Global container shipping market with a particular focus on intermodalism
|
|
|
- Egbert Anthony
- 5 years ago
- Views:
Transcription


1 Global container shipping market with a particular focus on intermodalism Intermodal Asia Tina Liu Country Manager China liu@drewry.co.uk Copyright notice This Report is for the sole use of the purchaser and is not to be copied or distributed outside of the client organisation March 2014


2 2 Drewry

3 Agenda 3 Container shipping market fundamentals Container shipping freight rate European Intermodalism
4 4 4 Industry fragmentation is high Herfindahl Hirschman Index (HHI) 10,000 5,000 Wide Body Aircraft Manufacturing 4,000 3,000 Cruise Lines (2) 2,000 International Express Package (4) 1,000 Container Shipping Lines (3) 0 Shipbuilding (1) Even Competition: all competitors have equal market share Highly Competitive (less than 100) Unconcentrated (100-1,000) Modest Concentration (1,000-1,800) 50 No. Competitors High Concentration (greater than 1,800) 1. Source: UBS Global Shipbuilding reports May-09, 2. Source: Natixis, Carnival report Sep-09, 3. Source: Drewry, Containerisation International, 4. Source: RBC, Fedex report Aug-09 4
5 Economics is challenging 5 5 Factor Effect Economies of scale Structural overcapacity Perishability Push for short run contribution rate erosion High operational gearing Push for short run contribution rate erosion Continuous battle for share, linked to drive for economies Fragmented industry of scale. Very strong role of intermediaries (Forwarders NVOCC) Inelastic demand curve Falling rates have a limited effect on overall demand Lines are profitable only when, by chance, demand exceeds supply Drewry Financial Research Services Ltd
6 Current state of the market 6 Supply demand equilibrium Drive for operating economies of scale through larger ships is resulting in overcapacity Slow demand growth Supply demand equilibrium pushed back Industry finances Fragile earnings, Carrier are burning cash this cannot last much longer Newbuild prices and finance Low newbuilding prices prompting new ordering Finance available through lessors and new entrants Way forward Consolidation needed; but aversion to M&A Time to revisit historical structures? Rethink cooperation agreements? 6
7 Questioning the cyclicality 7? Demand For New Tonnage? Optimism Supports New Orders Supply Exceeds Demand / Trade Growth Slows Freight Rates Recover? Shipping Market Cycle Over Supplied Market Demand- Supply Realign Freight Rates Drop Fleet Growth Slows/Trade Recovers Vessel Demand Drops
8 8 Containerships keep getting bigger Teu 20,000 18,000 16,000 14,000 12,000 10,000 8,000 6,000 4,000 2, Average Ship Size Average Newbuilding Largest Ship Orderbook by size range (% of teu capacity) Recent orders split per vessel size (total teu) 700,000 7% 9% 7% 3% 0-4,000 TEU 4-6,000 TEU 600, ,000 45% 29% 6-8,000 TEU 8-10,000 TEU >12,000 TEU 10-12,000 TEU Total teu 400, , , ,000 0 < 8,000 teu 8,000 teu+
9 Race to lower costs, upsizing the fleet Savings in slot cost per teu indexed to 8k teu vessel 9 USD/teu 1,050 1, % -16% -19% -21% -26% -30% 8k 10k 12k 13k 14k 16k 18k RV Slot cost at 85% Utilisation Significant unit cost savings by EEEs can not be ignored Drewry s analysis suggests fuel costs/teu are already 34% lower than a typical 13,100 teu vessel Ship operating costs lower by an impressive 11% Combined cost savings together are a massive 30% cheaper than 13,100 teu ships on a round voyage basis The rush to order vessels over 16,000 teu for deployment between Asia and Northern Europe will continue to gain momentum ource:, Drewry Maritime Research
10 How will be the major players stacked by end 2016? * Zim order cancelled No. of ULCCs per carrier by end 2016 Source: Drewry s Container Forecaster
11 Liner shipping market structure 11 Many ships and shipowners Around 400 container shipping companies and 5,100 container ships worldwide 1,400 1,200 Owned fleet size by carrier, July 2013 (excludes leased and chartered vessels) 1, But concentration Top 20 container lines account for over 80% of the market Maersk Line MSC CMA-CGM COSCO Evergreen CSCL Hapag-Lloyd Hanjin OOCL APL NYK K-Line MOL Yang Ming UASC PIL Hamburg-Sud. Wan Hai Zim HMM And alliances Effectively just 3 major global carrier alliances now Total owned fleet ('000 teu) Orderbook ('000 teu) but market still highly competitive as alliances are operational only, not commercial

12 Recent Container Freight Rate Trends Europe & US Imports from Asia (US$ per 40ft) 12 $3,800 $3,300 Capacity & GRI initiatives Fundamentals weaken Capacity & GRI initiatives US$ per 40ft Container $2,800 $2,300 $1,800 Market share rate wars $1,300 $800 Sep-11 Dec-11 Mar-12 Jun-12 Sep-12 Dec-12 Mar-13 Jun-13 Sep-13 Shanghai-Rotterdam Hong Kong-Los Angeles Source: Drewry s Container Freight Rate Insight ( & World Container Index
 13 $1,100 $1,000 Capacity & GRI initiatives US$ per 40ft")


13 Recent Container Freight Rate Trends Europe & US Exports to Asia (US$ per 40ft) 13 $1,100 $1,000 Capacity & GRI initiatives US$ per 40ft Container $900 $800 $700 $600 Market share rate wars Volume growth supports rates Weaker volume reduces rates $500 $400 Sep-11 Dec-11 Mar-12 Jun-12 Sep-12 Dec-12 Mar-13 Jun-13 Sep-13 Rotterdam-Shanghai Los Angeles-Shanghai Source: Drewry s World Container Index (


14 Recent Container Freight Rate Trends Intra-Asia (US$ per 40ft) 14 $1,550 $1,500 $1,450 $1,400 $1,350 $1,300 USD/40ft $1,250 $1,200 $1,150 $1,100 $1,050 $1,000 $950 $900 $850 $800 Overcapacity reduces rates Low volatility of rates Jan-12 Apr-12 Jul-12 Oct-12 Jan-13 Apr-13 Jul 13 Oct 13 Drewry's China-Japan Benchmark Drewry's Intra-Asia Index Source: Drewry s Container Freight Rate Insight (


15 Benchmarking Shipping Costs Drewry s Benchmarking Club 15
16 Chinese brands ambition 16
17 Is intermodal critical in the overall supply chain? 17 Supply Chain Time Order/manufacture period Pre-ship Ocean Transit Port Dwell Delivery 45 days 5 days 28 days 4 days 2 days 2/84 days 2/39 days Supply Chain Landed Cost ( per 40ft of Toys Asia - Munich) Manufactured cost Pre-ship Ocean Transit Port Dwell Delivery 98, , / 100,729 i.e. 0.54% 545/ 2729 i.e. 20.0%
 60% approx of population more than 250k away from")

18 18 Europe A population not always close to the ports European population 739 million consumers (GDP per capita: USD 32 thousand) 60% approx of population more than 250k away from main ports Importance of Rhine corridor through South Germany to Switzerland for population and economic activity Asia-Europe main port - 250km radius Other clusters also need competitive access.


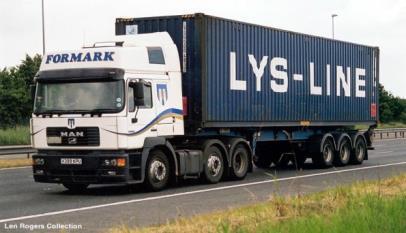
19 19 Intermodal forms of transport Barge important out of Rotterdam/Antwerp, Rail in Germany. Feeders & Ferries to Scandinavia, Ireland Rail Barge Truck

20 20 Road network E-Routes

21 21 Intermodal International Rail Network

22 22 The inland waterways/barge network 35% of inland cargo from Rotterdam/Antwerp

23 Because of these networks European Ports compete intermodally for the inland hinterland by 23 Ocean Services Price Transit times Frequency Origin Port Coverage Carrier operational efficiency (e.g. handling rates and berth slots) Inland Transport Coverage Cost Reliability Frequency Transit Information Systems Fiscal Arrangements (Duty/VAT)
24 Does adding an inland terminal open up the market? 24 60% of EU Purchasing within 500 kilometres of the terminal.
25 Overlapping multiple terminal footprints 25 Footprint defined by local transport costs. Prime costs often similar.
26 The Three Models of Intermodal Provision 26 Rail/Barge Operator Transfracht, Naviland IFB, BCTN Strategic Objective: Profit from rail/barge freight operations Method of Operation: Often own/control inland terminals Train operations Port/Terminal HHLA, Barcelona ECT/EGS Strategic Objective: Extension of port hinterland to gain cargo volume Method of Operation: Sometimes acquire inland terminals Contracted out train operations Forwarders Block Bookings etc. Carrier MSC,CMA-CGM Strategic Objective: Minimisation of container fleet inland costs/port coverage Method of Operation: Use third party terminals and depots Contracted out train operations

27 27 Relative costs and performance 795 Rotterdam to Frankfurt 0.5 Service per week na Hamburg Hamburg to Frankfurt Service per week na Rotterdam Rotterdam to Basel Service per week Frankfurt Hamburg to Basel Service per week na na Basel
28 28 End-Customer supply chain thinking Cost is always the headline factor But. Supply Chain architecture and practice items Reliability Simple Time cost Visible Risk Trackable Integrated whole supply chain

29 29 Key future developments N-Europe transit times from Asia similar or better than West Med ports & larger ships means lower slot costs. Mediterranean Rotterdam/Antwerp increased barge/rail modal share to reduce local congestion Rail/barge links to Central Europe and Southern. Germany Hamburg/Bremerhaven rail to Poland & Central Europe Adriatic/Med rail links to Southern Germany & Central Europe Spain rail to Southern France South France rail to North Europe
30 30 If you want to get involved, areas to look out for Traditional routings not always cheaper than new intermodal routings. Choose the right destination port not the traditional one If selling delivered terms then choosing right inland mode critical for cost and product reliability Behaviours Headline price always the most important initial consideration. Reliability of service a critical choice factor. Service Frequency is essential to flexibility. Final door delivery from inland terminal is important. Inland transit times (within limits) are less critical. Next day delivery is accepted norm on shorter routes.

31 31 Drewry background Drewry is a highly experienced, respected and well established sector expert Drewry has over 40 years experience within the maritime sector, employing over 90 specialists across our offices in London, India and Singapore. Offering research reports and consultancy services, our ability to assess the market and give our clients the knowledge to make critical decisions sets us apart from others. Our brand is renowned for its quality, with analysis that brings clarity to markets and enables us and our clients to stand above the competition. Drewry s bespoke consultancy service has its foundations in our research, but it is defined by our breath of expertise, sector adaptability and international capabilities. Our services extend from the provision of data and information to large assignments calling for a broad mix of disciplines. Typical commissions encompass strategic planning; market research; forecasting; management consultancy; feasibility studies and project evaluation. Since the founding of the company in 1970, Drewry has evolved into one of the world s leading international maritime consultancy and publishing organisations. Today, Drewry reports are sold in more than 90 countries and consultancy services commissioned by clients from over 70 countries. Over four decades, Drewry has built an extensive data library on trades, shipping costs, ship prices, fleets and freight rates. Sophisticated forecasting systems project trade flows, ship demand and supply, freight rates, costs and prices. The company s people include experienced market analysts, economists and financial planners who have had high-level exposure to the maritime industry. Drewry is also able to call on the services and expertise of a number of freelance consultants for projects requiring specialist knowledge.


32 32 Contact Head Office UK Drewry Shipping Consultants Ltd Christopher Street London EC2A 2BS, United Kingdom t: +44 (0) e: India Office Drewry Maritime Services Private Limited 209 Vipul Square, Sushant Lok-1 Gurgaon, Haryana , India t: e: Tina Liu Country Manager - China liu@drewry.co.uk Singapore Office Drewry Maritime Services (Asia) Pte, Ltd. 15 Hoe Chiang Road #13-02 Tower fifteen Singapore t: e: singapore@drewry.co.uk Shanghai Office 555, 5th floor Standard Chartered Tower, 201 Shi Ji Avenue, Pudong District, Shanghai, China t: +86 (0) e: info@drewry.co.uk