Increasing Supply Chain Efficiency with SH 130
|
|
|
- Violet McCoy
- 5 years ago
- Views:
Transcription


1 Increasing Supply Chain Efficiency with SH 130

2 Trade: U.S. and Mexico The U.S. is Mexico s number one trading partner. In May 2013 Bureau of Transportation Statistics announced that 60.8% of NAFTA Trade was moved by Truck. Mexico is Canada s 4 th largest trading partner and they are their 3 rd largest source of imports. According to a recent Bloomberg Report, U.S. Mexico truck traffic trade could reach $463 billion by 2020, a 44% rise from $322 billion in 2012.
3 Trade U.S. and Mexico Laredo: 6 th largest customs district In the top 10 of the fastest growing customs districts Over 3.5 million trucks crossed the Laredo border in 2012 Trade crossing through the port of Laredo has grown year over year an average of 5.6%. In 2010, the FHWA Analysis Framework Database names Laredo s top five domestic trading partners, they include: Michigan - Detroit and Grand Rapids Regions California Los Angeles Texas DFW and Houston
4 SH 130 Route alternative to I-35 SH a bypass of I-35 between Austin and San Antonio 91 mile corridor between Georgetown, TX and Seguin, TX Cashless open road tolling No toll booths No lane restrictions No weigh stations Entrance/Exit Points: Seguin: I-10 EB/WB - Exit 614 Georgetown: I-35 NB/SB - Exit 265 Payment Options: Pay by Mail TxTag - To obtain a TxTag please call ( )
5 SH 130 Route alternative to I-35 Just the facts Trucks pay the same rate as cars! I-10 and 410 are now TX 130 easy for dispatch Less congestion with free flow traffic 24 hours/day. 24/7 roadside assistance. I-35 thru Austin is the 4 th most congested roadway in Texas.

6 Who does SH 130 Benefit? Drivers Hours of Service JIT Manufacturers Auto Industry Perishable Goods Time sensitive delivery Urban Communities Environment


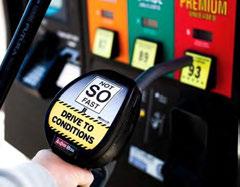
7 Opportunity Cost I-35 thru Austin is the #4 most congested road in Texas. How much do these delays actually cost? Cost of a reliable route? Less than $18 to bypass congestion. Benefits of reliability. Source: Texas Transportation Institute


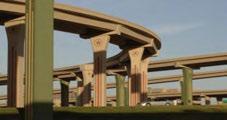
8 Opportunity Cost I-35 Congestion Lane Restrictions

9 Truck Incentive Program From April 1, 2013 March 31, 2014 trucks will be charged as a 2-axle vehicle saving you up to 67% Cost: Pay by Mail $18 or less TxTag $13 or less To obtain a TxTag please call ( )

10 Questions? Fast Safe Reliable

11 TXDOT Freight Advisory Committee Meeting WELCOME San Antonio, Texas August 13,

12 Trade Corridor Development
13 INTERMODALISM IS PSA
14


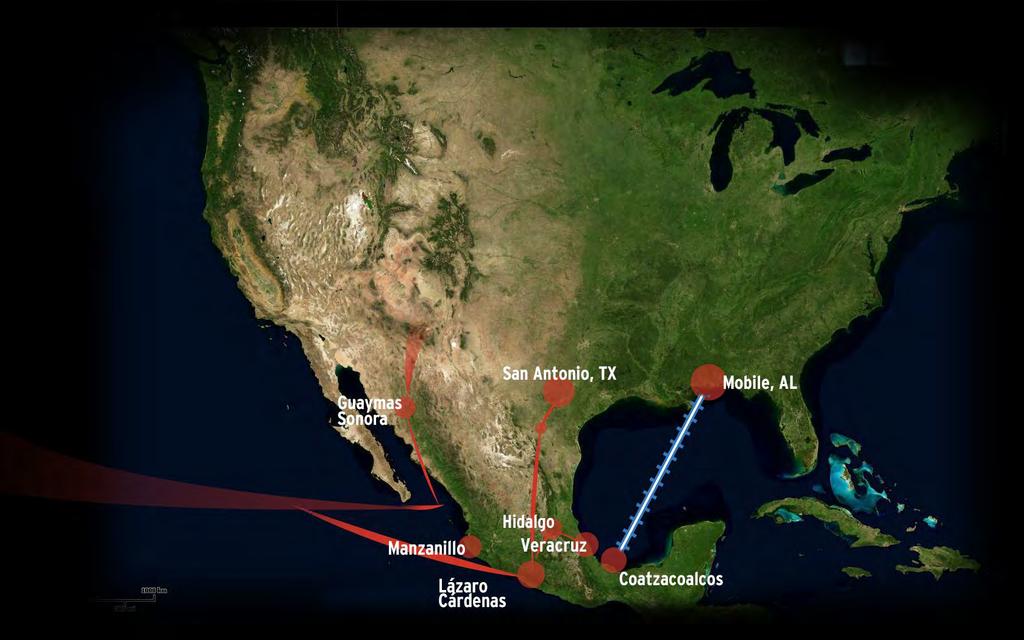
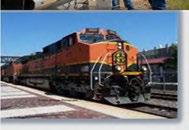
15 CG Railway Service CG Railway, a short line railroad, operates a liner service between the U.S. and Southern Mexico consisting of two 585 foot, 115 railcar capacity, roll-on, roll-off rail ferry vessels.

16


17 Strategic Regional Partnerships Laredo 2 nd Largest Inland Port in the United States San Antonio Region s Largest Industrial Airport Corpus Christi 5th Largest Seaport in the United States All are connected by excellent highways and railroads All have Foreign Trade Zones
18 OPPORTUNITIES AHEAD
19

20 Jorge Canavati Vice President, International Logistics (210)
21 TEXAS FREIGHT TRANSPORTATION NEEDS AND CHALLENGES Texas Freight Advisory Committee San Antonio August 22, 2013
22 KEY FREIGHT TRANSPORTATION NEEDS AND CHALLENGES IN TEXAS Understanding Freight Mobility Needs and Challenges
23 Outline Key Freight Transportation Needs and Issues in Texas A B C D E F G H System Capacity System Operations Safety Connectivity NFTA and Border Challenges Institutional Interagency Industry Coordination Education and Public Awareness Funding Challenges


24 Texas Freight Transportation Challenges: System Capacity Rail capacity constraints Lack of alternate corridors Congestion on key freight corridors Bottlenecks at interchanges on key freight corridors Inadequate merging lanes at many interstate interchanges


25 Texas Freight Transportation Challenges: System Operations Aging infrastructure Lack of statewide priority freight network Oversize/overweight/over dimensional issues Need for dedicated heavy weight truck corridors Need for truck only lanes Need for comprehensive statewide incident management


26 Texas Freight Transportation Challenges: Safety Lack of truck parking Numerous at grade rail crossings Presence of rail in rural areas Poor roadway geometrics Education of public on commercial vehicle needs


27 Texas Freight Transportation Challenges: Connectivity Need for regional corridors Need for connections within Texas Need for better port rail connections Need for greater north south connectivity to the border Need to connect to neighboring states infrastructure Need for more intermodal connection points Lack of connections between western and eastern railroads Need to connect US Interstate to Mexico s infrastructure Lack of rural access to existing freight network


28 Texas Freight Transportation Challenges: NAFTA and Border Challenges Congestion at the Border Customs processing time Border crossing staffing issues Need for more technology applications Need for awareness of changing policies in Mexico Improvement of infrastructure in Mexico compared to U.S. Increased use of Mexico ports and impacts on Texas Re-shoring and impact on freight volumes and Texas infrastructure


29 Texas Freight Transportation Challenges: Institutional-Interagency- Industry Coordination Legislative actions Communication between agencies and departments Technology efforts - private versus public sector systems Collaboration to accommodate varying planning horizons Linking long-term efforts by agencies to market conditions Real-time coordination on travel conditions with neighboring states


30 Texas Freight Transportation Challenges: Education and Public Awareness Lack of public education and awareness Need to communicate importance of freight movement to the public Need for communication between public private sectors Poor understanding of commercial vehicle operational needs Lack of understanding of role of private and public sector on infrastructure


31 Texas Freight Transportation Challenges: Funding Challenges Need to think differently Need to focus funding on high priority freight corridors Need to balance existing funding needs Need alternative measures for allocating funding Need to explore alternative funding mechanisms Need to promote freight transportation to elected officials

32 Texas Freight Transportation Challenges: Priority Freight Network Strategic Priority Freight Network Support efficient and reliable movement of freight Enhance safety of freight and passenger movement Better target investments
33 Discussion What are your thoughts on the outlined needs? Are there any that were missed?
34 PRELIMINARY TEXAS PRIORITY FREIGHT NETWORK Texas Freight Advisory Committee San Antonio August 22, 2013
35 PRELIMINARY TEXAS PRIORITY FREIGHT NETWORK Shaping the Future of Texas Economic Development and Competitiveness
36 What is the Texas Priority Freight Network (TPFN)? Cornerstone of the Texas Freight Mobility Plan Defines an all mode Priority Freight Network: Transportation corridors Key freight generators and gateways
37 Why Define a Priority Freight Network? Serves as the backbone for prioritizing freight investments Facilitates efficient freight movement across Texas Identifies and prioritizes needs Assists in investment decisions Engages the freight and business community Meets US DOT and MAP 21 requirements Serves local, regional, statewide, national and international markets
38 Key Goals of the Texas Priority Freight Network Link Texas economic regions Meet the growing demand for freight movement Enhance Texas economic competitiveness Make strategic decisions for future transportation investments

39 Developing the Preliminary TPFN Trucking and rail form the backbone of the Texas intermodal freight transportation network Trucks move 65% of freight Rail moves 19% of freight Weight of Shipments by Transportation Mode Share: 2011 Value of Shipments by Transportation Mode Share: % 19% 7% 6% 3% 65% Truck Rail Water Air, air & truck 3% 4% 8% 13% 2% 70% Truck Rail Water Air, air & truck Multiple modes & mail Multiple modes & mail Other & unknown Other & unknown


40 Preliminary Texas Highway Priority Freight Network Q: What are the important criteria? Q: What else should be considered? Texas Trunk Highways Border Crossing Continuity High Truck Volumes Freight Generator Connectivity Intermodal Connectors Priority Airport Connectivity State Highways Designated Truck Routes US Highways Oversize, HazMat, Energy Interstates Priority Highways Others

41 Texas Highway System Existing Texas Highway Map Texas has over 313,200 lane miles of roadway Trucks are the dominant mode of freight movement in the State by: Value = 60% Weight = 58% 8

42 Texas Trunk System 9
43 Texas Freight Gateways/Freight Generators Texas has more than 1,000 miles of channel Eleven deep water ports Six commercial airports 20 intermodal rail facilities Seventeen commercial vehicle international crossings Two inland ports 10

44 Texas Freight Gateways/Freight Generators How do you define a freight gateway? (warehouse, inland port, distribution center, etc.?) Are there other major freight gateways or generators missing? 11


45 Preliminary Texas Highway Priority Freight Network Are there any missing links that need to be added? Does this provide a good start? Where do we go from here? 12


46 Preliminary Texas Rail Priority Freight Network Q. What are the important criteria? Q. What else should be considered? Border Crossings Freight Volume Other Railroads Bottlenecks Class I Railroads Priority Railroads Others


47 Texas Rail Network 2 nd largest rail network in the nation More than 14,361 miles of track 47 freight rail operators 14

48 Preliminary Texas Rail Priority Freight Network Any missing links that need to be added? What about Class II and III railroads? Does this provide a good start? Where do we go from here? 15
49 Next Steps Further refine the Highway and Rail TPFN Input from TxFAC and other TxDOT planning partners and stakeholders Analyze how commodities move along the network Link the TPFN to performance measures Analyze network fluidity and efficiency Identify opportunities for network management Identifying opportunities for capital investment 16
50 Discussion Final thoughts on preliminary networks? What should be included in updated versions?


51 PRELIMINARY TEXAS FREIGHT TRANSPORTATION PERFORMANCE MEASURES Texas Freight Advisory Committee San Antonio August 22, 2013
52 PRELIMINARY TEXAS FREIGHT TRANSPORTATION PERFORMANCE MEASURES Pathway to the Future: Moving Freight Efficiently Within and Through Texas


53 MAP-21 Focus on performance based federal program Establishes national goal areas Creates performance reporting requirement FHWA is currently implementing Establishes a National Freight Policy
54 What are Transportation Performance Measures? Performance measures quantify and qualify transportation system performance. They can serve three basic functions: Plan Development Plan Implementation Accountability
55 Examples of What Some Other States are Measuring Florida Iowa Washington Truck miles traveled Average truck travel speed Hours of truck delay Highway crash rates per million vehicle miles for large trucks Total crashes at railroad highway crossings Percentage of rail track miles able to operate at 40mph or above Frequency of truck speed falling below 60% of posted speed limit Percent of miles below 45 mph during AM/PM peak Minnesota Oregon Truck daily delay Cost of truck delay Travel time reliability index Distance from center of metro area to the closest international container port Number of freight facilities per 10,000 population Truck travel time index

56 Lessons Learned Lessons Learned Start high and get input Reflect broad performance concerns Keep it simple Use existing data Collaboration and partnership is key

57 What is TxDOT Doing? Actively participating on national performance measure task forces Coordinating with other transportation stakeholders throughout the State Assessing capacity to produce baseline and set targets for likely measures Annual Hours of Delay Interstates Truck Reliability Index

58 Measurement Development Process Integrate with goals and objectives of the TFMP Build from existing TxDOT goals and objectives Include key stakeholders Stakeholders/ Constituencies Current Goals and Objectives Data Analysis Decision makers Identify Candidate Performance Measures Legislative/ Program Requirements State Performance Measures
59 What is the Role of TxFAC? Role of TxFAC Provide input into performance measurement evaluation criteria Define how industry views performance Help select and prioritize goals and measures for the Freight Network Help identify freight significant corridors
60 Question #1 Q: How does your organization measure performance? Q: How does the transportation system affect your results? Competitiveness Return on investment Profitability Reliability Customer satisfaction Productivity/efficiency Employee satisfaction Market Share Others
61 Question #2 From your perspective, what is good and bad transportation system performance? Good Performance Free flowing bypass Reliable travel time Roads in good repair Others Bad Performance Traffic and congestion Crashes and accidents Poor access to facilities and customers Others
62 Question #3 Do these TxDOT goals capture the needs of the State s freight system? General Goal Area TxDOT Strategic Plan Long Range Transportation Plan Texas Freight Planning Technical Report Safety Preservation Maintain a Safe System Maintain a Safe System Enhance safety for all Texas transportation system users Maintain the existing transportation system System Performance Address Congestion Promote congestion relief strategies Economic Development/ Connectivity Connect Texas Communities Enhance system connectivity Safety Maintenance and Preservation Mobility, Reliability and Congestion Accessibility and Connectivity Operations Environment Become a Best in Class State Agency Develop organizational structure and strategies to address future multimodal needs Develop comprehensive multimodal transportation funding strategies Environmental Impact


63 Freight Performance Measures for Consideration Mobility Annual hours of truck delay Truck Reliability Index Reduction in freight bottlenecks Border crossing wait times Safety Freight related crashes and fatalities Rail accidents Eliminating/Improving at grade rail crossings Preservation State of good repair on Priority Freight Network Multi Dimensional Operational and Technology Intermodal access Others
64 Question #4 Q: What specific measures should be considered in the Texas Freight Mobility Plan? Q: Which measures do you consider most important? Known Annual Hours of Delay Interstates Gross Domestic Product Other Examples Elimination/Improvement of at-grade rail crossings Truck Reliability Index Freight tonnage, ton-miles and value by mode Travel time in freight corridors System redundancy and ready access Capital investment in freight corridors Travel time reliability in freight corridors GHG emissions (e.g., CO 2 ) Freight carrier average operating costs Pavement condition index Structurally deficient bridges Freight related crashes and fatalities Freight-related issues and complaints Annual hours of truck delay Truck Reliability Index Reduction in freight bottlenecks


65 Performance Measurement Development Process Integrate with goals and objectives of TFMP Build from existing TxDOT work Selection considerations Resource implications Decision making value Strategic alignment Communication value Causality Requirements 15

66 Next Steps Stakeholders/ Constituencies Current Goals and Objectives Data Analysis Decision Makers Identify Candidate Performance Measures Legislative/ Program Requirements State Performance Measures 1. Get input on preliminary measures 2. Adjust measures as goals and objectives are identified 3. Research data availability 4. Research legislative requirements
67 Discussion


68 A Driving Force: Texas-Mexico Automotive SuperCluster (TMASC) David Marquez, Executive Director Bexar County Economic Development August 21,
69 L E A D E R S H I P Bexar County Economic Development drives new investment and job creation in the greater County region. Incentives Community Venues Strategic Initiatives Texas Ag Ext. 2
70 Texas-Mexico Automotive SuperCluster (TMASC): Regional strategy aimed at developing the vehicle manufacturing industry for job creation and capital investment. Coahuila Nuevo Leon San Luis Potosi Tamaulipas Texas 3


71 Changing Geography of Automotive Assembly The TMASC Region 4

72 Cluster Effect: Toyota Motor Manufacturing, Texas, Inc. $2.1B direct investment; 2,900 direct jobs 21 on-site suppliers; 2,800 jobs 5
 by T.I.P. Strategies 6")
73 The TMASC Region Figures from 2008 TMASC Market Study Type Automotive assembly and parts plants Commercial and military vehicle manufacturing plants Qty 6 7 Heavy equipment manufacturers 4 Specialty vehicle manufacturers 3 TOTAL PLANTS 20 Source: Texas-Northeastern Mexico Vehicle Manufacturing Industry Study (2008) by T.I.P. Strategies 6
74 The TMASC Region Change from 2008 to 2012 TYPE QTY NET CHANGE Automotive assembly and parts plants Commercial and military vehicle manufacturing plants Heavy equipment manufacturers Specialty vehicle manufacturers KalmarRT TOTAL PLANTS 28 7 NEW INVESTMENT ~ $2.7 B Source: Texas-Northeastern Mexico Vehicle Manufacturing Industry Study (2008) and TMASC Vehicle Manufacturing Report (2012) by T.I.P. Strategies 7


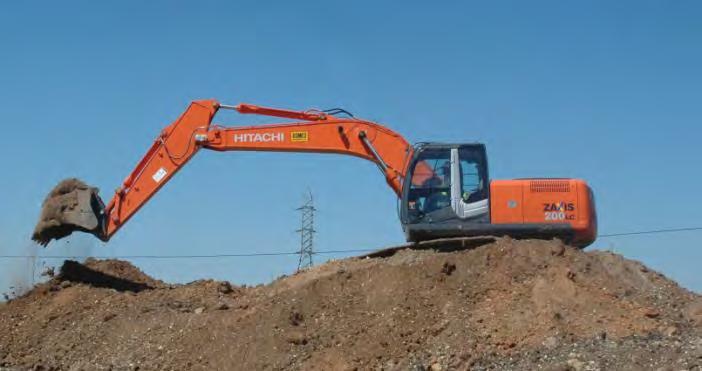
75 Continued Assembly Investment Caterpillar expands in six TMASC areas Jun New $170M diesel engine plant in Seguin, TX; 1,400 jobs created. Mar New 75,000 sq. ft., $30M tools manufacturing facility in Waco, TX; 62 jobs created. Apr New 260,000 sq. ft., $33M engine head manufacturing plant in Schertz, TX; 150 jobs created. Jun New 1 million sq. ft., $200M facility in Victoria, TX to manufacture hydraulic excavators; 600 jobs created. Nov Expansion of heavy mining truck plant in Ciudad Acuña, COA; 430 jobs created. Nov New $500M gear and parts plant in Cienega de Flores, NL; 1,000 jobs created. Sources: Greater Waco Chamber, Caterpillar Press Release, June 17, 2011; herald-zeitung.com, April 1, 2011, Maquila Portal 8
76 Key Advantage: Younger Population Relative to Other North American Sites Source: UN Secretariat, U.S. Census, CIA World Factbook MEDIAN AGE 2010 Japan 44.7 Canada 39.9 NJ 39.0 OH 38.8 MI 38.9 KY 38.1 TN 38.0 SC 37.9 MO 37.9 AL 37.9 VA 37.5 NC 37.4 U.S.A IN 37.0 IL 36.6 OK 36.2 MS 36.0 GA 35.3 CA 35.2 China 34.5 TX 33.6 Brazil 29.1 Mexico 26.6 India 25.1 MEDIAN AGE 2030 Japan 51.4 Canada 43.7 China 42.5 SC 41.3 MS 41.1 AL 41.0 NJ 40.8 OH 40.2 MI 40.2 KY 40.0 MO 39.6 U.S.A TN 38.3 OK 37.9 VA 37.8 IL 37.8 IN 37.7 Brazil 37.4 CA 37.4 NC 36.8 Mexico 36.2 GA 35.6 TX 34.6 India

77 High Growth Texas Metros Average Population Change Equal to or Greater than 50% ( ) Key Advantage: Younger population fuels growth Larger consumer markets Sources for manufacturing and corporate talent Source: July 2013 U.S. Metro Economies report by U.S. Conference of Mayors 10

78 Key Advantage: The U.S. as an export platform 11

79 Oil & Gas Exploration Strengthens economic resiliency & drives growth 12

80 Mexico Automotive Investments ( ) Audi Chairman Rupert Stadler introduces one of the maker's new models. Operation Location Investment Jobs Audi New Plant Puebla, PU, MEX $1.3 B N/A Ford Plant Expansion Hermosillo, SO, MEX $1.3 B 1,000 GM Expansions San Luis Potosi, SL, MEX & Silao, GJ, MEX $420 M 1,000 Honda New Plant Guanajuato, GJ, MEX $800 M 3,200 Nissan New Plant Aguascalientes, AG, MEX $2 B 3,000 13

81 Texas Automotive Investments ( ) Operation Location Investment Jobs BMW Distribution Center Lancaster, TX, USA N/A 65 Continental Plant Expansion Seguin, TX, USA $113 M 300 GM Plant Expansion Arlington, TX, USA $200 M 180 GM Tech Center Austin, TX, USA N/A 500 Caterpillar New Plant Victoria, TX, USA $200 M 225 Formula 1 New Track Austin, TX, USA $400 M
82 TMASC Goals: 1. Two new assembly plants by Five new assembly plants by State-level program to attract automotive manufacturing. Key: regional alignment, collaborative recruitment 15

83 Daimler Innovation Truck Future Opportunities Kit assembly plants for commercial trucks and heavy equipment Aerodynamic, mechatronics, power system, & telematics innovation Corporate functions for Western Hemisphere 16


84 17


85 Learn more at Thank you. David Marquez Executive Director Bexar County Economic Development T: (210) A Driving Force: The Texas-Mexico Automotive SuperCluster 18