Explore Portal. Maseeh College of Engineering and Computer Science. Kristin Tufte, Morgan Harvey, Hui Zhang, Chris Giossi Metro, Jan 25, 2015
|
|
|
- Sherilyn Ray
- 5 years ago
- Views:
Transcription


1 + Explore Portal Maseeh College of Engineering and Computer Science Kristin Tufte, Morgan Harvey, Hui Zhang, Chris Giossi Metro, Jan 25, 2015


!")


2 + Portal in one slide...! Portland-Vancouver Transportation Data Archive! Policy of Open Data! Publicly-funded (Thanks to NSF, FHWA, Metro, RTC, TREC)! Focus on open-source software! ~3 TB PostgreSQL Database Speed, Count, Travel Time, Weigh- in- MoAon, Variable Speed Travel Time, Traffic Signal, Bicycle Count, Pedestrian Push- BuFon Freeway ODOT, WSDOT, Lane County Portal Data Archive Arterial City of Portland, Clark County, Clackamas County, Washington County, Gresham, Tigard, Beaverton, Vancouver Ons, Offs, On- Time Performance Transit TriMet C- TRAN Other Weather, Weigh- in- MoAon
3 + Portal in Practice

4 + ATM Project Development SOUTHBOUND Speed Data for OR 217 OR 217 SB June 2009 Tuesdays OR 217 SB June 2009 Wednesdays Typical SB AM congestion is less severe than SB PM congestion OR 217 SB June 2009 Thursdays Congestion lasting 3 hrs and 45 mins Start of primary bottleneck Secondary bottleneck 4.4 miles of congestion Source: PORTAL, website: Southbound OR 217 Congestion Plot (Figure Credit: Jennifer Bachman, DKS Associates)
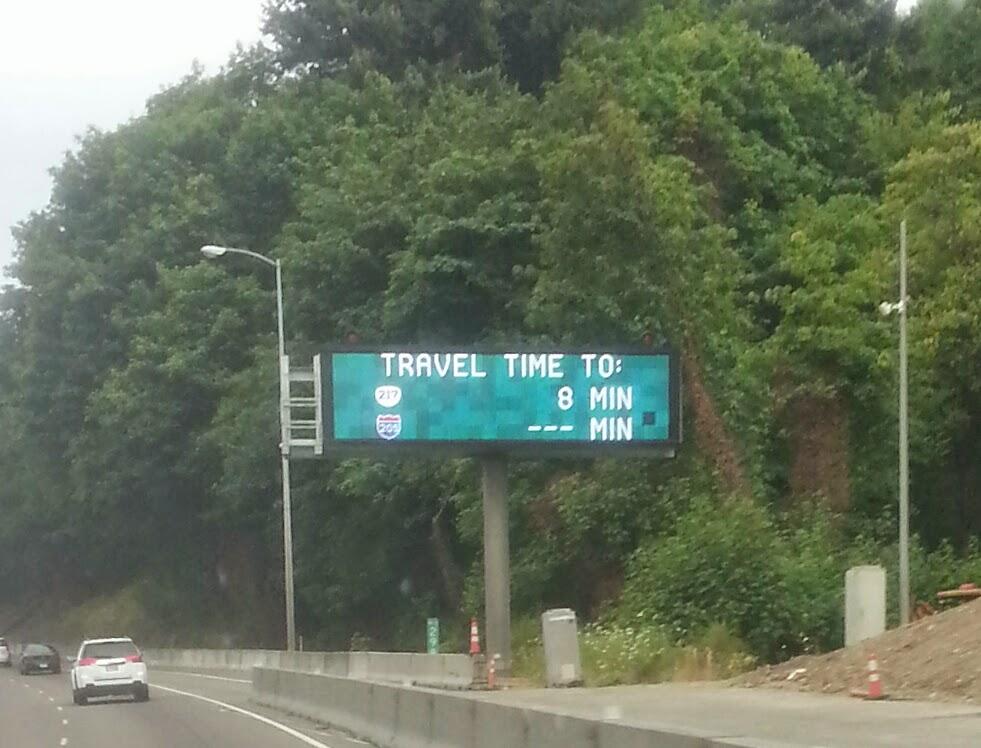
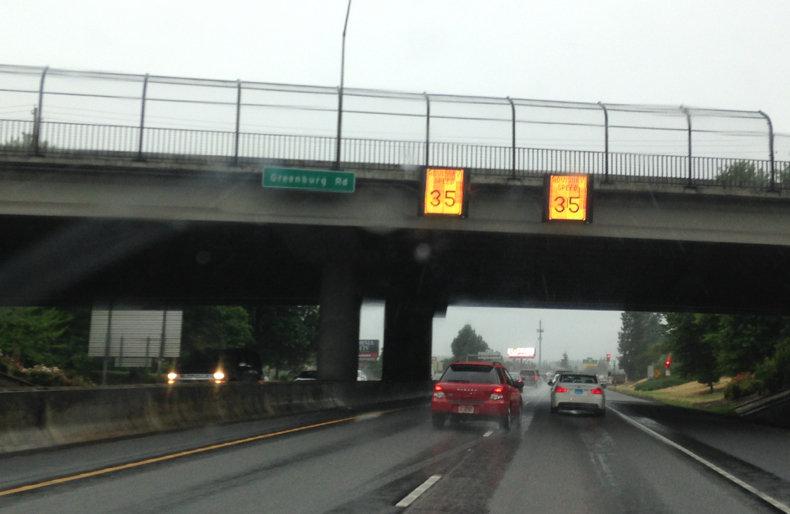
5 + ATM Project Development 4/12/ :45 Variable Speed Sign & Detector Information Lane by lane speeds Oregon 217 ATM Scenario Using Portal Data (Figure Credit: Carl S. Olson, DKS Associates)

6 + ATM Project Development Oregon 217 ATM Scenario Using Portal Data (Figure Credit: Carl S. Olson, DKS Associates)


7 + Connecting the Loop: Research > Planning -> Implementation -> Evaluation Portal Archive
8 + Travel Model Usage: Base Year Network Assignments for Travel Demand Modeling. Cutlines along I-5 Cutline volume detail Cutline Analysis For Traffic Demand Modeling (Figure Credit: Peter Bosa, Metro)
9 + Other Uses! Educational Use! Cloud Data Management! Civil and Environmental Engineering Curriculum! Agency Performance Reporting! Oregon Department of Transportation Bottleneck Analysis! Corridor Bottleneck Operational Study! Bottleneck Analysis! Powell Blvd Signal Analysis! Portland Metro Multimodal Arterial Performance Measures Guide! I-84 Traffic Management Plan! Ronler ATMS Project (Washington Cty)
10 + Data Sources for Performance Measures

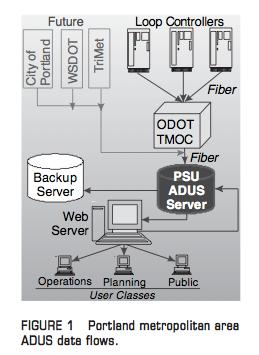
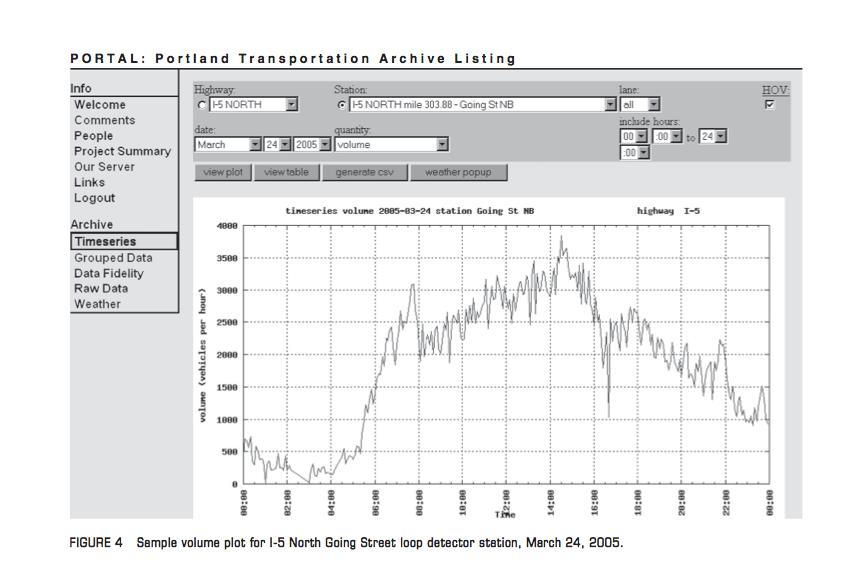
11 + Portal in 2005

12 + Portal today
13 + Freeway Data Sources Data Agency Detection Date Ranges Availability Speed, Volume, Occupancy ODOT Loops, Radar (loops) ~2014- (radar) Plots and download in UI Travel Time ODOT Bluetooth ~2014 Database only Speed, Volume, Occupancy VMS, VAS signs WSDOT Loops, Radar ~2012 Plots and download in UI ODOT n/a ~2014 Database only WIM ODOT ~ Demo site Incidents ODOT Currently sample only Vehicle length data (planned) ODOT WA Cty Loops, Radar ~2015 (planned) Plots and download in UI

14 + Portal UI: Freeway
15 + Arterial Data Sources Type of Data Agency Detection Date Ranges Availability Travel Time ODOT Bluetooth ~2014- Database only Travel Time City of Portland Arterial Volume City of Portland Arterial Speed, Volume Traffic Signal Data Traffic Signal Data (planned) Clark County City of Portland Clark County Bluetooth ~2012- Plots in UI Loops ~2014- Plots and download in UI n/a ~2014- Plots and download in UI TransSuite system (incl. MOE, SCATS) ATMS.Now ~2014- Database Only; UI in 2015
16 + Portal UI: Arterial

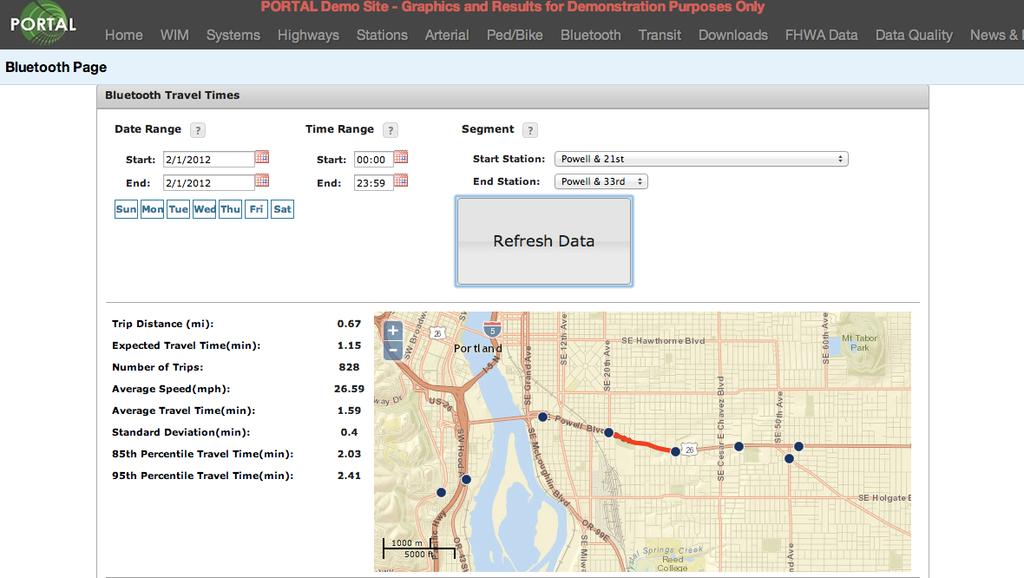
17 + Portal UI: Travel Time
18 + Transit Data Sources Type of Data Agency Detection Date Ranges Availability Passenger Counts, Ontime Performance Passenger Counts, On-time Performance (planned) TriMet AVL/APC ~2012 Plots/map in UI C-Tran AVL/APC ~2015 Plots/map in UI

19 + Portal UI: Transit Load Map
20 + Other Data Sources Type of Data Agency Detection Date Ranges Availability Weather NOAA Airports (Pdx, Hillsboro, Aurora) DEQ Air Quality (Portland Observatory) Bike Counts Bike Counts Parking (planned) ~2004- Plots of PDX data and downloads in UI DEQ DEQ ~2014 Database only City of Portland BikePed Portal Port of Portland Loops ~2014- Plots and download in UI (Stations page) Automated detection ~2015 Plots and download in UI ~2015 Database only

21 Bike- Ped Portal System Architecture Count Data Sources Data Uploaded via Web interface Semi- automated Hp uploads Data Upload Script Data Upload Interface Bike- Ped Portal Web Site Raw data Bike- Ped Portal Database Meta- data Validated data Visual ValidaAon Interface Rejected Data Automated QA/ QC Checks with approval link (automated uploads)
22 + BikePed Prototype Bike Counts


23 + BikePed Prototype Bike Counts
24 + BikePed Prototype - Peds

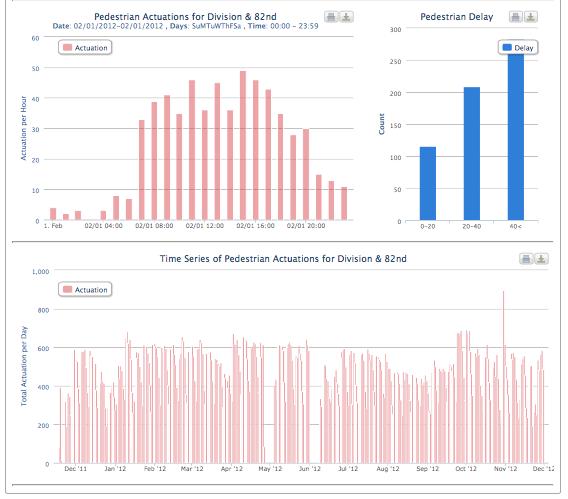
25 + BikePed Prototype - Peds
26 + THANK YOU!