2012 MPS Qualify Exam
|
|
|
- James Warner
- 5 years ago
- Views:
Transcription
1 2012 MPS Qualify Exam The examination will be four hours long. There will be eight questions in all. Students must select 7 out of 8 questions to answer. The exam is open book and open notes. The students can bring any relevant written materials. No computer and internet access are allowed. Calculator is allowed.
2 Problem 1 (ISyE 415): Consider the following two station line with a single product that must visit stations 1 and 2 in sequence. Station 1 has 4 identical machines with an average processing time of 10 minutes per job. Station 2 has 10 identical machines with an average processing time of 20 minutes per job. a) Determine the critical WIP in this system. b) Determine the WIP level that will allow you to obtain a throughput of 90% of the bottleneck rate of this system in the practical worst case scenario. Consider an alternative system where stations 1 and 2 are each split into two stations each, namely, stations 1a and 1b, and stations 2a and 2b, respectively. Stations 1a and 1b have 2 identical machines each with an average processing time of 5 minutes per job. Stations 2a and 2b have 5 identical machines each with an average processing time of 10 minutes per job. c) Determine the critical WIP in this system. d) Determine the WIP level that will allow you to obtain a throughput of 90% of the bottleneck rate of this system in the practical worst case scenario. e) What do the answers to parts a)-d) above tell you about the tradeoffs related to the length of a production line?
3 Problem 2 (ISyE 415) You are responsible for spare parts supply in your company. The spare parts usage averages 8 boxes per week. Each box costs $25. The shipping cost per order, regardless of size, is $50, and receiving an order takes about an hour of your time, which costs the company $80. Each order takes a week to arrive. The company figures financing costs at 15% per year. Keeping the boxes organized costs about $1.10/week per box. Currently you order 2 weeks worth of supplies with each order. (1). What is the average cost of this policy? (Use boxes, weeks, and $ as the units.) (2). Is this order policy optimal? If not, what will be the optimal order policy and its cost? (3). If the average usage is increased from 8 boxes to 12 boxes, what will be the optimal order quantity? (4). Or if the average usage is still 8 boxes, but shipping cost per order is reduced to $20, what should be the optimal order quantity?
4 Problem 3 (ISyE 510) (1) For a facility planning process, what types of data we should collect? What are the basic steps in a facility planning process? (2) Machine 1, 2, 3, 4, 5 are located at the points (96, 77), (53, 42), (32, 9), (10, 26), (61, 15), respectively. There are 5, 9, 6, 9, 2 trips per week, respectively, between the machines and a new facility. Find the location of the new facility if we consider the rectilinear distance and use the Minisum criteria. (3) Fill the blanks. Consider the following facility layout problem for 4 departments: From-to chart From/to A B C D A B C - 2 D - Space requirement: Departments Estimated space (ft 2 ) A 200 B 600 C 400 D 400 Initial layout (each grid represents 10x10 = 100 ft 2 ) A B B B A B B B D D C C D D C C (1) If we use the CRAFT method, then the score of the initial layout is. (2) If we use SLP method, then the score of the initial layout is. (3) If we use graph-based method, then the score of the initial layout is. (4) If we use MULTIPLE and given the space filling curve as follows, then what will be the resulting layout of assigning A,B,C, D sequentially? The space filling curve Please fill in the following grids to show the resulting layout
5 If we switch the locations of department A and D, what will be the resulting layout?
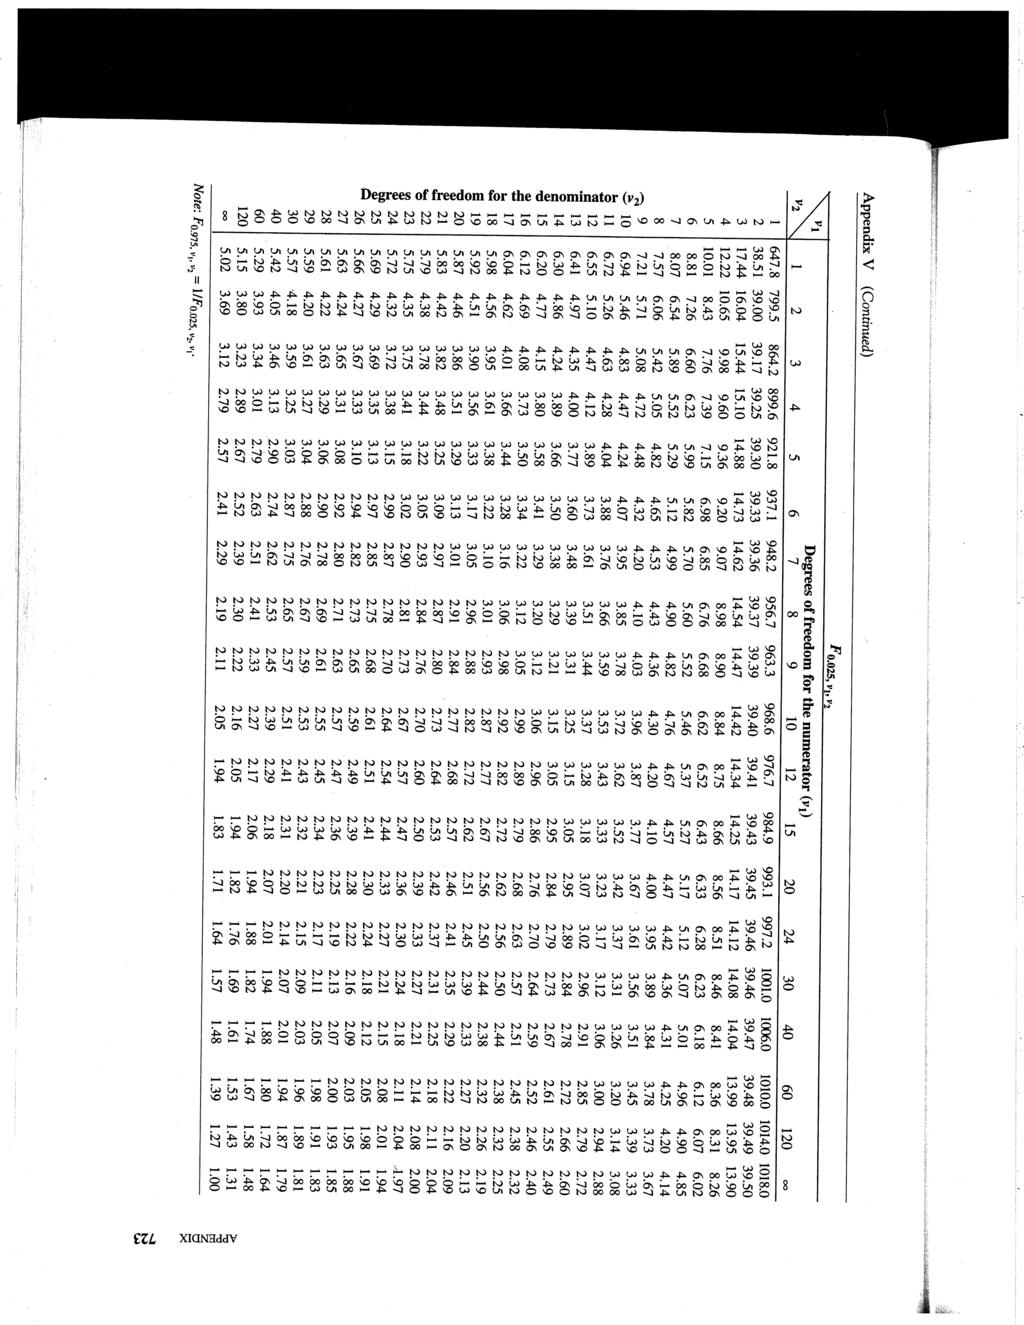
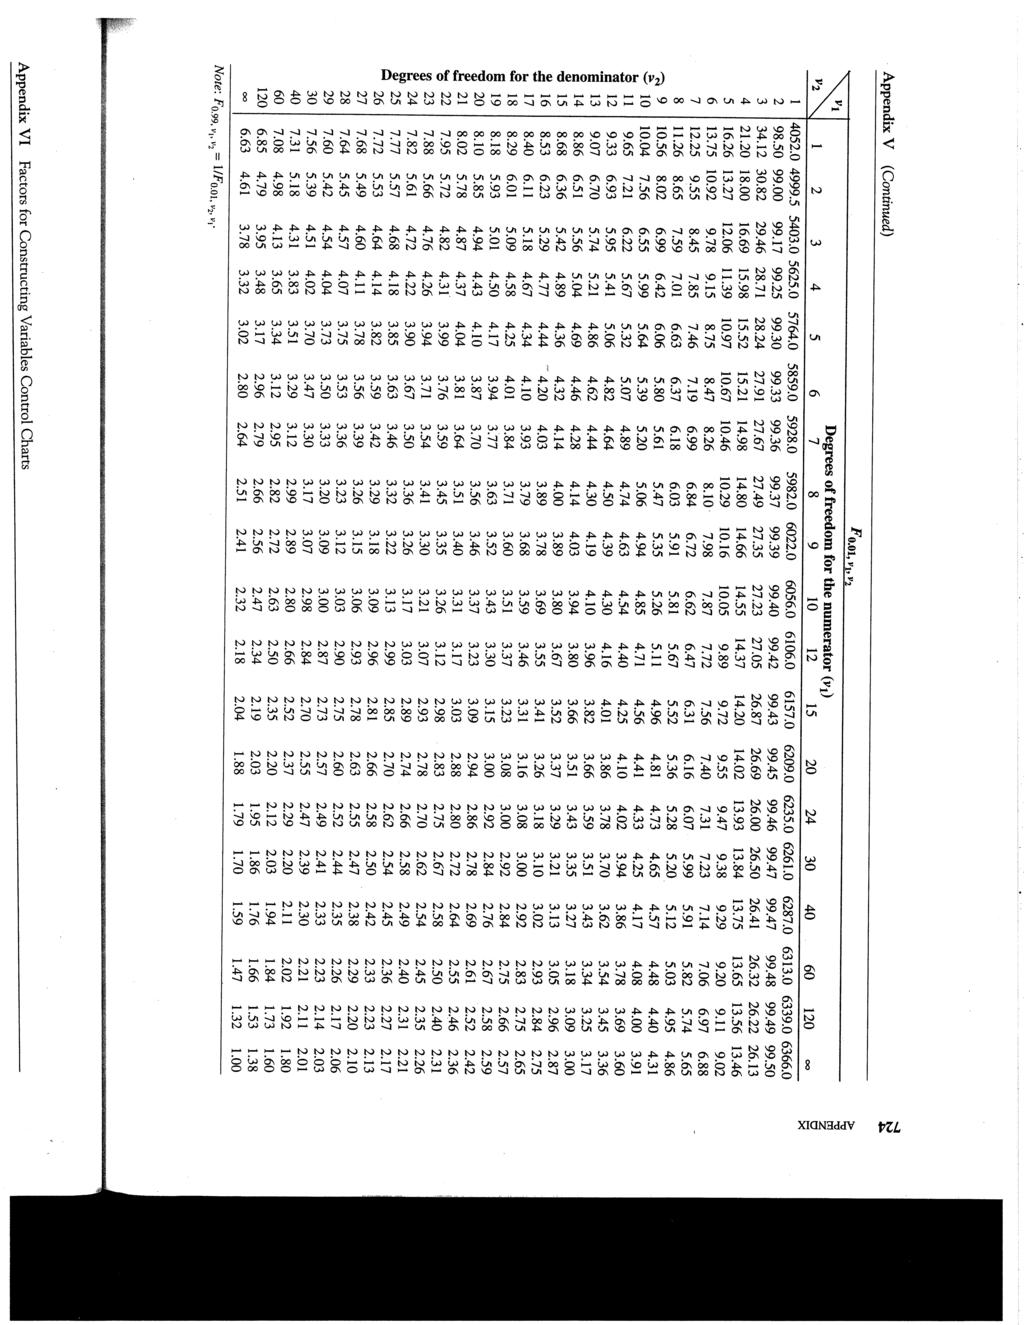
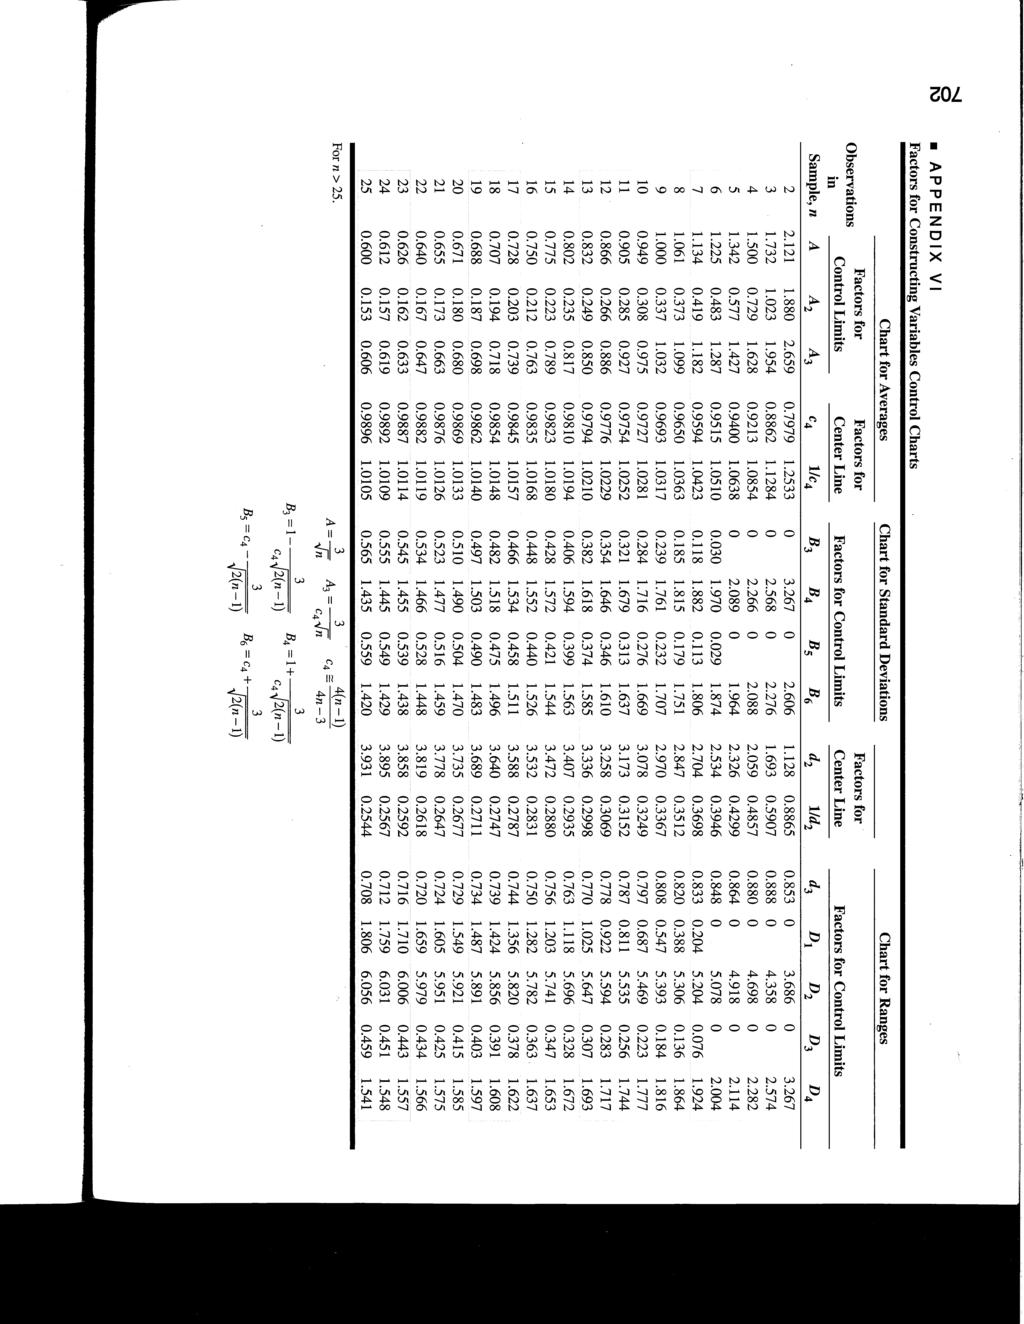
6 Problem 4 (ISyE 512) Recent development of sensing technology makes multivariate process monitoring popular. Consider the following historical dataset consists of the measurement of two quality characteristics (x,y). Subgroup Number x y We would like to use this dataset for Phase I analysis to establish control charts for the two quality characteristics. Assume both quality characteristics are independent and identically normal distributed. (1) If we want to build chart and S chart for variable x. What are the center line and control limits for these two charts? If we want to build a R chart for x, what are the center line and control limits? (Note: Please provide the answer based on the data in the table and you do NOT need to check if the data points are all in-control) (2) If we want to build a T 2 chart to monitor x and y simultaneously, what is the control limit? Using α = (3) Using the T 2 chart established in (2) to monitor some new samples, we have the following results:
7 Subgroup Number x S x y S y T Based on the results, what is the covariance between x and y used in the T 2 statistic? Are there out of control points of the three samples? (4) We often use univariate charts to monitor x and y separately and use the T 2 to monitor the two variable simultaneous. In general, is it possible that both the individual charts are in-control while the T 2 chart is out-of-control? And vice versa? Briefly explain your answer. You only need to consider the very general case, not the specific case in parts (1-3).
8 Problem 5 (ISyE 605) A large number of steel shafts with diameter D = 3" are to be rough-turned to diameter D' = 2.50" for a length L = 7.5" at a feed f = 0.01 inch per revolution, and a depth of cut d = When the cutting-tool was used at a cutting speed of 800 feet per minute, its tool life was found to be 1 minute. The Taylor's tool life equation constant (n) is 0.25 for this combination of cutting-tool and workpiece material. The initial cost of a cutting-tool is $60.00, and it can be re-sharpened and re-used 10 additional times. Each re-sharpening of the tool costs $5.00. The time to change the cutting-tool, ttc, is 5 minutes. The total time, tl, associated with loading and unloading of the shaft and repositioning of the tool to the beginning of the cut is 2 minutes per shaft. The operating cost, M, (including machine overhead and labor cost) is $ per minute. If the shaft was machined using a cutting-speed, V, of 400 feet per minute, what will be the total production cost per part (Cpr)? (Clearly state any assumptions that you make).
9 Problem 6 (ISyE 615) Consider a three-machine serial line with Bernoulli reliability model. Each machine m i, i=1,2,3, has probability p i to be up and 1-p i to be down during each time slot. Both buffers have capacity N=1. The status of the machine is determined at the beginning and buffer at the end of each time slot. Each machine status is determined independently from the other. A machine is starved if it is up and upstream buffer is empty, and is blocked if it is up, the downstream buffer is full and the downstream machine does not take a part. The first machine is never starved and the last machine is never blocked. Block before service and time-dependent failures are assumed. 1 1 p 1 p 2 p 3 (1). Define the states of the system (2). Derive the steady state balance equations (3). Assume p 1 =p 2 =p 3 =p, derive the formulas for line production rate PR, and blockage and starvation of each machine. (4). Identify the bottleneck of the machine, i.e., the machine with the largest explanation are needed). PR p i (illustration and/or (5). Under the workforce constraint p 1 p 2 p 3 =p *, how should one adjust p i to maximize line production rate? (Only qualitative answer is needed)
10 Problem 7 (641): In a company manufacturing high variety of custom engineered products, lead time spent in office operations such as quoting, engineering and order processing could be more significant than the lead time spent in shop floor operations. a) In the context of such office operations, explain clearly the response time spiral phenomenon observed in many office operations. b) Explain the following myth related to office processes: The more time spent on the quoting process, the more accurate the quote will be. List four distinct reasons to support your claim.
11 Problem 8 (ISyE 643) A certain machine has two critical bolts, either of which is sufficient to keep it running. If at the beginning of a week both bolts are intact, then at the end of the week exactly one will be intact with probability 0.3; neither will be intact with probability 0.4. However, if only one bolt is operative at the beginning of a week, the probability that it will still be intact at the end of the week is 0.4. When both bolts fail, the machine is damaged. A repairman comes once a week and determines whether the machine is damaged. If not, he leaves; if so, it takes him a week to fix it. 1) What fraction of all weeks is spent in repair (in the long run)? 2) How many repairs do we expect will be performed on average during a period of n weeks (in the long run)? 3) While the machine is running, it yields a profit of $5000/wk. Repairing a damaged machine costs $9000 per repair, and also results in the loss of a week s profit. Suppose the repairman could also look to see how many bolts were intact, and fix the machine of only one were faulty, at a cost of one week s time and $1000. Would this be better than the current arrangement? How much per week should we be willing to pay the repairman to perform the inspection for us?
12
13
14