The ever changing supply chain strategy. Tom Scorsune January 20, 2012
|
|
|
- Kimberly Shepherd
- 5 years ago
- Views:
Transcription

1 The ever changing supply chain strategy Tom Scorsune January 20, 2012

2 Domestic production Circa 1950 Domestic Production Regional Distribution Production Distribution 2


3 Domestic production Circa 1970 New York Japan S. Korea Taiwan Hong Kong Los Angeles Containerization New Markets Domestic Labor 3
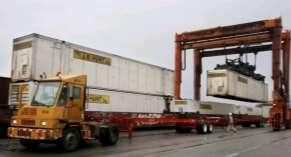
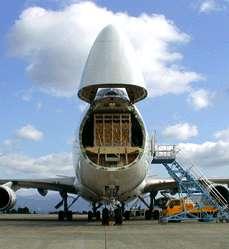
4 Global production Circa 2011 Longer Supply Chains Global Manufacturing Integrated Supply Chain 4


5 Future Challenges Environmental Port Security Port and Rail Infrastructure Owner Operator Capacity Development of New Technologies 5


6 Future Considerations Lazero Cárdenas Prince Rupert Inland Ports Panama Canal Expansion 6

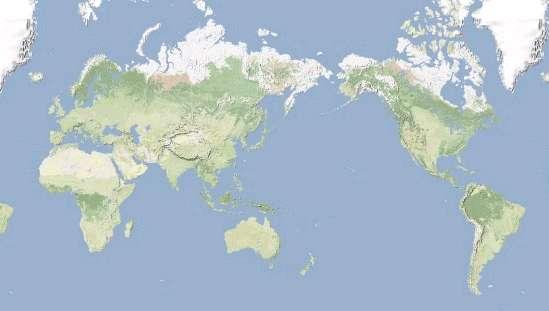
7 Future network (by 2015) Established Ocean Terminals Future Ocean Terminals Established Rail Hub/Network Future Inland Ports/Network 7
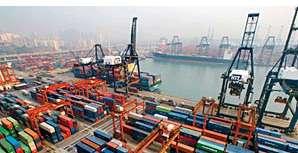
8 Major U.S. ports Share of imports (in Millions of TEU s) Lazaro Cardenas Containers Handled Growth Los Angeles/Long Beach 11,820 12, % New York/New Jersey 4,560 5, % Seattle/Tacoma 3,129 3, % Savannah 2,356 2, % Vancouver 2,150 2, % Oakland 2,050 2, % Norfolk 1,745 1, % Houston 1,797 1, % Charleston 1,181 1, % Lazaro Cardenas % Houston Charleston Norfolk Savannah Vancouver Oakland Seattle/Tacoma New York/New Jersey Los Angeles/Long Beach 8
9 Volume (in millions) 2010 container volume at top U.S. ports 2008 container volume at top U.S. ports Los Angeles Long Beach Seattle Tacoma Oakland NY/NJ Savannah Virginia YE 2010 YE

10 Current State Summary The economic recession has slowed freight volumes worldwide Although not currently an issue, congestion at LA/Long Beach, combined with the geographic constraints for growth, have made alternative ports and trade routes more attractive. Container ships are increasing in size to take advantage of cost savings provided by economies of scale. Panama Canal is opening up to accommodate larger ships The east and gulf coast ports are making infrastructure improvements in anticipation of long-term growth 10
11 Future Supply Chain Trends and Potential Impact Transportation represents one of the largest cost buckets important to have efficient and effective inbound and outbound transportation Intermodal / rail options increasingly more attractive - Sustainability/cost benefits - Resiliency risk mitigation Expansion of Panama Canal driving interest in east and gulf coast port locations - Closer proximity to U.S. population centers - Availability of less expensive land/facilities - Aggressive business and economic incentives Port diversification strategies more prevalent Trend to shorten supply chain near sourcing (e.g., Mexico vs. China) Inland ports expected to increase in importance Kansas City, Columbus, Chicago, etc. Availability of business & economic incentives, as well as labor issues, drive businesses to the southeast U.S. Increasing fuel costs will drive interest in more/smaller versus fewer/larger 11
 Supply chain network must be")
12 The One Thing That Is Constant Is Change Supply chains are increasingly global and complex Historically focused on cost reduction, but leveraged as a competitive differentiator by companies such as Wal-Mart, P&G, Toyota Supply chain security and risk are rising sharply Supply chain management is increasingly viewed as a core competency (versus a necessary evil ) Supply chain network must be evaluated on a regular basis 12
13 Case Study: Global Corporate Client

14 Original Supply Chain network Seattle Secaucus San Francisco Cherry Hill, NJ Los Angeles Atlanta Tampa Central DC Regional DC Ocean Routes Landbridge Domestic Routes 14

15 Post-Distribution Concept -10 Days -72 HRS 0 HRS Depart Origin EDI 856 & 315 EDI 850 & 315 Arrive Dest 15


16 Post-distribution objectives Improve On-Time Efficiency from 46% Provide Floor Ready Distribution Replace Manual Process with Automated Transload Facility Provide Post Distribution Capability Track Shipments by Containers vs. Purchase Orders Maintain Flexibility to Provide Pre-Pack Distribution Provide UCC 128 Labels to the Store Level with ASN Capability 16
17 Post-Distribution Results On-time performance improved from 46% to 99% Audit accuracy greater than 99.9% Reduced lead time by 14 days Eliminated a DC resulting in $11M annual cost reductions Less obsolete stock Domestic time saving from store-ready products Ability to leverage cost savings of inter-modal versus over the road 17


18 Replenishment Hybrid Concept Point of Sale Replenishment 3 Year Forecast, $300M USD Sales Increase Capital Investment of $300M USD Weekly Order Cycle Core Items - Expansion of Program to 40 Vendors RF Environment EDI Capabilities Random Reserve Storage Locations Zone Picking Efficiency Transload Process Integration Full Shipment Audit Functionality 18

19 Transload Calculator 19
20 More than real estate Understanding the total operating cost picture is critical to maximizing value 60% 50% 40% 30% 20% 10% 50.3% 21.8% 9.5% 7.8% Transportation, inventory and labor typically account for 80% of the operating costs Real estate typically accounts for less than 5% 4.3% 2.7% 2.2% 1.2% 0% Transportation Inv entory Labor Customer Serv ice Rent Admin Supplies Other Source: Herbert W. David & Company: Logistics Cost & Service Report 20
21 Thank You