Congest-Shun. Tim Lomax Texas A&M Transportation Institute
|
|
|
- Paulina Kelly
- 5 years ago
- Views:
Transcription


1 Congest-Shun An SEC Rival Discusses Mobility Data & How It Might Be Used to Design and Market Transportation Projects 58 th Annual Transportation Conference February 2015 Tim Lomax Texas A&M Transportation Institute
2 Project Design, Selection & Marketing More diverse set of project proposals More diverse information needs also include: Legislative mandate Agency accountability and transparency initiative Funding increase proposal Projects focused on problem locations Data and analysis needs Proactive public relations for the agency Maintain visibility of transportation
3 Congestion is Worse in Cities of All Sizes But the Recession Has Caused a Reset Delay per Commuter Very Large = 3 M + Large = 1 M - 3 M Medium = 500 K - 1 M Small = Below 500 K Small Medium Large Very Large

4 Slide 4 Birmingham Rush Hour $460 Million Congestion Cost 35 Hours Delay per Commuter $775 Per Commuter Wasted Fuel 10 Million Gallons in 2011 Severe 14% Heavy 16% 2011 Total Delay = 21 Million Hours Extreme 5% Light 20% Also: Huntsville, Mobile, Montgomery, Tuscaloosa Moderate 43%


5 Slide 5 Congestion Has Many Causes Special Events/Other 5% Poor Signal Timing 5% Bad Weather 15% Bottlenecks 40% Work Zones 10% Traffic Incidents 25%


6 % Varies for Each City Slide 6 100% But No Single Solution Accept Some Congestion Diversified Development Patterns Less Construction Delay Commute & Travel Options Improve System Efficiency 0% Build More Capacity
7 What s the Aggie Gonna Talk About? Why is transportation important? Importance of a value for money proposition What are the real choices? What are the expectations? Getting the data and using it Evaluating decisions and engaging the public 7
8 $6,000 $5,000 $4,000 $3,000 Pay More in Taxes But Less Overall Wait What s The Question? Wasted Fuel, Time & Maintenance Costs Taxes & Fees 2011 to 2035 Household Cost 6,095 4,825 4,228 3,652 $2,000 $1,000 $0 F-Unacceptable No Change 232 D-Worst Acceptable Preserve Infrastructure C-Minimum Competitive Median of Peers B-Continue 2010 Conditions Maintain 2010


9 What does this mean to me? The average Texan pays: $22/month in state/federal gas taxes and auto fees $128/month Internet, phone, cable TV $139/month cell phone
10 Fewer Consumers, Workers, Jobs Within Marketshed 1 Hour Commute Payroll & turnover increases; More trucks to maintain service standards More distribution centers
11 Texas Legislature Mandate TxDOT Appropriations Rider: 100 most congested sections (post on website every year) Travel delay per mile - find the biggest & slowest traffic streams What are the projects that will attack congestion for each section? Projects that will get the most bang for the buck Targeted funding (Not the typical creamy peanut butter process) What are economic benefits of projects?
12 Texas 100 Most Congested Methodology Traffic volume GIS dataset (TxDOT) Speed GIS dataset (INRIX) Combine the two Make the sets comparable Calculate congestion statistics by direction and segment Find problems location, time, cause Solution Operation, Design, Policy, Kitchen Sink? 12


13 Texas 100 Data INRIX Selected Bidder for 2013 Data $125,000 Licensed to TxDOT and all MPOs Unlimited use of derivative data for corridor level Average & percentile speeds by direction 15-Minute Intervals for average week 13
14 The Data We Would Like To Have Archived 15-minute speeds Traffic volume by 15-minute throughout the year (or estimated) Average passenger vehicle occupancy Roadway inventory data The Whys Weather, Incidents, Events, Road Work, Agency Actions
15 24-Hour Volume Profiles Example: Weekday Traffic, No to Low Congestion Percent of Daily Volume 12% 10% 8% 6% AM Peak, Frwy Wkday AM Peak, Non- Frwy Wkday PM Peak, Frwy Wkday PM Peak, Non- Frwy Wkday 4% 2% 0% Mid 4:00 8:00 Noon 4:00 8:00 Mid 15
16 2013 Data Comparison Texas 130,000 directional miles 110,000 directional miles matched to roadway inventory Alabama 30,000 directional miles 26,000 directional miles matched to roadway inventory Speeds by direction, every 15 minutes of average day 16
17 Where is Congestion in Texas? numerically, only a few places.. Hours Per Mile (1000s) 1,200 Top 20 Cost - $1,590M (43%) 1, Cost of : $1,110M (30%) Cost of : $1,000M (27%)

18 The Texas Freight Network Cornerstone of Texas Freight Mobility Plan Defines an all-mode Texas Freight Network Transportation corridors Key freight generators and gateways Source: Texas Freight Advisory Committee

19 Freight Congestion A Key Element of the 21 st Century Economy U.S. urban truck delay 350 million truck hours $27 billion Inventory costs Just-in-time operations Fleet productivity Distribution centers Public & private sector decision structures
20 graphic

21 TOol using STAcked DAta (TOSTADA) Decisions aren t just about congestion 1 st Step: Better public engagement Discuss all project effects Use geographic information tools Mapping, graphics, data, stories Yes, we started with the food, then developed the name
22 Congestion
23 Pavement Condition
24 Bridge Condition
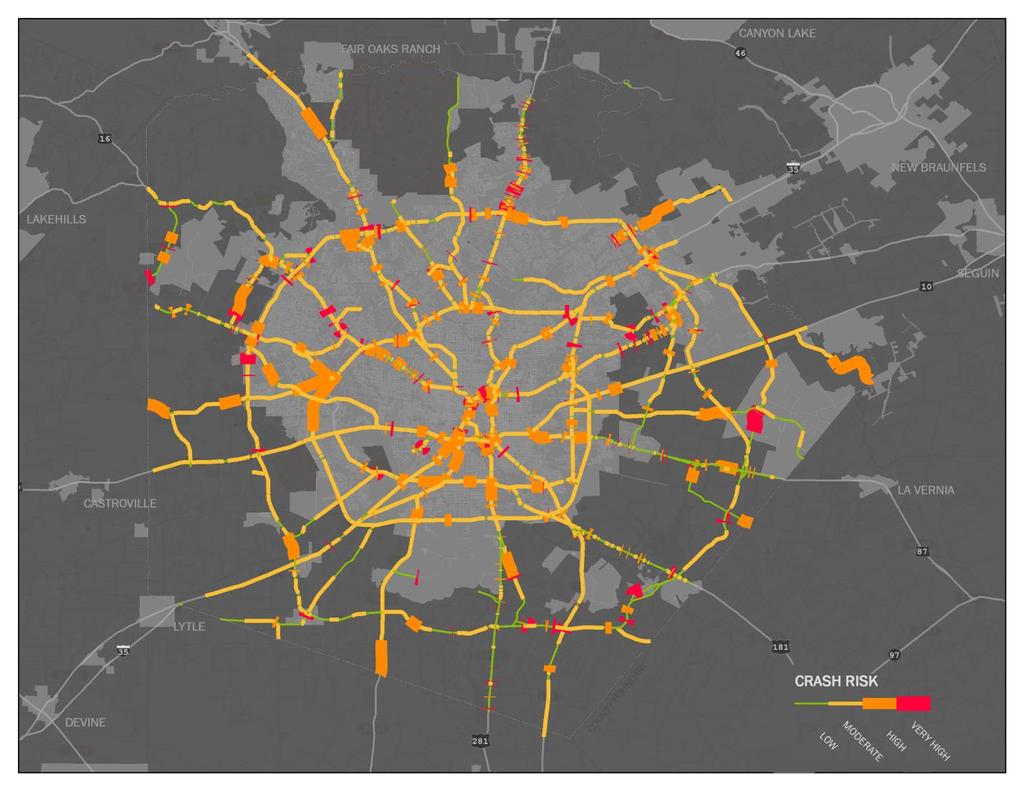
25 Safety
26 Freight Commodity Value


27 Use Case US 281 at Loop 1604 Bridge Condition Congestion Freight Value Pavement Condition Crash Risk Bridges good / fair Congestion high Freight Value medium-high Pavement very good / good Crash very high / high Spend resources here? If so, what type & amount? Take resources elsewhere?
28 TOSTADA The Next Course More data, more collaboration Brings traditional silo data together Helps frame project design and benefit messaging Consistent format for easier at-a-glance understanding Policy-makers can use results to better understand problems
29 What s Next? Local Input and MAP 21 Performance Measures MPOs, municipalities, transit agencies Use performance data to find problems and identify broad range of solutions Operations, design, travel options, pricing, policy Dashboards and Reports Facilitates transferability and accountability Engage the public more aggressively Projects, Long-range plans, Funding discussions


30 Texas A&M Transportation Institute (with TAMU Transportation Services, City of College Station, City of Bryan, BCS Chamber of Commerce, Convention and Visitors Bureau, Downtown Bryan Association, TAMU Athletics, 12 th Man Foundation, TxDOT, Safety and Law Enforcement Agencies)


31 Kyle Field Gameday: 4 th Largest Downtown in Texas Kyle Field Gameday 120,000+ attendees/workers 2 Freeways Downtown Austin 125,000 workers 4 Freeways Some Perspective Downtown Dallas 145,000 workers 6 Freeways Downtown Houston 150,000 workers 7 Freeways


32 Real time traffic Real time parking Shuttle bus service maps Parking cost information, pay through app Game weekend in BCS Dining, Activities, Hotels, Tickets App will evolve in 2015 Connected to: Bandwidth? gameday.12thman.com

33 2014 Kyle Field Transportation Ole Miss: Medical emergency on George Bush West & DWI crash on Stotzer at FM 2818
34 So now what? Use our existing roads smarter Move crashes and stalls out of the way Time traffic signals so more see green Encourage carpooling Change rush hour nightmares through flex-time, telecommuting, etc.


35 So now what? Get the biggest bang for the buck Tackle most congested roadways Improve safety Support biking, walking and mass transit options
36 Mobility Investment Priorities The Take-Aways Agencies must involve their stakeholders Go meet the public where they are Innovative designs and operating ideas are needed Multiple funding sources will be needed Technology can play a role Public-private partnerships - leading construction practice to the future Incentivize the market and encourage creativity mobility.tamu.edu/mip
 2.9 B Gallons in 2011 Severe 8% Heavy 9% 2011 Extreme 13% Moderate 18% Total Delay = 5.")
37 Slide Extreme Severe 5% 6% Heavy 7% Moderate 9% Expanding Travel Delay & Shrinking Free-Flow Hours Total Delay = 1.1 Billion Hours Uncongested 73% Wasted Fuel (Same Trend) 2.9 B Gallons in 2011 Severe 8% Heavy 9% 2011 Extreme 13% Moderate 18% Total Delay = 5.5 Billion Hours Uncongested 21% Light 31%


38 What s New: Daily Volume Profiles Time-of-day profile for truck volumes differs from mixed vehicle Data Source: FHWA Office of Policy Information and state DOTs, and TTI analysis

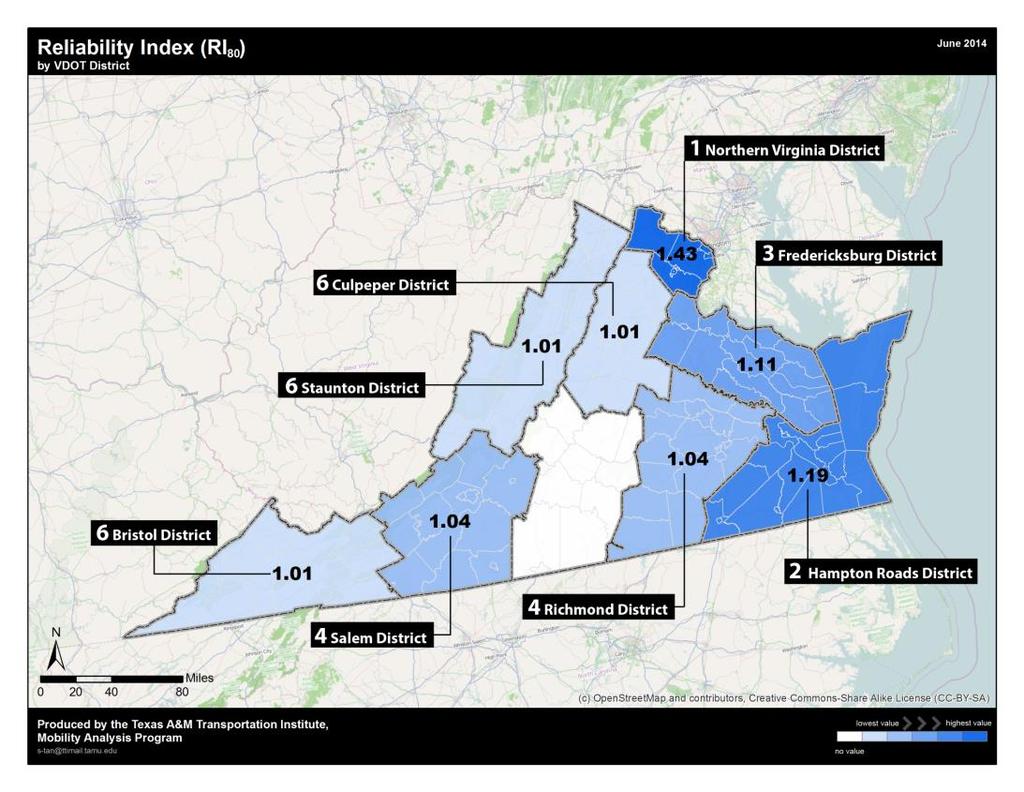
39 Slide 39 Reliability: The Profession Catches Up to the Public
40 How is This Information Used in the Public Sector? Monitoring performance What if? Project prioritization, decision-making Special events, what is the effect of X? Related policy/funding decisions
41 How Can This Information be Useful to Private Industry? Understand time required to traverse the network Understand risk by using variability of travel times Time-of-day travel time to help schedule delivery routes Avoiding bottlenecks to improve efficiency Distribution center location
Urban Mobility and the Cost of Congestion (Getting the Public Engaged in Solution Discussions)
") Urban Mobility and the Cost of Congestion (Getting the Public Engaged in Solution Discussions) Tim Lomax t-lomax@tamu.edu Texas A&M Transportation Institute Alabama Transportation Planners Association
Urban Mobility and the Cost of Congestion (Getting the Public Engaged in Solution Discussions) Tim Lomax t-lomax@tamu.edu Texas A&M Transportation Institute Alabama Transportation Planners Association
Telling the Truck Freight Mobility Story: Measures and Findings
 Telling the Truck Freight Mobility Story: Measures and Findings Bill Eisele Texas Transportation Institute http://mobility.tamu.edu September 13, 2012 Ohio Conference on Freight 2012 The Challenge: What
Telling the Freight (trucking/goods movement) story:
 story:") Telling the Freight (trucking/goods movement) story: Urban Mobility Report truck elements Trucks in Texas 100 Connection to Texas Freight Network Improving data for truck analyses Solutions/uses Observations
Telling the Freight (trucking/goods movement) story: Urban Mobility Report truck elements Trucks in Texas 100 Connection to Texas Freight Network Improving data for truck analyses Solutions/uses Observations
State Strategies to Reduce Traffic Congestion. National Conference of State Legislatures November, 2007
 State Strategies to Reduce Traffic Congestion National Conference of State Legislatures November, 2007 More People More Freight 40 million more people in last 15 years Highway travel increase 1990-2003,
INTERSTATE CORRIDOR PLANNING
 INTERSTATE CORRIDOR PLANNING Prioritization of Corridor Studies July 29, 2015 Importance of the Interstate System Texas is an integral part of the national interstate system. The interstate system provides
Travel Time Index: Why All the Fuss? Tim Lomax Texas A&M Transportation Institute
 Travel Time Index: Why All the Fuss? Tim Lomax Texas A&M Transportation Institute http://mobility.tamu.edu/ Key Aspects of TTI s Performance Measurement Recommendations Goal: Help a range of audiences
Regional Performance Measures Annual Progress Report TPO Board - 2/4/2016 Presentation by: Chris Wichman, Senior Planner
 2015 TPO Board - 2/4/2016 Presentation by: Chris Wichman, Senior Planner Overview History and definition of performance-based planning & programming Review of 2015 TPO Board Action Requested 2 History
9.0 Meeting the Challenges
 9.0 Meeting the Challenges 9.1 SLRTP Goals The SLRTP is built around the six TxDOT Strategic Plan goals. 1. Develop an organizational structure and strategies designed to address the future multimodal
Operations in the 21st Century DOT Meeting Customers Needs and Expectations
 Operations in the 21st Century DOT Meeting Customers Needs and Expectations 1 Purpose of this Meeting: Share Thoughts & Discuss Challenges brought about by the changing transportation environment and public
Transportation System Management & Operations (TSM&O)
") Transportation System Management & Operations (TSM&O) I.T.S. just not that complicated Chris Hilyer Assistant State Maintenance Engineer, TSM&O TSM&O is An integrated program to optimize the performance
Transportation System Management & Operations (TSM&O) I.T.S. just not that complicated Chris Hilyer Assistant State Maintenance Engineer, TSM&O TSM&O is An integrated program to optimize the performance
TOSTADA Data Integration Framework (TOol using STAcked Data)
") TOSTADA Data Integration Framework (TOol using STAcked Data) 2018 Arkansas DOT Transportation Research Committee Engineering Conference Tim Lomax Texas A&M Transportation Institute 1 TOSTADA Concept We
TOSTADA Data Integration Framework (TOol using STAcked Data) 2018 Arkansas DOT Transportation Research Committee Engineering Conference Tim Lomax Texas A&M Transportation Institute 1 TOSTADA Concept We
INTEGRATING FREIGHT IN CORRIDOR PLANNING AND PROJECT DEVELOPMENT. Steve Linhart, AICP Caroline Mays, AICP
 INTEGRATING FREIGHT IN CORRIDOR PLANNING AND PROJECT DEVELOPMENT Steve Linhart, AICP Caroline Mays, AICP June 17, 2016 The Importance of Freight Transportation in Texas Almost 4 billion tons of freight
2. Guiding Principles, Objectives, and Policies
 2. Guiding Principles, Objectives, and Policies INTRODUCTION The guiding principles for the 2040 MTP Update establish the vision and key focus areas for this planning effort. They combine the guidance
DES MOINES AREA MPO. Environment Roundtable. October 13, 2015
 DES MOINES AREA MPO Environment Roundtable October 13, 2015 October 13, 2015 Agenda 1. Call to Order 2. VOTE: Approval of Agenda 3. VOTE: Approval of Meeting Minutes 4. UPDATE: Water Trails 5. DISCUSSION:
Highest Priority Performance Measures for the TPP
 Highest Priority Performance Measures for the TPP The following list of measures are the highest priority performance measures as identified by modal working groups. These groups consist of staff from
Using INRIX Data in Iowa. Kyle Barichello, Iowa DOT Skylar Knickerbocker, InTrans
 Using INRIX Data in Iowa Kyle Barichello, Iowa DOT Skylar Knickerbocker, InTrans What is probe data? What is INRIX data? INRIX Data Overview Purchased traffic data Covers Interstates, State Highway, some
Management. VA SITE Annual Meeting June 27, 2013 Jay Styles Performance and Strategic t Planning Manager, Business Transformation Office
 VDOT and MAP-21 Performance Management VA SITE Annual Meeting June 27, 2013 Jay Styles Performance and Strategic t Planning Manager, Business Transformation Office Overview Map-21- How is VDOT Preparing?
Section 5: Performance-Based Planning
 Section 5: Performance-Based Planning Mapping the Future: The Southwestern PA Plan establishes a performance-based foundation for regional transportation investment decisions consistent with MAP-21 1 guidance.
Congestion Management Process (CMP)
") Congestion Management Process (CMP) Introduction The Congestion Management Process (CMP) is a systematic, data-driven, and regionally accepted approach that aims to improve the performance of the transportation
Congestion Management Process (CMP) Introduction The Congestion Management Process (CMP) is a systematic, data-driven, and regionally accepted approach that aims to improve the performance of the transportation
Speaker s notes for Rethinking our Path to Mobility presentation
 Speaker s notes for Rethinking our Path to Mobility presentation Slide 1 You know all those orange barrels that you see as you re driving around (name of city)? You might call them a good example of a
Proposed Comprehensive Update to the State of Rhode Island s Congestion Management Process
 Proposed Comprehensive Update to the State of Rhode Island s Statewide Planning Program January 2018 Summary Outline of of Action Steps 1. Develop Objectives for Congestion Management What is the desired
Travel Demand Modeling At NCTCOG
 Travel Demand Modeling At NCTCOG Arash Mirzaei North Central Texas Council Of Governments For University of Texas at Arlington ITE Student Chapter March 9, 2005 Agenda Background DFW Regional Model Structure
Transportation Problems and Issues Excerpts from WWW Links
 Transportation Problems and Issues Excerpts from WWW Links Reference Bok, D. (2018). Transportation policy and planning. https://www.hks.harvard.edu/courses/transportation-policy-and-planning Transportation
10.0 Congestion Management Process
 Livability 2040 Regional Transportation Plan 10-1 10.0 Congestion Management Process 10.1 CMP Summary The identification and evaluation of projects for the Livability 2040 Regional Transportation Plan
National Performance Research Data Set (NPMRDS): Travel Time Probe Data. Northwestern Indiana Regional Planning Commission
: Travel Time Probe Data. Northwestern Indiana Regional Planning Commission") National Performance Research Data Set (NPMRDS): Travel Time Probe Data Northwestern Indiana Regional Planning Commission Topics Presentation Will Cover: What is the NPMRDS? How is the NPMRDS used? What
National Performance Research Data Set (NPMRDS): Travel Time Probe Data Northwestern Indiana Regional Planning Commission Topics Presentation Will Cover: What is the NPMRDS? How is the NPMRDS used? What
Performance Measures for Transportation Planning Part 1
 Performance Measures for Transportation Planning Part 1 Flint, MI July 12, 2011 Brian Betlyon FHWA Resource Center Overview Performance Measurement in Transportation Planning Module Outcomes Describe performance
PERFORMANCE-BASED PLANNING AND PROGRAMMING
 February 2017 performance-based planning and programming Boston Region MPO PERFORMANCE-BASED PLANNING AND PROGRAMMING WHAT IS PERFORMANCE-BASED PLANNING AND PROGRAMMING? Performance-based planning and
Mobility and System Reliability Goal
 Mobility and System Reliability Goal Provide surface transportation infrastructure and services that will advance the efficient and reliable movement of people and goods throughout the state. Background:
2004 FEASIBILITY STUDY UPDATE
 Austin-San Antonio Intermunicipal Commuter Rail District 2004 FEASIBILITY STUDY UPDATE December 2004 EXECUTIVE SUMMARY INTRODUCTION Almost 3 million people in Central Texas, living and working between
TTAC STAFF REPORT. State Targets for the MAP-21/FAST Act National Highway Performance Program. MEETING DATE: August 2, 2018 AGENDA ITEM: 5
 TTAC STAFF REPORT SUBJECT: State Targets for the MAP-21/FAST Act National Highway Performance Program MEETING DATE: August 2, 2018 AGENDA ITEM: 5 STAFF CONTACT: Andrew Orfila, Jared Carvalho RECOMMENDATION:
GUIDING PRINCIPLES MEMORANDUM
 M E T R O P O L I TAN TRA NS P O RTATI O N PLAN GUIDING PRINCIPLES MEMORANDUM El Paso Metropolitan Planning Organization INTRODUCTION The guiding principles for development of the El Paso MPO s Destino
National Performance Measure Target Recommendations
 National Performance Measure Target Recommendations March 2018 TC Workshop Review of National Performance Measures PURPOSE: Transportation Commission must adopt National Performance Measure Targets in
Performance Based Planning and Federal Target Setting. Transportation Policy Board September 13, 2018
 Performance Based Planning and Federal Target Setting Transportation Policy Board September 13, 2018 Federal Requirements - Background MAP-21 and the FAST Act established new emphasis on performance and
Transportation Spending and Job Creation. February 2011
 Transportation Spending and Job Creation February 2011 $26 Billion in Flexible Transportation Dollars 2 What We Knew Going In Compared to new roads repair and maintenance create 16% more jobs Transit creates
SBCAG STAFF REPORT. MAP-21/FAST Act Performance Measures and Targets. MEETING DATE: September 20, 2018 AGENDA ITEM: 4H
 SBCAG STAFF REPORT SUBJECT: MAP-21/FAST Act Performance Measures and Targets MEETING DATE: September 20, 2018 AGENDA ITEM: 4H STAFF CONTACT: Andrew Orfila, Jared Carvalho RECOMMENDATION: Approve and accept
ACTIVE TRANSPORTATION ADVISORY COMMITTEE. Memphis MPO March 30, 2015
 ACTIVE TRANSPORTATION ADVISORY COMMITTEE Memphis MPO March 30, 2015 Agenda Welcome & Introductions Announcements and Briefings Livability 2040: Regional Transportation Plan Congestion Management Process
Introduction. National Performance Requirements. Addressing Performance in Mobility 2045
 Introduction Measuring and tracking the performance of the region s transportation system is a fundamental component of the Metropolitan Transportation Plan (MTP) and the performance-based planning process.
Introduction. National Performance Requirements. Addressing Performance in Mobility 2045
 Introduction Measuring and tracking the performance of the region s transportation system is a fundamental component of the Metropolitan Transportation Plan (MTP) and the performance-based planning process.
PROTECTING Our Quality of Life... Why the Capital Region Needs to Invest in Mass Transit NOW
 PROTECTING Our Quality of Life... Why the Capital Region Needs to Invest in Mass Transit NOW The Challenge... Traffic congestion in the Capital Region has doubled over the last decade. $86M Total cost
2040 Addendum Performance-Based Planning November 2018
 2040 Long Range Transportation Plan 2040 Addendum Performance-Based Planning November 2018 Adopted June 13, 2018 250 S. Orange Ave, Suite 200, Orlando, FL 32801 407-481-5672 www.metroplanorlando.org MetroPlan
Appendix E. Congestion Management Process. Congestion Management Process
 November 2017 Appendix E Congestion Management Process Maintenance of a Congestion Management Process (CMP) is a requirement for all Metropolitan Planning Organizations (MPOs) in Transportation Management
Appendix O Congestion Management Program REGIONAL TRANSPORTATION PLAN/SUSTAINABLE COMMUNITIES STRATEGY
 Appendix O Congestion Management Program REGIONAL TRANSPORTATION PLAN/SUSTAINABLE COMMUNITIES STRATEGY 2014 REGIONAL CONGESTION MANAGEMENT PROGRAM 2014 RTP/SCS APPENDIX O SAN JOAQUIN COUNCIL OF GOVERNMENTS
NJTPA Region. Bergen Essex Hudson Hunterdon Jersey City Middlesex Monmouth Morris. Newark Ocean Passaic Somerset Sussex Union Warren
 NJTPA Region Bergen Essex Hudson Hunterdon Jersey City Middlesex Monmouth Morris Newark Ocean Passaic Somerset Sussex Union Warren North Jersey Transportation Planning Authority The Metropolitan Planning
SECTION II CONTROLLED ACCESS FACILITIES
 SECTION II CONTROLLED ACCESS FACILITIES SYSTEM IDENTIFICATION A critical component of the Dallas-Fort Worth (DFW) Metropolitan Transportation System is the regional freeway and tollway systems, which are
Contents i Contents Page 1 A New Transportation Plan Community Involvement Goals and Objectives... 11
 Contents i Contents 1 A New Transportation Plan... 1 Why develop a new plan?... 1 What area does the LRTP focus on?... 2 Why is this LRTP important?... 3 Meeting Requirements for Transportation Planning...
INDIANA S INTERMODAL MANAGEMENT SYSTEM Stephen C. Smith Planning Manager, Transportation Planning Division Indiana Department of Transportation
 96 INDIANA S INTERMODAL MANAGEMENT SYSTEM Stephen C. Smith Planning Manager, Transportation Planning Division Indiana Department of Transportation Indiana is in the process of developing an Intermodal
Examining the Economic Trade-offs of Alternative Transportation Funding NC I-95 Economic Assessment
 Examining the Economic Trade-offs of Alternative Transportation Funding NC I-95 Economic Assessment presented to ITED Conference presented by Cambridge Systematics, Inc. Paula Dowell, PhD April 2014 Background
IDOT PERFORMANCE BASED PROJECT METRICS. February 2018
 IDOT PERFORMANCE BASED PROJECT METRICS February 2018 March 5, 2018 2 What is Performance Management? Performance Management of the Federal Highway Program is a systematic approach to making investment
RTC Mobility Plan Workshop. North Central Texas Council of Governments July 9, 2015
 RTC Mobility Plan Workshop North Central Texas Council of Governments July 9, 2015 Agenda 1. Introduction to the Metropolitan Transportation Plan (MTP) 2. New Planning Parameters 3. Emerging Planning and
Transit Service Guidelines
 G R E AT E R VA N CO U V E R T R A N S P O RTAT I O N A U T H O R I T Y Transit Service Guidelines PUBLIC SUMMARY REPORT JUNE 2004 Greater Vancouver Transportation Authority TRANSIT SERVICE GUIDELINES
TRANSPORTATION SYSTEMS MANAGEMENT & OPERATIONS (TSMO)
") TRANSPORTATION SYSTEMS MANAGEMENT & OPERATIONS (TSMO) Program Planning 2018 Transportation Planning Conference June 6, 2018 The Congestion Problem Continues to Get Worse $160 billion of wasted time and
TRANSPORTATION SYSTEMS MANAGEMENT & OPERATIONS (TSMO) Program Planning 2018 Transportation Planning Conference June 6, 2018 The Congestion Problem Continues to Get Worse $160 billion of wasted time and
MONITORING IMPLEMENTATION AND PERFORMANCE
 12 MONITORING IMPLEMENTATION AND PERFORMANCE The FAST Act continues the legislation authorized under MAP-21, which created a data-driven, performance-based multimodal program to address the many challenges
TEXAS FREIGHT MOBILITY PLAN 2017
 TEXAS FREIGHT MOBILITY PLAN 2017 Texas Transportation Commission September 28, 2017 Overview of the Texas Freight Mobility Plan 2016 Plan First multimodal freight mobility plan Identified freight network,
TRANSPORTATION SYSTEMS MANAGEMENT & OPERATIONS (TSMO)
") TRANSPORTATION SYSTEMS MANAGEMENT & OPERATIONS (TSMO) Statewide Strategic Plan Texas Association of Metropolitan Planning Organization (TEMPO) Meeting March 2, 2018 Today s Speakers Marco Cameron, P.E,
TRANSPORTATION SYSTEMS MANAGEMENT & OPERATIONS (TSMO) Statewide Strategic Plan Texas Association of Metropolitan Planning Organization (TEMPO) Meeting March 2, 2018 Today s Speakers Marco Cameron, P.E,
Status of Freight Planning in the Alamo Area MPO
 Status of Freight Planning in the Alamo Area MPO Technical Advisory Committee March 10, 2017 Freight Planning at All Levels National Transportation and trade priorities National Strategic Freight Plan
THAT Council adopt the Congestion Management Strategy as outlined in this report
 RR3 ADMINISTRATIVE REPORT Report Date: May 2, 2017 Contact: Winston Chou Contact No.: 604.873.7913 RTS No.: 011564 VanRIMS No.: 08200020 Meeting Date: May 16, 2017 TO: FROM: SUBJECT: Vancouver City Council
TEXAS DEPARTMENT OF TRANSPORTATION. Texas Metropolitan Mobility Plan: Breaking the Gridlock
 TEXAS DEPARTMENT OF TRANSPORTATION Texas Metropolitan Mobility Plan: Breaking the Gridlock CONTENTS PAGES Overview 1-2 Planning 1 Funding 2 Streamlined Project Delivery 2 Introduction: Why a Texas Mobility
TEXAS FREIGHT MOBILITY PLAN. Greater Houston Freight Committee Kick-Off Meeting
 TEXAS FREIGHT MOBILITY PLAN Greater Houston Freight Committee Kick-Off Meeting July 11, 2016 Overview of Texas Freight Mobility Plan The Freight Plan is TxDOT's first multimodal transportation plan that
Contents. Introduction 1
 Contents Introduction 1 Pg. 01 Traffic congestion impacts how easy - or not - it is to get around. While traffic will grow as more people and jobs move to the Alamo Area, we can and should try to manage
TAMING BIG DATA FOR SMARTER FUTURE
 2015 APA National Planning Conference Function Code: S585 TAMING BIG DATA FOR SMARTER FUTURE Ed Hutchinson OVERVIEW 1. Enterprise Information Management (EIM) 2. Data Clearing House 3. Florida Transportation
Active Direction to Managing Transportation ATDM: Ohio s Perspective
 Active Direction to Managing Transportation ATDM: Ohio s Perspective John Gray, Associate Vice President AECOM Brenton, Bogard, P.E. Studies Engineer Ohio Department of Transportation Ohio Transportation
PERFORMANCE-BASED PLANNING AND PROGRAMMING
 February 2017 performance-based planning and programming Boston Region MPO PERFORMANCE-BASED PLANNING AND PROGRAMMING WHAT IS PERFORMANCE-BASED PLANNING AND PROGRAMMING? Performance-based planning and
Integrated Corridor Management --An Overview --
 Integrated Corridor Management --An Overview -- Neil Spiller FHWA Office of Operations Program Manager: ICM KBPS video 1 Integrated.. combining or coordinating separate agencies so as to provide a harmonious,
INVESTMENT SCENARIOS CHAPTER Illustrative Investment Approaches Public Outreach 6-1
 CHAPTER 6 As detailed in Chapters 4 and 5, Texas multimodal transportation needs estimated at $21 billion annually (2014 constant dollars) illustrated in Exhibit 4-12 far outstrip the approximately $9.1
Policy Research CENTER
 Connecting Demand Management and Economic Development Activities TRANSPORTATION Policy Research CENTER Recent research into employer-based demand management strategies highlighted the fact that most business
Developing a Methodology for Deriving Cost Impacts to the Trucking Industry that Generate from Freight Bottlenecks
 Developing a Methodology for Deriving Cost Impacts to the Trucking Industry that Generate from Freight Bottlenecks Principal Investigator: Jeffrey Short Senior Research Associate American Transportation
Regional Transportation Performance Measures
 Regional Transportation Performance Measures March 5, 2014 Presented by Tom Murtha Regional Transportation Performance 2 Measures: Introduction Regional Transportation Performance Measures address needs
Congestion Management Strategy
 Congestion Management Strategy Vancouver as of 2018 50% of trips are made on foot, by bike or transit. 6 major bridges in Vancouver. 32% decrease in distance driven per person since 2007. 4.6% population
TEXAS TRANSPORTATION PLAN. Public Meeting Round 1
 TEXAS TRANSPORTATION PLAN Public Meeting Round 1 The Texas Transportation System The Texas transportation system enables you to drive, ride, walk, bike, or fly to get where you need to go. It supports
Chapter IX Regional Performance
 Chapter IX Regional Performance In recent years, performance-based planning and project programming have increasingly been employed by the North Central Texas Council of Governments (NCTCOG) in the development
MOBILITICS. Scenario Planning and Modeling Connected & Automated Vehicles. June 12, 2018
 MOBILITICS Scenario Planning and Modeling Connected & Automated Vehicles June 12, 2018 Connected and Automated Vehicles are everywhere. Light Duty (personal or shared) Shuttles Bus Freight Parcel Delivery
RTC Position on Pavement Condition Targets
 RTC Position on Pavement Condition Targets NCTCOG Supports TxDOT Statewide 2022 Good Pavement Condition Targets for National Highway System Facilities NCTCOG Supports TxDOT Statewide 2022 Poor Pavement
FHWA Programs Supporting Freight
 FHWA Programs Supporting Freight Institute for Trade and Transportation Studies Conference Office of Operations 1200 New Jersey Avenue S.E. Washington, D.C. 20590 www.ops.fhwa.dot.gov/freight Jeff Purdy,
The Policies section will also provide guidance and short range policies in order to accomplish the goals and objectives.
 4 Goals & Objectives INTRODUCTION The 2015-2040 MTP preserves and promotes the quality of life and economic prosperity of the MAB by providing a transportation system consistent with the regional goals.
Current Trends in Traffic Congestion Mitigation
 Current Trends in Traffic Congestion Mitigation April 24, 2009 NCSL Spring Forum Washington, DC Jeff Lindley Associate Administrator, Office of Operations Federal Highway Administration U.S. Department
From Breakout Discussions
 From Breakout Discussions Table # Concept Votes for Priority Quadrant Table 2 A. Balance New/Existing 1 2 Table 2 B. Additional/Alternative 2 1 Table 2 C. Combine projects to maximize $$ 3 2 Table 2 D.
Appendix L Greenhouse Gas 4-part Strategy
 Appendix L Greenhouse Gas 4-part Strategy Supplementary information regarding options for further reducing greenhouse gas emissions in the Puget Sound region State and Federal Greenhouse Gas Emissions
Chapter 10 Goals, Objectives + Policies
 Chapter 10 Goals, + Policies Warehouse on Nestle Way near I-78 114 115 10.1 ESTABLISHMENT OF CONSISTENT GOALS 10.2 NATIONAL FREIGHT GOALS The Lehigh Valley s freight transportation investment decisions
Incorporating TMS into Planning. Jianming Ma, Ph.D., P.E.
 Incorporating TMS into Planning Jianming Ma, Ph.D., P.E. Table of Contents 1 What is TMS 3-4 2 Transportation Environment is Changing 5-6 3 Benefits from TMS 7-8 4 Traditional Approach to Managing Transportation
APPLES TO APPLES: MEASURING THE PERFORMANCE OF TRANSIT AND ROADWAYS EQUIVALENTLY
 0 APPLES TO APPLES: MEASURING THE PERFORMANCE OF TRANSIT AND ROADWAYS EQUIVALENTLY Reuben M. Juster Faculty Research Assistant Center for Advanced Transportation Technology University of Maryland College
University Transportation Center Conference for the Southeastern Region
 University Transportation Center Conference for the Southeastern Region Innovative Solutions Needed to Address Transportation Challenges Michael F. Trentacoste Associate Administrator for Research, Development
TEXAS FREIGHT MOBILITY PLAN IMPLEMENTATION. AAMPO Technical Advisory Committee (TAC)
") TEXAS FREIGHT MOBILITY PLAN IMPLEMENTATION AAMPO Technical Advisory Committee (TAC) October 7, 2016 Overview of Texas Freight Mobility Plan The Freight Plan is TxDOT's first multimodal transportation plan
TEXAS FREIGHT MOBILITY PLAN IMPLEMENTATION AAMPO Technical Advisory Committee (TAC) October 7, 2016 Overview of Texas Freight Mobility Plan The Freight Plan is TxDOT's first multimodal transportation plan
CIRCULATOR STATUS UPDATE PRESENTATION JUNE 22, 2015
 CIRCULATOR STATUS UPDATE PRESENTATION JUNE 22, 2015 1 Summary of Outreach Activities Peer Review Operating Plan Development Discussion Next Steps 2 CCT Cumberland Transfer Center Intercept Surveys Stakeholder
The Cost Savings Potential of Sustainability Practices
 The Cost Savings Potential of Sustainability Practices The Sustainability Triple Bottom Line The Triple Bottom Line (TBL) means addressing Environmental, Economic and Social Equity dimensions of a project
NATMEC June 30, 2014 Anita Vandervalk, PE, PMP
 NATMEC June 30, 2014 Anita Vandervalk, PE, PMP Agenda 1. Florida s MPM Program 2. Research Efforts and Progress 3. Source Book 4. Transitioning to Real Time Data 5. Next Steps Importance of Mobility Providing
NEW YORK TRANSPORTATION FACTS ECONOMIC IMPACTS
 The 2015 U.S. Transportation Construction Industry Profile: New York page 1 NEW YORK TRANSPORTATION FACTS ECONOMIC IMPACTS The design, construction and maintenance of transportation infrastructure in New
Chapter 3 - Goals, Objectives, & Strategies
 Chapter 3 - This chapter presents goals, objectives, and strategies that have been developed as part of the Richmond Area MPO 2026 Long-Range Transportation Plan (LRTP) update. Strategies have been developed
CHAPTER 4 FUTURE TRENDS
 CHAPTER 4 FUTURE TRENDS 4.1 LAND USE SCENARIO PLANNING Scenario planning represents the next generation of analytical processes created to evaluate the influence of development intensities and land use
TRANSPORTATION 101 Today and Tomorrow. Moving People and Goods
 TRANSPORTATION 101 Today and Tomorrow Moving People and Goods What is the Transportation Commission? An independent, seven-member body of citizens appointed by the Governor for six-year terms and representing
Highway and Freight Current Investment Direction and Plan. TAB September 20, 2017
 Highway and Freight Current Investment Direction and Plan TAB September 20, 2017 Today s Topics Where are we now, what are the current issues? Where do we want to go? How will we get there? What are the
INCIDENT MANAGEMENT TRANSPORTATION SYSTEMS MANAGEMENT & OPERATIONS (TSM&O) FLORIDA DEPARTMENT OF TRANSPORTATION DISTRICT SIX
 FLORIDA DEPARTMENT OF TRANSPORTATION DISTRICT SIX") INCIDENT ROAD RANGERS RISC IRV Road Rangers Service Patrols provide motorist assistance and incident management services in Miami-Dade County 24 hours per day, 7 days per week. The fleet assists stranded
INCIDENT ROAD RANGERS RISC IRV Road Rangers Service Patrols provide motorist assistance and incident management services in Miami-Dade County 24 hours per day, 7 days per week. The fleet assists stranded
Addendum 1: Performance Measures
 Addendum 1: 2 Addendum Livability 2040 Regional Transportation Plan Table of Contents 1.0 Introduction... 3 Federal Requirements... 3 MPO Measure Targets... 4 2.0 Safety Measure Targets... 9 3.0 Transit
Introduction. Performance Measurement. Pg. 01
 Pg. 01 Introduction The Alamo Area recognizes the importance of transportation performance tracking, goal setting and measurement to provide greater accountability and transparency and to achieve a more
EXAMPLES OF COMPREHENSIVE PLAN POLICIES HOW TO ESTIMATE THE BENEFITS OF THE CTR PROGRAM
 TABLE OF CONTENTS INTRODUCTION... I BACKGROUND OF THE COMMUTE TRIP REDUCTION EFFICIENCY ACT... II MAKING THE CONNECTION BETWEEN COMMUTE TRIP REDUCTION AND THE GROWTH MANAGEMENT ACT... IV CTR PLANNING AND
The Many Dimensions Of America s Congestion Problem And A Solution Framework
 The Many Dimensions Of America s Congestion Problem And A Solution Framework Testimony of Tim Lomax Research Engineer, Texas Transportation Institute Researcher, University Transportation Center for Mobility
CITY OF JACKSONVILLE 2030 MOBILITY PLAN STUDY UPDATE GOALS, OBJECTIVES, AND PERFORMANCE MEASURES PREPARED FOR: CITY OF JACKSONVILLE
 CITY OF JACKSONVILLE 2030 MOBILITY PLAN STUDY UPDATE GOALS, OBJECTIVES, AND PERFORMANCE MEASURES 3.20.2017 PREPARED FOR: CITY OF JACKSONVILLE 55 Railroad Row White River Junction, VT 05001 802.295.4999
Public Input from Regional Visioning Forums
 Public Input from Regional Visioning Forums Innovation and Economic Development Provide transportation systems to continue to position Florida as a global hub for trade, logistics, and exports-oriented
Policy Research CENTER
 TRANSPORTATION Policy Research CENTER Methodologies Used to Estimate and Forecast Vehicle Miles Traveled (VMT) What Is Vehicle Miles Traveled? Vehicle miles traveled (VMT) is a measure used extensively
GOALS AND PERFORMANCE MEASURES
 PLANNING FRAMEWORK The planning framework guides the development of the Regional Transportation Plan, articulating what the region is trying to achieve. This chapter establishes a foundation to focus data-gathering
Livability 2050 Regional Transportation Plan Update. Transportation Policy Board (TPB) August 23, 2018
 August 23, 2018") Livability 2050 Regional Transportation Plan Update Transportation Policy Board (TPB) August 23, 2018 1 Oct. 2017 Plan Kick-Off Sept. 2019 Plan Adoption Timeline Livability 2050 Regional Transportation
Livability 2050 Regional Transportation Plan Update Transportation Policy Board (TPB) August 23, 2018 1 Oct. 2017 Plan Kick-Off Sept. 2019 Plan Adoption Timeline Livability 2050 Regional Transportation