PINELLAS SUNCOAST TRANSIT AUTHORITY 2007 TRANSIT DEVELOPMENT PLAN
|
|
|
- Beatrix Grant
- 6 years ago
- Views:
Transcription
1 PINELLAS SUNCOAST TRANSIT AUTHORITY 2007 TRANSIT DEVELOPMENT PLAN Final Report PREPARED FOR: PINELLAS SUNCOAST TRANSIT AUTHORITY 3201 SCHERER DRIVE ST. PETERSBURG, FLORIDA ph (727) , fax (727) JUNE 2007 TINDALE-OLIVER & ASSOCIATES, INC N. ASHLEY DRIVE, SUITE 100 TAMPA, FLORIDA ph (813) , fax (813)
2
3 TABLE OF CONTENTS SECTION 1: GENERAL INFORMATION Introduction New TDP Requirements Identification of the Submitting Entity SECTION 2: TRANSIT POLICY CONTEXT Local Policies County Comprehensive Plan Concurrency Management Long Range Transportation Plan (LRTP) Transportation Improvement Program (TIP) Transportation Disadvantaged Service Plan (TDSP) Five Year Transit Development Plan (TDP), Transit Development Plans, Annual Updates HART Transit Development Plan (TDP) Pasco County Transit Development Plan Manatee County Transit Development Plan Pinellas Mobility Initiative (PMI) Bluff to Beach Guideway Study and Action Plan SR 688/I-275 Transit Corridor Study Ulmerton Road Bus Preferential Treatment Study Central Avenue Corridor for Bus Rapid Transit Planning Study Central Avenue Bus Rapid Transit Extended Corridor Analysis nd Avenue North Corridor Study McMullen-Booth Corridor Strategy Plan McMullen-Booth Road Bus Preferential Treatment Study Pinellas County MPO, Countywide BRT Study Development Coordination Program Pinellas by Design Regional Transit Coordination West Central Florida 2025 Long Range Transportation Plan Regional Transit Action Plan Local Government Plans State of Florida Polices Florida Transportation Plan Florida TDP Requirements New TDP Requirements Transit Quality of Service Evaluation State Growth Management Legislation (Senate Bill 360) Florida Department of Transportation Transit Funding Programs Tindale-Oliver & Associates June 2007 i 2007 TDP
4 Florida Department of Transportation Work Program Federal Polices SAFETEA-LU Clean Air Act of Empowerment Zone and Enterprise Community Program Federal Transit Administration Transit Safety Program Other Policies Affecting Transit Summary and Implications Summary Implications SECTION 3: PERTINENT CONDITIONS Service Area Description Demographics and Land Use Population Population Characteristics Land Use Patterns and Major Trip Generators Developments of Regional Impact Commuting Patterns Existing Transit Services System Operating Characteristics Existing and Potential Park-and-Ride Facilities Other Transit Services Transportation Disadvantaged Population Estimates Existing Roadway Network Roadway Level of Service Planned Improvements Program of Projects FY 2006/ Transportation Improvement Program Summary of Pertinent Conditions Population Economy Cost of Housing Mobility Characteristics SECTION 4: EXISITING SERVICE LEVELS Introduction Fixed-Route Service Levels Ridership Productivity Service Frequency Fares Demand Response Transportation Tindale-Oliver & Associates June 2007 ii 2007 TDP
5 SECTION 5: MILESTONES Introduction Milestone Achievements Fixed-Route Service Fiscal Year 2006/07 Service Development Projects Prior Year Service Development Projects Passenger Amenities New Operations and Administration Facility Fleet Upgrades Demand Response Service Improvements Paratransit Feeder Connections In-Person Assessments and Travel Training ADA Paratransit Service Criteria Public Involvement Efforts Planning Studies Central Avenue BRT Study Countywide BRT Study Ulmerton Road BRT Corridor Development Coordination Tarpon Wal-Mart Transit Center Pridgen/Gateway/Sod Farm New Transit Center at U.S. 19 and Roosevelt Boulevard Park Street Kohl s Store Marketing Awards SECTION 6: NEEDS ASSESSMENT Consistency with New TDP Rules Introduction to TAC Workshop Service Enhancement Priorities Workshop Outline of NGT Process Methodology Results of the Meeting Analysis of TAC Priorities Summary of Workshop Strategic Planning Board Workshops Introduction Analysis of Board Comments, Ideas, & Priorities Summary of Workshop Market Research Study 2006/ On-Board Survey Household Travel Survey Results Major Employer Interviews Tindale-Oliver & Associates June 2007 iii 2007 TDP
6 SECTION 7: BUDGET ESTIMATES Introduction Vision Plan Recommendations for Enhanced Local and Premium Transit Service Recommendations for Enhanced Evening Bus Service Recommendations for Weekend Service Improvements Recommendations for New Service Corridors Recommendations for Inter-county Connections with Pasco and Manatee Terminal/Transit Points Shuttle Service SECTION 8: MAJOR CONCLUSIONS AND FIVE-YEAR TRANSIT DEVELOPMENT PLAN Introduction Major Conclusions Service Delivery Enhancements Monitoring Program Market Research and Project Implementation Tindale-Oliver & Associates June 2007 iv 2007 TDP
7 LIST OF TABLES Table 2-1: Vision, Mission, and Strategic Goals (FY 2006/07) Table 3-1: Means of Transportation to Work Table 3-2: Employment by Category Table 3-3: Major Private and Public Employers in Pinellas County Table 3-4: DRIs in Pinellas County Table 3-5: County of Work for Workers Residing in Pinellas County, Table 3-6: Commuting from Neighboring Counties to Pinellas County, Table 3-7: Selected Fixed-Route Operating Statistics (FY 2005/2006) Table 3-8: Park-and-Ride Facilities in Pinellas County Table 3-9: Potential Park-and-Ride Sites Table 3-10: Inventory of TD Transit Service Providers Table 3-11: Inventory of Other Transit Services in Pinellas County Table 3-12: Program of Projects (FY 2006/07) Table 4-1: s Adopted FY 2006/07 Operating Budget Table 4-2: Total Fixed Route Ridership Table 4-3: Ridership Analysis FY 2005/ Table 4-4: Ridership Analysis FY 2006/ Table 4-5: Service Profile for Fixed Route Table 4-6: Commuter Routes Table 4-7: Express Routes Table 4-8: Extended Night & Trolley Service Table 4-9: Existing Fixed-Route Service Levels (FY2006/2007) Table 4-10: Growth in Demand Response Trip Volume Table 4-11: FY 2006/07 Demand Response Ridership Analysis Table 4-12: Operating Costs/Cost per Passenger Trip by Fiscal Year Table 4-13: Total Ridership FY 1993/ / Table 5-1: Operating and Financial Characteristics Fixed-Route System FY 1999/00 FY 2005/ Table 5-2: Bikes on-buses Ridership Table 5-3: Fleet Upgrades (3-Year Summary) Table 5-4: Marketing Awards Table 6-1: New TDP Rule Pertaining to Public Involvement Process Table 6-2: Previous TAC Workshop Priorities Table 6-3: TAC Workshop Results Table 6-4: The Average Bus Rider (2007) Table 7-1: Total Transit System Cost Estimate Capital & Operating Budget Summary Table 7-2: Total Transit System Revenue Estimate Operating Budget Summary Table 7-3: Minimum Fixed-Route Transit Service Enhancement Alternative Table 8-1: Candidate Urban Corridor Projects Annual Operating Costs Table 8-2: Candidate Service Development Projects in Three-Year Operating Costs Tindale-Oliver & Associates June 2007 v 2007 TDP
8 Table 8-3: Candidate Intermodel Project Table 8-4: Candidate Trip Project (Regional) Table 8-5: Candidate Very Small Start (Section 5309) Project LIST OF MAPS Map 3-1: Municipalities and Unincorporated Areas of Pinellas County Map 3-2: Absolute Population Changes ( ) Map 3-3: Population Density by TAZ (2005 and 2015) Map 3-4: Absolute Employment Growth by TAZ ( ) Map 3-5: Employment Density by TAZ (2005 and 2015) Map 3-6: Major Private and Public Employers Map 3-7: Total Hotel and Motel Units by TAZ (2005 and 2015) Map 3-8: Absolute Dwelling Unit Growth by TAZ (2005 and 2015) Map 3-9: Dwelling Unit Density by TAZ (2005 and 2015) Map 3-10: Major Trip Generators and Attractors Map 3-11: Pinellas County DRI Coverage Map 3-12: Route System Map 3-13: Existing and Potential Park-and-Ride Facilities Map 3-14: State 5 Year Work Program (FY ) Map 3-15: Pinellas County Work Program (FY ) Map 3-16: Municipal Road Improvement Program (FY ) Map 4-1: Enhanced Fixed-Route System Map 4-2: ¼ Mile Service Area Characteristics Map 4-3: ¾ Mile Service Area Characteristics Map 5-1: Routes with 20 Minutes or Better Headways Map 5-2: Segments of Rural Cross-Sections Map 7-1: Top 5 Routes by Ridership LIST OF FIGURES Figure 3-1: Median Age Figure 3-2: Pinellas County Tourist Trends Figure 3-3: Pinellas County Average Tourist Trip Budget Figure 3-4: Peak-Hour Vehicle Miles of Travel (VMT) Figure 3-5: Vehicle Miles of Capacity (VMC) Figure 3-6: % Roadways Above Capacity Figure 3-7: Network Center-Line Miles Figure 3-8: Housing Costs and Household Income Figure 4-1: Operating Budget by Revenue Source Figure 4-2: Total Fixed-Route Ridership Figure 4-3: Growth in Demand Response Trip Volume Tindale-Oliver & Associates June 2007 vi 2007 TDP
9 Figure 4-4: Ridership FY 1993/ / Figure 5-1: Cantilevered Shelters Figure 5-2: Bus Stop Lighting Figure 5-3A: Curb Retrofits Figure 5-3B: Curb Retrofits Figure 5-4: Bikes on Buses Figure 5-5: Bikes on Buses Ridership Figure 6-1: Sample Response Sheet Illustrating Rank-Order Voting Process Figure 6-2: Agenda for Board of Directors Workshop Tindale-Oliver & Associates June 2007 vii 2007 TDP
10 Tindale-Oliver & Associates June 2007 viii 2007 TDP
11 Section 1 GENERAL INFORMATION INTRODUCTION The state of Florida Public Transit Block Program was enacted by the Florida Legislature to provide a stable source of funding for public transit. The Block Grant Program requires public transit service providers to develop and adopt a Five-Year Transit Development Plan (TDP). The TDP must be submitted to the Florida Department of Transportation (FDOT) District Office on or before July 1 st of each year. Major updates are due every three years, while minor updates are required in the interim years. The TDP is the guiding document for the Pinellas County Metropolitan Planning Organization (MPO) Transportation Improvement Program (TIP), as well as the FDOT Five-Year Work Program concerning public transportation in Pinellas County. Assuring that the TDP is completed and submitted by July 1 st is the responsibility of the Pinellas Suncoast Transit Authority (), in coordination with the MPO. The TDP must be consistent with the approved local government comprehensive plans and the MPO Long Range Transportation Plan. The TDP includes reports on transit policies, demographics relating to the need for transit services, proposed transit-related service improvements, costs (operating and capital), funding sources, and an implementation plan. Also included is a summary of ridership trends by fare category over the past several years. This plan meets the requirement for a major TDP update in accordance with Rule Chapter 14-73, Florida Administrative Code (FAC). New TDP Requirements A notice of proposed rulemaking for TDP requirements (major and minor updates) was published in the Florida Administrative Weekly (Volume 31, Number 52, December 30, 2005). Proposed major changes to the rule include the following: Extends the planning horizon from five years to ten years. Requires major updates every five years rather than every three years. Requires a public involvement plan to be developed and approved by FDOT or consistent with the approved MPO public involvement plan. Requires that FDOT, the regional workforce board, and the MPO be advised of all public meetings where the TDP is presented and discussed and that these entities be given the opportunity to review and comment on the TDP during the development of the mission, goals, objectives, alternatives, and ten-year implementation program. Tindale-Oliver & Associates 1-1 June TDP
12 Requires the estimation of the community s demand for transit service (10-year annual projections) using the planning tools provided by FDOT or a demand estimation technique approved by FDOT. Annual updates shall be in the form of a progress report on the ten-year implementation program and shall include: o Past year s accomplishments compared to the original implementation program. o Analysis of discrepancies between the plan and its implementation for the past year. o Any revisions to the implementation program of the coming year. o Revised implementation program for the tenth year. o Added recommendations for the new tenth year of the updated plan. o Revised financial plan. o Revised list of projects or services needed to meet the goals and objectives, including projects for which funding has not been identified. Allows for TDPs to be submitted to FDOT at any time but requires that they be submitted by September 1. The intent of the new requirements is to provide better planned and, thus, improved public transit services, and to provide the State with improved estimates of transit needs over a longer period of time. Table 1-1 presents a checklist of TDP requirements based on the proposed new TDP rule. That table provides a useful tool for ensuring that future updates of the TDP comply with the new rule. Identification of the Submitting Entity Agency: Pinellas Suncoast Transit Authority Telephone Number: (727) Mailing Address: 3201 Scherer Drive, St. Petersburg, Florida, Authorizing Agency Representative: Roger Sweeney, Executive Director For further information about this plan, please contact Mr. William Steele, Director of Planning, 3201 Scherer Drive St. Petersburg, Florida Phone (727) Fax (727) Tindale-Oliver & Associates 1-2 June TDP
13 Section 2 TRANSIT POLICY CONTEXT A major component of the TDP Update is the review and assessment of transit policies, along with their relationship to. This chapter reviews transit policies at the local, state, and federal levels of government. Various transportation planning and programming documents are summarized, with an emphasis on issues with implications for public transportation in Pinellas County. For text cited directly from documents reviewed, the most updated information may not be presented. LOCAL POLICIES County Comprehensive Plan Florida law requires every incorporated municipality and county to adopt a comprehensive plan that is consistent with the Growth Management Act of The Growth Management Act requires all comprehensive plans to be consistent with state and regional plans. For communities with a population over 50,000, all comprehensive plans must include a Transportation Element that summarizes the existing and future transportation conditions, how those conditions relate to what the community considers the ideal transportation situation, and how the community proposes to get there. The Pinellas County Comprehensive Plan is the primary policy document concerning land use, transportation, and other planning categories for the County. Pinellas County has identified six major findings in terms of public transportation and demand management as part of the December 2004 Comprehensive Plan update. (1) Future roadway congestion projected to occur on major corridors within the County calls for the need to evaluate long-range mobility options such as commuter rail and a guideway system. (2) The predominance of low-density, single-family development and highway commercial development in the County serves to encourage a dependency on personal automobile travel while hindering the delivery of traditional fixed-route mass transit services in these areas. (3) Expanding bus shelters throughout the County is important for encouraging people to utilize transit services. (4) A lack of adequate pedestrian facilities exists between bus stops and proximate buildings in Pinellas County. This includes an absence of pedestrian ways within parking areas leading to buildings and of connections from bus stop locations to proximate sidewalks. Tindale-Oliver & Associates June TDP
14 (5) A large portion of bus passengers are elderly and/or physically impaired. It is especially difficult for these individuals to travel from buses through parking areas to nearby buildings without adequate pedestrian facilities. (6) In Fiscal Year 1995/96, ridership reached 8.3 million compared to 7.5 million in FY 1992/93. This was s highest ridership total since A major factor contributing to this growth in ridership has been the increase in daily and 31-day bus passes (Go Cards) issued through Medicaid and the Pinellas County Transportation Disadvantaged Program. (Note: More recent ridership data are discussed in further detail on pages 11 and 13). The implications of the Comprehensive Plan are that Pinellas County must continue to move toward providing more effective public transportation services. It is evident that the land use patterns and demographics are not the ideal operating environment for public transportation. However, the commitment to providing excellent service area coverage, while improving the fixed-route service through infrastructure, enhanced service, and an aggressive marketing plan, demonstrates s understanding of the County s goals for public transportation. The following is the primary goal of the Comprehensive Plan s Transportation Element that is pertinent to public transportation. Goal 1: Provide for a safe, convenient, and energy efficient multimodal transportation system that serves to increase mobility, reduce the incidence of single occupant vehicles, protect roadway capacity, reduce the contribution to air pollution from motorized vehicles, and improve the quality of life for the citizens of Pinellas County. The objectives and policies of the Comprehensive Plan that address public transportation are identified below. Objective 1.2: Pinellas County, in cooperation with Pinellas Suncoast Transit Authority (), shall strive to provide transit access for all major traffic generators and attractors with headways less than or equal to 30 minute headways in the peak hour and no greater than 60 minutes in the off-peak period. Policy 1.2.1: Pinellas County shall implement strategies to increase the efficiency of fixed-route services by encouraging mass transit use through the application of the Concurrency Management System, the Site Plan Review Process, and the implementation of corridor strategy plans. Objective 1.8: Pinellas County shall increase the efficiency and effectiveness of mass transit service as well as opportunities for multi-passenger vehicle travel that Tindale-Oliver & Associates 2-2 June TDP
15 accommodates the transportation needs of the service area population and the transportation disadvantaged while reducing single-occupant vehicle demand. Regarding mass transit, this objective shall be furthered through the amendment of the Comprehensive Plan in 2000 to incorporate and implement recommendations of the MPO-sponsored Pinellas Mobility Major Investment Study (MIS). (Note: This effort has continued through the Pinellas Mobility Initiative [PMI].) Policy 1.8.1: Pinellas County shall participate in the MPO-sponsored Pinellas Mobility Major Investment Study, which will analyze and evaluate land use conditions and policies, land development regulations, and funding issues associated with longterm mobility solutions in Pinellas County. Policy 1.8.2: Pinellas County shall participate in MPO-sponsored corridor strategy plans, compiling and analyzing information on existing land uses, future land use plans, existing traffic patterns, and bus stop and sidewalk locations to determine where opportunities exist to implement strategies to encourage mass transit ridership as well as other alternative modes of travel. Policy 1.8.3: Pinellas County shall provide bus stop improvements along major roadways through the application of the Concurrency Management System. Policy 1.8.4: Pinellas County shall support ride-sharing, vanpooling, and the efforts of the County s Transportation Management Initiatives (TMIs) through the application of the Concurrency Management System, which allows employers to participate in such efforts as transportation management plan strategies. Policy 1.8.5: Within one year following the adoption of the Transportation Element, Pinellas County shall develop strategies to increase participation among employees in its ridesharing program. These strategies shall be supported through a subsequent amendment to the policies of the Transportation Element. In the interim period, prior to amending the policies of the Element, Pinellas County shall continue to coordinate carpooling among participating employees. Policy 1.8.6: Within one year following the adoption of the Transportation Element, Pinellas County shall determine the feasibility and implications of amending the Land Development Code to facilitate the participation of employers in ridesharing or vanpooling programs provided through Bay Area Commuter Services (BACS) through the site plan review process. Policy 1.8.7: Within one year following the adoption of the Transportation Element, Pinellas County shall identify unmet transportation disadvantaged needs within Tindale-Oliver & Associates 2-3 June TDP
16 unincorporated Pinellas County. Residents in need of transportation assistance shall be informed of services available through the Pinellas County Transportation Disadvantaged Bus Pass Program provided through. Policy 1.8.8: Within one year following the adoption of the Transportation Element, in cooperation with the MPO, Pinellas County shall develop an inventory of transportation disadvantaged persons that would be affected by an evacuation order in the event of a natural disaster. Those needing to evacuate to a public shelter that have no personal means available to transport them, shall be provided the opportunity to register with Pinellas County for Special Needs assistance in order to receive transportation assistance. Policy 1.8.9: Within one year following the adoption of the Transportation Element, Pinellas County shall amend the Land Development Code to require and/or encourage developments to provide separated/buffered pedestrian ways (e.g., sidewalks, crosswalks) connecting bus stops to proximate buildings. Initial efforts shall focus on sites that are frequent destinations of bus passengers. Policy : Within one year following the adoption of the Transportation Element, Pinellas County shall coordinate with to identify locations where the need for pedestrian accommodations between bus stops and proximate buildings frequented by users is most pronounced from a safety standpoint. Subsequent to this effort, Pinellas County shall develop incentives for existing development to provide separated/buffered pedestrian ways (e.g., sidewalks, crosswalks) to accommodate pedestrian movements within parking areas between bus stops and proximate buildings. Initial efforts shall focus on the locations identified by Pinellas County and. The goals, objectives, and policies outlined in the Pinellas County Comprehensive Plan are evaluated through the Evaluation and Appraisal Report (EAR) process, which last took place in The County is currently in the midst of another EAR process, which is scheduled for adoption in April 2007, at which time the County s transit-related objectives and policies identified above will be reevaluated. Concurrency Management In addition to the comprehensive planning requirements, a sub-section of the Growth Management Act requires the County to administer a concurrency management system, as prescribed in Chapter 9J-5 of the Florida Administrative Code. Concurrency simply means that development cannot proceed without the appropriate infrastructure being in place to support the development. If a development is shown to degrade infrastructure below the adopted level of service standard, the development must provide mitigation or not be approved. Public Tindale-Oliver & Associates 2-4 June TDP
17 transportation is an activity that is monitored by concurrency. The standard for transit concurrency, as included in the Pinellas County Land Use Development Code, is provided below: Mass transit. The County, in cooperation with, shall ensure transit access to all major traffic generators and attractors with at least 30-minute headway in the peak hours and no greater than 60-minute headway in the off-peak hours. (Major generators and attractors are defined as businesses with 500 or more employees or regional shopping centers.) Developers can mitigate their concurrency impacts by agreeing to a Transportation Management Plan (TMP). TMPs are negotiated between the developer and Pinellas County and are often used by the County to require or encourage transit infrastructure and employersponsored transit programs Long Range Transportation Plan (LRTP) The Pinellas County LRTP is the fundamental planning document for transportation in Pinellas County. While the Comprehensive Plan provides a vision of where the County wants to go, the LRTP provides the year-by-year needs to reach the transportation-related goals. Although these goals are determined at the local level, they must be consistent with federal- and statelevel requirements to maintain funding. The LRTP focuses on all transportation needs; therefore, the plan has two specific objectives dedicated to public transportation. To accomplish these objectives, 13 policies are provided relating to public transportation. These policies address governmental coordination, transit friendly design, intermodal development, and transportation disadvantaged services. Public transportation is also an area of concern in other objectives dealing with transportation system efficiency, level of service monitoring, intergovernmental coordination, and public involvement. The objectives and policies that address public transportation are identified below. Objective 1.4: Mass Transit use shall be encouraged and promoted in order to increase ridership while reducing the number of single-occupant vehicles on the County s roadways and as a primary means of travel for the transportation disadvantaged population. Policy 1.4.1: Policy 1.4.2: The MPO shall assist and support the efforts of to implement and achieve the goals of its Five-Year Transit Development Plan and Ten-Year Mid-Range Transit Plan and to carry out recommended actions derived from related studies. The MPO shall encourage local governments to include transit-friendly design standards in local land development codes that ensure safe passage for transit users from bus stops to proximate buildings. Tindale-Oliver & Associates 2-5 June TDP
18 Policy 1.4.3: Policy 1.4.4: Policy 1.4.5: Policy 1.4.6: Policy 1.4.7: Policy 1.4.8: Policy 1.4.9: The MPO shall encourage FDOT and local governments to include pull-out bays at transit stops on major roadways in the design of road improvement projects and on re-surfacing projects, where feasible, to provide a safe boarding area for transit riders while limiting the impedance of oncoming vehicular traffic. The MPO shall promote s Bikes on Buses Program through the provision of informational materials and shall encourage the establishment of similar programs in other counties in the region. The MPO shall continue to ensure that the economically disadvantaged and physically impaired citizens of Pinellas County have access to cost-effective and efficient transportation services. The MPO shall carry out this policy under its responsibilities as the Designated Official Planning Agency (DOPA) and Community Transportation Coordinator (CTC) in accordance with Chapter 427, F.S., Rule 41-2, F.A.C., and in accordance with the goals, objectives, and strategies set forth in the Three-Year Transportation Disadvantaged Program Service Plan. In its role as the Pinellas County CTC, the MPO shall continue to promote the use of 31-day unlimited ride bus passes (i.e., Go Cards) to Transportation Disadvantaged Program customers as a cost-saving initiative and as a means to increase their independence. The MPO shall work with local governments, communities, and to identify and assess transit needs in the County. The MPO shall work with, other transit agencies, and local governments to identify and assess regional transit needs. The MPO shall continue to provide a forum for discussion of countywide transit governance issues and will work with the County s legislative delegation, and the Board of County Commissioners to implement transit governance policies. Objective 1.5: Develop a long range inter-county and regionally accessible transit system in Pinellas County that features advanced technology express service to intermodal transportation facilities, major employment centers, recreational points of interest, tourist destinations, and significant commercial activity. Policy 1.5.1: The MPO shall continue to prioritize funding to support the planning and implementation activities associated with the Pinellas Mobility Initiative, which Tindale-Oliver & Associates 2-6 June TDP
19 includes fixed guideway transit, expanded trolley service, bus rapid transit strategies, and other transportation improvements. Policy 1.5.2: The MPO shall include private sector participation in the planning and implementation of strategies associated with the Pinellas Mobility Initiative. Policy 1.5.3: The Pinellas Mobility Initiative shall be utilized to identify and implement long term solutions to the mobility needs of Pinellas County. Policy 1.5.4: The MPO shall work with local governments to ensure that mobility strategies and local land use plans are compatible and mutually supportive. The LRTP reflects strategies to enhance fixed-route bus services along designated corridors, consistent with the Five-Year TDP and the Mid-Range Transit Plan. The following transit needs are identified in the 2025 LRTP: Consolidate fixed routes to facilitate passenger trips that currently require a transfer; Partner with local governments on redevelopment projects to facilitate increased transit use; Take advantage of programs to mitigate congested roadways through utilization of mass transit incentives and improvements; Improve terminal and transfer facilities allowing for more convenient transit service and to accommodate more bus traffic; Continue to address inter-county commuting between Pinellas and Hillsborough counties; Take advantage of Intelligent Transportation System (ITS) technologies; Continue to increase accessibility to fixed routes for Transportation Disadvantaged (TD) Program customers and/or for people affected by the Americans with Disabilities Act (ADA); Enhance passenger amenities on a system-wide basis; Acquire additional space for administrative and maintenance facilities. Transportation Improvement Program (TIP) The TIP prioritizes and programs funding for specific transportation projects to be implemented over the next five years. The TIP is a financially constrained plan, which means that projects listed in the plan must be funded. The most recently adopted TIP is for fiscal years 2006/07 through 2010/11. The TIP is updated annually and categorized into sections based on jurisdiction. The section addressing public transportation needs includes s input regarding s five-year capital and operating projects. Public transportation projects planned for the next five years are summarized below. Tindale-Oliver & Associates 2-7 June TDP
20 Major Transit Capital Projects FY 2006/ /11 Although the majority of capital projects are presented in FY 2006/2007, portions of these projects may have been funded in prior years as well. Although some of these projects may have began construction in prior year, funding for projects may be earmarked for completion in FY 2006/07. Fiscal Year 2006/07 28 expansion buses 10 replacement buses Planning studies (TDP and Market Research Study) 7 support vehicles 20 automatic passenger counters 85 shelters 50 solar lights 100 trash receptacles Bus stop sign upgrades BRT planning studies Terminal renovation Park-and-ride lot development 25 bike racks Passenger landing pads Fiscal Year 2007/08 Annual purchase of capital equipment, including buses, trolleys, supervisory vehicles, support vehicles, bus parts, lease bus tires, furniture and equipment, computer hardware and software, rehabilitate facilities, construct and install passenger amenities Park-and-ride lot development Airport intermodal terminal Fiscal Year 2008/09 Annual purchase of capital equipment, including buses, trolleys, supervisory vehicles, support vehicles, bus parts, lease bus tires, furniture and equipment, computer hardware and software, rehabilitate facilities, construct and install passenger amenities Park-and-ride lot development Airport intermodal terminal Fiscal Year 2009/10 Annual purchase of capital equipment, including buses, trolleys, supervisory vehicles, support vehicles, bus parts, lease bus tires, furniture and equipment, computer hardware and software, rehabilitate facilities, construct and install passenger amenities Tindale-Oliver & Associates 2-8 June TDP
21 Park-and-ride lot development Fiscal Year 2010/11 Annual purchase of capital equipment, including buses, trolleys, supervisory vehicles, support vehicles, bus parts, lease bus tires, furniture and equipment, computer hardware and software, rehabilitate facilities, construct and install passenger amenities Park and ride lot development Major Transit Operating Projects Fiscal Year 2006/07 Corridor Bus Service: Route 90 Service development (Central Plaza Terminal/St. Pete Beach) Commuter Route 93 Tri-County Transit Initiative (Oldsmar/Downtown Clearwater) Route 78 Service enhancement (Westfield Shopping Town/Downtown Clearwater) Routes 5, 7, and 15 Service enhancement (Downtown St. Petersburg/Tyrone Square Mall, Downtown St. Petersburg/Gulfport Casino) Route 19 Service enhancement (Tarpon Springs/St. Petersburg) Route 18 Service enhancement (Downtown St. Petersburg/Downtown Clearwater) Express Bus Service: Route 100X (Gandy Boulevard) Route 300X (Ulmerton Road/I-275) Fiscal Year 2007/08 Express Bus Service: Route 100X (Gandy Boulevard) Route 300X (Ulmerton Road/I-275) Fiscal Year 2008/09 Express Bus Service: Route 100X (Gandy Boulevard) Route 300X (Ulmerton Road/I-275) Fiscal Year 2009/10 Express Bus Service: Route 100X (Gandy Boulevard) Route 300X (Ulmerton Road/I-275) Fiscal Year 2010/11 Express Bus Service: Route 100X (Gandy Boulevard) Route 300X (Ulmerton Road/I-275) Tindale-Oliver & Associates 2-9 June TDP
22 In addition to these capital and operating items, routine operations and maintenance, vehicle upgrades, staff training, computer software and hardware, and marketing funds are included in the five-year programming period. Transportation Disadvantaged Service Plan (TDSP) Chapter 427, F.S., defines the transportation disadvantaged (TD) as persons who because of a physical or mental disability, income status, or age are unable to transport themselves or purchase transportation. These individuals are dependent upon others to obtain access to lifesustaining activities. The aim of the TD program is to broker countywide paratransit services to maximize coordination. The Pinellas County MPO is the Community Transportation Coordinator (CTC) and, therefore, is responsible for managing and operating the overall TD program administration. The MPO coordinates with a network of for-profit and non-profit organizations that provide TD services. independently provides complementary demand-response service to ADA-eligible clients in the service area. The Florida Commission for the Transportation Disadvantaged (FCTD) requires that each CTC submit a TDSP, or an annually updated tactical plan that includes the following components for the local TD program: Development Plan (service area, county profile/demographics, service analysis, goals/objectives/strategies, implementation plan); Service Plan (operations element); Quality Assurance (service standards, complaint and grievance procedures, evaluation processes); and Cost/Revenue Allocation and Rate Structure Justification. In accordance with Chapter 427, F.S., it is the responsibility of the Pinellas County CTC to provide cost-effective transportation services for the transportation disadvantaged and ensure that these services are provided in a coordinated and efficient manner. The Pinellas County CTC has identified four goals for the transportation disadvantaged program. These four goals are identified below. Goal 1: Ensure the delivery of transportation disadvantaged services that meet the needs of the transportation disadvantaged population of Pinellas County. Goal 2: Provide transportation disadvantaged services as efficiently and effectively as possible through the maximization of existing resources. Goal 3: Provide transportation services that are responsive to the demands of the transportation disadvantaged community, but that can also be adjusted as necessary to comply with changes to statewide rules/policies, local conditions, and/or available funding. Tindale-Oliver & Associates 2-10 June TDP
23 Goal 4: Provide sufficient mechanisms for client feedback and outreach and inform residents of available transportation disadvantaged services while promoting a positive identity for the Pinellas County TD program. The current TDSP was adopted in 2003 and addresses the 2004 to 2007 timeframe. Five-Year Transit Development Plan (TDP), Major Update The last major update of the Five-Year TDP was published in June 2004 and covered the time period from 2005 to This TDP offers the following summary and conclusions. Efforts to increase ridership have been very successful. Route extensions have proven to be effective in promoting ridership growth and facilitating intra-county travel, particularly to/from St. Petersburg and North County. Express bus service is proposed to increase service frequency and reduce travel time on the most productive bus routes serving major urban corridors. has utilized demand response service to facilitate connections to fixed routes when there are architectural barriers, which, in combination with a person s disability, impede or prevent fixed-route travel. The fixed-route system is increasingly productive, and ridership growth is most evident on major urban corridors. must improve service frequencies, and add later evening and weekend services to meet the needs of the increased workforce, shift workers, and service employees. s service ratings are positive overall, but riders would like to see improvements in later and more frequent services on existing routes, and new/improved service in St. Petersburg. Internet access has increased for transit riders, indicating that the website and internet promotions may have increasing effectiveness in reaching existing and potential riders. Efforts to improve the convenience of transit service for passengers and accommodate ridership growth through park-and-ride, transfer facility, and fleet improvements must continue. An updated fleet inventory is critical to position for service expansion. Commuter express service concepts make transit more attractive for longer distance travel and this type of service is proposed for Routes 18, 19, and 52. Route extensions are an option to facilitate travel and expand the transit network, along with schedule improvements for selected routes. Improved terminal and transfer facilities will continue to be a major emphasis area for. Additional capacity at transfer points and development of park-and-ride facilities is required to operate new and expanded bus routes. Improved service frequency is needed on the most productive routes. Tindale-Oliver & Associates 2-11 June TDP
24 Additional space is needed for administrative/maintenance facilities and certain transfer points must be expanded to accommodate more buses before significant service expansion can occur. Intelligent Transportation Systems (ITS) technologies must be utilized to reduce travel time and delay. An intermodal terminal facility at the St. Petersburg-Clearwater International Airport is proposed to provide seamless connections for public transit and airport passengers. Transit Development Plans, Annual Updates Florida regulations require that MPOs prepare major TDP updates every three years and annual updates in interim years. To comply with these regulations, following the 2005 major update, an annual TDP update was produced by in May 2005, covering the time period from 2006 to 2010, and again in May 2006, covering the time period from 2007 to These annual TDP updates include level of service documentation, milestones, needs assessment, system-wide budget estimates, unfunded transit and mobility needs, and major conclusions and a five-year TDP. From the most recent TDP updates, it is apparent that ridership has continued to increase over the last few years. In order to maintain this level of growth, five delivery service priorities were identified in both the 2005 and 2006 minor updates/five-year TDP, as summarized below. 1. Later Evening Service 2. Customer Service Improvements 3. Varied Marketing Techniques 4. Improved Transfer Issues 5. Increase/Improve Bus Stop Infrastructure The major conclusions from the 2006 annual TDP update are summarized below. Major Conclusions Ridership increased 2.42 percent in FY 2002/03, 2.25 percent in FY 2003/04, and 4.33 percent in FY 2004/05. Improved frequency on the most productive bus routes is very effective for promoting ridership growth. As employment growth continues in Pinellas County, must continue to enhance transit service frequency to facilitate ridership growth. Fleet and fare structure improvements have been well received by customers, as well as passenger amenities and the availability of schedule information. Factors of importance for riders and potential riders include sheltered bus stops, later service, and improved service frequency. Efforts to improve the convenience of transit service for passengers and accommodate ridership growth through park-and-ride, transfer facility, and fleet improvements must continue. An updated fleet inventory is critical to position for continued service expansion. Tindale-Oliver & Associates 2-12 June TDP
25 Accommodate ridership growth through park-and-ride and transfer facility improvements. Update and replace fleet inventory as necessary to accommodate service expansion. Route extensions that facilitate intra-county travel, particularly to/from St. Petersburg and North County, are effective for transit commuter trips. has utilized demand response service to facilitate connections to fixed routes when there are architectural barriers, which, in combination with a person s disability, impede or prevent fixed-route travel. Later evening service improvements implemented in FY 2004/05 are necessary for shift workers and service employees. Service Delivery Enhancements Schedule improvements are necessary to facilitate commuter trips, particularly for the midcounty employment center. Improved terminal and transfer facilities include additional capacity at transfer points and park-and-ride facility development will continue to be an area of emphasis for. Improved service frequency for the most productive routes must include expansion of the administrative/maintenance facility and transfer points, such as the replacement of the Park Street Terminal, to accommodate more buses. Intelligent Transportation Systems (ITS) technologies must be utilized to reduce transit travel time and delay in order to improve service quality and provide an incentive for people to use public transportation. ITS technologies to be utilized include Transit Signal Priority (TSP). An intermodal terminal facility in mid-county to provide seamless connections for public transit and airport passengers. Additional service improvements have been implemented since adoption of the 2006 TDP Minor Update. Those improvements are identified in Section 5 of this report. HART Transit Development Plan (TDP) The HART TDP for FY 2007 to FY 2016, referred to as Vision 2016, has been reviewed in the context of the TDP for. Vision 2016 is the Hillsborough Area Regional Transit Authority s (HART) response to the recent growth in residents and employment in Hillsborough County. A vision statement was developed as part of the HART Vision 2016: HART s vision is to make transit a relevant and viable travel option for all residents of Hillsborough County, with increased access to HART services as its central theme. As part of this vision, one element calls for transit services that are integrated to support convenient connections to Pinellas, Pasco, Polk, and Manatee counties. Tindale-Oliver & Associates 2-13 June TDP
26 The Vision 2016 Implementation Action Plan includes one action pertaining to regional coordination under the service delivery and ridership policy: Pursue opportunities for regional transit services and programs Continue to coordinate with adjacent counties, transit agencies, and FDOT to pursue opportunities for new regional services and programs, including new routes, improved service connections, advertising programs, and fare policies. Participate with other regional public transit agencies, human service transportation providers, and planning organizations to review strategies to coordinate services and develop new service programs. Two target funding programs will be the federal Jobs Access and Reverse Commute and New Freedom programs. Pasco County Transit Development Plan As part of Pasco County Public Transportation s (PCPT) TDP update for the 2006 to 2010 time period, the transit goals and objectives adopted in the 2005 TDP have been reviewed in the context of the TDP for. In addition, the goals and objectives for the next five years, addressing the 2006 to 2010 time period, are presented. Goal 3 addresses regional coordination between transit providers, including. The two objectives pertaining to this regional coordination are identified below. Goal 3: Pursue Coordination Activities with Other Jurisdictions and Transportation Providers. Objective 3.1: Ensure coordination and consistency with local, regional, and state plans for the future provision of public transit service in Pasco County. The strategy for accomplishing Objective 3.1 includes reviewing relevant local, regional, and state plans as they are prepared, and to provide comments as appropriate. A component of this strategy includes participating in regional transit meetings, which includes Hillsborough, Pinellas, and Hernando counties as participants. Objective 3.2: Identify areas for cooperative efforts with neighboring county transit systems, including Hillsborough Area Regional Transit Authority (HART), Pinellas Suncoast Transit Authority (), and Hernando County (THE Bus). A strategy for accomplishing Objective 3.2 from Pasco County s 2002 TDP included coordinating with with respect to the US 19 fixed-route bus service. The implementation of Route 19 was a direct result of ongoing coordination between and PCPT. Tindale-Oliver & Associates 2-14 June TDP
27 Manatee County Transit Development Plan The Manatee County 2005 TDP addresses a five-year transit plan for Manatee County Area Transit (MCAT) by focusing on short-term transit alternatives. Four alternatives were developed based on both MCAT s vision and the goals and objectives outlined in the previous TDP. The four short-term transit alternatives are identified below. Focus improvements on existing service; Expand service to unserved areas of the County; Combination of alternatives A and B; and Explore innovative options for public transportation services. Each of the alternatives described above will focus on a particular area related to MCAT s goals and objectives. One, or a combination of these alternatives, may be better suited to meet these goals rather than the use of all four alternatives. Those alternatives identified as best suited to meet a goal have been included in the five-year plan. All four transit alternatives have been identified as instrumental to the implementation of Goal 1 of the 2005 Manatee County TDP, which addresses regional coordination between transit systems, including both HART and. Goal 1: Develop an effective multimodal public transportation system that safely and efficiently moves people within Manatee County and connects with adjacent systems. Objective 1.1: Provide transit services that meet community demands and needs by modifying system routing as practical to reduce the need to transfer and to provide coordinated transit and paratransit connections to adjacent counties. Short-term transit alternatives A, B, and C are identified as the three transit alternatives best suited to achieve Objective 1.1, with the ultimate purpose of supporting Goal 1. Pinellas Mobility Initiative (PMI) In 1997, the Pinellas County MPO initiated the Pinellas County Mobility Major Investment Study (MIS) to identify transportation and policy solutions to manage problems related to future traffic congestion on a long-term basis. The MIS was completed in October 2002 and concluded with a recommendation to further evaluate the possibility of an elevated rail or monorail system. To continue the work of the MIS, the Pinellas County MPO, in conjunction with FDOT and the Federal Transit Administration (FTA), sponsored the Pinellas Mobility Initiative (PMI). The PMI is a two-year study that provides further detail needed to make decisions about alternative transit systems. The goal of the PMI is to evaluate alternative travel modes to the Tindale-Oliver & Associates 2-15 June TDP
28 single-occupant vehicle, which is the primary mode of transportation for citizens of Pinellas County. The PMI Steering Committee, followed by the MPO Board, approved a monorail system as the selected technology to use for the elevated transit system. Following the selection of the monorail, the locally preferred alternative (LPA) was narrowed to the selection of a 38-mile monorail system loop around Middle and South Pinellas County, including 28 stations, and supplemented by bus and trolley systems. The LPA has been revised since its approval to become a fully intermodal approach, including an integrated countywide system of premium transit services and facilities, consisting of monorail, enhanced express bus service, local bus service, trolley service, and Bus Rapid Transit. Once implemented, this new design will significantly influence the route structure of buses and trolleys, including changes in commuter and express bus routes and the possible change to a system that is fully integrated with the PMI. Bluff to Beach Guideway Study and Action Plan The Bluff to Beach Guideway Study is a feasibility study pertaining to the implementation of a guideway link between downtown Clearwater and Clearwater Beach undertaken by the City of Clearwater. The proposed guideway system would consist of an automated people-mover connector system similar to a monorail-type system, grade separated in order to avoid vehicular and pedestrian conflicts. The proposed guideway link would target the tourist and service industries rather than commuters by linking the downtown commercial district to the beach. This study recognizes a parking deficit along the beach and that building additional parking garages would spoil the beach surroundings. Downtown Clearwater is also an ideal location to build such parking facilities. In addition, beach residents and tourists vacationing on the beach for extended periods of time would have access to downtown via the guideway system, while day beach-goers can park at parking facilities in downtown Clearwater and then ride the guideway to the beach. Other than relieving parking congestion and serving as a mobility tool for beach residents and tourists, the guideway would also be an economic engine, supporting the redevelopment initiatives in the downtown and beach areas. Although riding the bus into downtown Clearwater and then transferring to the guideway would require a transfer for transit riders, implementing the guideway system would offer a way for transit riders to travel between downtown Clearwater and the beach in a quick and efficient manner. The project is currently in the PD&E stage. If put into operation, the guideway will serve as a demonstration project for implementing additional guideway systems in Pinellas County and serve as a starter system for the larger, countywide, Pinellas Mobility Initiative. The study is not clear on how this proposed service would integrate with existing bus service provided by on the same corridor or if will be the implementing agency for construction and operation of the guideway. However, the study does recommend either Tindale-Oliver & Associates 2-16 June TDP
29 beginning discussion with major redevelopment interests to gage their potential involvement in this project or working with to determine if would intend to become the implementing agency or grant a franchising agreement to an operator to complete and operate the project. SR 688/I-275 Transit Corridor Study The SR 688/I-275 Transit Corridor Development Study was conceived by several public agencies in the area, including, the Pinellas County MPO, and FDOT. The purpose of this study was to examine the feasibility of providing bus service for commuters between Pinellas and Hillsborough Counties along SR 688/I-275 (Howard Frankland Bridge), from Indian Rocks Road in Pinellas County to downtown Tampa. As a result of this effort, an express bus service operating along the SR 688/I-275 corridor from Starkey Road to downtown Tampa and serving limited stops in the peak A.M. and P.M. travel periods was recommended. As a result of this recommendation, Route 300X commuter service was implemented in August 2003 and serves as a connection for transit commuters between Pinellas and Hillsborough counties. Ulmerton Road Bus Preferential Treatment Study As discussed previously, the result of the SR 688/I-275 Transit Corridor Development Study led to the implementation of Route 300X, a commuter bus service connecting Pinellas and Hillsborough counties. This new express route, as well as existing local routes, all operate to some capacity along Ulmerton Road, and could potentially benefit from bus preferential treatments along the corridor. The Ulmerton Road Bus Preferential Treatment Study identifies five top priority intersections located along the Ulmerton Road corridor from Starkey Road to I-275 where bus queue jump treatments could potentially be implemented to facilitate bus service along the corridor as follows: Belcher Road 66 th Street US th Street 34 th Street It was found that all of the intersections selected experience a high amount of delay and very long vehicle queues during both morning and afternoon peak periods, and that the physical and geometrical barriers to transit signal priority in all of the selected intersections were limited, making implementation feasible. Recommendations were made for each individual intersection s transit signal priority implementation as well. Tindale-Oliver & Associates 2-17 June TDP
30 Central Avenue Corridor for Bus Rapid Transit Planning Study The 2004 St. Petersburg East-West Transit System Study identified BRT as the appropriate technology to apply along the Central Avenue transit corridor. Specifically, the Transit System Study addressed BRT between Bayfront Medical Center and the Central Plaza Transit Center. As a result, a planning study for Bus Rapid Transit along this portion of Central Avenue was initiated in February 2006 by. The planning study addresses several major components of the BRT service including: selection of the preferred vehicle type, station design and locations, preferred fare collection system, identification of real-time passenger information systems, development of a refined service plan, and development of capital and operating cost estimates. At this time, the BRT study is complete. It is anticipated that the next study phase for the corridor will begin in late Central Avenue Bus Rapid Transit (BRT) Extended Corridor Analysis As a result of the Central Avenue preliminary engineering study, a follow-up extended corridor analysis study was undertaken by to examine an extended corridor west of Central Plaza and recommend an extended corridor that could be tied to the BRT corridor east of Central Plaza. The study addressed five alternatives, and evaluated them based on 18 criteria, divided into three categories, namely: 1) Service impacts; 2) Transportation impacts; and 3) Land use, socioeconomic, and environmental impacts. The study concluded that the recommended alternative extension to the Central Avenue BRT is an extension to the Tyrone Square Mall and Madeira Beach, which is consistent with the Pinellas Mobility Initiative. A corresponding final system concept plan study for the preferred Central Avenue BRT corridor is now complete. An Alternatives Analysis Report is now underway and will be filed with FTA in late June nd Avenue North Corridor Study The Pinellas County MPO, through its ongoing Congestion Management System, identifies congested roadways, determines specific causes of congestion on roadways, develops and implements strategies for relieving that congestion, and monitors implemented strategies for Tindale-Oliver & Associates 2-18 June TDP
31 effectiveness. The MPO identified 22 nd Avenue North, from 68 th Street North to Dr. M.L. King Jr. Street as a congested facility, and subsequently initiated a study to develop a corridor strategy plan to mitigate this congestion. The study initially began by preparing a Baseline Conditions Report describing the existing conditions of the corridor and its surrounding area. Following this report, a Strategy Screening Document was initiated, detailing potential strategies to address concerns within the 22nd Avenue North corridor. These strategies were presented to the Stakeholders Committee and the public for comment. The feedback from the public participation process was essential to the selection of strategies for reducing congestion along the 22 nd Avenue North corridor. The final report for this study outlines proposed strategies to alleviate congestion and improve mobility within the study area. Since 22 nd Avenue North is a major roadway through St. Petersburg, relieving congestion will help buses travel more efficiently through this corridor. Ridership has declined on Routes 5 and 22, which operate in the study area, leaving little justification for service expansion at this time. However, a review of the County s Intelligent Transportation System program specifies a number of planned improvements that should have a positive impact on transit riders in the 22 nd Avenue North corridor, which are shown below. Automated vehicle location (AVL) On-board annunciators Video cameras Automatic passenger counters The installation of bicycle racks at park-and-ride lots is yet another suggestion for drawing transit riders to the 22 nd Avenue North area. McMullen-Booth Corridor Strategy Plan McMullen-Booth Road is a highly congested corridor that runs through Pinellas County. In an effort to identify, analyze, and evaluate the causes of congestion on this roadway, the McMullen-Booth Corridor Strategy Plan was completed. The study area for this project included a portion of the corridor from Tampa Road (SR 584) on the north to Gulf-to-Bay Boulevard (SR 60) to the south, and from Belcher Road (CR 501) to the west to Old Tampa Bay to the east. The results of this study consist of 37 strategies, the goals of which are to relieve congestion, enhance mobility, enhance bicyclist and pedestrian safety, and improve roadway operational conditions. Transit-related strategies to reduce congestion along the McMullen-Booth corridor include the following: Extension of Route 11 and commuter connector service across the Bayside Bridge. Expansion of Route 58 and initiation of Route 300X (which is now operating). Tindale-Oliver & Associates 2-19 June TDP
32 Consideration of Bus Rapid Transit, including signal and intersection accommodations (which led to the McMullen-Booth Bus Preferential Treatment Study and the related BRT fatal flaw study for this corridor). Expansion of Routes 19 and 62. By implementing combinations of the transit-related strategies with the other proposed strategies, it is hoped that existing and future congestion will be mitigated at some level, providing greater access and mobility to all traveling within the corridor. McMullen-Booth Road Bus Preferential Treatment Study The McMullen-Booth Road Bus Preferential Treatment Study identified five intersections along the corridor where potential bus preferential treatments could be implemented to facilitate bus service within this highly congested corridor. The goal of implementing bus preferential treatments along this corridor would be to reduce bus travel time, schedule variance, and delay at highly congested signals by implementing necessary roadway and signal modifications at key intersections. This study was undertaken as an extension of the McMullen-Booth Corridor Strategy Plan. One of the methods described in the Corridor Strategy Plan is to improve transit operations along the corridor. Currently, operates several routes along this segment of McMullen-Booth Road, all of which are likely to be affected by any bus preferential treatment strategies implemented along this corridor. The results of this study indicate that the development of bus preferential treatments along this corridor could help improve bus travel times and reliability, especially when added roadway and intersection capacity are provided, including improvements identified in the Corridor Strategy Plan. Pinellas County MPO, Countywide BRT Study The Pinellas Countywide Bus Rapid Transit Plan is an effort by the Pinellas County MPO to identify potential future Bus Rapid Transit corridors by evaluating major arterial roadways in Pinellas County. Roadways are evaluated with regard to potential travel demand, existing/future land use and densities, and planned transit improvements in order to identify the corridors with the greatest potential for BRT strategies in the near term. The result of the study will be the selection of two new corridors eligible to continue the BRT implementation process, which would include preliminary design and engineering, right-of-way acquisition, and eventual construction of possible running ways and stations. Development Coordination Program, in coordination with the Pinellas County MPO, Pinellas County Engineering Department, and FDOT, has developed a program to assist in roadway design to improve public transportation infrastructure. The major issues involve pedestrian access to bus stops, passenger loading pads, sidewalk construction, and curb cuts. participates by reviewing Tindale-Oliver & Associates 2-20 June TDP
33 and commenting on preliminary design plans. The goal of this program is to implement transit friendly design standards to better support the public transportation services operated by. This program was initiated by to assist in meeting the goals of Pinellas County as outlined in the Comprehensive Plan. By participating in this program, can improve and encourage transit infrastructure early in the development review process. Transit Service Monitoring and Coordination has established quantitative performance measures in several areas of operation. Standards in systems management, productivity, operating costs, maintenance, and safety have been implemented. Using the National Transit Database (NTD), is required to publish an annual report describing how the transit system has performed in the previous year. Data from this annual report are used in determining the State of Florida Block Grant Program funds. has a policy of reviewing routes for productivity and prioritizing service availability as appropriate. Pinellas by Design With the intent of assisting jurisdictions within Pinellas County, the Pinellas County Economic Development Office and the Pinellas Planning Council created Pinellas by Design: An Economic Development and Redevelopment Plan for the Pinellas Community. It was adopted by the Board of County Commissioners in November Included in the Regulatory Tools and Urban Design Goal are two strategies and four implementation actions that are associated with transit and. The strategies and implementations pertinent to are listed below. Strategy 3: Accommodate motor vehicle demands while encouraging multiple modes of travel. Action 3d: Allow reduced parking thresholds in appropriate locations where transit availability makes such reduction feasible. Strategy 5: Implement redevelopment regulations that support transit usage. Action 5a: Revise land development regulations to include transit-related development standards. Action 5b: Implement supportive regulations to provide increased ridership potential within ¼-mile of transit station locations. Action 5c: Employ model district regulations to guide transit-oriented/related development and redevelopment. In addition, the following strategies and implementation actions in the Pinellas County Jurisdictions and Agencies Coordination Goal pertain to. Tindale-Oliver & Associates 2-21 June TDP
34 Strategy 4: Coordinate countywide redevelopment planning with the MPO regarding transportation and land use relationships. Action 4a: Ensure that planning for redevelopment center, corridors, and districts is coordinated with the MPO Pinellas Mobility Initiative and other transit planning efforts. Strategy 5: Link countywide redevelopment efforts with Pinellas County tourism promotion to complement the economic development perspective. Action 5b: Ensure that transit planning is designed to complement the tourism industry by linking to the St. Petersburg/Clearwater Airport, the barrier island communities, and other areas that attract concentrations of visitors. Regional Transit Coordination There are a number of organizations within West Central Florida that are putting forth effort in trying to address regional transportation issues and intermodalism. In addition to the Florida Department of Transportation and the many metropolitan planning organizations and transit agencies within the region, there are other organizations striving for transportation goals that are more regional in scope, such as the Tampa Bay Regional Planning Council (TBRPC) and the Tampa Bay Partnership. In May 2003, many of these organizations participated in a Regional Transit Roundtable that was conducted to help coordinate efforts to improve transit and facilitate regional transit connectivity. More than two dozen individuals representing many of these organizations attended and actively participated in the program, which had a primary goal of ensuring (and improving) the competitiveness of the West Central Florida area in attracting Federal transit funding and intensifying regional cooperation on transportation issues. According to a representative of the Tampa Bay Partnership s Transportation Task Force, there is a general concern that the region is losing ground to the South Florida and Orlando regions with regard to regional transportation coordination. In addition to the need for regional vision and a unified voice for transit, another major topic that was discussed includes the identification of projects of regional importance and impact, as well as strategies to implement such projects. Among the strategies that were mentioned are receiving a fair share of federal funding, maintaining the eligibility of potential fixed-guideway projects in the region, and instigating and supporting a regional transportation study. Another important key to promoting regional transportation solutions is gaining the support of local area politicians and legislators and convincing them to help champion transit awareness efforts. Finally, it was stressed that new development (and redevelopment) must be more transit Tindale-Oliver & Associates 2-22 June TDP
35 supportive, and that better coordination is a necessity among the region s transit agencies, including dealing with issues like transfer policies and transferable fare media. On a statewide level, several pieces of transit-related legislation were enacted in 2003 with special interest to the Tampa Bay area, including the following. SB 676, Omnibus Transportation Bill, allows the Florida Department of Transportation to be exempt from all local regulations, including the regulations that implement local comprehensive plans. This bill also sanctions the creation of the Statewide Strategic Intermodal Transportation Advisory Council (SITAC), which is composed of representatives from major modes of transportation. In addition, this bill requires FDOT to develop the Florida Strategic Intermodal System (SIS) in cooperation with MPOs, regional planning councils, and local governments. SB 2070, Florida Public Transit Act, instructs FDOT to include intercity bus service as part of its work program. West Central Florida 2025 Long Range Transportation Plan As a result of the Regional Transit Roundtable, in an effort to coordinate the transportation of the Tampa Bay region, the MPOs of eight counties, including Hillsborough, Pinellas, Pasco, Polk, Citrus, Hernando, Manatee, and Sarasota, are coordinating plans under the Chairs Coordinating Committee (CCC). Resulting from this coordination was a series of reports, including the West Central Florida 2025 Long Range Transportation Plan (WCF LRTP). The WCF LRTP includes a list of viable inter-county travel markets, a regional needs assessment, system goals and objectives, and a cost affordable plan. Regional travel markets with densities to support transit included in the plan that are specific to Pinellas County include the cross-bay corridor along I-275 and Pinellas County to south Pasco County along US 19. The WCF LRTP provides three goals along with objectives and measures of effectiveness (MOEs) to meet those goals. Goals, objectives, and MOEs that are pertinent to include: Goal 1: Provide a safe and efficient multi-modal transportation system that serves the mobility needs of West Central Florida. Objective 1.2: Maintain and improve an integrated public transportation system that addresses regional mobility, and promotes regional connectivity and customer service. MOE 1.2.1: Number of direct and indirect county-to-county connections available. MOE 1.2.2: Percent of fixed-route (urban) area served by fixed-route transit. Tindale-Oliver & Associates 2-23 June TDP
36 Objective 1.3: Develop a coordinated common fare instrument to allow seamless transfers across transit systems in the region. MOE 1.3.1: Number of fare structures. Objective 1.6: Support an integrated regional transportation system with efficient connections between transportation modes. MOE 1.6.1: Number of intermodal transfers possible (park-and-ride, system transfers, bus-to-air, bus-to-train connections, etc.) Goal 2: Provide a transportation system that contributes to the economic vitality of West Central Florida. Objective 2.1: Improve access to regional activity centers. MOE 2.1.1: Percent of population within 20 minutes of activity centers by auto/transit. Objective 2.3: Develop a regional transportation system to support adopted land use plans, and encourage land use and planning decisions that promote an efficient regional transportation system. MOE 2.3.1: Percent of population within 20 minutes of activity center or intermodal facility. MOE 2.3.2: Percent of urban area served by fixed-route transit. Objective 2.5: Support the appropriate institutional mechanisms that implement and operate regional transportation facilities and services. MOE 2.5.1: Number of intermodal connections. Goal 3: Provide a regional transportation system that protects the environment and preserves quality of life. Objective 3.2: Minimize disruption to established communities and environmental justice areas. MOE 3.2.1: Percent of population served by fixed-route transit service. Tindale-Oliver & Associates 2-24 June TDP
37 In addition to the goals and objectives, a cost affordable plan was established as a part of the 2025 Regional LRTP. Planned regional projects that affect Pinellas County include: Central Avenue BRT Fourth Street BRT Gandy-Crosstown Super Express Bus Route Gulf-to-Bay Columbus Avenue BRT McMullen-Booth Little BRT PMI Feeder BRT Lines SR 580/Hillsborough Avenue BRT Ulmerton Road BRT US 19 BRT/Express Bus Route Pinellas Mobility Initiative Fixed Guideway High Speed Rail Guideway St. Petersburg-Clearwater International Airport Intermodal Hub Downtown St. Petersburg Intermodal Hub ITS/APTS for regional transit, seamless fare mechanisms, regional data sharing and control center, and transit friendly highway ITS component software Regional Transit Action Plan The Regional Transit Action Plan is a set of recommended steps that the region s transit agencies and MPOs can implement to help forward the goals and objectives of the WCF LRTP in order to help develop and operate the service. Specific recommendations in the Regional Transit Action Plan include: The West Central Florida CCC and FDOT should establish and recognize the Tampa Bay Commuter Transit Authority as the leader in implementing the WCF LRTP and the Action Plan. The Authority and other agencies and stakeholders should craft a vision and a mission statement that clearly articulates what regional transit is and how it differs from local transit. Goals and objectives can be developed from the mission statement. The Authority and local operators and agencies must quickly develop interlocal agreements on how existing routes will be operated and new routes will be planned and developed, as well as a long-term agreement on how the region will coordinate local and regional services. Tindale-Oliver & Associates 2-25 June TDP
38 In the short-term, the Authority should provide a portion of the funding needed to develop and operate regional routes. The Authority must develop a dedicated funding source for regional transit, most likely through a sales tax. The Authority should coordinate with local land planning agencies to develop transitoriented development plans and regulations and with FDOT and localities to demonstrate how road development projects can incorporate transit features. The Authority should take advantage of immediate opportunities for regional coordination that may exist. Florida House Bill 251, which was filed on January 12, 2007, provides for the creation of the Tampa Bay Area Regional Transportation Authority to finance, plan, construct, operate, and maintain certain transit facilities and multimodal transportation systems and facilities in Citrus, Hernando, Hillsborough, Manatee, Pasco, Pinellas, and Sarasota Counties. A no-vote action was taken in regard to this Bill. Florida Senate Bill 506, which was filed on January 9, 2007, also provides for the creation of the Tampa Bay Regional Transportation Authority. This bill was passed by both the Florida House and Senate during the Spring 2007 legislative session. The effective date for this Bill is July 1, Local Government Plans With less than six percent of the land area in Pinellas County currently vacant, development activity in Pinellas County is primarily concentrated on redeveloping existing land uses. Redevelopment activity within areas where higher densities exist provides opportunities for improvements to public transportation (e.g., bus stops and pedestrian facilities, on-site transit amenities, and route enhancements). The following municipalities were contacted to investigate where designated redevelopment is planned to occur. St. Petersburg The City of St. Petersburg has seven redevelopment areas. The redevelopment areas in the downtown are near Central Avenue, between the Airport and Bartlett Park, and the area surrounding Tropicana Field. One area is directly west of I-275, one is directly south of I-375, and the other two are directly south of the I-175/I-275 junction. Clearwater Clearwater is placing attention on redeveloping the downtown area, both residentially and commercially. The plan includes the traditional downtown core, four periphery areas, and the Tindale-Oliver & Associates 2-26 June TDP
39 new eastern gateway to Downtown. There are six Character Districts within the downtown planning area: the Downtown Core is the traditional city center; the Old Bay, South Gateway, and East Gateway are the urban residential neighborhoods and entranceways into Downtown; the Town Lake Residential Character District is a new residential area; and the Town Lake Business Park is an area with new corporate office development. One goal and two objectives of the plan pertain specifically to. Goal 2: Create an environment where both people and vehicles can circulate throughout Downtown safely and effectively. Objective 2G: Encourage improvements to, and the expansion of, Pinellas Suncoast Transit Authority () services and routes to include connections between Downtown and Clearwater Beach and from Downtown to other regional attractions in Pinellas County. Objective 2J: Encourage the future development of a joint use public/private parking garage and bus terminal located at either the current terminal location on the west side of Garden Avenue from Park Street to Pierce Street or at another Downtown location determined by the City and. In addition, redevelopment projects within downtown Clearwater include a new multimodal transportation center to be built after 2010, which may include a new transfer station, public parking, and a possible light rail station. Largo Downtown Largo is divided into two community redevelopment districts (CRDs), consisting of the Clearwater-Largo Road CRD and the West Bay Drive CRD. Largo s strategy is to provide incentives for businesses and citizens moving into these areas, such as business assistance loans, architectural assistance, and first-time homebuyer benefits. Largo s Strategic Plan includes future transit stations at the Crossroads Mall and supporting transit use, in general, through the establishment of community streets. Implementation plans include the improvement of the transit system within Largo by establishing a local transit shuttle to activity centers, parks, and civic centers. Largo plans on working with to develop this shuttle service. Pinellas Park Redevelopment areas in the City of Pinellas Park include the Park Boulevard/66 th Street area, the Park Boulevard/US 19 intersection area, Park Side Mall, and three roadway corridors (Bryan-Dairy Road, 78 th Avenue, and 49 th Street in the downtown). Tindale-Oliver & Associates 2-27 June TDP
40 Dunedin The Community Redevelopment Agency (CRA) of the City of Dunedin is responsible for the redevelopment of the downtown area. The goals of the CRA are varied and encompass fostering private investment, making public improvements, beautifying areas, providing downtown parking, building the tax base, and creating jobs. The City of Dunedin is successfully redeveloping the downtown area. Due to the positive response from the market, downtown redevelopment efforts have continued. Tarpon Springs The City of Tarpon Springs has designated two areas for redevelopment: the Sponge Docks and Downtown. The City adopted a Downtown Redevelopment Plan in July 2001, including a downtown Community Redevelopment Area consisting of the Downtown and commercial area of Tarpon Springs. Pinellas County Pinellas County has identified five major revitalization areas, including Dansville, Wind Tree Village, the Greater Ridgecrest Area, Union Academy Neighborhood, and Central Lealman. In addition, Pinellas County has developed a plan for the Gateway Area, consisting of areas east of US 19, north of Gandy Boulevard, south of Long Branch Creek, and west of Tampa Bay. This area includes portions of St. Petersburg, Largo, and Pinellas Park. As part of the plan, an intermodal hub is planned as a regional transfer center for those using the airport, the planned monorail service, bus services, and rental cars. The terminal may also be used for commuter buses to and from Hillsborough County. Other mobility initiatives such as BRT corridors, trolleys, and loopers are being considered for the area, as well. will continue its involvement in planning for the Gateway Area, particularly for the intermodal hub site. STATE OF FLORIDA POLICIES Florida Transportation Plan The 2025 Florida Transportation Plan (FTP) is Florida s statewide 20-year transportation plan, which provides a policy framework for allocating funding that will be spent to meet the transportation needs of the state. Florida is committed to providing livable communities and mobility for people and freight through greater connectivity and meeting the rising needs of businesses and households for safety, security, efficiency, and reliability. The FTP provides goals and objectives for Florida s transportation system. The long range goals and objectives that are pertinent to are provided below. Goal: Enrich quality of life and responsible environmental stewardship. Tindale-Oliver & Associates 2-28 June TDP
41 Objective: Plan, develop, implement, and fund the transportation system to accommodate the human scale, including pedestrian, bicycle, transit-oriented, and other community-enhancing features, unless inappropriate. Goal: A stronger economy through enhanced mobility for people and freight. Objective: Focus attention on meeting regional mobility needs that transcend traditional jurisdictional boundaries and ensuring connectivity between SIS, regional, and local facilities. Objective: Facilitate economic development opportunities in Florida s economically distressed areas by improving transportation access from these areas to markets in a manner that reflects regional and community visions. Objective: Develop multimodal transportation systems that support community visions. Objective: Expand transportation choices to enhance local mobility and to maintain the performance of the SIS and regionally significant facilities. Objective: Reduce per capita vehicle miles traveled by single occupancy vehicles, especially during peak hours of highway use. Objective: Ensure that the transportation system is accessible to all users, including young, elderly, disabled, and economically disadvantaged persons. Goal: Sustainable transportation investments in Florida s future. Objective: Reduce the cost of providing and operating transportation facilities. Objective: Document the gap between funding resources and needs across all levels and all modes in a consistent and compatible format. In summary, the FTP supports the development of state, regional, and local transit services. The growth in Florida requires new and innovative approaches by all modes to meet the needs today and in the future. Transit 2020 The Florida Department of Transportation provides policy guidance to local jurisdictions through the State of Florida Transit Plan, Transit Florida is committed to reducing congestion through the promotion of public transportation. The FDOT provides funds to local public Tindale-Oliver & Associates 2-29 June TDP
42 transportation systems in the form of Block Grants. The mission, goals, and objectives from the current 2020 public transportation plan are presented below. Mission The FDOT will provide a safe, interconnected statewide transportation system for Florida s citizens and visitors that ensures the mobility of people and goods, while enhancing economic prosperity and sustaining the quality of our environment. The three key issues of Transit 2020 include transit service, funding, and planning/policy. For each of the three issues, a related goal and set of objectives have been identified to set the priority direction for transit in Florida for the next 20 years. Goal 1: Implement a transit system that improves and expands travel choices for and visitors. Floridians Objective 1.1: Achieve the quantity and quality of local transit (core) service sufficient to increase transit ridership in Florida at twice the average rate of population growth through Objective 1.2: Develop and expand regional transportation service in corridors where the number of inter-county trips exceeds established thresholds. Objective 1.3: Expand the transit market to include a greater percentage of riders who have a choice between transit and auto for their trips. Objective 1.4: Provide an effective and efficient mix of transit modes and transfer facilities to achieve seamless intermodal travel. Goal 2: Sustain and expand investment in public transportation from all existing and potential public and private funding services. Objective 2.1: Achieve adequate and stable funding levels to meet transit needs for service preservation, operating and capital expansion, and technological innovation. Objective 2.2: Utilize flexible funding opportunities for transit. Objective 2.3: Use creative and innovative funding strategies. Goal 3: Develop, promote and encourage transit supportive policies, institutional arrangements and practices. Tindale-Oliver & Associates 2-30 June TDP
43 Objective 3.1: Promote land use planning and urban design practices that facilitate transit service and access. Objective 3.2: Foster institutional arrangements, practices, and cultures that establish clearly defined roles, promote staff teamwork, encourage partnership with transit providers, and support a result-oriented management approach. Objective 3.3: Develop a multi-modal transportation planning process that addresses the wide range of policy issues involved in making sound, long-range transportation investment decisions, including technological innovation and the environmental and economic benefits of transit. Objective 3.4: Establish broad-based public and political support of transit as a mobility choice and enhancement to Floridians quality of life. This plan was created in 2000, and new plans will be forthcoming. Therefore, it will be important for to monitor this effort for any impacts that a further updated plan may have on its system. Florida TDP Requirements The State of Florida Public Transit Block Grant Program was enacted by the Florida Legislature to provide a stable source of state funding for public transportation. The Block Grant Program requires public transit service providers to develop and adopt a Five-Year Transit Development Plan (TDP). TDP updates must be submitted to FDOT in July of every year. A major update is required every three years, and minor updates are required in the interim years. The TDP is often the source for determining the types of projects and their priority in the public transportation component of a community s Transportation Improvement Program (TIP). The plan must be consistent with the approved local government comprehensive plans and Long- Range Transportation Plans. The requirements for a major TDP update are included in Rule Chapter 14-73, Florida Administrative Code (FAC). Relevant sections in the Florida Statutes are highlighted below. (1) There is created a public transit block grant program which shall be administered by the department...eligible providers must establish public transportation development plans consistent, to the maximum extent feasible, with approved local government comprehensive plans of the units of local government in which the provider is located. Section (2) Where there is an approved local government comprehensive plan in the political subdivision or political subdivisions in which the public transportation system is Tindale-Oliver & Associates 2-31 June TDP
44 located, each public transit provider shall establish public transportation development plans consistent with approved local government comprehensive plans. Section In addition to the State mandate, the TDP can also assist in meeting several objectives, as indicated in the Manual for the Preparation of Transit Development Plans prepared by the Center for Urban Transportation Research (CUTR) in October FDOT is currently working on an update to this manual to document the new TDP requirements that are being considered by the Florida Legislature (see next section for a summary of the new rule). Other objectives of a TDP include the following: Assess the need for transit services Determine appropriate type and level of transit services Identify current and planned local transit resources Evaluate existing services Outline capital and operating expenses for proposed service development Identify potential and expected funding sources Identify a staged implementation plan supporting the cost affordable TIP New TDP Requirements Amendments to Rule of the Florida Administrative Code, which provides the requirements for TDP development, were approved on December 13, 2006 and published in the Florida Administrative Weekly (Volume 32, Number 52, December 29, 2006). Major changes to the rule include the following: Extends the planning horizon from 5 years to 10 years. Requires major updates every five years rather than every three years. Requires a public involvement plan to be developed and approved by FDOT or consistent with the jurisdiction s approved public involvement plan. Requires that FDOT, the Regional Workforce Board, and the local MPO be advised of all public meetings where the TDP is presented and discussed and that these entities be given the opportunity to review and comment on the TDP during the development of the mission, goals, objectives, alternatives, and 10-year implementation program. Requires the estimation of the community s demand for transit service (10-year annual projections) using the planning tools provided by FDOT or a demand estimation technique approved by FDOT. Requires that annual updates be in the form of a progress report on the 10-year implementation program and include: o Past year s accomplishments compared to the original implementation program; o Analysis of discrepancies between the plan and its implementation for the past year; Tindale-Oliver & Associates 2-32 June TDP
45 o Any revisions to the implementation program for the coming year; o Revised implementation program for the tenth year; o Added recommendations for the new tenth year of the updated plan; o Revised financial plan; and o Revised list of projects or services needed to meet the goals and objectives, including projects for which funding has not been identified. Allows for TDPs to be submitted to FDOT at any time but requires that they be submitted by September 1. The intent of the new requirements is to provide better planned and, thus, improved public transit services, and to provide the State with improved estimates of transit needs over a longer period of time. However, the FDOT does not provide any additional funding to implement the new requirements. Transit Quality of Service Evaluation FDOT is interested in the regular application of the quality of service framework published in the first edition of the Transit Capacity and Quality of Service Manual (TCQSM). The major goal is to establish a benchmark evaluation of transit systems within a similar time period. It is hoped that the information from this evaluation will provide support for increased investments in transit services and facilities throughout Florida. FDOT is requiring that MPOs (where fixed-route transit service operates) coordinate an effort to evaluate fixed-route transit services within their respective regions for the six transit service measures identified in the TCQSM. Latest guidance indicates that this evaluation should be completed as part of the MPO s LRTP update. The six transit service measures are included below. service frequency hours of service service coverage passenger loading reliability (on-time performance and headway adherence) transit vs. auto travel time State Growth Management Legislation (Senate Bill 360) In the 2005 Legislative Session, Senate Bill (SB) 360 was approved and signed into law by Governor Jeb Bush on June 24, The new law is referred to as the Growth Management (GM) legislation. The highlights of the GM legislation include closing the gap between development and construction of needed transportation and school facilities and requiring communities to identify water supplies needed for growth; set up a pay-as-you-grow system to Tindale-Oliver & Associates 2-33 June TDP
46 reduce backlogs and future growth needs; and link policies, plans, and budgets to ensure that infrastructure is available to support local growth plans. SB 360 requires that transportation improvements to meet concurrency are constructed or under construction within three years of the issuance of the building permit. In some situations when the traffic impact mitigation is planned for the near future a developer may be able to meet concurrency requirements through monetary proportionate fair-share contributions. In some cases it may be appropriate for transit proportionate share to be considered, such as for developments serving a large amount of transit riders or where roadways are physically constrained so that expansion is not possible. The new funding programs that are potentially applicable to are listed below, along with the amount of statewide funding available over the 10-year life span of the law and its applicability for use on transit projects. Some of these descriptions are taken from FDOT s Resource Guide for Transit and Transit-Related Programs (November 2005). New Starts Transit Program, $709 million (annual amounts starting at $54 million and increasing to $75 million) The program purpose is to assist local governments in the development of fixed guideway and bus rapid transit projects and to use state funds to leverage local revenues and secure federal discretionary transit New Starts funding. Eligible projects will be major new transit capital projects in metropolitan areas and must support local plans to direct growth where desired. FDOT can fund up to 50 percent of the non-federal share, with a limit of 12.5 percent on projects that do not receive FTA New Starts funding, and state funding participation is dependent on an acceptable FTA rating. Transportation Regional Incentive Program (TRIP), $1.015 billion (annual amounts in most years of $115 million) TRIP is a 50/50 match program that is designed to provide an incentive for regional planning, to leverage investments in regionallysignificant transportation facilities, and to link investments to growth management objectives. Eligible participants include all counties, MPOs, and multi-county transportation authorities. However, they must form regional partnerships to include two or more contiguous counties and/or MPOs, a multi-county regional transportation authority, or an MPO comprised of three or more counties. These regional partners must develop a regional plan that designates regionally-significant facilities and includes a priority listing of eligible projects. State Infrastructure Bank (SIB), $100 million (one-time allocation to be added to the existing program, but reserved for growth management related projects.) The SIB has been a good resource for agencies when projects are truly a priority and adequate funding from grants or earmarks are not enough. These interest-free loans can be applied for in the Work Program cycle and, depending upon fund availability and Tindale-Oliver & Associates 2-34 June TDP
47 project priority, the funding can be paid back over an extended time period (up to 30 years). Strategic Intermodal System (SIS), $2.8 billion (recurring allocation of $300-$500 million annually) Increasing the capacity of SIS facilities is the highest priority in the state. Improving the access to and within hubs is critical to efficient operation of the SIS. Therefore, FDOT developed guidelines that were designed to help close the gap identified in the GM legislation. In summary, the 2005 GM legislation provides for many new and creative opportunities to fund transit projects. New state transit funding programs, as well as legislation that identifies transit as a growth management strategy, will offer new transit funding opportunities that should be investigated by. Florida Department of Transportation Transit Funding Programs The Public Transit Block Grant Program was established by the Florida Legislature to provide a stable source of funding for public transit systems. Funds are awarded by FDOT to those public transit providers eligible to receive funding from the Federal Transit Administration's Sections 5307 and 5311 programs and to Community Transportation Coordinators. Public Transit Block Grant funds may be used for eligible capital and operating costs of providing public transit service. Program funds may also be used for transit service development and transit corridor projects. Public Transit Block Grant projects must be consistent with applicable approved local government comprehensive plans. State participation is limited to 50 percent of the non-federal share of capital projects. Program funds may be used to pay up to 50 percent of eligible operating costs, or an amount equal to the total revenue, excluding farebox, charter, and advertising revenue, and federal funds received by the provider for operating costs, whichever amount is less. The Transit Corridor Program provides funding to Community Transportation Coordinators or transit agencies to support new services within specific corridors when the services are designed and expected to help reduce or alleviate congestion or other mobility issues within the corridor. Transit Corridor funds are discretionary and are distributed based on documented need. Transit Corridor Program funds may be used for capital or operating expenses. Eligible projects must be identified in a Transit Development Plan, Congestion Management System Plan, or other formal study undertaken by a public agency. Projects are funded at one-half the non-federal share. Projects that have regional or statewide significance may receive funding at up to 100 percent. The classification of a project as having either regional or statewide significance is made by the FDOT Central Office. Tindale-Oliver & Associates 2-35 June TDP
48 The Public Transit Service Development Program is selectively applied to determine whether a new or innovative technique or measure can be used to improve or expand public transit services. Service Development Projects specifically include projects involving the use of new technologies; services, routes, or vehicle frequencies; the purchase of special transportation services; and other such techniques for increasing service to the riding public. Projects involving the application of new technologies or methods for improving operations, maintenance, and marketing in public transit systems are also eligible for Service Development Program funding. Service Development Projects are subject to specified times of duration, but no more than three years. If determined to be successful, Service Development Projects must be continued by the public transit provider without additional Public Transit Service Development Program funds. Projects submitted for funding must be justified in the recipient's TDP (or TDSP, if applicable). The Commuter Assistance Program was established to encourage public/private partnerships to provide brokerage services to employers and individuals for carpools, vanpools, buspools, express bus service, subscription transit service, group taxi services, heavy and light rail, and other systems designed to increase vehicle occupancy. The program encourages the use of transportation demand management strategies including employee trip reduction planning; Transportation Demand Management Association activities; alternative work hour programs, such as telecommuting and compressed work weeks; parking management; and bicycle and pedestrian programs. Funding for the Commuter Assistance Program is allocated to each FDOT district based on a statewide assessment of Commuter Assistance Program need. Allocation requests identified in the annual FDOT District Work Plan will be given first priority. The Department is authorized to fund up to 100 percent of the eligible costs of commuter assistance projects determined by the FDOT district to be regional in scope and application or of statewide significance and application. The Park-and-Ride Lot Program was created to provide organized, safe parking for vehicles constantly congregating on roadsides. The program provides for the purchase and/or leasing of private land for the construction of park-and-ride lots, the promotion of these lots, and the monitoring of their usage. FDOT has established criteria for parkand-ride planning to assist in siting, sizing, and disposal of park-and-ride facilities. These criteria are contained in the State Park-and-Ride Lot Planning Handbook. Local agencies may request the use of Park-and-Ride Lot Program funds by filing a project proposal with the FDOT district office. The FDOT district office sends a project priority list to the FDOT Central Office. The FDOT Central Office determines which projects will be funded. The Department will fund up to one-half the non-federal share of park-andride lot capital projects. If a local project is in the best interest of the Department, then the local share may be provided in cash, donated land value, or in-kind services. Tindale-Oliver & Associates 2-36 June TDP
49 The New Starts Transit Program (NSTP) was established by the 2005 Florida Legislature to assist local governments in developing and constructing fixed guideway and bus rapid transit projects, planned to operate within exclusive right-of-way, to accommodate and manage urban growth and development. A secondary purpose of the program is to leverage State of Florida funds to generate local transportation revenues and secure FTA New Starts Program funding for Florida projects. Eligible projects include those capital projects that support the Strategic Intermodal System and would be a worthwhile investment of state dollars. NSTP projects may be used to support final design, right-of-way acquisition, and construction projects. The NSTP will follow the selection guidelines of the FTA Section 5309 New Starts Program. Proposed projects should have political support, be included in local plans, and have a dedicated funding commitment. In order to receive funding, a project must have either a Record of Decision (ROD) from the Federal Transit Administration, or a Finding of No Significant Impact (FONSI). The state s participation in transit capital projects may not exceed 50 percent of the non-federal share of a project. For individual fixed guideway projects not approved for federal funding, the maximum state share is 12.5 percent of the costs of final design, right-of-way acquisition, and construction. Other state funds, such as Transportation Regional Incentive Program funds or Intermodal Program funds, cannot be used as match for NSTP funds. The Intermodal Development Program was developed to provide funding for major capital investments in fixed guideway transportation systems; access to seaports, airports, and other transportation terminals; and provide for the construction of intermodal or multimodal terminals. Projects funded with Intermodal Development Program funds are to be consistent, to the maximum extent feasible, with approved local government comprehensive plans of the units of local government in which the project is located. Eligible projects include major capital investments in public rail and fixed guideway transportation facilities and systems that provide intermodal access; road, rail, intercity bus service, or fixed guideway access to, from, or between seaports, airports, and other transportation terminals; construction of intermodal or multimodal terminals; development and construction of dedicated bus lanes; and projects that otherwise facilitate the intermodal or multimodal movement of people and goods. The Transportation Regional Incentive Program was created by the 2005 Legislature to improve regionally significant transportation facilities in "regional transportation areas." State funds are available throughout Florida to provide incentives for local governments and the private sector to help pay for critically needed projects that benefit regional travel and commerce. FDOT will pay for 50 percent of project costs, or up to 50 percent of the non-federal share of project costs for public transportation facility projects. This program can be used to leverage investments in regionally significant transportation facilities, and must be linked to growth management objectives. Eligible TRIP projects must be Tindale-Oliver & Associates 2-37 June TDP
50 identified in appropriate local government capital improvements program(s) or long-term concurrency management system(s) that are in compliance with state comprehensive plan requirements. In addition, projects must be consistent with the Strategic Intermodal System and support facilities that serve national, statewide, or regional functions and function as an integrated transportation system. The FDOT district offices will provide district priorities for TRIP funds to the FDOT Central Office. Selected projects may also be eligible for revolving loans and/or credit enhancements from the State Infrastructure Bank program. If project funding is awarded through the SIB, the funding must be matched by a minimum of 25 percent from funds other than the SIB. SIB loans can be made to a FDOT district office or the Turnpike Enterprise, or they can be between the Department and an entity external to the Department (e.g., County, City, or Expressway Authority). The County Incentive Grant Program (CIGP) was created by the 2000 Legislature for the purpose of providing grants to counties to improve a transportation facility (including transit) that is located on the State Highway System or that relieves traffic congestion on the State Highway System. Municipalities are eligible to apply, as well, and can do so by submitting an application through the county. CIGP funds are distributed to each FDOT district office by statutory formula. The Department will cover 50 percent of eligible project costs. Eligible projects include those that improve the mobility on the State Highway System; encourage, enhance, or create economic benefits; foster innovative public-private partnerships; maintain or protect the environment; enhance intermodalism and safety; and those that advance other projects. New technologies, including intelligent transportation systems, that enhance the efficiency of a project are also eligible. CIGP is managed within the FDOT district. Each year, each district notifies the counties within its boundaries of the availability of CIGP funds and asks that applications be submitted by a certain deadline. The District ranks the projects according to the selection criteria and selects projects as funds are made available. Florida Department of Transportation Work Program FDOT annually develops a Five-Year Work Program. The Work Program is a project-specific list of transportation activities and improvements developed in cooperation with the MPO and local transportation agencies. The Work Program must be consistent, to the maximum extent feasible, with the capital improvement elements of local government comprehensive plans. The Tentative Work Program is presented to the Legislature at the beginning of each Legislative session. It identifies transportation projects and programmed funding by year and is adopted by July 1 each year. Tindale-Oliver & Associates 2-38 June TDP
51 Once adopted, the Work Program is then used by FDOT to develop the State Transportation Improvement Program (STIP) that is used at the federal level to ensure that planning efforts are consistent with federal guidelines. All transit funding coming through the Federal Transit Administration must be included in the STIP before a grant award can be finalized and approved. Close coordination with FDOT on the programming of federal funds is required in the development of the Tentative Work Program, as well as throughout the year as federal adjustments and allocations are announced. State transit planning and programs encourage the growth of public transportation services, as well as support the increasing local investment in transit systems. The State has several funding programs that are available if local areas are able to commit to a dedicated funding source for system development and expansion. Legislation passed over the past few years indicates that the State plans to continue to foster a multimodal approach to transportation investment. FEDERAL POLICIES SAFETEA-LU The Safe, Accountable, Flexible, and Efficient Transportation Equity Act - A Legacy for Users (SAFETEA-LU) continues and/or establishes numerous funding programs for transit. A summary of relevant programs is taken from FDOT s Resource Guide for Transit and Transit- Related Programs (November 2005). Urbanized Area Formula Program (49 U.S.C. Section 5307) This program makes Federal resources available to urbanized areas and governors for transit capital and operating assistance in urbanized areas and for transportation related planning. Funds are allocated on a formula basis, with some variation within each state for those urban areas that are under 200,000 in population. Growing States and High Density States Program (49 U.S.C. Section 5340) These new programs provide for the distribution of funds to the urbanized and non-urbanized area formula programs based on new factors. From 2006 to 2009, $1.6 billion will be allocated. One-half will be allocated based on population forecasts for 15 years out from the last Census (2015). Florida will benefit by moving up to the third most populous state in One-half will be based on population densities in excess of 370 persons per square mile. Eight states, not including Florida, will share this portion of the allocation (Florida ranks 9 th in population density). Florida systems are expected to receive an additional $10.0 million in FY 2006 and a total of $46.1 million through 2009 due to the Growing States adjustment. Tindale-Oliver & Associates 2-39 June TDP
52 Bus and Bus Related Facilities Program (49 U.S.C. Section 5309) The Bus and Bus Related Facilities Program provides capital assistance to eligible recipients on a discretionary basis. Although, in recent years, funding available through this program has been primarily distributed through the earmarking process, eligible recipients for capital investment funds include public bodies and agencies (transit authorities and other state and local public bodies and agencies thereof) including states, municipalities, other political subdivisions of states; public agencies and instrumentalities of one or more states; and certain public corporations, boards, and commissions established under state law. Major Capital Investment Grants of $75 million or more (New Starts) (49 U.S.C. Section 5309(d)) The FTA discretionary New Starts program is the Federal government s primary financial resource for supporting locally-planned, implemented, and operated transit guideway capital investments. From heavy to light rail, from commuter rail to bus rapid transit systems, the New Starts program has helped to make possible hundreds of new or extended transit fixed guideway systems across the country. Major Capital Investment Grants of under $75 million (Small Starts Program) (49 U.S.C. Section 5309(e)) This program provides funding for smaller projects with a federal New Starts share of less than $75 million, including streetcar, trolley, bus rapid transit (if a substantial portion of the project operates in a separate right-of-way in a defined corridor dedicated for public transit use during peak hours or it has other characteristics of a fixed guideway system), and commuter rail projects. Small Starts projects may not total more than $250 million. Simplified procedures and criteria apply to the program and were developed in 2006 by the National Bus Rapid Transit Institute at CUTR. This program is being funded at $200 million per year from 2007 to New Freedom Program (49 U.S.C. Section 5317) This new formula funding program provides funding for services that are developed beyond that required by ADA to assist persons with disabilities. Sixty percent of the apportionment under the program will be allocated directly to large urbanized areas (over 200,000 in population), and the remaining 40 percent will be allocated to states for use in urbanized areas of less than 200,000 in population and in rural areas. Job Access and Reverse Commute Program (JARC) (49 U.S.C. Section 5316) This program provides funding to develop transportation services for welfare recipients and low income individuals to and from jobs, and to develop transportation services from urban centers to suburban employment opportunities. The JARC Program funds are distributed by formula to designated recipients in urbanized areas with over 200,000 in population and to the states through an application process. Tindale-Oliver & Associates 2-40 June TDP
53 Flexible Funding Programs Flexible funds are legislatively specified funds that may be used either for transit or highway purposes. This provision was first included in the Intermodal Surface Transportation Efficiency Act of 1991 (ISTEA), was continued with the Transportation Equity Act for the 21 st Century (TEA-21), and is included in SAFETEA-LU. Flexible funds allow a local area to choose to use certain Federal surface transportation funds based on local planning priorities, not on a restrictive definition of program eligibility. Flexible funds include the Federal Highway Administration Surface Transportation Program, the Congestion Mitigation and Air Quality Improvement Program, and Federal Transit Administration Urban Formula Funds. FHWA Discretionary Programs SAFETEA-LU continued several programs initiated in the earlier transportation acts with some modification. Programs with potential relevance to Lee County are identified below. Corridor Planning and Development and Border Infrastructure o Possible corridor improvements funded under this program could include transit facilities, but have not historically been approved for transit facilities. The federal share is 80 percent. Ferry Boats o Provides a special funding category for the construction of ferry boats and ferry terminal facilities based on an annual, open competition on a national level. The federal share in this program is 80 percent. ITS Deployment o Technology that can benefit and serve transit can be included as part of an overall ITS deployment plan in a community. The federal share is 50 percent. Value Pricing Pilot Program o Projects with a variable pricing component to encourage shifts in time, route, or mode of travel are eligible. The federal share is 80 percent. SAFETEA-LU includes many different funding programs, many of which could be accessed with innovative approaches and project ideas. It should be noted that any funds that are awarded by the FTA, regardless of the initial source of the funding, must be properly identified in the State Transportation Improvement Program prior to the award being approved. With annual appropriations and allocations occurring each year, appropriate adjustments to the FDOT Work Program are required to ensure that projects are properly included in the STIP. Federal support in public transportation continues to grow and the number of funding programs that can be used to develop transit systems expands with each federal transportation reauthorization. To anticipate that federal support will be maintained is logical, and should a Tindale-Oliver & Associates 2-41 June TDP
54 local area decide to move ahead with developing a high investment service such as bus rapid transit, federal support should be attainable. Clean Air Act of 1990 The Clean Air Act of 1990, and subsequent amendments, determines the National Ambient Air Quality Standards (NAAQS). NAAQS are standards based on the amount of particulate matter in the air, measured in parts per million for the following pollutants: Carbon Monoxide (CO); Nitrogen Dioxide (NO2); Ozone (O3); Sulfur Dioxide (SO2); Lead (Pb); and Particulate Matter (PM). An area meeting these standards is classified as an attainment area. Attainment areas must provide a plan on how they will maintain air quality. According to the previous Air Quality Technical Report in 2004, Pinellas County falls in this category as an attainment/maintenance area for all NAAQS pollutants. The County must continue to meet the Federal ozone standards to continue to receive transportation funding. To assist in maintaining the attainment area designation, purchases clean diesel and Compressed Natural Gas (CNG) buses and trolleys. The implications of this act have been higher capital and infrastructure costs for transit vehicles and equipment. Empowerment Zone and Enterprise Community Program The Empowerment Zone and Enterprise Community (EZ/EC) Program was one component of the Clinton Administration s community revitalization strategy. Under this program, up to 104 areas were to be designated for revitalization based on poverty and distress criteria. There were no communities designated as an EZ or EC in Pinellas County. However, Florida has implemented a similar program in which communities may be designated as an Enterprise Zone. Areas in the cities of St. Petersburg and Clearwater were designated as Enterprise Zones. provides fixed-route bus service to the Enterprise Zones and will play an important role in providing transportation and job opportunities to residents within the zones. In addition, the cities of St. Petersburg, Clearwater, Pinellas Park, and Tarpon Springs work with Enterprise Florida, Inc., in the area of economic development. According to the State of Florida website, Enterprise Florida is a public/private partnership between government and business leaders. Enterprise Florida serves as the primary economic development organization for the State of Florida. One program that Enterprise Florida administers is the Economic Development Tindale-Oliver & Associates 2-42 June TDP
55 Transportation Fund, which provides up to $2,000,000 for public transportation infrastructure improvements for companies expanding or relocating in Florida. By 1995, when the State of Florida s Office of Program Policy Analysis and Government Accountability issued a government-mandated review of the Economic Development Transportation Fund, 48 of the State s 67 counties had been awarded program grants. 1 Federal Transit Administration Transit Safety Program In response to the September 11, 2001 attacks, FTA has taken a lead role in enhancing and ensuring the safety of transit systems throughout the county. In June 2002, FTA issued a report addressing its five-part security initiative to enhance the security of the nation s public transportation systems and help public transportation agencies cope with these new threats. Since that time, the FTA has undertaken a series of major steps to implement these five steps through on-site readiness assessments, technical assistance, regional forums, grants for drills, training, and accelerated technology and research projects. The initiative emphasizes the following functional areas: Assessment. FTA has completed 37 threat and vulnerability assessments at the highest risk transit agencies using anti-terrorism, security, and transit operations experts. Using these assessments, FTA has provided specific feedback to individual agencies and best practices for the industry in order to improve system security. Planning. FTA is encouraging a reexamination of emergency response plans in light of heightened terrorist concerns. To this effect, technical assistance teams are being deployed to the top transit agencies to help them implement the major components of a systematic security program. Testing. The FTA has awarded grants up to $50,000 to 83 transit agencies to conduct tabletop and full-scale drills to test and improve their emergency response plans. ( secured a Federal Grant and conducted such a drill in February 2003). Training. Transit employees play a crucial role in security and emergency response. FTA has conducted emergency preparedness and security forums, and offers a new two-hour security awareness course for front line employees and supervisors nationwide. Technology. FTA is funding security-related transit research through the Transit Cooperative Research Program (TCRP), has improved the Transit Safety and Security Reporting module of the National Transit Database, and has implemented a Bus Safety Program. 1 State of Florida Office of Program Policy Analysis and Government Accountability, December 4, Tindale-Oliver & Associates 2-43 June TDP
56 In response to the Office of Homeland Security, the FTA has defined a plan to guide transit response to the Homeland Security Advisory System. 2 The plan, which includes 253 specific measures organized by level of alert, establishes a consistent and coordinated response to potential threats against transit in order to protect passengers, employees, and infrastructure, and to support community emergency response efforts. The program is divided into six categories of protective measures. 1.0 Information and Intelligence: Threat and vulnerability information collection and analysis, sharing information with and getting information from local, regional, and federal sources. 2.0 Security and Emergency Management: All aspects of creating, updating, and executing the security and emergency management plans and procedures for the transit agency. 3.0 Regional Coordination: Participation of the transit agency in the region, including regional emergency response plans, relationships with other security-related organizations in the region and first responders, and conducting regional drills and exercises. 4.0 Information Technology and Communications Systems: All aspects of creating, updating, and executing the information system plans and monitoring and operating the communications equipment for the transit agency. 5.0 Employee and Public Communication: All aspects of creating, updating, and executing the employee and public information communications plans for the transit agency. 6.0 Contingency and Continuity Plans: All aspects of creating, updating, and executing the transit agency s contingency and continuity of operations plans for emergency incidents/events within the transit system and in the region. Other Policies Affecting Transit The federal government has programs available for mass transit and vanpool reimbursements. In addition, there are also programs through employers for parking. Parking demand management is also being explored through a program called Commuter Choice. Commuter Choice is a blend of cash incentives and parking demand management to provide incentives for public transportation, vanpools, and/or other commuter programs. is working to promote Employers Choice, a program designed to help Pinellas County employers encourage their employees to utilize transit services to and from work. works with participating employers to administer and market the program to employees by offering bus riding tips, trip planning, details on local routes, and information about the Employer s Choice program itself. Employers 2 FTA, Transit Agency Security and Emergency Management Protective Measures Tindale-Oliver & Associates 2-44 June TDP
57 can choose either to share the cost of bus passes with their employees or subsidize the full cost of the employees public transit commute. Bus passes purchased through the Employer s Choice program can be purchased with pre-tax salary dollars by employees and are tax deductible for employers. SUMMARY AND IMPLICATIONS Summary The purpose of this chapter was to review related transportation planning and programming documents to assess existing transit policies, along with their relationship to. Policies were reviewed at the local, state, and federal levels of government to determine guidance for the subsequent development of the TDP Update. Based on this policy review, the principal goals for the public transportation services in Pinellas County are to: assist in the mitigation of traffic congestion; provide mobility for residents and visitors, including the transportation disadvantaged; reduce air pollution; and improve the quality of life for the residents of Pinellas County. Specific policies for achieving these goals all relate to making public transportation a more viable transportation alternative for traveling throughout Pinellas County. A summary of the transit policy context and conclusions is provided below. The County Comprehensive Plan has defined six emphasis areas for public transportation. These include evaluating long-range mobility options, improving passenger amenities, improving pedestrian facilities (especially for the elderly), expanding marketing, expanding the fixed-route service area, and continuing ridership development. The standard for transit concurrency is to ensure transit access to all major traffic generators and attractors with at least a 30-minute service frequency in the peak and no greater than a 60-minute service frequency in the off-peak. Transportation Management Plans may be negotiated to mitigate concurrency impacts (e.g., passenger amenities, employer-sponsored transit programs, etc.). Pinellas County is dedicated to encouraging the use of public transportation throughout the County and developing an advanced regional transit system in the County. Tindale-Oliver & Associates 2-45 June TDP
58 A significant number of transit capital and operating projects are included in the current 2006/07 to 2010/11 TIP. Specific service delivery enhancements are identified in the 2005 TDP update. Implementation for many of these enhancements is already underway. is involved in transportation coordination efforts with other organizations in the region to ensure that citizens throughout the Tampa Bay area have access to transit service. The PMI is a major initiative for the improvement of mobility throughout Pinellas County using fixed guideway and bus rapid transit services. will continue to develop plans to supplement the PMI as it is implemented, in addition to providing regular transit services. As a result of the SR 688/I-275 Transit Corridor Study, Route 300X was implemented with service from Starkey Road in Pinellas County to downtown Tampa in Hillsborough County, including two new park-and-ride locations, and sleek commuter coaches. Bus preferential treatment studies along congested corridors in Pinellas County have helped to identify ways to facilitate bus travel through highly traveled corridors. participates in the review of preliminary design plans to provide comments regarding the implementation of more transit-friendly design standards. Redevelopment plans throughout Pinellas County provide opportunities for expansion of transit use and services. The current version of the FDOT Florida Transportation Plan supports the provision of travel choices to ensure mobility of citizens and visitors. FDOT has indicated that this plan will again be updated in the near future. The Safe, Accountable, Flexible, and Efficient Transportation Equity Act A Legacy for Users (SAFETEA-LU) includes various funding programs that could be accessed with innovative approaches and project ideas. SAFETEA-LU increases federal support of public transportation, and federal funding should be available for developing and maintaining high investment services. The Federal Transit Administration has established a new five-part security initiative and six categories of protective measures to enhance the security of public transit agencies around the country. Tindale-Oliver & Associates 2-46 June TDP
59 Implications A review of local, state, and federal transportation policies indicates that no conflicts are expected with regard to consistency with other plans and programs. The 2006 Minor TDP Update, the Transportation Element of the Pinellas County Comprehensive Plan, and the 2025 Long Range Transportation Plan (LRTP) should be considered as appropriate in the development of this Major TDP Update. Pedestrian facilities and connections to and from bus stops and between bus stops and surrounding developments must continue to be improved in order to create a more transitfriendly environment for both current patrons and potential new users. Similarly, bus stop infrastructure should continue to be improved for the comfort of waiting passengers and to help improve the attractiveness of transit service. These improvements will ensure the accessibility of stops for persons with disabilities, as well. The development review process in coordination with local jurisdictions should be continued to ensure the inclusion of transit-oriented and/or supportive infrastructure for both new development and redevelopment. This includes the conveyance of development requests from the County to so that has an opportunity to review and provide input from a transit-supportive standpoint. ITS technologies should be considered and implemented as necessary to help promote more effective and/or efficient transit services to patrons. Transit-related studies should continue to be monitored in order to provide input and identify potential opportunities for transit service enhancements. Regional coordination should continue to develop inter-county transit services with Hillsborough, Pasco, and Manatee counties. In addition, strategies supporting regional coordination, such as reciprocal transfer policies and regional fares, are already under consideration. In response to FDOT s preference for a countywide approach to the implementation of bus preferential treatments, FDOT, the Pinellas County MPO, and are working cooperatively on developing such an approach. SAFETEA-LU should continue to be monitored closely for potential transit policy implications affecting. Tindale-Oliver & Associates 2-47 June TDP
60 should consider additional funding opportunities available from FTA s New Starts, Small Starts, New Freedom, and Job Access Reverse Commute programs. The MPO should consider developing transit proportionate fair share rules to help fund transit operations in Pinellas County. The monitoring program should continue to assure that rider concerns and needs are taken into consideration during the planning process. Capital equipment should continue to be maintained and replaced. In particular, upgrades to the transit fleet with clean running buses will help meet air quality requirements. Continued involvement in any existing and future projects involving the PMI should ensure coordination and the need for additional feeder services. This would include the accommodation of any potential transit modal technologies such as monorail, commuter rail, light rail, streetcar, and/or Bus Rapid Transit. Enhancements to the fixed-route system with respect to service frequency, hours of operation, service area coverage, express service, and/or BRT and premium service concepts should continue. Development of security programs using the FTA and other resources as templates must continue. In addition to the implications summarized above, the Vision Statement, Mission Statement, and Strategic Goals for fiscal year 2006/07 are provided in Table 2-1. The table includes the vision statement, mission statement, and six strategic goals. These statements and goals provide critical guidance for the preparation of the TDP Update. Tindale-Oliver & Associates 2-48 June TDP
61 Table 2-1: Vision, Mission, and Strategic Goals (FY 2006/07) Vision Statement The Pinellas Suncoast Transit Authority is a dynamic and highly responsive intermodal public transportation network utilized as a viable travel alternative for both residents of and visitors to the Tampa Bay region. Mission Statement The mission of is to provide safe, convenient, attractive, and affordable alternative transportation service for residents and visitors, thereby enhancing the quality of life in Pinellas County. Strategic Goals Ensure current high quality standards in transit vehicles, facilities, and services. Provide the coverage and frequency of transit services in order to optimize capacity. Enhance the involvement and awareness of in the community. Coordinate transit planning with area land use and economic development efforts. Maintain, recruit, and train a diverse workforce to meet the current and future skill needs of. Balance capital and operating needs with available financial resources. Source: Pinellas Suncoast Transit Authority Tindale-Oliver & Associates 2-49 June TDP
62 Tindale-Oliver & Associates 2-50 June TDP
63 Section 3 PERTINENT CONDITIONS This section summarizes the pertinent conditions under which operates transit services in Pinellas County. The review of pertinent conditions includes a discussion of the service area, demographics and land use, commuting patterns, existing transit services, and existing roadway network. The chapter concludes with a summary of pertinent conditions for. This review of pertinent conditions provides the background information needed to understand the service area and characteristics of the service area population. The information compiled in this chapter is used to help determine future public transportation needs in the county. SERVICE AREA DESCRIPTION Located on the West Coast of Florida approximately 10 miles west of the City of Tampa, Pinellas County is an urban county with the highest population density in the state of Florida. Pinellas County is composed of 24 municipalities, the largest of which are the cities of St. Petersburg and Clearwater. Map 3-1 illustrates the municipalities and unincorporated areas of Pinellas County. DEMOGRAPHICS AND LAND USE To better understand the demographics and land use characteristics of Pinellas County, a review of this information was conducted as part of the transit plan development process. The sources for this information include the U.S. Census Bureau, the American Community Survey (ACS), the Bureau of Economic and Business Research at the University of Florida (BEBR), the Florida Department of Transportation (FDOT), the Pinellas County Metropolitan Planning Organization (MPO), and the Tampa Bay Regional Planning Council (TBRPC). These agencies provided data and information to summarize the existing and future demographics and land use patterns in Pinellas County. Population The estimated population of Pinellas County was 948,102 in Since 2000, the annual population growth has been less than one percent. This relatively low annual population growth rate may be attributed, in part, to many areas of the county having already reached build-out. The projected changes in population from 2005 to 2015 are illustrated in Map 3-2 by traffic analysis zone (TAZ). These population projections were developed as part of the MPO s adopted 2025 Long Range Transportation Plan (LRTP). Tindale-Oliver & Associates June TDP
64
65
66 As mentioned previously, Pinellas County has the highest population density of all counties in Florida. With the second smallest land area (280 square miles) and the sixth highest population (948,102) in 2006, the resulting county-wide population density is 3,386 persons per square mile. Population density is expected to increase gradually in the coming years. This is especially true in the northern portion of the county, where significant population growth is projected in areas that have not reached build-out. Map 3-3 shows the persons per square mile by TAZ in Pinellas County for the year 2005, as well as the projected population density for Population Characteristics Age An important trend in Pinellas County is the aging of the population. The trend is important because the population of Pinellas County has been getting older over the past 17 years. This may be attributed to the large number of baby-boomers residing in Pinellas County, as well as the significant retirement population. Figure 3-1 shows the median age of Pinellas County from 1990 to 2000, as well as projections through The median age has increased by over five percent from 1990 to Figure 3-1 Median Age 50.0 Age Year Sources: Florida Statistical Abstract, 1999, 2000 Bureau of Economic and Business Research, University of Florida, Accessed 03/12/07 and the American Community Survey of the U.S. Census Household Size In addition to having the highest population density in Florida, Pinellas County is one of two counties that have the smallest average household size. The average household size is 2.17 persons, placing Pinellas County with Sarasota County as having the smallest average household size in the state. Tindale-Oliver & Associates June TDP
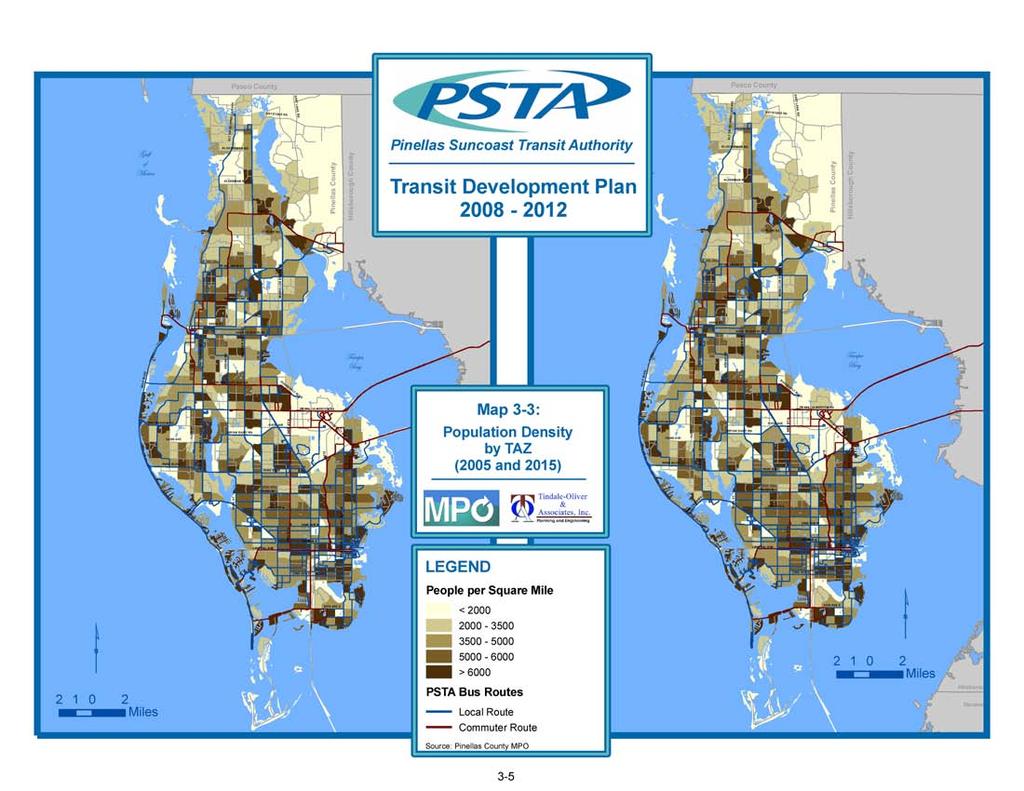
67
68 Minority Population Pinellas County s population shows that there is a lower proportion of minorities when compared to Florida and the nation as a whole. According to the 2005 American Community Survey (ACS), over 84 percent of the county population is white, 10 percent is African-American, less than 3 percent is Asian, and slightly more than 3 percent is of another race or two or more races. Over six percent of the population is of Hispanic origin. Income According to the ACS, the projected 2005 median household income for Pinellas County is $40,694. This represents a 10 percent increase since The 2000 Census data show that median household income in the county was $37,111, an increase of 41 percent since Approximately 10 percent of the county population has an annual household income below the poverty line. Auto Ownership Based on the 2000 Census, over 9 percent of the occupied dwelling units did not have a vehicle available for use, and households with no vehicle are considered a primary market for public transportation services. However, nearly 91 percent of the occupied dwelling units had access to an automobile and, in most cases, more than one. As expected, automobiles are the overwhelming choice for travel. According to the 2000 Census, over 90 percent of workers over age 16 use their personal automobile to drive to work, with nearly 80 percent driving alone. It is important to note, however, that the transit mode split increased from 1.5 percent in 1990 to 1.9 percent in 2000, an increase of 27 percent. According to 2005 ACS data, however, single occupancy vehicle travel has increased even further, to more than 80 percent, while the carpool, walking, and transit mode shares have all decreased between 2000 and Table 3-1 shows the primary means of travel to work for Pinellas County residents. Table 3-1 Means of Transportation to Work Mode Preference % Change % Change Drive Alone 78.9% 79.7 % 80.6% 1% 1% Carpool 12.5% 11.0% 9.6% -12% -13% Walk 2.4% 2.0% 1.5% -16% -20% Public Transportation 1.5% 1.9% 1.4% 27% -26% Work at Home 2.5% 3.5% 4.6% 40% 31% Other Means 2.2% 1.8% 2.3% -18% 28% Sources: 1990 and 2000 Census, and 2005 ACS. Tindale-Oliver & Associates June TDP
69 Employment Unemployment rates in Pinellas County declined steadily from 3.7 percent in 1996 to 2.5 percent in However, the rate has climbed since then, up from 2.5 percent in 2000 to 5.4 percent in This trend is consistent with the unemployment rates of adjacent counties and the nation as a whole. In 2002, Polk County had the lowest unemployment rate in the region at 5.1 percent, while Hernando County had the highest unemployment rate at 7.3 percent. Overall, Pinellas County s unemployment rate is lower than those for Florida and the United States as a whole. The economy in Pinellas County is primarily service-oriented, with over 45 percent of employment falling within this category. The fastest growing employment sector involves service-oriented jobs, which have grown from 22 percent in 1970, to 40 percent in 1996, to 42 percent in 1999, to 45 percent by Although service jobs have seemed to level off more recently, according to the Pinellas County MPO 2025 LRTP, approximately 60 percent of the jobs in the county will be in the service industry in Other major industries include medical and biotechnology products, plastics, navigational instruments, electronic equipment, printing and publishing equipment, and industrial machinery. Table 3-2 shows the employment breakdown for Pinellas County in 2005, and percent change by employment category from 2002 to Category Table 3-2 Employment by Category Employees % in 2005 % in 2002 in 2005 % Change Agriculture, Forestry & Fishing % 0.1 % 0.0% Mining, Construction, and Utilities 26, % 5.9% 0.8% Wholesale, Transportation, Warehousing, and Manufacturing 57, % 14.9% -0.2% Retail 53, % 13.3% 0.3% Professional 76, % 19.1% 0.5% Services 177, % 46.7% -1.5% Other % 0.1% 0.0% Source: Florida Statistical Abstract, 2000 & 2006; Bureau of Economic and Business Research, University of Florida. Note: The professional category includes information, finance, insurance, real estate, professional services, scientific services, technical services, and management and enterprise. Services include administration and support, educational services, healthcare and social assistance, arts entertainment and recreation, accommodation and food services, and other services. In addition to the service industry, industrial employment is also expected to increase in future years, consistent with a national trend. Most of this growth is expected to occur in the midcounty area where nearly 55 percent of the county s current industrial land uses exist and more than 40 percent of the county's remaining vacant land is designated for industrial development. The majority of employment growth is expected to occur in the Greater Pinellas Park Area, the Tindale-Oliver & Associates June TDP
70 Greater St. Petersburg Area, the Highpoint Area, and the Greater Clearwater Area. In addition, redevelopment is expected to occur in the urban areas of the county, especially in the cities of St. Petersburg and Clearwater. Map 3-4 shows the projected employment changes by TAZ from 2005 to 2015 and Map 3-5 shows employment density by TAZ for 2005 and 2015 in Pinellas County. In addition, Table 3-3 lists major employers in the county and Map 3-6 shows the location of each major employer listed in Table 3. Employer Nielsen Media Research, Inc. Home Shopping Network Table 3-3 Major Private and Public Employers in Pinellas County Description Number Employed Major Private Employers Publishing 3,510 Location 501 Brooker Creek Blvd., Oldsmar, FL Television Broadcasting 2,419 1 HSN Dr., St. Petersburg, FL St. Petersburg College College 1, th St. N., Pinellas Park, FL Jabil Circuit Honeywell International, Inc. Bare Printed Circuit Board Manufacturing 1, Dr. Martin Luther King Jr. St. N., St. Petersburg, FL Electronic Computer Manufacturing 1, US Hwy 19 N., Clearwater, FL Raytheon Company System and Instrument Manufacturing 1, nd St. N., St. Petersburgm FL Tech Data Corporation Electronic Computer Manufacturing 1, Tech Data Dr., Clearwater, FL Times Publishing Corporation Newspaper Publishers 1, st Ave. S., St. Petersburg, FL Franklin Templeton Companies Financial Investment 1, Fountain Parkway, St. Petersburg, FL YMCA of the Suncoast Individual and Family Services 1, Enterprise Rd., Clearwater, FL Special Data Processing, Inc. Progress Energy Florida Pinellas County School Board Board of Pinellas County Direct Selling 1, US Hwy 19 N., Clearwater, FL Electric Power Distribution 1, Central Ave., St. Petersburg, FL Major Public Employers School District 17, th St. SW, Largo, FL Executive Offices 3, Court St., Clearwater, FL City of St. Petersburg Executive Offices 3, th St. N., St. Petersburg, FL Pinellas County Sheriff s Office Sheriff s Office 2, Ulmerton Rd., Largo, FL Bay Pines VA Medical Center Medical Center 2, Bay Pines Blvd., Bay Pines, FL United States Postal Service Public Administration 2,199 n/a City of Clearwater Executive Offices 2, S. Myrtle Ave., Clearwater, FL Source: Accessed 01/15/07. Tindale-Oliver & Associates June TDP
71 Tourism Tourism, one of the largest and fastest growing employment sectors in the county, is expected to grow more in the near-term creating an even greater demand for service jobs. Due to the built-out condition of much of Pinellas County, the increase in jobs is anticipated to occur along the coasts, near existing tourist areas, and along major arterial routes. In 2005, Pinellas County had 41,854 employees working in hotels and other lodging, eating/drinking establishments, and amusement and recreation services. Out of Florida s 67 counties, Pinellas County ranks eighth in the total number of hotel rooms, third in the number of motel rooms, and sixth in the total number of food service establishments. This indicates that Pinellas County s tourism industry is strong when compared to the rest of Florida, a state known for its high tourist population. Tindale-Oliver & Associates June TDP
72
73
74
75 According to the St. Petersburg/Clearwater Area Convention and Visitor s Bureau, 5,254,255 people visited Pinellas County in 2006, with half staying in hotels and the other half staying at friends and relatives. Figure 3-2 shows the tourist population visiting Pinellas County Annual from 1990 to During that time, the annual tourist population in Pinellas County has increased 37 percent. The median income of Pinellas County visitors is $106,438 with an average head of household age of Airplane is the dominant mode of arrival to Pinellas County for visitors (72%) and the average length of visitor stays in the County is 6.8 days. The average trip budget for visitors is $2,270. Figure 3-3 provides a breakdown of the average trip budget for visitors to Pinellas County. Map 3-7 illustrates existing and projected hotel and motel units by TAZ for 2005 and Figure 3-2 Pinellas County Tourist Trends 5,500,000 Number of Visitors 5,000,000 4,500,000 4,000,000 3,500,000 3,000,000 Source: St. Petersburg/Clearwater Area Convention and Visitor s Bureau Tindale-Oliver & Associates June TDP
76 Figure 3-3 Pinellas County Average Tourist Trip Budget $1, $ $ $ $ $ $ $ $ $ $ $ $0.00 Accomodations Food/Entertainment Retail Purchases $ $ Rental Car Source: St. Petersburg/Clearwater Area Convention and Visitor s Bureau. Land Use Patterns and Major Trip Generators Land Use Patterns Pinellas County consists primarily of low-density residential development with strip commercial development along arterial roadways. The southern portion of the county in the St. Petersburg area is more densely-developed and built-out. The central portion of the county, which includes the Gateway area, contains the county s largest employment base and most of the county s vacant industrial land. The northern half includes large, low-density, single-family residential areas, a concentration of industrial land in the Oldsmar area, and large tracts of preservation land east of East Lake Road. Map 3-8 shows the growth in dwelling units from 2005 to 2015, and Map 3-9 shows the housing units per square mile by TAZ for Pinellas County (2005 and 2015). provides bus service to the more densely-populated areas in the county, including the US 19 and Sunset Point Road area, 66 th Street North and Tyrone Boulevard area, along 4 th Street North, Roosevelt Boulevard, and in and around the downtown areas of St. Petersburg and Clearwater. The remaining high-density areas are commercial regions along major arterial roadways, including US 19, 66 th Street, Gulf-to-Bay Boulevard, Bay Drive, Alternate US 19, and Ulmerton Road. The land use patterns in Pinellas County are not expected to change significantly during the 10-year transit planning horizon. Tindale-Oliver & Associates June TDP
77 Major Trip Generators The major trip generators in Pinellas County consist of hospitals, transportation facilities, shopping centers, major employers, government offices, sports/entertainment facilities, and the Central Business Districts (CBDs) in St. Petersburg and Clearwater. Specific generators include Tropicana Field, Clearwater/St. Petersburg Airport, and the commercial development areas designated by the local communities. The City of St. Petersburg is the only area with a CBD that functions as a major commercial retail and activity center. The City of Clearwater s downtown is primarily government activities and Church of Scientology functions. Map 3-10 shows the major trip generators and attractors in Pinellas County. Tindale-Oliver & Associates June TDP
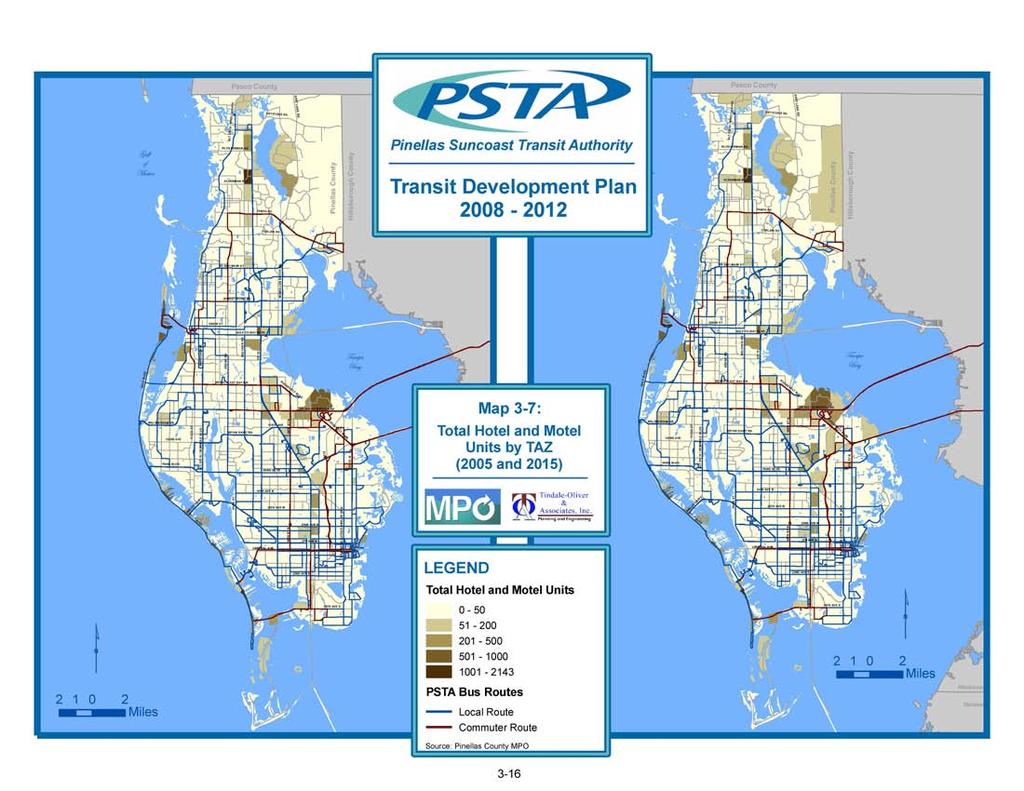
78
79
80
81
82 Developments of Regional Impact Developments of Regional Impact (DRIs) are large multi-use developments that influence a large region and are good indicators of future growth. The Tampa Bay Regional Planning Council is responsible for tracking DRIs and maintaining development agreements. Table 3-4 lists the approved DRIs in Pinellas County compiled from the data provided by the TBRPC. Map 3-11 depicts the coverage of the DRIs listed in Table 4. DRI # 3 Project Name Local Govt. Buildout Imperial Land Corp. of Clearwater (Highland Lakes) Table 3-4 DRIs in Pinellas County Development Parameters Total Land Use Approved Existing Pending Pinellas Withdrawn N/A N/A N/A N/A 12 Gateway St. Pete Withdrawn N/A N/A N/A N/A The Shoppes at Park Place East Lake Wooodlands Pinellas Park Not Appl. Pinellas Not Appl. None EXPIRED (4/30/1995) Total Acres Retail (SF/GLA) Theater (SF) (Seats) (Screens) Residential (MF #) Total Acres Residential (#) Retail (Acres) (GSF) ,000 90,000 4, ,146 3,334 Unspecifie d Unspecifie d ,373 N/A N/A 16 2, , Ramblewood Pinellas Withdrawn N/A N/A N/A N/A 24 Tarpon Lake Village (aka Lansbrook) Pinellas 5/13/04 Not Appl. 11/01/ /31/2009 Total Acres Residential (#) Retail (GSF) 4,000 8, , ,016 6, , North Lake Village St. Pete Withdrawn N/A N/A N/A N/A 56 Forest Lake Oldsmar Countryside Annexation II (U.S. Homes) USF Bayboro Harbor Campus Park Place (fka Metro) EXPIRED (11/17/1994) N/A N/A N/A N/A Clearwater Withdrawn N/A N/A N/A N/A St. Pete Not Appl. Clearwater 9/27/06 Total Acres EXPIRED School (GSF) (11/17/1994) (Students) 12/31/ /31/2008 Total Acres Office (GSF) Industrial (GSF) Retail (GSF) Residential/MF (#) 426,000 5, , ,000 81, N/A 344,000 1, , , ,000 85, Tindale-Oliver & Associates June TDP
83 Table 3-4 (continued) DRIs in Pinellas County DRI # Project Name Local Govt. Buildout Development Parameters Total Land Use Approved Existing Pending 97 St. Petersburg Intown Areawide St. Pete 4/25/06 12/30/ /30/2010 Total Acres Residential (#) Rooming Units (#) Office (GSF) Retail (GSF) Industrial (GSF) Boat Slips (#) Museum (GSF) Exhibit (GSF) Movie Theater (#) 458 2, ,696,865 1,170, , (Wet) 86,000 50, ,936 29, ,000 50, , , , (Wet) -147,927 21, Harbor Watch & Riverside Landings (aka Pointe Alexis N. & S.) Tarpon Springs 9/17/97 ABANDONED (7/02/2002) Total Acres Residential (#) Boat Slips (#) (Wet) St. Petersburg Intown Stadium St. Pete EXPIRED (2/03/1990) Total Acres Stadium (Seats) 66 46, , Tampa Bay Park of Commerce Pinellas See DRI #159 N/A N/A N/A N/A 111 Forest Lake/ Ph. II 121 Carillon 123 Bay Area Outlet Mall 132 Gateway Centre 134 Harborage at Bayboro 135 Cypress Lakes Oldsmar Not Appl. St. Pete 2/15/06 Largo 4/03/06 Pinellas Park/ St. Pete 11/13/06 St. Pete Oldsmar 7/27/06 BUILTOUT (7/27/2004) 12/31/ /31/ /01/ /01/ /31/ /31/2010 EXPIRED (12/07/1991) 7/14/2009 7/14/2009 Total Acres Residential (#) Retail Total Acres Office (GSF) Hotel (Rooms) Total Acres Reg. Mall (GLA) Total Acres Industrial (GSF) Office (GSF) Retail (GSF) Hotel (Rooms) Residential/MF (#) Auto Museum(GSF) Total Acres Boat Slips (#) Office (GSF) Total Acres Residential/SF (#) Residential/MF (#) Office (GSF) Retail (GSF) Hotel (Rooms) 381 2, , ,675, N/A 155, N/A 2,201, ,303 16, , ,807,425 2,529, , ,575 Not spec. 255 (Wet) 1, , , , , , , ,545 31, , (Wet) 1, , , Central Plaza St. Pete Withdrawn N/A N/A N/A N/A 137 Marina del Sol St. Pete Withdrawn N/A N/A N/A N/A 143 Feather Sound Commerce Center Pinellas Withdrawn N/A N/A N/A N/A Tindale-Oliver & Associates June TDP
84 DRI # Project Name Local Govt. Largo Mall (fka Carriage Hill Mall S/D) Trinity Communities Tampa Bay Park of Commerce S/D Largo Not Appl. Pasco/ Pinellas 1/09/06 Oldsmar/ Pinellas 7/28/06 Table 3-4 (continued) DRIs in Pinellas County Development Parameters Buildout Total Land Use Approved BUILTOUT (12/04/1998) 12/13/ /13/2020 6/01/2009 7/14/2010 Total Acres Retail (GSF) Total Acres Residential/SF (#) Residential/MF (#) Mobile Homes (#) Comm. Park (GSF) Retail (GSF) Med. Office (GSF) Nghd. Ctr. (GSF) Office (GSF) Hospital (Beds) Life Care (Units) Total Acres Industrial (GSF) Office (GSF) Retail (GSF) Residential (#) ,534 3,702 5,307 3,134 1,235 1,414,500 1,133, ,000 60,000 43, , , ,284 50,000 0 Existing N/A , , Pending N/A 2, , , , , , Bay Vista (fka Pioneer Center S/D) Largo 5/03/06 12/31/ /31/2010 Total Acres Office (GSF) Retail (GSF) 139 1,180,000 20, ,052,692 20, Rubin-ICOT Center Largo 8/29/05 12/31/ /31/2004 Total Acres Office (GSF) Industrial (GSF) Retail (GSF) Hotel (Rooms) College (Students) Resid./MF (Units) , , , , , , , , , Sheraton Sand Key Clearwater Not Appl. EXPIRED (3/03/1999) Total Acres Hotel (Rooms) Gateway Areawide Tierra Verde Marine Center Pinellas Co. Criminal Courthouse FQD St. Pete 4/26/06 Pinellas Not Appl. Pinellas 11/30/06 Ph1-12/30/2007 Ph2-12/30/ /30/2008 EXPIRED (7/01/1995) /31/2015 Total Acres Office (GSF) Industrial (GSF) Retail (GSF) Residential (#) Hotel (Rooms) Total Acres Boat Slips (#) Retail (GSF) Office (GSF) Total Acres Jail Expan. (GSF) (Beds) Court Expan. (GSF) 1,653 2,894,576 2,349, ,466 4, (Dry) 6,240 1, ,061,000 4, , , ,330,035 1,939,429 57, (Dry) 6,021 1,500 Not Spec. Not Spec. 500, ABR Tarpon Springs 11/25/02 ABANDONED (7/20/2004) Total Acres Office (GSF) Retail (GSF) ,000 50, Source: Tampa Bay Regional Planning Council (TBRPC). Note: List of DRIs as of 01/17/07. Contact TBRPC for additional information. Tindale-Oliver & Associates June TDP
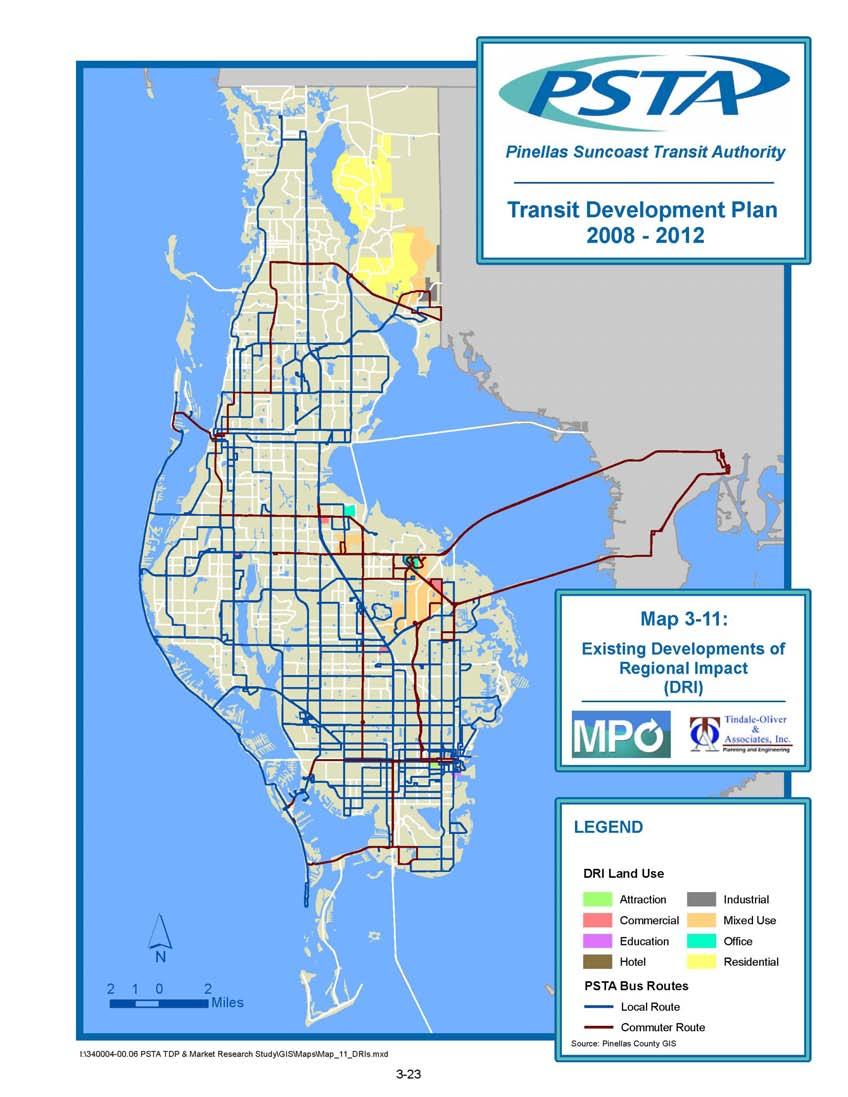
85
86 COMMUTING PATTERNS The commuting patterns are based on the 2000 Census and, therefore, the data included here are the same as the data from the previous TDP. According to the 2000 Census, 13 percent of the work trips terminating in Pinellas County originate outside the County, an increase of 3 percent since The analysis of Census data shows that 86 percent of the worker population works in Pinellas County, while 12 percent commutes to neighboring counties. The commuter flow increased from 1990 to 2000 due largely to the residential development occurring in Pasco County and western Hillsborough County. In addition, work commuter flows also increased to Manatee and Hernando counties over the same time period. Table 3-5 summarizes the place of work for workers residing in Pinellas County, while Table 3-6 reflects the number of people commuting to Pinellas County from neighboring counties. County of Residence Pinellas County (2000) Pinellas County (1990) Table 3-5 County of Work for Workers Residing in Pinellas County, 2000 County of Work Number of Workers Pinellas County Hillsborough County Pasco County Hernando County Manatee County Sarasota County Other Tindale-Oliver & Associates June TDP Total 360,285 44,000 5, , , ,625 % DISTRIBUTION 86.1% 10.5% 1.3% 0.1% 0.3% 0.2% 1.6% 100.0% Number of Workers 332,695 32,150 3, , ,906 % DISTRIBUTION 88.3% 8.5% 1.0% 0.1% 0.2% 0.2% 1.7% 100.0% PERCENT CHANGE ( ) 8.3% 36.9% 40.0% 40.9% 56.3% -1.1% 2.2% 11.1% Source: 2000 Census commuter flow data and 2002/06 TDP. Note: Data represent number of workers 16 years old and over in the commuter flow. Pinellas County (2000) Pinellas County (1990) County of Work Table 3-6 Commuting from Neighboring Counties to Pinellas County, 2000 County of Residence Number of Workers Pinellas County Hillsborough County Pasco County Hernando County Manatee County Sarasota County Other Total 360,285 25,175 21,073 1,537 2, , ,714 %DISTRIBUTION 87.1% 6.1% 5.1% 0.4% 0.6% 0.1% 0.6% 100.0% Number of Workers 332,695 16,783 14,286 1, , ,841 %DISTRIBUTION 90.0% 4.5% 3.9% 0.3% 0.2% 0.1% 1.0% 100.0% PERCENT CHANGE 8.3% 50.0% 47.5% 42.2% 209.0% 16.0% 28.6% 11.9% ( ) Source: 2000 Census commuter flow data and 2002/06 TDP. Note: Data represent number of workers 16 years old and over in the commuter flow.
87 EXISTING TRANSIT SERVICES System Operating Characteristics Service Area operates buses on 37 fixed bus routes (33 local routes and 4 circulators) and seven commuter routes providing transit service coverage to 21 of the 24 incorporated communities plus the unincorporated area of Pinellas County. Service is not provided to Kenneth City, Belleair Beach, and Belleair Shores. provides service to St. Pete Beach and Treasure Island through a 5-year contract to provide transit service, although the areas are not part of the Transit Authority. In addition, provides demand response service to persons with disabilities in accordance with the Americans with Disabilities Act (ADA) requirements. Map 3-12 shows the s fixed-route system as of January Facilities In 2005, moved into its new administration, operation, and maintenance facility located at 3201 Scherer Drive in St. Petersburg. This new facility replaced the garage facilities located on 28 th Street South in St. Petersburg and the garage and administrative facility on 49 th Street North in Mid-County. This facility allows to operate from one central location with additional space for service expansion. The new facility can accommodate up to 125 administrative personnel, 160 maintenance personnel, 600 bus operators, and 300 buses. Ridership Fixed-route bus ridership increased from 9.4 million in FY 2000/01 to 10.1 million in FY 2001/02, an increase of 7.9 percent; decreased in FY 2002/03 by 6.2 percent to 9.5 million, and then increased again in FY 2003/04 and FY 2004/05 to 10.2 million, an increase of 7.55 percent. Over this same period, demand response ridership increased from 239,777 to 255,413, an increase of just over 6.5 percent. Fixed-route ridership continued to increase in FY 2005/06 to 11.0 million; an increase of another 8.0 percent. Level and Frequency of Service Seventeen routes (excluding commuter routes and community circulators) have weekday service headways of 30 minutes or less. With the exception of Route 82 (over 60-minute headways), commuter, and circulator services, all other routes have weekday headways of 60 minutes. Service hours vary by route and run from 4:55 a.m. to 12:30 a.m. during the week and 4:55 a.m. to 9:35 p.m. on weekends. Transfer Sites has 3 major transfer terminals, including Williams Park in St. Petersburg, Park Street in Clearwater, and Central Plaza in St. Petersburg. Major improvements were made to the Park Street terminal in 2002, including a new customer service booth, benches, bathrooms, security cameras, etc. Central Plaza Intermodal Terminal opened in February 2002 and serves as a major transfer hub with an array of transit amenities. Other transfer sites include: Tyrone Square Mall, Gateway Mall, The Shoppes at Park Place, Largo Mall, the 34 th Street Transfer Center at, Tarpon Mall, 25 th Way and Roy Hanna Drive, Clearwater Mall, Westfield Countryside, Seminole Mall, and Indian Rocks Shopping Center. Tindale-Oliver & Associates June TDP
88 Route Coverage has a weekday fleet requirement of 171 buses in the peak hour, 44 percent more buses than in The southern half of Pinellas County is well served, which is consistent with the urban land uses and high densities in the City of St. Petersburg. The northern half of the county is more difficult to serve as land uses and densities are not as high as in the south county and the roadway system did not develop as a grid pattern. Table 3-7 shows selected operating statistics for the fixed-route system in FY 2005/2006. Table 3-7 Selected Fixed-Route Operating Statistics, FY 2005/2006 Routes Annual Revenue Miles Annual Revenue Hours Local/Line Haul 8,054, ,226 Commuter/Express 453,189 23,504 Shuttle/Circulator 43,030 4,004 Source:. Total 8,550, ,734 Existing and Potential Park-and-Ride Facilities There are four existing park-and-ride facilities in Pinellas County. While three of the existing lots are used by, the fourth lot in Clearwater is owned and maintained by the City of Clearwater and used by the Hillsborough County Area Regional Transit Authority (HART) for Commuter Route 200X, operating between Clearwater and Tampa. Table 3-8 shows the location, condition, and site specifications for these four lots and five other lots currently not in use. often takes inventory of these sites and uses that information to determine which park-and-ride facilities are the most successful, as well as which lots require improvements. On the date of the last inspection, 38 percent of the spaces were being used (this excludes the park-and-ride lot served by HART Route 200X). The park-and-ride sites in Pinellas County are designed predominantly for inter-county commuters traveling to and from work or for commuters traveling long distances. FDOT District 7 has identified potential sites in its Regional Park-and-Ride Lot Plan. According to FDOT staff, this plan, which was developed prior to the 2002/06 TDP, is the most recent document ranking the potential park-and-ride sites. Further discussions with the FDOT District 7 staff also revealed that no update for the plan is scheduled in the near-future. Table 3-9 shows the top 9 potential park-and-ride sites based on this plan, and a potential parkand-ride site selected by staff. Each of the first 9 sites in the table is ranked according to a number of criteria ranging from connectivity to the public transportation system, to safety and other criteria. A weighted score is determined for each potential site and is commonly referred to as a utilization score. FDOT research has shown that the higher the score, the more successful the site will be. Map 3-13 shows the locations of the existing and potential parkand-ride facilities in Pinellas County. Tindale-Oliver & Associates June TDP
89
90 Table 3-8 Park-and-Ride Facilities in Pinellas County City Location Spaces Usage Signs Markings Access Owner/ Maintained By Condition Date Inspected Transit St. Petersburg 22nd Avenue N. at 19th Street (and I-275) Poor advanced signage Good OK FDOT/ Good March, 2006 Route #22 Oldsmar SR 580 just west of Commerce 20 0 Poor advanced signage Good Good - WB FDOT/ Good March, 2006 Route #93 St. Petersburg Clearwater Pinellas County Largo Derby Lane Calvary Baptist US 19, S of Curlew Rd Ulmerton, East of Starkey No Longer in Use No Longer in Use No Longer in Use Good Good Good / Good March, 2006 Route #300X Pinellas County Ulmerton Road at 125 th St. No Longer in Use Pinellas County Stoneybrook Drive No Longer in Use Pinellas County Drew St. east of Hampton 30 5 Good Good Good City of Clwtr/Clwtr Parks Dept Good March, 2006 Route #200X Source: and FDOT-District Improvements planned include: re-seal and re-stripe, fix the sidewalk, replace broken parking stops, and additional signs as needed. Table 3-9 Potential Park-and-Ride Sites Location FDOT Utilization Score Site Information Route Access US 19/SR Clearwater Mall #19, 60, 62 Alternate US 19/Ulmerton Road Largo Mall #18 & th Street/22 nd Avenue Tyrone Square Mall Major Transfer Point US 19/Tarpon Road Strip Shopping Mall #19 & rd Street/9 th Avenue Gateway Mall Major Transfer Point US 19/Park Boulevard Park Side Mall Major Transfer Point US 19/SR Westfield Shopping Town Major Transfer Point SR 584/East Lake Road Shoppes at Boot Ranch #62, & 93 Alternate US 19/Park Boulevard Seminole Mall #18, 74, th Street South n/a Bayfront Medical Center #100 Source: FDOT-District 7 and. Tindale-Oliver & Associates June TDP
91
92 Other Transit Services is the largest provider of transit services in Pinellas County. However, there are other public and private firms offering services for specific groups of transit users. Table 3-10 shows the other transit providers that provide social service related public transportation services in Pinellas County. This list consists of private, non-profit firms that provide service to the transportation disadvantaged (TD) population in Pinellas County. Table 3-11 shows a list of other transit providers that serve the general public. This table also provides selected operating characteristics. Agency Table 3-10 Inventory of TD Transit Service Providers Address Type of Provider Care-Ride, LLC Clearwater Yellow Cab Lighthouse of Pinellas, Inc. Medfleet Systems, Inc. Neighborly Care Network Pinellas Association for Retarded Children (PARC)* United Cab Upper Pinellas Association for Retarded Citizens (UPARC)* VIP Wheelchair Transport, Inc. Wheelchair Transport Service, Inc. Agency for Community Treatment Services, Inc. (ACTS) Alpha A Beginning, Inc. Boley Centers, Inc. Girls, Inc. Goodwill Industries, Inc st Avenue Pinellas Park, FL U.S. 19 N. Clearwater, FL th Circle N., Suite 103 Largo, FL U.S. 19 N., Suite A Clearwater, FL C 49 th Street N. Clearwater, FL Tyrone Boulevard N. St. Petersburg, FL U.S. 19 N., Suite A Clearwater, FL N. Belcher Road, Suite 249 Clearwater, FL P.O. Box Clearwater, FL th Avenue N., Suite 309 Largo, FL North 56 th Street Tampa, FL th Avenue N. St. Petersburg, FL st Street N. St. Petersburg, FL st Street N. Pinellas Park, FL Gandy Boulevard St. Petersburg, FL Brokered Brokered Brokered Brokered Brokered Brokered Brokered Brokered Brokered Brokered Coordinated Coordinated Coordinated Coordinated Coordinated Tindale-Oliver & Associates June TDP
93 Agency Table 3-10 (continued) Inventory of TD Transit Service Providers Address Type of Provider Gulf Coast Community Care City of Gulfport Louise Graham Regeneraton Center Operation PAR, Inc. Personal Enrichment Through Mental Health Services, Inc. Suncoast Center for Community Mental Health, Inc. Van Gogh Pallette, Inc. dba Vincent House ICOT Boulevard Clearwater, FL rd Street S. Gulfport, FL Third Avenue S. St. Petersburg, FL th Street N. Pinellas Park, FL th Street N. Pinellas Park, FL Central Avenue, P.O. Box St. Petersburg, FL th Avenue N. Pinellas Park, FL Coordinated Coordinated Coordinated Coordinated Coordinated Coordinated Coordinated Source: Pinellas County Transportation Disadvantaged Service Plan. Note: Brokered Providers broker TD trips to transportation carriers and Coordinated Providers, under contract with the Community Transportation Coordinator (CTC), provide TD service within the designated area. Tindale-Oliver & Associates June TDP
94 Table 3-11 Inventory of Other Transit Services Pinellas County Name Type Ownership Special Agreement Service Area Service Period Service Freq. Clients Vehicles Seating Capacity Daily Ridership Reg. Fare Special/ Wheelchair Accessible Prepared ADA Plan Coord. with St. Pete Pier Shuttle Fixed- Route City of St. Petersburg Contract w/ Urban Retail Property St. Pete Pier Area 7:30 a.m.- 1 a.m. 5 min. All types 3 Trolleys 2 Trams Trolley: 39 Tram: 23 Approx per day Free Trolleys are Wheelchair accessible Yes No The Looper Trolley ( Operating Subsidy) Fixed- Route The Looper Group, Inc. Contract w/ Bay to Bay Aves. 5N - 11S; Pier to 4th Street Sun.-Thurs. 11 a.m.- 5 p.m. Fri.-Sat. 10 a.m.-12 p.m. 15 min. Tourists, Residents, Seniors, Disabled 5 Minitrolley: 32 Trolley: avg. $0.25 All vehicles are wheelchair accessible No Yes Gulfport Extended Minibus Service (GEMS) Demand Response City of Gulfport None City of Gulfport Mon.-Fri., No holidays Varies Residents, Seniors over 55, Disabled 1 bus, 1 minivan, 1 car Buses: 14 Minivan: 10 Car: 4 Approx. 70 $3/ride; $120/yr. Buses & Minivans are wheelchair accessible No No Greyhound Bus Lines (St. Petersburg) Fixed- Route Intercity Bus Company None All of United States 365 days N/A All types N/A Avg. $100 Yes Yes No Greyhound Bus Lines (Clearwater) Fixed- Route Intercity Bus Company None All of United States 365 days 6 a.m.-9 p.m. N/A All types N/A Avg. $100 Yes Yes No Jolly Trolley Fixed- Route City of Clearwater None Clearwater Sun-Sat 10 a.m.-9 p.m. 25 min. All types 9 32 N/A $ vehicles are wheelchair accessible Yes Yes Tarpon Springs Trolley Fixed- Route Operation by City using vehicles Contract w/ for Vehicle Lease City of Tarpon Springs Tue-Thurs. 11 a.m.-5 p.m., Fri.- Sat. 11 a.m.-5 p.m., Sun min. All types avg. $1/ride; $3 all day Yes No Yes a.m.-5 p.m. Tindale-Oliver & Associates June TDP
95 Table 3-11 (continued) Inventory of Other Transit Services Pinellas County Name Type Ownership Special Agreement Service Area Service Period Service Freq. Clients Vehicles Seating Capacity Daily Ridership Fare Special/ Wheelchair Accessible Prepared ADA Plan Coord. with Gulfport Trolley Special Services Operation by City using vehicle Service Plan City of Gulfport N/A N/A N/A 1 45 N/A Free Yes N/A Yes Mon-Fri: Hillsborough Area Regional Transit (HART) Fixed- Route Public Authority None Hillsborough County and 200X from Clearwater to Tampa 365 days 4:35 a.m.- 12:05 a.m. Varies by route All types 189 buses (156 peak vehicles) 40 approx. 23,000, Sat: 9,500, Sun: 4,600 $1.50 Local, $2.50 Express Yes Yes Yes, for 100X, 200X, and 300X, Pasco County Public Transit (PCPT) Fixed- Route Pasco County None East and West Pasco Mon-Fri: 4:50 a.m.- 8:50 p.m. 60 min. All 27 buses (14 peak vehicles) 22 to 33 2,000 $0.50 Yes Yes Yes Mon-Sat: Manatee County Area Transit (MCAT) Fixed- Route Manatee County None Southwest County Bus: 6 a.m.-7 p.m. Trolley: 6 a.m.-10:30 Bus: 60 min. Trolley: 20 min. All 25 Bus: 35 Trolley: N/A 3,500 Bus: $1 Trolley: Free Yes Yes Yes p.m. Source: and other transit providers. Tindale-Oliver & Associates June TDP
96 Transportation Disadvantaged Population Estimates The State of Florida Transportation Disadvantaged program is designed to provide public transportation to those who cannot transport themselves due to physical, mental, income, or age related disabilities. This is different from those who qualify for the ADA Paratransit program, although eligibility for one does not necessarily disqualify a person for the other. Based on the 2004/07 Pinellas County Transportation Disadvantaged Service Plan, the total number of persons estimated to be transportation disadvantaged in Pinellas County was 119,734 in The projected transportation disadvantaged population for Pinellas County in 2007 is 122,633. This includes disabled and low-income, and non-disabled and low-income individuals with no access to an automobile. According to the operating data from Commission for the Transportation Disadvantaged (CTD), the Pinellas County received revenues from CTD at the amount of 1,640,000 dollars in 2005 and 1,686,187 in 2006, respectively, indicating a 3 percent increase. Additionally, the Agency for Health Care Administration (AHCA) (Medicaid) also granted 1,656,080 dollars in 2005 and 3,111,597 dollars in 2006 to the Pinellas County, with nearly 88 percent increase from the previous year. EXISTING ROADWAY NETWORK Pinellas County s roadway system is primarily a grid system with several primary north-south routes and a system of east-west roadways providing connections. The major north-south roadways are US 19, Alternate US 19, McMullen-Booth Road, Missouri Boulevard, Starkey/Keene Road, and Belcher Road. Primary east-west routes are Park Boulevard, Bay Drive, Ulmerton Road, Tampa Road, Gulf-to-Bay Boulevard, SR 580, and Sunset Point Road. Northern and southern Pinellas County have different roadway systems. Southern Pinellas County consists of a more traditional grid system with avenues oriented east-west and number streets oriented north-south. Northern Pinellas County consists of more suburban development with arterial roads providing access to subdivisions that have limited connections to the road network. Roadway Level of Service The MPO publishes a Roadway Level of Service Report on an annual basis. According to the data used in the 2006 Roadway Level of Service Report, based on 2005 base data, the average peak-hour peak-direction Vehicle Miles of Travel (VMT) for 2006 was 875,366. The 2006 Roadway Level of Service Report shows that, of the 2,423 lane miles included in the Pinellas County Roadway Network, 24 percent, or 593 miles, are reported as deficient. Figures 3-4 through 3-7 illustrate the trends in vehicle miles traveled, vehicle miles of capacity, percentage of roadways operating over capacity, and the total center-line miles in Pinellas County between 2004 and Roadway deficiencies are expected to decrease through 2008/09 due to the Tindale-Oliver & Associates June TDP
 Vehicle Miles of Capacity (VMC) Figure 3-6 Figure 3-7 % Roadways")

 for is presented below.")
. In addition, Table 3-12 presents the dollar value for each item presented in the POP.")
97 MPO s planned roadway improvements. Map 3-14 displays the level of service for all of Pinellas County in Figure 3-4 Figure 3-5 Peak-Hour Vehicle Miles of Travel (VMT) Vehicle Miles of Capacity (VMC) Figure 3-6 Figure 3-7 % Roadways Above Capacity Network Center-Line Miles PLANNED IMPROVEMENTS Two programs of planned improvements are presented here. The Program of Projects provides an overview of various transit capital related improvements planned for FY 2006/07, while the MPO s Transportation Improvement Program (TIP) provides the priorities for implementing transportation improvements. Program of Projects - FY 2006/07 The project justification for the FY 2006/07 Program of Projects (POP) for is presented below. The POP summarizes the capital needs for that year based on the Section 5307 Formula Fund allocations by the Federal Transit Administration (FTA). In addition, Table 3-12 presents the dollar value for each item presented in the POP. Tindale-Oliver & Associates June TDP
98 Table 3-12 Program of Projects FY 2006/07 Item # Description Cost Replacement Buses (to replace the 9600s) $5,003, Replacement Buses (to replace Trolleys) $2,249, Replacement Buses (to replace 9700s) $1,949, Purchase Bus Parts $1,000, Transit Security Services $160, Purchase and Install Passenger Shelters $250, Purchase and Install Bicycle Racks $12,000 Subtotal $10,623, Contingency (5%) $531, Administration (1%) $106,239 Source: FY Program of Projects. Grand Total $11,261,334 Purchase Fifteen 40 Replacement Buses These buses would replace 1996 model buses which are 40 buses. These buses are on a 12-year replacement schedule and will be eligible for replacement next year. All of these buses currently have in excess of 500,000 miles. Purchase Six 35 Replacement Buses These buses would replace model Trolleys, which are on a 7-year replacement schedule. While these are standard transit coaches, each will include a Trolley themed appearance, with the comfort and system components of a lowfloor bus. Purchase Six 35 Replacement Buses These buses would replace 1997 model clean diesel buses. The 1997 model buses are in excess of 500,000 miles and therefore eligible for replacement. Purchase Bus Parts Major bus parts used in the maintenance of the bus fleet will be purchased and will include engine, transmissions, alternators, etc. Transit Security Services This line item funds security services at s Park Street and Central Plaza Terminals. 25 Passenger Shelters will purchase and install up to 25 new passenger shelters including slabs. 25 Bicycle Racks will purchase 25 bike racks (sets of two) to be placed at strategic bus stops. Tindale-Oliver & Associates June TDP
99 Transportation Improvement Program The TIP provides the priorities for implementing transportation improvements and allocates funding for transportation projects based on the MPO goals and objectives stated in the Long Range Transportation Plan (LRTP). The TIP also contains a five-year schedule of transportation improvements, including highways, bus system, airport, and seaport improvements. The most recently adopted TIP is for fiscal years 2006/07 through 2010/11. Programmed roadway projects are listed below by year. The project number is included in parentheses. Map 3-15 shows the future roadway improvements funded by the current State Five-Year Work Program. In addition, Map 3-16 and Map 3-17 show the County Six-Year Work Program (FY ) and Municipal Street Improvements Program (FY 2007/08-FY 2011/12), respectively. FY 2006/07 49 th Street North From 38 th Avenue North to Lake Boulevard ( ) Sidewalk on both sides. 54 th Avenue North At 28 th Street ( ) Left turn lanes, signals for east and west movements on 54 th. I-175 (SR 594) From the east end of Bridge # to 4 th Street South ( ) 4 lane pavement rehabilitation. I-275 (SR 93) From 62 nd Avenue North to North of Gandy Boulevard ( ) 4 lane pavement rehabilitation. I-275 (SR 93) From 54 th Avenue South to 54 th Avenue North ( ) ITS Freeway Management Tampa Bay Sunguide Phase 2. I-275 (SR 93) From 26 th Avenue South to 5 th Avenue South ( ) 6 lane pavement rehabilitation. I-275 (SR 93) Skyway Bridge ( ) Painting. Pinellas County SR 595, SR 60, SR 694 ( ) Drainage improvements. Pinellas County Advanced traffic management system ( ) ITS communication system. SR 666 (Gulf Boulevard) From the beginning of Bridge # to the end of Bridge # ( ) Bridge repair and rehabilitation. SR 682 (Pinellas Bayway) From west of SR 679 to SR 699 (Gulf Boulevard) ( ) Bridge replacement and add lanes. SR 686 From east of US 19 to west of 49 th Street ( ) Install lighting poles. SR 686 From east of CR 611 to Ulmerton Road ( ) 6 lane resurfacing. Tindale-Oliver & Associates June TDP
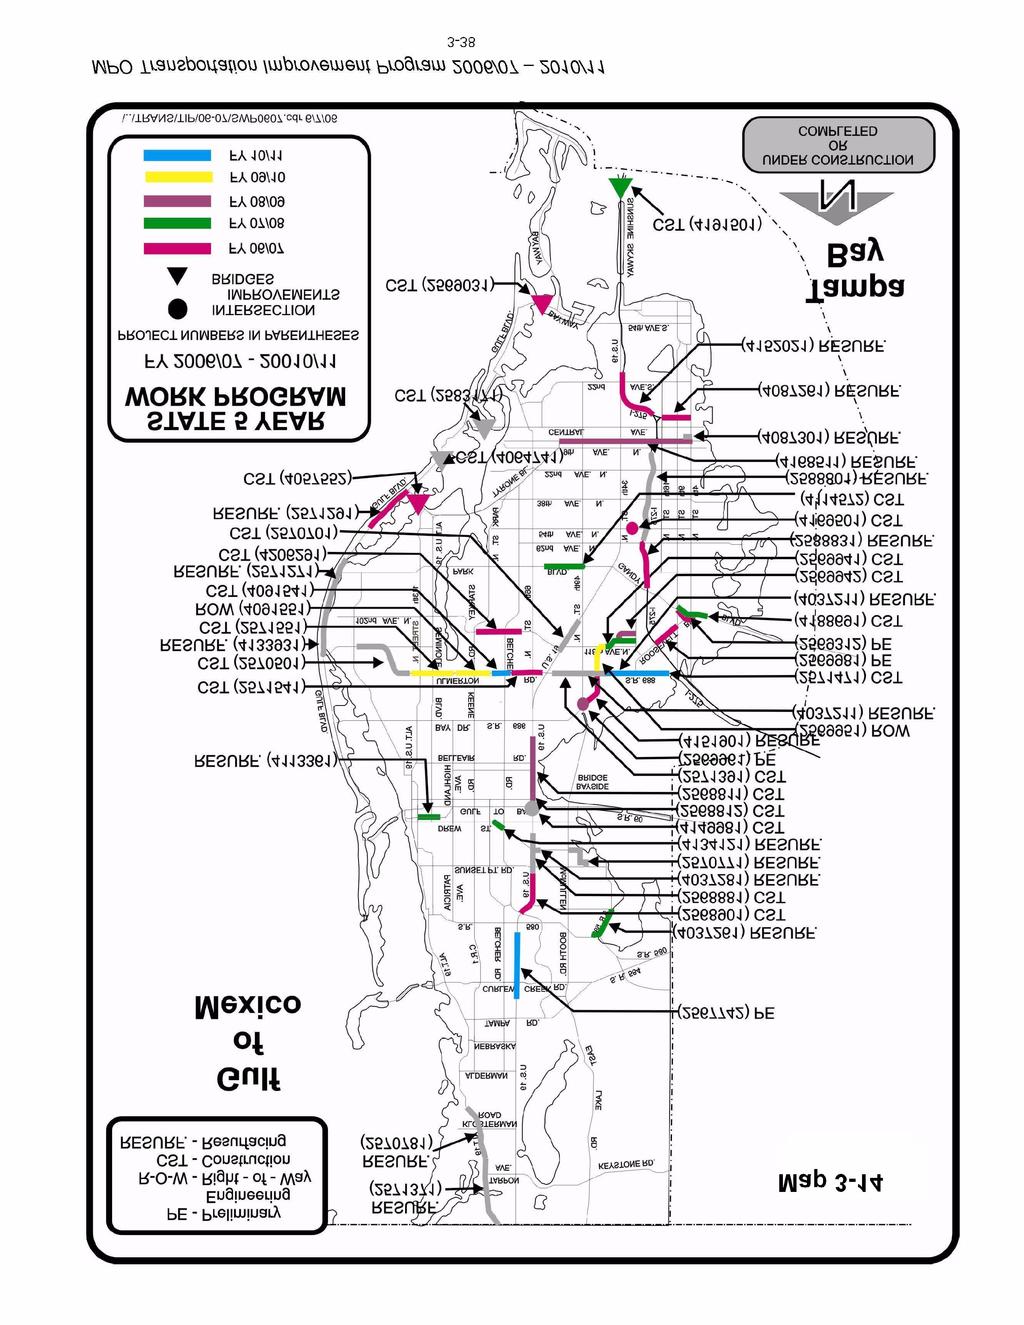
100 3-38
101
102 3-40
103 SR 688 (Ulmerton Road) From El Centro/Ranchero to west of US 19 ( ) Add lanes and reconstruct, 4 to 6 lanes. SR 699 (Gulf Boulevard) From north of SR 666 to north of Colony Circle ( ) 4 lane resurfacing. Tampa Road At Country Place Apartments ( ) Directional median opening. US 19 (SR 55) from north of Sunset Point Road to south of Countryside Boulevard ( ) Reconstruct US 19 with Frontage Road, Enterprise Interchange. US 92 (SR 687/4 th Street) From 5 th Avenue to 30 th Avenue North Sidewalk construction. FY 2007/08 4 th Street South From Pinellas Point Drive South to 45 th Avenue South ( ) Bike lane on both sides. 54 th Avenue South From 34 th Street to 41 st Street ( ) Bike lane on both sides. Bryan Dairy Road From Starkey Road to 72 nd Street ( ) Add lanes, 4 to 6 lanes. Gandy Boulevard from Martin Luther King, Jr. Boulevard to Brighton Bay ( ) Add lanes, 4 to 6 lanes. Drainage Improvements SR 594, 651, 686, 60 ( ) Rehab existing drainage structures and pipes. I-275 (SR 93) From South Sunshine Skyway Bridge to 54 th Avenue South ( ) ITS Freeway Management Tampa Bay Sunguide Phase 4A. I-275 (SR 93) Northbound and Southbound Skyway Bridge ( ) Bridge repair & rehabilitation. I-275 (SR 93) From 0.3 miles south of 38 th Avenue to 26 th Avenue South ( ) Guardrail. Pinellas County ITS ( ) Primary Control Center. Pinellas County Various Locations ( ) Resurfacing repairs. SR 590 (Northeast Coachman Road) From west of Old Coachman Road to west of Coachman Crossing ( ) 2 lane resurfacing. SR 590 (Phillipe Parkway) From CR 638 to SR 580 ( ) 2 lane resurfacing. SR 60 (Cleveland Street) From Myrtle Street to Fredrica Lane ( ) 5 lane resurfacing. SR 686 From east of 40 th Street to west of 28 th Street ( ) New 4-lane road. SR 694 (Park Boulevard) ( ) Drainage improvements. US 19 (SR 55) Various median closures ( ) At various intersections. FY 2008/ th Avenue at 43 rd Street ( ) Directional median opening. Alt US 19 (SR 595) From 4 th Street to 58 th Street ( ) 4 lane resurfacing. Tindale-Oliver & Associates June TDP
104 City of St. Pete Lake Maggiore Bike Lanes 22 nd Street South and 26 th Street South ( ) Bike path. City of St. Pete Pinellas Point/Lakewood various points ( ) Bike path. SR 686 from Northbound I-275 to Westbound SR 692 ( ) New ramp construction. Tampa Road At Cornerstone Center Drive ( ) Directional median opening. Tampa Road At Strathmore Gate Drive ( ) Directional median opening. US 19 (SR 55) From north of Whitney Road to south of Seville Drive ( ) Reconstruct US 19 with Frontage Road, Belleair Interchange. US 19 (SR 55) From south of Seville Drive to north of SR 60 ( ) Reconstruct US 19 with Frontage Road, Seville Interchange. US 19 (SR 55) Trail Crossing Bayside Segment ( ) Interchange. FY 2009/10 SR 688 (Ulmerton Road) From east of 119 th Street to west of Seminole Bypass ( ) Add lanes and reconstruct, 4 to 6 lanes. FY 2010/11 SR 688 (Ulmerton Road) From west of 38 th Street to west of I-275 ( ) Add lanes and reconstruct, 4 to 6 lanes. SR 688 (Ulmerton Road) From Wild Acres Road to Elcentro/Ranchero ( ) Add lanes and reconstruct, 4 to 6 lanes. SUMMARY OF PERTINENT CONDITIONS While the use of public transportation to work increased from 1990 to 2000, transit s share of commuting trips decreased between 2000 and 2005 from 1.9 percent to 1.4 percent. In addition, the number of households with no vehicle available dropped from 9.2 percent in 2000 to 3.5 percent in This has been the case despite transit-favorable income changes developing in Pinellas County. Pinellas County s median household income grew slower than the inflation rate from $37,111 in 2000 to $40,694 in Nevertheless, each area of Pinellas County appears to have an opportunity for increased public transportation considering that, when compared to other Florida counties, Pinellas County is better suited to transit service (given density and reaching build-out conditions) than all but the most urbanized. Three major demographic aspects that play a large role in the demand for transit are analyzed below in terms of their impact on transit ridership within Pinellas County. Tindale-Oliver & Associates June TDP
105 Population Pinellas County population has increased by less than 3 percent between 2000 and 2006, according to U.S. Census estimates. Population density is the highest of all Florida counties, making Pinellas County an ideal area for transit growth. In addition to the year-round population, the 2000 Census found that 7.1 percent of houses, or 34,111 houses, in Pinellas County were retained for seasonal, recreational, or occasional use. The Pinellas County Planning Department estimates that 78,116 people take up seasonal residence in the County each year, and the impact that tourists have on the use of public services and facilities in the County was estimated to be equivalent to that of 91,018 residents in The additional impact of the tourist and seasonal resident population serves to increase the population density above the 3,384 persons per square mile estimated for 2006, making Pinellas County even more conducive to effective public transportation. The population share of those over the age of 65 years has decreased slightly between 2000 and 2005, from 22.5 percent of the population in 2000 to 20 percent of the population in The population share of those under the age of 19 has increased slightly from 21.1 percent in 2000 to 22.2 percent in Economy Economic conditions in Pinellas County are becoming more conducive to transit use in Pinellas County. While the unemployment rate has increased from 4.3 percent in 2000 to 5.4 percent in 2005, the civilian labor force in Pinellas County increased from 58.2 percent to 59.7 percent of the population over the age of 16 during the same time period, according to the 2005 American Community Survey. The percent of the population below the poverty level has increased from 10.0 percent to 11.1 percent between 2000 and As stated previously, during this same time period, the County median household income has not kept pace with inflation, increasing from $37,111 to $40,694, an increase of less than 10 percent. These trends, in conjunction with fluctuating fuel prices, suggest an increased propensity for transit use, because those with lower incomes are more likely to use transit than those with higher incomes. Cost of Housing The cost of housing has been increasing rapidly in Pinellas County, and outpacing the growth in average income. Figure 3-8 shows the median cost of housing in Pinellas County compared with the median household income. While the cost of housing has increased more than 72 percent between 2000 and 2005, the median household income has increased less than 10 percent. Tindale-Oliver & Associates June TDP
106 Mobility Characteristics According to the U.S. Census, the percentage of households with no vehicles decreased from 9.2 percent in 2000 to 8.4 percent in Households with 2 or more cars increased from 43.9 percent to 45.8 percent during that same time period. Mean travel time to work has increased in Pinellas County from 23.6 minutes in 2000 to 24.2 minutes in Increased auto ownership is not conducive to transit use. In addition, its primary impact is that there will be more automobile travel and, hence, greater congestion levels on existing roadways. This is most likely a factor in the increase in mean travel time to work, along with the greater distances traveled suggested by the county-to-county flow data that was presented in Tables 3-5 and 3-6. The end result of increased congestion, though, will be the desire for increased roadway capacities and/or mobility alternatives like transit. Given the built-out condition of Pinellas County, as discussed previously, it will become increasingly difficult and expensive to expand roadways, this, combined with the continuing fluctuation in the price of fuel could lead to a continued increase in the utilization of existing, and demand for increased, transit services. $180,000 $160,000 $140,000 $120,000 $100,000 $80,000 $60,000 $73,500 Figure 3-8 Housing Costs and Household Income Median Cost of Housing Median Household Income $96,500 $166,200 $40,000 $20,000 $26,296 $37,111 $40,694 $ Source: 1990 and 2000 Census, and 2005 American Community Survey. Tindale-Oliver & Associates June TDP
107 Section 4 EXISTING SERVICE LEVELS INTRODUCTION The Pinellas Suncoast Transit Authority provides service to Pinellas County. The county is the smallest, yet most densely populated county in Florida with a population of over 900,000. Presently, has over 500 employees and 200 buses and serves 21 of the 24 communities in Pinellas County plus unincorporated areas. The current operating budget for FY 2006/07 is $55,794,830. Of this amount, 67.7 percent is generated from ad valorem taxes from the 19 communities participating in the Authority (excluding Belleair Beach, Belleair Shores, Kenneth City, St. Pete Beach, and Treasure Island) and property within unincorporated Pinellas County. St. Pete Beach and Treasure Island, which are not part of the Authority, contract with for transit services. Approximately 18.0 percent is from passenger revenues, and another 10.2 percent of revenue is from state and federal grants. The remaining 4.1 percent is derived from special transit fares, auxiliary revenue (i.e., bus and shelter advertising), investment income, non-transportation revenue, State of Florida reimbursement for fuel taxes, and purchased service (see Table 4-1 and Figure 4-1). 's routes can be generally categorized as a hub and spoke system with three major hubs: downtown St. Petersburg, Central Plaza, and downtown Clearwater. The weekday peak fleet requirement of 171 buses includes service enhancements programmed for The Saturday vehicle requirement is 100 buses; while the Sunday/Holiday service requirement is 65 buses (see Tables 4 5, 4 6, 4-7, and 4-8). Total annual route miles are currently 10,614,539 and total annual operating hours are currently 697,504 (see Table 4-9). Table 4-1 s Adopted FY 2006/07 Operating Budget Revenue Source Revenue Generated % of Total Budget Ad Valorem Taxes $37,746, % Passenger Revenue $10,070, % State & Federal Grants Fuel Tax Reimbursement & Misc. Revenue $ 5,699, % $ 2,278, % TOTALS $55,794, % Tindale-Oliver & Associates June TDP
108 Figure 4-1 Operating Budget by Revenue Source Passenger Revenue18.0% Fuel Tax Reimbursement & Miscellaneous Revenue 4.1% State & Federal Grants 10.2% Ad Valorem Taxes 67.7% FIXED-ROUTE SERVICE LEVELS operations currently include 33 local routes, 5 commuter routes, 2 express routes, and 3 community circulators [i.e., Route 32, Pinellas Park Shuttle (Route 444), and Municipal Service Center Shuttle (Route 111)]. Map 4-1 depicts the fixed-route system. Figures 4-2 and 4-3 illustrate the transit service population within a quarter-mile and threequarter mile dimension of the fixed-route network, respectively. sustained ridership growth which began in FY 1993/94 and continued through FY1999/00. The total change in ridership from FY 1993/94 to FY 1999/00 is 1,843,294 additional passenger trips (19.0% increase). Total ridership increased 2.06 percent in FY 1999/00, declined in FY 2000/01 and FY 2001/02; and rebounded in FY 2002/03, FY 2003/04, FY 2004/05, and FY 2005/06 (see Table 4-2 and Figure 4-2). Table 4-2 Total Fixed-Route Ridership Fiscal Year Total Ridership % Change From Previous Year 1993/94 7,858, % 1994/95 7,975, % 1995/96 8,271, % 1996/97 8,719, % 1997/98 9,077, % 1998/99 9,505, % 1999/00 9,701, % 2000/01 9,690, % 2001/02 9,289, % 2002/03 9,487, % 2003/04 9,701, % 2004/05 10,226,584* 5.83% 2005/06 11,141,770* 8.95% * Includes Looper ridership of 105,259 and 120,419 in FY 2004/05 and 2005/06, respectively. Tindale-Oliver & Associates June TDP
109 Figure 4-2 Total Fixed-Route Ridership Total Ridership 12,000,000 10,000,000 8,000,000 6,000,000 4,000,000 2,000, / / / / / / / / / / / / /06 Ridership Productivity Overall, ridership exceeded 11 million in FY 2005/06 with a system-wide average of passengers per revenue hour, and 1.29 passengers per revenue mile (see Table 4-3). In FY 2005/06, Medicaid Bus Pass ridership increased percent, wheelchair passenger ridership increased 5.85 percent, and bicycle ridership increased percent. Both Routes 18 and 19 topped the 1 million mark for overall ridership with a combined total of 2,446,477 passenger trips in FY 2005/06. At this level, Routes 4, 18, 19, 52, and 59 carry 44 percent of all passengers, and this ridership continues to increase (see Table 4-3). Ridership has also increased on the Circulator Routes by 3.36 percent, Express Routes by 6.60 percent and Commuter Routes by percent. Thus far in FY 2006/07, ridership has increased 3.02 percent system-wide, with very significant growth on Routes 5, 18, 22, 58, 67, 73, 78, 79, and 80 (see Table 4-4). also experienced significant year-to-date increase of percent for Bikes-On-Buses due to the elimination of the bike permitting requirements, the use of three-bike carriage racks (to replace two bike racks), and continued overall ridership growth. Service Frequency Fourteen (42%) of 's fixed routes (excluding commuter routes, express routes, and community circulators) have peak-hour frequencies of 30 minutes and four (12%) provide peakhour frequencies of 20 minutes or less. The Pinellas Park Shuttle, which serves as a community circulator, operates with service frequencies greater than 60 minutes, and Route 32, which provides circulator service in the downtown St. Petersburg area, has 30-minute service Tindale-Oliver & Associates June TDP
110 frequency during off-peak hours. Fourteen of the remaining fifteen fixed routes have 60-minute, peak-hour frequency Fares Riding with is a terrific value with a regular cash fare or unlimited rides with a Daily, GO Card. The 7-Day or 31-Day Unlimited Ride GO Cards are also available. Commuters traveling between Pinellas County and Tampa on the 100X and 300X can save 10 percent on every ride with the 20-ride Premium GO Card. Senior citizens and persons with disabilities may ride for a reduced cash fare or use a reduced fare GO Card with an original Medicare card or a Photo ID card. Students may ride for a reduced cash fare also with a Photo ID card. Passenger fares are an important revenue source for operations, and the current fare structure was put in place in October GO Cards are available at Customer Service Centers and 21 authorized outlets throughout Pinellas, Hillsborough, and Pasco County. Passengers can purchase a Daily Go Card on board the bus. Photo ID cards are available at the Customer Service Centers. The current fare structure is presented on the following page. Tindale-Oliver & Associates June TDP
111 FARE STRUCTURE (EFFECTIVE ) Child (5 years and under except on 100X & 300X)... Free Full Cash Fare (Cash or Token)... $ 1.50 Special Citizen Reduced Cash Fare with ID*... $.75 Student Reduced Cash Fare with ID*... $ 1.00 Route 100X and 300X Premium Cash Fare ***... $ 2.50 Daily Full Fare Unlimited Ride GO Card... $ 3.50 Daily Reduced Fare Unlimited Ride Go Card... $ DayUnlimited Ride GO Card $ Day Unlimited Ride GO Card... $ Day Reduced Fare Unlimited Ride GO Card*.... $ Ride Premium GO Card (Routes 100X & 300X)***... $ Premium Cash Fare (tokens not accepted)... $ 2.50 Special Citizen Reduced Premium Cash Fare*... $ 1.25 Passport... $ Day Youth Platinum Pass... $ Summer Youth Haul Pass... $ Demand Response Cash Fare**... $ Ride Punch Ticket... $ Ride Demand Response Punch Ticket**... $ BULK DISCOUNT PROGRAM Purchase 100 through 299 tokens... Save 5% Purchase 300 or more tokens... Save 10% Purchase 200 or more tokens or passes (purchased by 501(c)(3) & government agencies Save 10% *Proper ID must be shown prior to paying a reduced fare or using a reduced fare GO Card. Students are not eligible for reduced fare GO Cards. photo ID cards cost $250 each and can be obtained at a Customer Service Center, as well as selected ticket outlets. **Demand Response Service for people who, because of their disability, are unable to independently use the regular, accessible buses. Certification and reservations are required.. ***Medicare Cardholders and Senior/Disabled Citizens with issued Photo ID may pay reduced cash fare of $.75 on select trips. Students are not eligible for this discount and reduced fare GO Cards will not be accepted. Good for unlimited travel during the stated calendar month on all and HART buses and trolleys. Youth ID required except for elementary age school children Tindale-Oliver & Associates June TDP
112
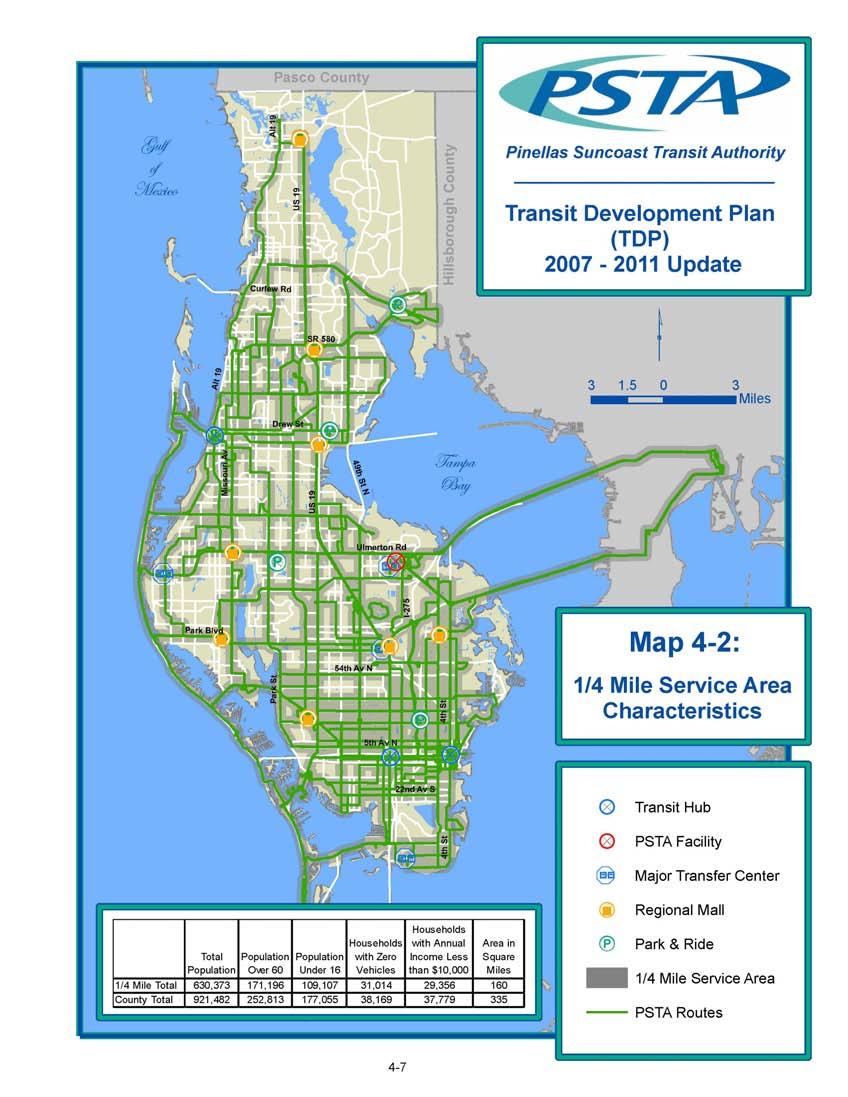
113
114
 Tindale-Oliver & Associates June 2007 4-9")
115 Table 4-3 Ridership Analysis FY 2005/06 (October 2005 September 2006) Tindale-Oliver & Associates June TDP
116 Table 4-4 Ridership Analysis FY 2006/07 (October 2006 March 2007) PASSENGERS REVENUE PASSENGERS REVENUE TOTAL TOTAL WHEELCHAIR WHEELCHAIR BICYCLE BICYCLE MEDICAID MEDICAID PER REV. HOUR HOURS PER REV. MILE MILES RIDERSHIP RIDERSHIP PERCENT PERCENT PERCENT PASSENGERS PASSENGERS PERCENT CHANGE CHANGE PASSENGERS PASSENGERS CHANGE PASSENGERS PASSENGERS CHANGE FY 2006/07 FY 2006/07 FY 2006/07 FY 2006/07 FY 2006/07 FY 2005/06 FY 2006/07 FY 2005/06 FY 2006/07 FY 2005/06 FY 2006/07 FY 2005/ , , ,327 26, % % % % , , , , % 2,730 2, % 8,168 6, % 15,104 13, % , , ,715 88, % % 1,790 1, % 3,491 2, % , , ,779 92, % % 1, % 2,686 4, % , , , , % % 2,374 1, % 1,950 1, % , , , , % % 1,747 1, % 4,870 4, % , , ,977 80, % % 1, % 2,979 2, % , , , , % 3,862 3, % 17,269 11, % 10,725 6, % , , , , % 3,042 3, % 24,476 14, % 9,498 5, % , , ,646 87, % % 1, % 2,253 1, % , , ,309 24, % % % % , , , , % % 1,485 1, % 2,510 2, % , , ,803 22, % % % % , , , , % % 5,739 5, % 4,931 4, % , , ,908 78, % % 1,692 1, % 1,487 1, % , , , , % 2,084 1, % 12,821 9, % 12,112 9, % , , ,505 57, % % 3,144 2, % % , , , , % 1,155 1, % 8,061 5, % 5,327 3, % , , , , % % 5,789 3, % 3,037 1, % , , ,477 92, % % 1,511 1, % 1, % * , , ,589 72, % % 2,508 2, % 1,718 1, % * , , , , % % 3,474 3, % 1, % , , ,709 48, % % 2,115 1, % % , , ,881 49, % % 1,328 1, % % , , ,842 58, % % 2,301 1, % % , , , , % 1,855 2, % 7,981 6, % 4,295 2, % , , ,605 59, % % 1,629 1, % % , , ,324 47, % % 1, % % , , ,652 71, % % 2,046 1, % % , , , , % 1,801 1, % 6,378 4, % 5,530 3, % , , ,359 61, % % 2,658 1, % % , , ,742 24, % % % % Suncoast Beach Trolley SM , , , , % % 4,500 4, % 1, % SUBTOTAL , ,176, ,433,816 5,318, % 26,269 24, % 140,569 99, % 104,339 81, % (75% of AVG) SHUTTLE/CIRCULATOR ROUTES PASSENGERS REVENUE PASSENGERS REVENUE TOTAL TOTAL WHEELCHAIR WHEELCHAIR BICYCLE BICYCLE MEDICAID MEDICAID SHUTTLE/CIRCULATOR PERCENT PERCENT PER REV. HOUR HOURS PER REV. MILE MILES RIDERSHIP RIDERSHIP PASSENGERS PASSENGERS PERCENT CHANGE ROUTE CHANGE PASSENGERS PASSENGERS CHANGE PASSENGERS PASSENGERS PERCENT FY 2006/07 FY 2006/07 FY 2006/07 FY 2006/07 FY 2006/07 FY 20005/06 FY 2006/07 FY 2005/06 FY 2006/07 FY 2005/06 FY 2006/07 FY 2005/06 CHANGE , ,987 16, % % % % , ,913 6, % % % % * , ,029 3, % % % % , % % % % SUBTOTAL , , ,818 28, % % % % (75% of AVG) COMMUTER ROUTES PEAK-HOUR PASSENGERS REVENUE PASSENGERS REVENUE TOTAL TOTAL WHEELCHAIR WHEELCHAIR BICYCLE BICYCLE MEDICAID MEDICAID COMMUTER PER REV. HOUR HOURS PER REV. MILE MILES RIDERSHIP RIDERSHIP PERCENT PASSENGERS PASSENGERS PERCENT CHANGE PASSENGERS PASSENGERS PERCENT PERCENT CHANGE PASSENGERS PASSENGERS CHANGE ROUTES FY 2006/07 FY 2006/07 FY 2006/07 FY 2006/07 FY 2005/06 FY 2004/05 CHANGE FY 2006/07 FY 2005/06 FY 2006/07 FY 2005/06 FY 2006/07 FY 2005/ , ,886 14, % % % % , , ,102 9, % % % % , , ,041 8, % % % % , , ,265 4, % % % % , ,713 14, % % % % SUBTOTAL , , ,007 52, % % 2,360 1, % 1, % (75% of AVG) EXPRESS SERVICE PASSENGERS REVENUE PASSENGERS REVENUE TOTAL TOTAL WHEELCHAIR WHEELCHAIR BICYCLE BICYCLE MEDICAID MEDICAID EXPRESS PER REV. HOUR HOURS PER REV. MILE MILES RIDERSHIP RIDERSHIP PERCENT PERCENT PERCENT PASSENGERS PASSENGERS PERCENT CHANGE CHANGE PASSENGERS PASSENGERS CHANGE PASSENGERS PASSENGERS CHANGE ROUTE FY 2006/07 FY 2006/07 FY 2006/07 FY 2006/07 FY 2006/07 FY 2005/06 FY 2006/07 FY 2005/06 FY 2006/07 FY 2005/06 FY 2006/07 FY 2005/ , , ,147 30, % % % % , , ,906 16, % % % % SUBTOTAL , , ,053 47, % % 1,078 1, % % (75% of AVG) Sub-Totals , ,292, ,575,694 5,445, % 26,651 25, % 143, , % 106,143 82, % Special Service Revenue** 85 GRAND TOTAL , ,414, ,575,694 5,445, % 26,740 25, % 144, , % 106,143 82, % 301, ,422, *Routes which fall below performance standards (i.e. 75% of AVG) for passengers per revenue hour and passengers per revenue mile are noted at the end of each fiscal year **Special Revenue Service includes Airport Fire Department, Alternative Transportation Week, Clearwater Jazz Fest, Dunedin High School, Federal Transit Association, Oldsmar Oktoberfest, Stuff-A-Bus, Pinellas County Economic Development Department, Pinellas County Department of Public Affairs, Pinellas Park Christmas Parade, and Pinellas County Sheriff's Department Tindale-Oliver & Associates June TDP
117 Table 4-5 Service Profile for Fixed Route Includes Budgeted Route Schedule Changes FY Daily Route Miles Daily Route Hours Service Headway Service Period AM/PM Vehicle Requirements Route No. M-F SAT Sun M-F SAT SUN M-F SAT SUN M-F SAT SUN M-F Peak M-F Off Peak SAT SUN min. 60 min. 60 min. 7:15/6:10 7:15/6:10 9:15/6: , , min. 30 min. 30/60 min. 5:10/11:05 5:10/11:05 7:15/6: /60 min. 60 min. 90 min. 5:30/8:35 5:30/8:35 7:15/7: /60 min. 60 min. 60 min. 5:40/8:15 5:35/8:10 6:25/8: min. 60 min. 120 min. 5:55/7:40 5:55/7:40 7:50/6: min. 30 min. 90 min. 5:35/9:00 6:05/8:00 6:50/6: /60 min. 60 min. 60 min. 5:15/8:45 5:15/8:45 7:15/6: , , /30 min. 30 min. 60 min 5:00/12:05 5:10/10:30 7:05/8: , , /30 min. 30 min. 60 min 5:15/11:45 5:00/10:45 6:20/7: min. 60 min. 60 min. 5:20/7:20 5:20/7:20 7:15/6: None None 60 min. 60 min. None 5:50/7:35 5:50/7:35 None min. 30 min. 60 min. 5:20/8:40 5:20/8:40 8:20/6: None None 60 min. 60 min. None 5:10/6:30 5:10/6:30 None None None 30 min. 30 min. None 8:50/4:15 8:50/4:15 None min. 60 min. 120 min. 5:50/9:45 5:50/9:45 7:50/6: , min. 60 min. 60 min. 4:45/11:45 4:55/9:35 7:05/8: , /60 min. 60 min. 60 min. 4:50/8:25 5:35/8:25 5:35/8: , min. 60 min. 60 min. 5:05/9:45 5:15/9:45 5:15/9: min. 30 min. 30 min. 5:05/11:10 5:05/9:35 7:25/9: min. 60 min. 90 min. 5:25/8:15 5:25/8:15 7:15/6: None None 60 min. 90 min. None 5:30/8:55 6:40/7:00 None min. 60 min. 120 min. 5:10/8:10 5:10/8:10 7:55/6: None None 60 min. 60 min. None 6:00/7:00 6:00/7:00 None None None 60 min. 60 min. None 5:55/6:45 5:55/6:45 None , min. 60 min. 60 min. 5:10/10:00 5:45/8:45 8:15/6: min. 60 min. 60 min. 5:30/8:40 5:30/8:40 6:00/8: min. 60 min. 90 min. 6:00/6:50 6:00/6:50 8:45/6: /60 min. 60 min. 90 min. 6:20/7:55 6:25/7:55 7:45/5: , min. 60 min. 60 min. 5:30/8:45 5:35/8:05 7:50/6: None None 120 min. 120 min. None 5:25/6:15 5:25/5:45 None :05/8: None None 4.34 None None 10 min. None None 4:10/5:45 None None None None 5.42 None None 150 min. None None 9:05/2:15 None None DAILY TOTALS 28, , , , , ANNUAL TOTALS 7,224, , , , , , Indicates Routes to be enhanced in June 2007 Tindale-Oliver & Associates June TDP
118 Table 4-6 Commuter Routes Daily Route Miles Daily Route Hours No. of One-Way Trips Service Period AM/PM Vehicle Requirements Route No. M-F SAT Sun M-F SAT SUN M-F SAT SUN M-F SAT SUN M-F Peak M-F Off Peak SAT SUN 7:05/9:35 7:05/9:35 7:05/9: :00/6:10 4:20/6:30 4:20/6: :00/9: None None None None 6 3:25/6:45 None None :45/8: None None None None 10 3:50/6:55 None None :15/9: None None None None 8 3:05/6:30 None None :45/8: None None None None 6 3:40/5:40 None None DAILY TOTALS 1, ANNUAL TOTALS 309, , , Table 4-7 Express Routes Daily route Miles Daily Route Hours Service Headway Service Period AM/PM Vehicle Requirements Route No. M-F SAT Sun M-F SAT SUN M-F SAT SUN M-F SAT SUN M-F Peak M-F Off Peak SAT SUN 100X None None None None 30 min. None None 11:10/7:40 None None X None None None None 30 min. 11:00/7:55 None None DAILY TOTALS 1, ANNUAL TOTALS 331, , Route Daily Route Miles Daily Route Hours Table 4-8 Extended Night & Trolley Service Service Headway No. Sun-Thurs Fri-Sat Sun-Thurs Fri-Sat Sun-Thurs min min min. Suncoast Beach Trolley SM 1, , min. Service Period 5:20/11:10 6:00/10:20 Vehicle Requirements Fri- Sat Sun-Thurs Fri-Sat Sun-Thurs Fri-Sat 30 min. 5:50/9:15 5:50/12: min. 5:50/9:40 5:50/11: min. 5:25/10:30 5:25/12: min. 4:55/10:45 4:55/12: DAILY TOTALS 3, , ANNUAL TOTALS 867, , , , The annual total was calculated by multiplying the daily total for 254 Weekdays, 52 Saturdays and 59 Sundays/Holidays The annual total was calculated by multiplying the Sun-Thurs by 261 and Fri-Sat total by 104 Tindale-Oliver & Associates June TDP
119 Table 4-9 Existing Fixed-Route Service Levels (FY 2006/2007) FY 2006/07 Total Annual Route Miles Total Annual Route Hours Table 1-5 8,734, , Table , , Table , , Table 1-8 1,231, , Totals* 10,614, , *These figures include deadhead and report time. DEMAND RESPONSE TRANSPORTATION Demand response trip volumes increased significantly from 111,631 one-way passenger trips in FY 1990/91 to 189,314 one-way passenger trips in FY 1993/94 (a percent increase). Table 4-10 and Figure 4-3 reflect the change in total trip volume. Table 4-10 Growth In Demand Response Trip Volume Fiscal Year Total Ridership % Change From Previous Year 1993/94 189, % 1994/95 166, % 1995/96 179, % 1996/97 183, % 1997/98 192, % 1998/99 237, % 1999/00 249, % 2000/01 242, % 2001/02 239, % 2002/03 242, % 2003/04 257, % 2004/05 255, /06 258, % Tindale-Oliver & Associates June TDP
120 Figure 4-3 Growth in Demand Response Trip Volume 300, , , , ,000 50, / / / /00 Total Ridership 2001/ / /06 Demand response passenger volume increased percent from FY 1995/96 through FY 1990/00. Ridership decreased 2.84 percent in FY 2000/0l and 1.06 percent in FY 2001/02, and increased by 1.09 percent in FY 2002/03 and 6.26 percent in FY 2003/04. In FY 2004/05, ridership decreased slightly by 0.8 percent, but then increased by 1.26 percent in FY 2005/06 (sees Table 4-10 and Chart 4-3). Thus far in FY 2006/07, ridership has increased 3.68 percent over the same period of the previous year (see Table 4-11). Table 4-11 FY 2006/07 Demand Response Ridership Analysis Passengers Passengers Percent MONTH FY 2006/07 FY 2005/06 CHANGE October 23,088 21, % November 21,651 21,567.39% December 20,928 20,779.72% January 22,281 21, % February 21,097 20, % March 23,215 21, % TOTALS 132, , % Prior to October 1995, private operators were responsible for the provision of a large portion of demand response trips. In order to achieve additional cost savings, amended its contract with these local operators to allow for complete privatization of all functional areas of demand response service provision, effective October Privatization also presented an opportunity to proceed with full next-day scheduling earlier than anticipated. As a result, implemented full next-day scheduling effective January 1996, rather than January 1997 as proposed. Tindale-Oliver & Associates June TDP
121 budgeted $4.4 million in FY 2006/07 for demand response service, which is approximately 7.91 percent of the annual operating budget. A bid for demand response service was completed in the summer of 2003, and new contracts were awarded at the beginning of FY 2003/04 (i.e., October 2003). This procurement was the result of a Request for Proposals (RFP) process that considers a variety of factors, not just pricing. All buses purchased or leased by public transit operators after August 1990 are required to have one wheelchair lift or ramp, two wheelchair securement locations (for vehicles in excess of 22 feet in length), mobility aid securement devices, and a public address system for announced stops. While the Americans with Disabilities Act (ADA) implementing regulations require complementary paratransit service for those persons whose disability prevents use of the fixedroute system, it is expected that as new equipment and facilities are put into place, transportation for persons with disabilities will largely be provided by fixed-route services. With full privatization of demand response service provision, the unit cost per passenger trip declined from $14.12 in FY1994/95 to $9.52 in FY 1995/96 (i.e., a decrease of 32.6 percent). While unit costs for demand response service increased in FY 1996/97 and FY1997/98, a dramatic increase occurred in FY 1998/99 as new bid rates went into effect. These trends in increased unit costs continued from FY 1999/00 to FY 2005/06. Combined unit costs for both the fixed-route and demand response systems declined percent from FY 1994/95 through FY 1998/99; then increased percent from FY 1999/00 through FY 2004/05. As ridership increased 8.76 percent in FY 2005/06 the combined unit cost decreased in FY 2005/06, even with a 6.75 percent increase in expenses (see Table 4-12). Total ridership increased by 3,352,501 passenger trips, or approximately percent since FY 1993/94 (see Table 4-13). Tindale-Oliver & Associates June TDP
122 Table 4-12 Operation Costs Cost per Passenger Trip by Fiscal Year (FY 1994/ /06) Fiscal Year System Total Expenses Total Trips Unit Cost per Trip 1994/95 FIXED ROUTE $23,868,898 7,975,651 $ 2.99 DEMAND RESPONSE $ 2,354, ,711 $ TOTAL SYSTEM $26,223,404 8,142,414 $ /96 FIXED ROUTE $24,214,840 8,271,908 $ 2.93 DEMAND RESPONSE $ 1,707, ,346 $ 9.52 TOTAL SYSTEM $25,922,669 8,451,254 $ /97 FIXED ROUTE $24,136,823 8,719,071 $ 2.77 DEMAND RESPONSE $ 1,865, ,637 $10.77 TOTAL SYSTEM $26,001,870 8,902,708 $ /98 FIXED ROUTE $24,483,123 9,077,502 $ 2.70 DEMAND RESPONSE $ 2,077, ,236 $10.81 TOTAL SYSTEM $26,560,555 9,269,738 $ /99 FIXED ROUTE $24,155,732 9,505,696 $ 2.54 DEMAND RESPONSE $ 3,090, ,305 $13.02 TOTAL SYSTEM $27,246,189 9,743,001 $ /00 FIXED ROUTE $26,369,717 9,701,963 $ 2.72 DEMAND RESPONSE $ 3,394, ,437 $13.61 TOTAL SYSTEM $29,763,782 9,951,400 $ /01 FIXED ROUTE $28,706,597 9,690,296 $ 2.96 DEMAND RESPONSE $ 3,664, ,353 $15.12 TOTAL SYSTEM $32,370,716 9,932,649 $ /02 FIXED ROUTE $29,917,237 9,289,701 $ 3.22 DEMAND RESPONSE $ 3,808, ,777 $15.88 TOTAL SYSTEM $33,725,271 9,529,478 $ /03 FIXED ROUTE $32,832,830 9,487,637 $ 3.46 DEMAND RESPONSE $ 4,089, ,383 $ TOTAL SYSTEM $36,922,426 9,730,020 $ /04 FIXED ROUTE $35,676,304 9,701,063 $ 3.68 DEMAND RESPONSE $ 4,375, ,560 $16.99 TOTAL SYSTEM $40,051,794 9,958,623 $ /05* FIXED ROUTE $37,982,193 10,226,584 $ 3.71 DEMAND RESPONSE $ 4,459, ,490 $17.45 TOTAL SYSTEM $42,441,859 10,482,074 $ /06* FIXED ROUTE $40,833,249 11,141,770 $3.66 DEMAND RESPONSE $4,473, ,714 $17.29 TOTAL SYSTEM $45,306,795** 11,400,484 $3.97 NOTE: Expenses for the demand response system exclude fare revenues collected by s contract carrier. *Total fixed-route ridership includes Looper ridership of 105,259 and 120,419 in FY 2004/05 and FY 2005/06 respectively. Demand Response expenses include subsidy for Looper service. ** Expenses for FY 2005/06 are un-audited. Tindale-Oliver & Associates June TDP
123 Table 4-13 Total Ridership FY 1993/ /06 Fiscal Year Fixed Route Demand Response Combined Total Percent Change 1993/94 7,858, ,314 8,047,983 N/A 1994/95 7,975, ,711 8,142, % 1995/96 8,271, ,346 8,451, % 1996/97 8,719, ,637 8,902, % 1997/98 9,077, ,236 9,269, % 1998/99 9,505, ,305 9,743, % 1999/00 9,701, ,437 9,951, % 2000/01 9,690, ,353 9,932, % 2001/02 9,289, ,777 9,529, % 2002/03 9,487, ,388 9,730, % 2003/04 9,701, ,560 9,958, % *2004/05 10,226, ,413 10,482, % *2005/06 11,141, ,714 11,400, % TOTALS 120,647,511 2,894, ,541, % Note: Total ridership increase of 41.66% from 1993/94 to 2005/06. *This figure includes Looper ridership of 105,259 in FY 2004/05 and 120,419 in FY 2005/06. 12,000,000 Figure 4-4 Ridership FY1993/ /06 10,000,000 8,000,000 FIXED ROUTE 6,000,000 DEMAND RESPONSE 4,000,000 2,000, / / / / / / / / / / /04 *2004/05 *2005/06 Tindale-Oliver & Associates June TDP
124 Tindale-Oliver & Associates June TDP
125 Section 5 MILESTONES INTRODUCTION An ongoing program of annual service enhancements over a period of several years facilitated intra-county travel, improved customer service, and influenced ridership growth. To date, these service enhancements include new service on major travel corridors, improved service frequency on the most productive fixed routes, improved passenger amenities, and improved terminal facilities. A number of demand response procedural revisions have also been implemented, and achieved full compliance with Americans with Disabilities Act (ADA) complementary paratransit service requirements effective January MILESTONE ACHIEVEMENT FIXED-ROUTE SERVICE accomplished its original TDP priority of full Comprehensive Operations Analysis (COA) implementation in FY 1993/94. As a result of COA implementation, an ongoing program of service improvements and growth in employment, ridership increased to more than 9.7 million in FY 2003/04 and passenger revenue exceeded $8 million for the first time. This very favorable trend continued in FY 2004/05 and FY 2005/06. Since FY 2001/02, ridership has grown by 1,731,650 to over 11 million last fiscal year (see Table 5-1). Fiscal Year Table 5-1 Operating and Financial Characteristics Fixed-Route System FY 1999/00 FY 2005/06 Fixed- Route Ridership Operating Expenses Passenger Revenue Operating Ratio 1999/00 9,701,963 $26,369,717 $7,562, % 2000/01 9,690,296 $28,706,597 $7,747, % 2001/02 9,289,701 $29,917,237 $7,817, % 2002/03 9,487,637 $32,832,830 $7,985, % 2003/04 9,701,063 $35,676,304 $8,060, % 2004/05 10,226,584 $37,982,193 $8,252, % 2005/06 11,141,770 $40,833,249 $8,996, % Note: These figures exclude expenses and revenues for purchased transportation to provide demand response service, as well as contract service with the City of St. Petersburg and South Pasadena. Expenses and passenger revenue for FY 2005/06 are un-audited. Total fixed-route ridership includes Looper ridership of 105,259 and 120,419 in FY 2004/05 and FY 2005/06, respectively. Tindale-Oliver & Associates June TDP
126 Fiscal Year 2006/07 Service Development Projects 1. Improved Peak-Period Service Frequency: Routes 59 and 74 are programmed for enhancement to provide 20-minute, peak-period service frequency, effective June Improved Weekday Service Frequency: Routes 4 and 60 are programmed for enhancement to provide 15- and 20-minute service frequency, respectively, for weekday service, effective June These service enhancements provide a nucleus of very frequent fixed routes for intra-county trips (see Map 5-1). 3. Evening Service: Later evening service was added to Routes 11, 18, 38, 52, 61, 62, 66, and 79 effective with the February 11, 2007, service modifications. Routes 59, 60, and 74 will have evening service improvements in June Transfer Center Upgrade: The Central Plaza Intermodal Terminal rehabilitation project included concrete, sewer, and utility repair to correct structural defects and provide additional clear space for bus movements. A new transfer center was established on South Clearwater Beach for connections between the Suncoast Beach Trolley SM and Route 80. Both of these projects were completed in February In May 2007, the transfer center on 25 th Way S. and Roy Hanna Drive in South St. Petersburg (served by Routes 4, 11, 20, and 90) was upgraded to provide an improved boarding platform area, with access from the bus stop area to the adjacent street and crosswalk area. 5. Technology Improvements: The installation of Automatic Passenger Counters (APCs) on 15 buses is currently underway. These units record passenger activity by stop and utilize sensors that record wheelchair ramp and bike rack deployments, as well. This information will be utilized to identify bus stop locations for new passenger amenities, monitor ridership activity by time of day, and review running time and schedule adherence by route segment. 6. Trip Planner: Rollin is s new automated trip planner software and the latest upgrade to.net. Effective April 1, 2007, "Rollin the Trip Planner" provides schedule and trip planning information to transit customers through the InfoLine and via the web, including any transfers and even walking time to bus stops. Travel planning is available 24/7, including weekends and holidays. The web component will allow bus riders to plan their trip by entering addresses, landmarks, or intersections. They will also be able to customize the trip using three criteria: shortest walking distance, least number of transfers, or by the quickest route. A trip plan summary can also be printed by the customer or sent via . Tindale-Oliver & Associates June TDP
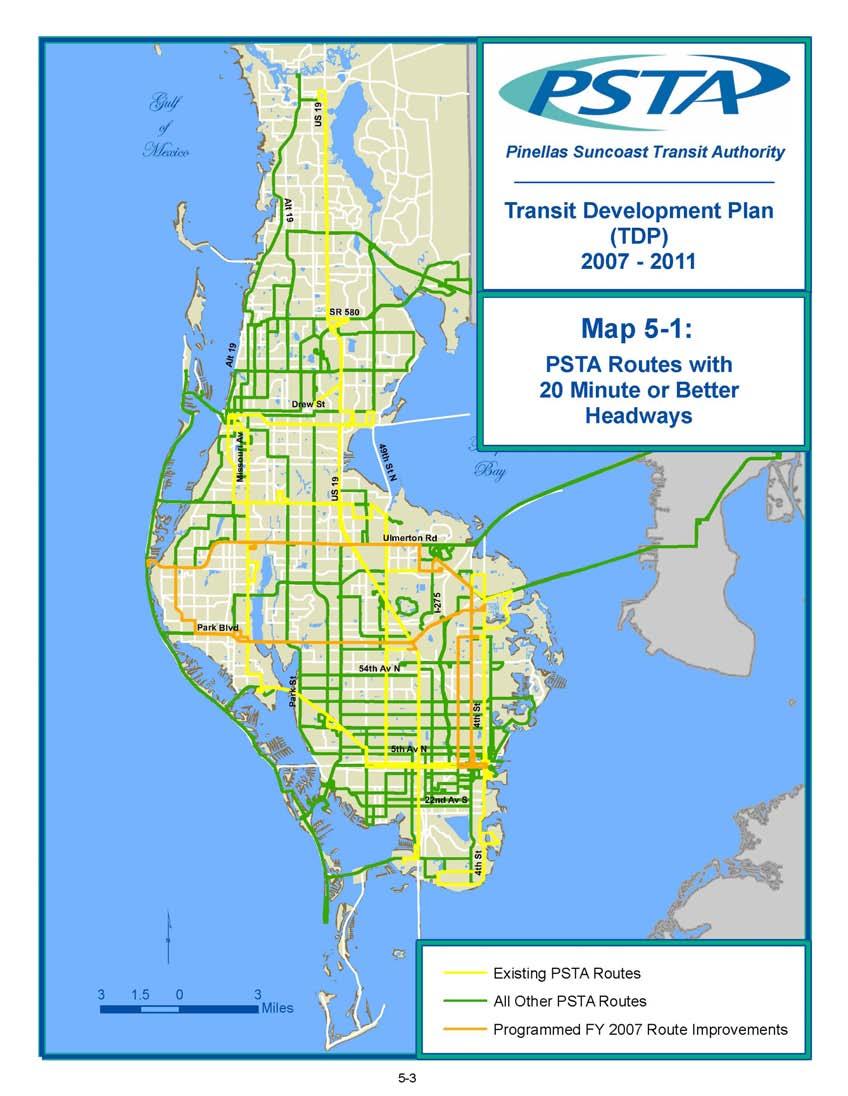
127
128 The call center component allows Customer Service Representatives to locate addresses rapidly and explain to customers how to get from Point A to Point B using the transit network. Alternate routes can be suggested depending on the caller's particular needs and desires. For example, some people want the quickest overall route, while others wish to minimize walking. A trip plan summary can also be printed for the customer. Prior Year Service Development Projects 1. New Route: Effective February 26, 2006, Commuter Route 97 was initiated to serve commuters traveling between St. Petersburg and mid-county. This route serves the Central Avenue and 49th Street North corridors connecting Williams Park with the Carillon Business Complex and the Pinellas County Criminal Justice Center. 2. Route Deviation: Concurrent with implementation of new Commuter Route 97, Route 52 service was deviated to serve the new off-street transfer facility on 34th Street North in midcounty. This facilitates off-street connections for six mid-county routes including: Routes 11, 52, 59, 96, 97, and Improved Peak-Period Service Frequency: Effective September 24, 2006, Routes 5, 7, 15, and 78 were enhanced to provide 30-minute peak-service frequency. At the same time, six buses were added to Route 18 for 20-minute peak-period service frequency. 4. Improved Service Frequency: Effective June 11, 2006, Route 79 provides 30-minute service frequency during mid-day service. 5. Weekend Service: Effective June 11, 2006, another bus was added to Route 19 for improved schedule adherence and consistent 60-minute service frequency on Sundays and Holidays. Effective September 24, 2006, another bus was added to Route 18 for 60-minute service frequency on Sundays and Holidays. 6. Transfer Point Upgrade: In February 2006, initiated service to the new transfer center at the Shoppes at Park Place (formerly ParkSide Mall). This facility includes a bus island 20 feet wide and 200 feet long with 4 shelters, 6 benches, and bike racks. Passenger Amenities Passenger amenities are items of comfort and convenience such as passenger benches and shelters. Improving the convenience of transit service for passengers and accommodating ridership growth through new and expanded facilities continues to be a major emphasis area for. Tindale-Oliver & Associates June TDP
129 Passenger Benches The goal of is to have, at minimum, one passenger bench at each bus stop. The Jaycees have agreed to provide benches at bus stops in order to enhance the overall attractiveness and convenience of transit for passengers. This arrangement allows for very timely placement of benches since the Jaycee bench is a freestanding bench, which does not require permanent installation. As part of an ongoing program, purchases passenger benches that require permanent installation and permit review prior to construction. These bench installations also include accessibility improvements to ensure that persons with disabilities have access to the fixedroute system. This passenger bench installation program complements the public seating program conducted through the Jaycees, thereby resulting in a maximum number of bus stops with seating available for passengers awaiting the arrival of their bus. There are currently 2,093 passenger benches in Pinellas County. Passenger Simme-Seat Designed by a transit expert, the Simme-Seat is an innovative seating system consisting of opposing cantilevered seats attached to a bus stop pole. The streamlined profile succeeds in residential or commercial areas, and the unit installs on existing sidewalks or adjacent concrete surfaces. Currently, there are 61 seats installed. Passenger Shelters A passenger shelter program was initiated by in Shelters are typically installed where high levels of bus stop boarding occur and at activity centers such as libraries, hospitals, municipal buildings, shopping centers, educational/residential facilities, and employment sites. There are currently 631 passenger shelters in Pinellas County. A Request for Proposals (RFP) was developed for prefabricated shelters with a Barrel Style Roof and a Gable Style Roof for specific community-based applications, and a new contract was awarded on April 4, Cantilevered Shelters In 2006, began to install small footprint passenger shelters with a cantilevered design (see Figure 5-1), which allows for placement immediately behind a sidewalk in the right-of-way. This shelter application allows to place a passenger shelter at boarding locations where minimal right-of-way exists, using shelter pads that are only 24 inches wide and placed directly behind the sidewalk. The new cantilevered shelter provides passenger seating, and standees have shelter while waiting on the sidewalk. A total of 10 units are programmed for installation as part of the initial demonstration project. Tindale-Oliver & Associates June TDP
 allow the passenger to activate a flashing light as their bus approaches to alert the bus operator to stop at their bus stop (see Figure")


130 Figure 5-1 Cantilevered Shelters Bus Stop Lighting - Omnilight TM To enhance passenger safety and access during nighttime hours, utilizes solar lighting units to illuminate bus stops. These solar-powered lighting units (OmniLight ) allow the passenger to activate a flashing light as their bus approaches to alert the bus operator to stop at their bus stop (see Figure 5-2). This is particularly important along poorly-lit corridors or bus stops situated between light poles, making it difficult for bus operators to see waiting passengers during early morning or evening periods. In addition, these units provide security lighting and route schedule illumination. Solar lighting units are also utilized to illuminate passenger shelters. Figure 5-2 Bus Stop Lighting Curb Retrofit Higher volume, high-speed roadways are often designed as rural cross-sections, where a paved shoulder is present rather than a curb. The rural cross-section results in additional slope when low-floor buses deploy the wheelchair ramp; this can present more difficulty for boarding Tindale-Oliver & Associates June TDP

.")
131 passengers. An innovation to mitigate these slope problems is construction of a concrete pad on a newly constructed curb, positioned at the bus stop with a curb ramp leading to the passenger loading pad. This design provides reduced slope and improves accessibility at select bus stops and is now programmed with roadway construction on rural cross sections. A program of bus stop improvements is underway to add curb retrofits along many rural cross-sections (see Figures 5-3A and 5-3B). Figure 5-3A Figure 5-3B Passenger Loading Pads has been working cooperatively with FDOT, Pinellas County, and local jurisdictions on the construction of passenger loading pads at bus stops whenever a roadway is resurfaced or reconstructed. These pads have been constructed along some of Pinellas County s major roadways and blanket permit authority is often granted by local jurisdictions. These pads provide a firm, stable surface for passenger loading and wheelchair deployment along fixed routes. While there is no requirement for construction of concrete bus stop pads, there are design standards that must be followed, including: Minimum clear length of 96 inches, Minimum clear width of 60 inches, Connection to an accessible sidewalk (if available), and Maximum slope of 2 percent. A total of $600,000 is programmed in s FY 2006/07 Federal Transit Administration (FTA) Section 5307 grant for passenger loading pad installation system-wide. This funding will be utilized for curb retrofits, as well (see Map 5-2 for emphasis areas). Tindale-Oliver & Associates June TDP
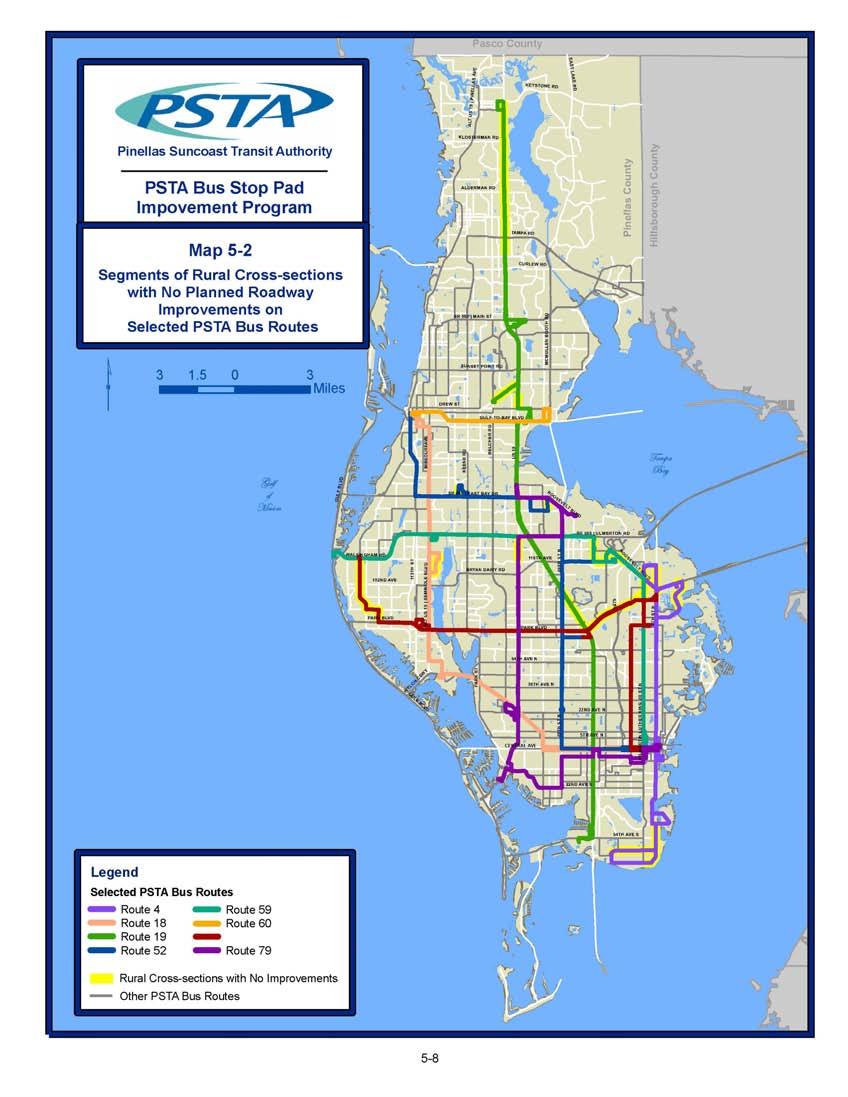
132


133 Bus Stop Signage Using Federal Transit Administration Section 5307 funding, the Marketing Department is upgrading bus stops to reflect s new colors and logo. New signs and decals are purchased to start this upgrade, which is expected to take one to two years. In addition, banners with the new logo were manufactured for Central Plaza Terminal. As part of this upgrade, 100 accessible bus stop signs were purchased with raised and Braille characters. These accessible bus stop signs facilitate bus stop access for passengers with visual impairments. Bikes on Buses Program A new program was implemented by to allow passengers to travel with their bicycles onboard buses. Bicycle racks were installed on all buses in January 1998 so that passengers can ride their bikes to and from bus stops and load their bike onto the bus for continued use upon arrival at their destination (see Figures 5-4). Bike racks have subsequently been installed on all new buses and trolleys. On October 22, 2003, Board authorized the purchase of 52 new Sportworks Trilogy Bike-Rack-for-Buses for expansion of the Bikes-on- Buses Program. These new Trilogy Bike-Rack-for-Buses racks provide for the placement of three bikes per bus, and these 52 racks are now available on the most productive bus routes where usage by passengers is most prevalent. Since its inception, the Bikes-On-Buses Program has exceeded ridership expectations for each fiscal year from FY 2001/02 to FY 2005/06 as manifested in Table 5-2 and Figure 5-5. As bicycle passenger ridership continues to grow, is installing bike racks at strategic bus stops. Approximately 25 bike racks (sets of two) are purchased each year, so that passengers can secure their bikes at stops and travel on the fixed-route system. Figure 5-4 Bikes on Buses Tindale-Oliver & Associates June TDP
134 Table 5-2 Bikes-on-Buses Ridership YEAR RIDERSHIP % INCREASE FY 2001/02 130,237 - FY 2002/03 147, % FY 2003/04 163, % FY 2004/05 183, % FY2005/06 233, % Figure 5-5 Bikes-on-Buses Ridership 250, , , , , , , , ,830 50,000 0 FY 2001/02 FY 2002/03 FY 2003/04 FY 2004/05 FY2005/06 New Operations and Administration Facility In August 2000, purchased 36 acres of vacant land located at the northeast corner of 34 th Street North and Scherer Drive in Pinellas County to establish a single consolidated operations facility. On November 17, 2003, broke ground for the new facility, which includes a new Administration Building for the following departments: Executive Director, Planning, Human Resources, Marketing, Finance, Information Technology, and the public areas including the Board Meeting Room. The Transportation Department is on the second floor above the Maintenance Building. Transportation facilities include: office space, lounge area for bus operators, dispatch, scheduling, and training rooms. The Maintenance Facility includes 35 service bays, storage warehouse, parts room, and training rooms. Fuel lanes for diesel, gas, and Compressed Natural Gas (CNG) are located adjacent to the Maintenance Building. Tindale-Oliver & Associates June TDP
135 In December 2005, moved into the new state-of-the-art facility and consolidated the St. Pete and Clearwater Operating Divisions. The new facility will allow to accommodate 125 administrative personnel, 160 maintenance personnel, 600 bus operators, and 300 buses. Due to sound fiscal planning, the construction of the facility was funded without compromising operations and without incurring debt service that would require years to pay off. This new facility allows to grow over time and provide enhanced service levels to meet future transit demand. As a part of the new facility, a new transfer facility was constructed nearby on 34th Street North in mid-county. This facility includes four passenger shelters, accessibility features, and bike racks. Currently this facility serves Routes 11, 52, 59, 96, 97, and 98, and provides an opportunity for off-street intermodal transfers in the growing mid-county area. Fleet Upgrades In March 2005, replaced twenty-one 1993 model buses with new low-floor models. All of these 2005 model buses include the new Trilogy Bike-Rack-for-Buses, which provides for the placement of three bikes per bus. In addition, the 2005 models include s new distinctive colors and logo. A Special Congressional Appropriation provided with more than $9.6 million to replace thirty-one 1994 model buses in This Special Appropriation allowed to utilize FTA Section 5307 formula funds to purchase 17 buses to expand the fleet and improve transit services in accordance with s Vision Plan. In February 2006, started the phase-out of the high floor buses that had been used for regular route service with delivery of 48 low-floor buses 31 replacement and 17 expansion buses. The only remaining high floor vehicles are trolleys and the MCI commuter coaches that are used for the commuter-express runs to Tampa. With this transition, the problems of malfunctioning wheelchair lifts will be reduced to a minimum and customers can board without navigating steps. Currently, another 21 buses are in production with delivery expected in May Eleven of these buses are for expansion to continue with the service frequency enhancements program for the most productive fixed routes. The combined bus buy total over three years is an impressive 90 new buses for an upgraded fleet inventory (see Table 5-3). Another 27 replacement buses are currently on order. Table 5-3 Fleet Upgrades (3-Year Summary) FY 2004/05 FY2005/06 FY2006/07 FY FY2007 Replacement Buses Expansion Buses TOTAL Tindale-Oliver & Associates June TDP
136 DEMAND RESPONSE SERVICE IMPROVEMENTS The following summary reflects service improvements implemented pursuant to Americans with Disabilities Act (ADA) complementary paratransit service requirements. Paratransit Feeder Connections Demand response service has been utilized for connections to fixed routes when there are architectural barriers, which in combination with a person s disability, impede or prevent fixedroute travel. When these circumstances exist, applicants for demand response service are certified for feeder connections to/from transfer points where they can access fixed-route service. These registrants are also provided with a courtesy bus pass for fixed-route travel. The feeder service program has served to provide access to the fixed-route system for persons with disabilities, which is the primary emphasis of the ADA. In-Person Assessments and Travel Training Some applications for demand response service require a face-to-face interview, which provides more detailed information regarding the person s disability and travel capabilities. This interview is tailored to the person s particular disability and provides an opportunity for the reviewer to inform the applicant about the regular bus system, accessibility features, passenger amenities, bus pass programs, and the use of travel aids for specific disabilities. In-person assessments are scheduled after a demand response service application is received and reviewed by staff. This application provides basic information regarding the person s disability and travel needs. The in-person assessment is utilized on an as-needed basis as part of the overall eligibility determination process. The reviewer s written report is then incorporated into the applicant file before a final eligibility determination is rendered. Travel training is offered to applicants who have the potential to use the regular bus system, but do not possess the skills and knowledge necessary for travel. In-person assessments provide an opportunity to market travel-training assistance and determine whether an applicant is a candidate for travel training. Group travel-training assistance is sometimes provided for individuals with common origins and/or destinations, particularly for assisted living facility residents participating in the same day treatment program. Tindale-Oliver & Associates June TDP
137 Upgraded Computer Software The contract carrier for s Demand Response Transportation (DART) service installed new software that allows the system to calculate the pickup time for DART clients based on the following criteria: a. Appointment time b. Load time c. Travel time The reservationist asks for the client s appointment time and date. Once this is entered, the system will then calculate the best time for the pickup to ensure the client arrives at their destination prior to the scheduled appointment. The computer also keeps a running account of trip volume in 15-minute increments. Based upon the availability of vehicles, the software system makes a determination whether another trip can be scheduled during that 15-minute period. Once the computer determines the best available time for the pickup, the reservationist will be shown the available times in 15-minute increments. The reservationist then will tell the client what the available times are, and the client will select their pickup time. This will ensure that trips are scheduled when service is available, and that the client reaches their destination in time for their appointment. The system design also prevents untimely service during the peak times of the day. Courtesy Door Hanger A door hanger that can be hung on a door knob is used when a client cannot be found at the pickup address. The card indicates the actual time of pickup time, the name of the client, and driver number. On the back side of the card are a few basic rules governing DART service. The card also has telephone numbers, if clients need to call. Customer Courtesy Cards A card was developed that includes the telephone numbers for both ambulatory and wheelchair transportation providers, as well as a telephone number the client can call with specific service comments, concerns, or compliments. On the back side of the card are the basic rules governing DART service and information to help the client comply with service regulations. These cards are provided to all clients by DART drivers, so the client will have the telephone numbers for scheduling their trips and resolving any problems associated with the carrier. This will provide a quicker resolution to travel problems the client may have and expedite corrective actions. Tindale-Oliver & Associates June TDP
138 ADA Paratransit Service Criteria Service Area The demand response system serves 21 incorporated communities, plus a portion of the unincorporated areas of Pinellas County. The origin and destination of demand response trips are closely monitored to ensure that all trips correspond with a three-quarter mile corridor dimension of fixed-route service availability. The ADA does not require complementary paratransit service in areas where the provider does not have the legal authority to operate. In Pinellas County, these areas include Belleair Beach, Belleair Shores, and Kenneth City. Fixedroute service has been extended to St. Pete Beach and Treasure Island, and complementary paratransit is now available in these areas as well, effective December 31, In addition, complementary paratransit service does not have to be provided along fixed routes that provide only commuter service. 1 s commuter routes come under this category. Response Time Next-day scheduling is provided until 5:00 p.m. Pick-up times are negotiated with the rider in an effort to maximize the multi-loading of passenger trips and avoid capacity constraints. However, pick-up times in excess of one hour must be agreed to by the rider (i.e., the rider has the right to require a pick up time within an hour before or after his/her requested time). Pick-up times are negotiated whenever possible in an effort to increase the possibilities for multi-load trips and to maximize the efficiency of the demand response system. Fares According to ADA regulations, the fare for demand response service can be no more than twice the full cash fare for the same trip on the regular bus system. The full cash fare on the regular bus system is $1.50, and the demand response fare is $3.00 for all trips. Currently, demand response trips that would require more than one bus are not charged a higher fare. Trip Purposes complies with this provision in that demand response trips are not prioritized. Subscription service is not required according to ADA implementing regulations. However, eligible passengers can schedule subscriptions for repetitive trips for employment and acute medical treatment. 1 Thatcher and Gaffney, ADA Paratransit Handbook: Implementing the Complementary Paratransit Service Requirements of the Americans With Disabilities Act of 1990, Page 2-5 Tindale-Oliver & Associates June TDP
139 Hours and Days of Service Demand response transportation is a complement to s regular bus service. Therefore, service for eligible passengers is available during the same days and hours as the regular bus service for any given trip request. In this way, comparable service levels are maintained on both the regular bus and demand response systems. Capacity Constraints Contract taxi and wheelchair-accessible van operators provide all demand response trips effective October As a condition of these contracts, private operators must honor all eligible trip requests. If they are unable to meet this obligation, can utilize supplemental operators to preclude capacity constraints. PUBLIC INVOLVEMENT EFFORTS The established process for input and feedback in public transit typically involves focus groups, user groups/advisory committees, workshops, public hearings, surveys, and market research. These efforts garner input necessary to evaluate existing service and proposed service modifications and improvements. While uses these methods, an ongoing community outreach program complements the more traditional public involvement program. General information dissemination for Public Hearings includes 15 days advance notice provided by placing interior signs on all buses and posters at Customer Service Centers. Paid newspaper advertisements, news releases, and public notices also provide information with respect to proposed service modifications and capital and operating budget development. The Transit Advisory Committee (TAC) is comprised of passengers and interested citizens that provide ongoing input to the staff and Board. The TAC meets monthly and provides input regarding service enhancement priorities and proposed service and fare modifications. Regular TAC bus ride reports provide information such as passenger volumes, activity at terminal and transfer facilities, construction activity and resulting problems/concerns, stop locations and spacing, bus operator commendations, and operational concerns. The membership assists with ride checks and passenger surveys that facilitate planning efforts. Ongoing TAC participation is a vital component of s more traditional public involvement program. Beyond TAC, has an extremely effective community outreach and liaison program as described in the following section: 1. Regional Funding/Service Coordination: staff has coordinated with Hillsborough Area Regional Transit (HART) and Pasco County Public Transportation (PCPT) on regional transit funding and services. The three Tindale-Oliver & Associates June TDP
140 agencies effectively share FTA Section 5307 formula funding and jointly developed a Regional Job Access and Reverse Commute Program. 2. Cities of St. Petersburg and Largo: staff has worked closely with the City of St Petersburg on the Downtown St. Petersburg East-West Transit System Study. This study process continues as Bus Rapid Transit is explored in further detail along the Central Avenue corridor. A service plan for the Looper Trolley system resulted in funding for additional evening service, improved service frequency, and reduced fares in the downtown area. The City of Largo is exploring multi-use redevelopment concepts for the former Crossroads Mall, and staff participated in the review of these concepts, including a new multimodal transfer facility/bus stop. Plans for new developments are also shared with. 3. Municipal Trolley Leases: Working with the cities of Gulfport, Tarpon Springs, and Largo, established vehicle lease agreements and operator training for community-based transit services. Each community operates a trolley vehicle at their expense, in accordance with a service plan, which accompanies each respective lease agreement. The regular bus system and the trolley services operated by local governments are closely coordinated to provide the opportunity for travel connections, without service duplication. 4. WorkNet Pinellas: Marketing staff works with case managers to provide information relevant to jobseekers and employers. Participation in WorkNet job fairs is ongoing. 5. Purchased Service: The City of St. Pete Beach and Treasure Island do not currently belong to the Transit Authority. However, these communities jointly purchase transit service that operates in their communities along the Gulf Boulevard corridor. 6. Community Presentations and Local Public Involvement Programs: Marketing staff provides special presentations to various groups in the community with respect to service and programs. Life skills presentations for bus travel are provided, particularly for supported employment and rehabilitation programs. 7. Employer s Choice Program: The Marketing Department staff vigorously promotes this program whereby the employer can fully subsidize the cost of public transit commute benefits and purchase 31-day Unlimited Ride Go Cards. With this benefit, employees get a tax-free transit benefit and the employer receives a taxreduction for the expense. Another option is for the employee to pay the full cost Tindale-Oliver & Associates June TDP
141 for the purchase of transit passes with pre-tax salary dollars. Finally, the employer and employees can share the cost of transit passes and share the tax benefit. Due to the great success of this program, program information and employer presentations include: National Mortgage Acceptance Wage Works Home Shopping Network Chiro Med-Arrowhead Management Adams Tank & Lift Merchants Association Pinellas Education Foundation McDonald s Ed White Hospital Adaptive Learning Systems City of St. Petersburg Tradewinds 4th Street Shrimp Store Don CeSar Resort Sterling Cleaners Federal Loan Source Pinellas County Batan Business Associates Home Builders of America Wired Commute Alden Beach Resort 8. Development Coordination & Review: Staff works closely with local communities to review development and redevelopment plans and incorporate passenger amenities as part of the project. This program is very successful with regard to the placement of passenger shelters and benches throughout the community. Staff is also participating with local communities on redevelopment projects and providing input on conceptual design. 9. Speakers Bureau Show Me Service: The Marketing Department has a very ambitious group of volunteers that offers presentations to community groups regarding the role of as a transportation provider, route and schedule information, and fare options. Also, "Show Me" service volunteers escort first-time riders on a complete round-trip that includes route schedules, fare information, and travel tips. 10. Accessible Bus Stop Signage: In coordination with s Transit Advisory Committee, new bus stop signs were developed to differentiate the bus stop from other poles along roadways. These tactile signs include raised and Braille characters for 100 select bus stops, which were identified with input from visually-impaired passengers. 11. Travel Training/Travel Aids Program: Travel training is offered by to persons with disabilities so they can gain the skills and knowledge necessary for independent travel. An independent contractor of serves in the capacity as travel trainer and works with individuals as they learn to navigate the regular bus system. New communication systems are also available for low vision, blind, and deaf-blind passengers to assist with identifying bus routes. Using this Bus Identifier Kit, passengers can prepare a hand-held sign with the number of the bus route on which they want to travel. Use of this kit alerts the bus operator as to the specific bus route the waiting passenger wishes to board. Development of this program Tindale-Oliver & Associates June TDP
142 included assistance from local disability groups and organizations. organizations also refer passengers to for travel training. These 12. Social Service Agency Coordination: For many years, has leased surplus paratransit vehicles to area social service agencies to increase the accessibility of the Transportation Disadvantaged (TD) system. Monthly unlimited-ride bus passes are provided by free of charge to approximately 12 agencies for their travel trainers use during the process of travel training clients. Most recently, leased surplus staff cars for use by job coaches for supported employment programs. Staff also works with local agencies on the provision of passenger amenities including benches, shelters, curb cuts, and passenger loading pads for those bus stop locations serving agency clients. 13. Inter-Agency Cooperation: is a very active partner in transit and transportation efforts in Pinellas County. Staff attends the monthly meeting of the Metropolitan Planning Organization (MPO) and the following MPO sub-committees: a. Bicycle Advisory Committee (BAC), b. Citizens Advisory Committee (CAC), c. Intelligent Transportation Systems (ITS), d. Local Coordinating Board (LCB), e. Pedestrian Transportation Advisory Committee (PTAC), f. Pinellas Mobility Initiative (PMI) Steering Committee, g. School Transportation Safety Committee (STSC), and h. Technical Coordinating Committee (TCC). staff participates in several regional forums that include the Joint Citizens Advisory Committee, the Joint Chairs Committee on Regional Needs and Priorities, and the Executive Transportation Team s efforts to locate Intermodal Terminal sites in the Tampa Bay area. Other activities involve assisting and supporting the Pinellas County Government and all 24 cities. Staff attends the MPO meetings, coordination meetings with various County Offices, Divisions of City Government that include Planning Departments, Community Development Offices, and special meetings. 14. Inter-County Transit Service: Regional connection points and transfer centers are maintained by in Tarpon Springs, Oldsmar, and Clearwater. These centers facilitate transit service connections between, PCPT, and HART. Coordination efforts include the provision of passenger benches and shelters, route and schedule information, shared bus stop locations, and planning requirements. Passengers can also utilize a new monthly bus pass for seamless travel between Pinellas and Hillsborough Counties. The new Passport provides unlimited travel Tindale-Oliver & Associates June TDP
143 on and HART routes and inter-county connections via Routes 100X, 200X, and 300X. 15. Web Page: In February 2001, started a website ( The site is continually updated with minutes of the monthly Board meeting, special events, employment opportunities, planning, and financial reports. At the end of the first year of operation, there were 100,576 visitors to the website. The number of visitors increased from 279,551 in 2004, to 314,927 in 2005, and 402,395 in A recently added feature is surveys where the public can provide feedback on proposed service modifications and route performance. Trip planning is also now available 24/ Board Workshops: The Board of Directors meets in workshop sessions monthly for in-depth review of specific topics. These workshops provide an opportunity for more informal review and discussion on topics including, but not limited to the following: Investment Strategies Five-Year Vision Plan Strategic Planning Bus Workshop/Advertising Proposed Operating Budget Market Research 17. Regional Workshops: In June 2004, and several other transit agencies in conjunction with Center for Urban Transportation Research (CUTR), FDOT, the National Transit Institute (NTI), and the FTA sponsored a Tampa Bay Regional Bus Rapid Transit (BRT) Workshop. The workshop was very well received and provided the focus that was needed to move forward with the concept of BRT in Pinellas County. In 2005, Board members suggested a second BRT workshop that would focus more specifically on the issues most relevant to the Tampa Bay region. The second workshop was held on February 16th and 17th, 2006, in Pinellas County with speakers who have first-hand experience with BRT systems in communities that are similar to those found in the Tampa Bay area. Over 140 individuals from 54 organizations participated in the workshop and speakers came from Miami, Los Angeles, Seattle, Eugene, Tallahassee, and Washington, D.C. 18. Public Access Television: The show Progressive Pinellas featured a story on BRT, and the efforts of to develop a BRT network in Pinellas County. 19. Service Requests and Programmed Service Improvements: The website is utilized to receive requests for new and improved transit services from Tindale-Oliver & Associates June TDP
144 passengers. Each request is reviewed by staff and a written or verbal response provided to the passenger. The website also includes programmed service improvements, including those in the adopted five-year Transit Development Plan. 20. Public Input: Each Board meeting includes an open forum where comments are provided with respect to discussion topics not on the Board Agenda. Before the Board votes on any action item, public input is also solicited. 21. Schedule Outlets: The Marketing Department serves 129 locations by providing route schedules and system maps through the mail, and another 185 locations are directly served by Marketing Staff. These locations include hotels, motels, restaurants, governmental offices, private corporations, and tourist attractions. 22. Customer Service: The information line receives 800 to 1,200 calls Monday through Saturday, and 400 to 600 calls on Sundays and Holidays. Customer service personnel staff offices at Park Street Terminal, Central Plaza Intermodal Terminal, and Williams Park where bus passes are sold, route and schedule information is available, and assistance is provided for passenger questions and concerns. 23. Bus Information: Each bus has interior ad cards that address topics such as passenger seating and assistance, fares, Employer s Choice, Emergency Ride Home Program, service improvements, and Board meetings. Passengers are afforded the opportunity to use various services and participate in commuter programs. 24. Community Programs: Staff participates in education programs, including new rider assistance for supported employment and social service programs. 25. Bus Operations: Each bus operator receives customer service training and uses a form known as From the Driver Seat. This provides an opportunity to document passengers complaints, concerns, or requests, as well as issues that arise during daily service provision (e.g., proposed passenger amenities, damaged bus stops, additional areas of concern, etc.). Supervisors review these forms with an opportunity for further review, investigation, and action. Tindale-Oliver & Associates June TDP
145 PLANNING STUDIES Several study efforts were undertaken to further BRT in Pinellas County. These planning efforts continue, including a very critical concept planning study underway on the Central Avenue Corridor. Central Avenue BRT Study Concept planning was initiated in February 2006 on the Central Avenue corridor from downtown St. Petersburg to the Central Plaza Intermodal Terminal. At the same time, an extended corridor analysis was initiated for BRT service west of Central Plaza, with three alternatives: southwest to St. Petersburg Beach, northwest to Tyrone Square Mall/Madeira Beach, and west to Treasure Island. These BRT studies are nearing completion at a total cost of $550,000. In cooperation with the Pinellas County MPO, secured $2.3 million necessary for the completion of the Central Avenue BRT study. This would include completion of Preliminary Engineering for the segment west of Central Plaza and Final Engineering for the entire corridor. The consultant contract will be awarded in fall 2007 after the Board approves system elements and a finance plan, and a detailed Alternative Analysis (AA) report is approved by the FTA. Countywide BRT Study The Pinellas County MPO agreed to use approximately $375,000 in funding from a Congressional earmark to fund a study that would explore the feasibility of BRT service along major arterial roadways in Pinellas County. Corridors would be ranked to determine which ones are the most feasible in the near term and the highest priority corridors could be studied in more detail for BRT implementation. This study is underway, and the initial screening process is complete. Ulmerton Road BRT Corridor Starting in 2003, began exploring the Ulmerton Road corridor for the early phases of an integrated BRT system. The studies continued into 2004, and staff entered into negotiations with FDOT over designing BRT bus bays into the expansion and improvements scheduled for the next 14 years., in conjunction with Kittelson and Associates, produced a set of BRT bus bay designs for nearside and far side stops as well as a partial open bay design. The Ulmerton Road FDOT reconstruction project is scheduled to take many years and be divided into several segments. The BRT stops are currently included in the design of the segment between 49 th Street and US 19, with agreements on the segments from 119 th Street to El Centro. The two segments west of 119 th Street were too far along in design for BRT bus bays to be included in the final design. Tindale-Oliver & Associates June TDP
146 DEVELOPMENT COORDINATION Tarpon Wal-Mart Transit Center Beginning in late 2004, staff started working with the City of Tarpon Springs and Wal-Mart on planning for a new transfer facility that would be constructed on the northeast corner of Tarpon Avenue and US 19. The facility would be of sufficient size to accommodate buses from and PCPT. Wal-Mart has agreed to pay for the facility, which will include sheltered waiting areas, benches, bike racks, water hook-up, electricity, and lighting. Pridgen/Gateway/Sod Farm In fall 2005, made contact with the Grady Pridgen organization and requested the integration of passenger amenities with the planning for the Sod Farm complex. The Sod Farm is located between Roosevelt Boulevard and 28th Street, and is bordered by 110th Avenue and Gandy Boulevard. The complex is currently under construction with two large manufacturing facilities and several hundred housing units. This initial phase is a small part of a much larger project that will be immediately to the west of 28th Street in the Gateway. The developer has a vision to build a community where residents will be working, living, and shopping in a selfcontained community with transit-friendly design features along the roadway corridors. New Transit Center at US 19 and Roosevelt Boulevard As the redevelopment plans for the former Crossroads Mall move forward in project development, Boulder Development Company approached with respect to a new transit center on-site at the development project. The new transit center will include sufficient size to accommodate more than six buses at one time with access and egress via the northbound US 19 Frontage Road and a lighted entrance along Roosevelt Boulevard. Passenger amenities will include sheltered waiting areas, benches, bike racks, bathrooms, water hook-up, electricity, and lighting. A contemporary architectural theme and public art are also part of the new transit center project. Park Street Kohl s Store In early fall 2006, a representative of the Sembler Corporation and a representative of the City of Seminole approached with a proposal to incorporate public art into a bus stop/passenger shelter that will be constructed at a new Kohl s Store on Park Street at 50 th Avenue North. In February 2007, representatives of Sembler, Kohl s, the City of Seminole,, the Pinellas County Arts Council met in incorporated Seminole and finalized an agreement to seek input from local artists to design the shelter and incorporate public art. This effort will be the first of its kind for and Pinellas County, and funded by the Sembler Corporation. The estimated cost of the project is between $40,000 and $50,000, and the intent is to lay the groundwork for future transit Tindale-Oliver & Associates June TDP
147 related public art at bus stops or stations. It is expected that the shelter will be in place within a year, including design, wind load certification, permitting, and fabrication. Marketing Awards s Marketing Department is on the cutting edge of transit promotion. During the past two years, the Marketing Department was honored by several groups that recognize excellence in marketing. First, was awarded the Advertising Industry s Silver ADDY Awards for the new bus design and There s a Better Way, the 30-second commercial. The TV commercial was also recognized with a TELLY Award, a television advertisement trophy. The Tampa Bay Regional Planning Council s (TBRPC) Future of the Region Awards honored the Haul Pass project and the Easy Way to Cross the Bay promotions each with second place awards. received top honors in the Transportation Marketing and Communications Association s (TMCA) annual Tranny Awards: the prestigious Award of Excellence was awarded for the Beauties of the Beach campaign, and the distinguished Award of Merit was bestowed on the Route 93 Postcard, Get Outta the House poster, Haul Pass Campaign, and the Smart Move TV commercial. The South West Transit Association (SWTA) recognized the promotion of the 100X and 300X Routes with a first place award. The Association for Commuter Transportation (ACT) bestowed their Creative Excellence Award for the youth Haul Pass (see Table 5-4). Table 5-4 Marketing Awards Award Campaign 1. ADDY New design/logo and There s A Better Way 2. TELLY Television, There s A Better Way Bikes on Buses Instructional Powerpoint 3. Future of the Region Pick-up the Phone TV Commercial Scherer Drive Administration & Operations Facilities Beauties of the Beach, Route 93 Postcard, Get Outta 4. Tranny the House Poster, Haul Pass, Smart Move Commercial 5. SWTA Express X Routes Promotions 6. ACT Haul Pass Promotions Sustaining Campaign Class 2, Best Marketing Best of 7. FPTA Best, Television Class 2 7-Day Youth Platinum Pass 8.TMCA Compass Recruitment Campaign Lost and Found Poster Tindale-Oliver & Associates June TDP
148 Tindale-Oliver & Associates June TDP
149 Section 6 NEEDS ASSESSMENT CONSISTENCY WITH NEW TDP RULES Various public involvement efforts have been conducted for this TDP, including service enhancement priorities workshop, strategic planning board workshop, on-board and household survey, and regional employer interview. In review of the public involvement efforts in consistency with the new TDP rule, the following table (table 6-1) is presented with the new TDP requirements pertaining to the public involvement process and the comments and/or where the specific requirement is addressed in this section. Table 6-1 New TDP Rule Pertaining to Public Involvement Process Public Involvement Process Comment/location Get public involvement plan approved by the Department or be consistent Completed with the MPO s adopted public involvement plan. Get the comment by citizens or passengers or interested entities during the development of providers mission, goals and objectives Authorized to establish time limits for receipt of comments. Include a description of the process used and the public involvement activities undertaken. Solicit comments from the regional workforce board. Advise the Department, regional workforce board, and MPO of all public meetings. Give the Department, regional workforce board, and MPO an opportunity to review and comment during the development of the mission, goals, objectives, alternatives, and ten-year implementation program. INTRODUCTION TO TAC WORKSHOP Service enhancement priorities workshop Completed Throughout this section Major Employer interviews Completed Completed Similar to the last major TDP update, a workshop with s Transit Advisory Committee (TAC) was used to better delineate the focus of the needs assessment process. Members of the committee were asked to participate in a discussion group process to help identify service improvement priorities for over the next five years. This section reviews the methodology used to conduct the workshop. In addition, the overall results of the TAC s input are summarized along with the primary needs that ultimately will be used in developing s current Five-Year TDP Update. SERVICE ENHANCEMENT PRIORITIES WORKSHOP On March 13, 2007, at a regularly-scheduled TAC meeting, a workshop was held with members of the TAC to discuss transit enhancement priorities for the the next five years. As discussed previously, the TAC is a mixed group of transit users and other interested citizens appointed by the Board of Directors to provide input into the transit planning process and Tindale-Oliver & Associates, Inc. June TDP
150 the day-to-day operation of the transit system. Transit users are an important resource for transit agencies since they often can provide valuable insight into the service and/or infrastructure improvements that can be made by the agencies to help increase ridership and improve the overall transit experience. The workshop was conducted to provide a forum for the TAC members to generate ideas and prioritize the most important needed improvements for the system. At the outset of the workshop, a brief presentation was given to explain the purpose and the process of the workshop to the TAC members. The focus of the workshop was presented to the TAC as a simply-phrased question: What service improvements should be priorities over the next five years?. Next, the priority lists for the last three major TDP updates that were developed with the assistance of previous TACs were reviewed to give current members a better understanding of the types of improvements that have been desired in the past and how priorities have shifted over time. Table 6-2 presents these previous TAC workshop priority lists by period. The priorities from the TDP update then were discussed in terms of s progress to date in addressing the indicated needs. For example, with regard to the indicated need for later evening service, it was mentioned that has extended the service hours on a total of 13 different routes since The workshop process then was discussed with the TAC. The basic process that was used to facilitate the workshop is the Nominal Group Technique (NGT). The NGT process is designed to organize meetings in a manner that maximizes productivity. This process balances and increases participation. The NGT process is best suited for small group meetings designed for fact-finding, idea generation, or the search of problems or solutions. Table 6-2 Previous TAC Workshop Priorities Period Public Awareness for Disability Groups Increased Service Availability as Employment Opportunities Grow Contingency Planning for Service Reductions in case Operating Funding Decreases Information Booths on Mall Properties Express Service from Designated Park-and-Ride Lots Period More Frequent Service on Selected Routes Later Evening Service on Selected Routes More Equipment (Buses) Rules Enforcement for Passengers Expanded Express Bus Service Period Later Evening Service Customer Service Improvements Varied Marketing Techniques Improved Transfer Issues Increase/Improve Bus Stop Infrastructure Tindale-Oliver & Associates, Inc. June TDP
151 The NGT was developed to counter the problems often experienced in group meetings that prevent the inclusion of everyone s ideas. This technique reduces the social and psychological dynamics of group behavior that are normally encountered. Examples of these sorts of problems include: a few individuals dominating the discussion, too many participants just listening, and few people taking the time to actually think about the issue at hand. People tend to be more creative when everyone is given a structured opportunity to participate. Outline of NGT Process The following outline lists each step of the NGT process, along with the benefits that each step contributes to the overall process. 1. Silent Generation of Ideas in Writing a. Allows time to think and provides a creative setting b. Allows for improved focus and uninterrupted thought c. Avoids competition and status differences d. Avoids conformity pressures e. Avoids polarizing on ideas 2. Recorded Round-Robin Listing of Ideas on Chart a. Structures participation b. Depersonalizes ideas c. Tolerates conflicting ideas d. Provides written permanence 3. Discussion of Each Idea on Chart a. Shows that each idea is as important as another b. Clarifies ideas 4. Vote on Priorities a. Provides focus on important issues b. Avoids dominance by strong members 5. Review of Vote a. Helps identify any voting inconsistency b. Allows group members to confirm vote Tindale-Oliver & Associates, Inc. June TDP
152 Methodology Each of the steps in the NGT process is discussed in further detail below. Step 1: Silent Generation of Ideas in Writing As indicated previously, the nominal question for the workshop was What service improvements should be priorities over the next five years?. This question was presented to the group both in written form (on a worksheet that was handed out to all participants) and it was stated verbally. The participants then were given 10 minutes to respond to this question by writing brief phrases describing their five necessary improvements in the space provided on the worksheet. Step 2: Round-Robin Listing of Ideas on Chart The next step of the process involved reading each TAC members ideas to the rest of the group. Each idea provided was recorded by the facilitator on a flip chart without having the group discuss the idea. This procedure continued for all the response worksheets until the responses to the nominal question were exhausted for all workshop participants. The pages of the flip chart containing the provided ideas were displayed on a wall for further reference. Step 3: Discussion and Clarification of Each Idea The ideas listed on the flip chart then were discussed in order. The facilitator read each idea, indicated in general terms the understood intent of the idea, and asked the group if there were any questions about it. During this process, efforts were made to ensure that each idea was clarified appropriately and that it was understood clearly by all participants. In addition, ideas similar in intent were grouped together to produce a more concise listing of ideas. In some cases, additional probing was used to help identify more specific details about some of the ideas that were listed. Step 4: Vote on Priorities At this point in the process, the participants again were reminded about the nominal question that they were trying to address regarding priority service improvements needed in the next five years. The participants then were instructed to select their preference for the five most important improvements from the entire list of ideas displayed on the flip chart pages and record these improvements on separate response sheets that the facilitator had provided. In addition to the participants selecting five important improvements, the facilitator asked each participant to rank in priority order the improvements listed on their cards from one (highest priority) to five (lowest priority). The participants were given approximately five minutes to complete this step, and they did so independently and without discussion. The following is a sample of the Tindale-Oliver & Associates, Inc. June TDP
153 response sheet that was provided to the participants for use in voting for and prioritizing the improvements. Figure 6-1 Sample Response Sheet Illustrating Rank-Order Voting Process Step 5: Review of the Vote During a break in the workshop, while other TAC business was being completed, the response sheets were collected and the priority voting was reviewed. A weighted score was assigned to each participant s indicated improvement preferences in the following manner: the highest ranked improvement (i.e., ranked #1) would receive a score of five, the next highest would receive a score of four, and so on until the fifth-ranked improvement would receive a score of one. In cases where a participant ranked two or more improvements similarly, all of these improvements would be given an identical corresponding score. In this manner, all of the participants listed improvements were scored and totals were tallied to identify the five topranked service improvements. The results of the vote then were recorded to provide a permanent record of the voting process and results. Lastly, the results were presented to the workshop participants for their consideration. Results of the Meeting Table 6-3 summarizes all of the service improvement ideas identified by the participants during the workshop, along with the results of the voting and prioritization process. Tindale-Oliver & Associates, Inc. June TDP
154 Table 6-3 TAC Workshop Results Nominal Question: What service improvements should be priorities over the next five years? Initial Brainstorming Ideas Initial Number of Votes Weighted Score Fix Williams Park shelters & stop area 1 4 More convenience facilities at transfer stations 1 4 Final Prioritization More weekend/sunday service Improve Park Street Terminal More 40-ft. buses 1 5 Expand service area Expand Route 19 into Pasco County 1 5 Implement HOV lanes 2 6 3T Add more park-and-ride facilities Increased rules enforcement (eating violations) 2 3 Increase involvement of neighborhood associations and the public Encourage more student ridership 1 4 Look for opportunities for storage space on buses 2 6 3T Increase the number of shelters and add more lighting 1 1 More marketing to neighborhood associations and schools Increase peak frequency on select routes 1 2 Later evening service 1 3 Provide service to both airports (Tampa International Airport and St. Petersburg/Clearwater) 2 2 Continue good customer service 1 5 As summarized in the table, five service improvement priorities were determined by the TAC through this process. The five top priorities are reiterated below. 1. More weekend/sunday service (13 points) 2. More marketing to neighborhood associations and schools (10 points) 3. Implement HOV lanes (6 points) 4. Look for opportunities for storage space on buses (6 points) 5. Add more park-and-ride facilities (5 points) It should be noted that, since there was a tie in weighted score between Add more park-andride facilities, Continue good customer service, Expand Route 19 into Pasco County, and Tindale-Oliver & Associates, Inc. June TDP
155 More 40-ft. buses, the priority order between these four was determined by the initial number of votes each received. Analysis of TAC Priorities Priority 1 - More weekend/sunday service The results of the TAC workshop indicate that the participants believe that supplying more weekend service is the highest priority. TAC members indicated that, although there is a need for more service overall, more emphasis should be placed on increasing the availability of transit service on weekends, particularly on Sundays. In addition, TAC members believe that increasing service during weekends could help increase ridership. Such an improvement may also entice new riders to use the bus system since this improvement would help it become a more convenient transportation alternative on weekend days. Priority 2 - More marketing to neighborhood associations and school Several of the TAC members think that more effort should be placed on community outreach and education programs directed at neighborhood associations, schools, and businesses. A particular emphasis was placed on reaching out to local neighborhood groups and associations who, in many cases, are well organized and serve as the eyes and ears for many niche and hard-to-reach segments of the community. One TAC member indicated that articles and advertisements in association newsletters can be a successful tool in getting the word out regarding transit services. With regard to outreach efforts at local schools, TAC members agreed that these efforts can plant the seed for potential future transit use as well as encourage more students to ride the bus now. Priority 3 - Implement HOV lanes It was suggested that an effort should be made to implement HOV lanes in the county. TAC members indicated that HOV lanes could be shared by both automobiles and buses. Although such an alternative would be difficult to implement on very congested roadways, TAC members noted that consideration should be given to these types of improvements in order to begin giving buses a certain degree of priority over single-occupancy vehicles. Priority 4 - Look for opportunities for storage space on buses TAC members were concerned about the amount of storage space available on-board buses. Participants at the workshop stated that there is a problem with strollers, bulky bags, and other large items that are carried on-board the bus by passengers and that block aisles and restrict mobility and comfort within the bus. The TAC members agreed that on-board storage space should be provided for carry-on items of a certain size somewhere on-board the vehicles. Tindale-Oliver & Associates, Inc. June TDP
156 Another option would be to relegate persons with large, bulky carry-on items to a specific area of the bus. Priority 5 - Add more park-and-ride facilities The fifth highest ranking service enhancement prioritized by the TAC was the need for more park-and-ride facilities. Although currently owns and operates three park-and-ride facilities in the county, TAC members indicated that additional park-and-ride facilities can improve access to and the convenience of services for potential bus riders who do not live near a bus stop. Summary of Workshop In summary, a workshop was conducted to obtain consensus from TAC members regarding service improvement priorities for the next five years. Numerous suggestions were made, all of which were discussed and prioritized by the workshop participants. The final results reflect the five most important service improvements from the perspective of the TAC members. works closely with the TAC on a regular basis and the service improvement priorities identified through this workshop will be considered strongly as evaluates and prioritizes service improvements for the next five years. STRATEGIC PLANNING BOARD WORKSHOPS Introduction In order to help focus s strategic direction for service, staff conducted two workshops with the agency s Board of Directors. The first workshop was held on Wednesday, December 6, 2007, and the second workshop was held on February 7, The results of these workshops serve as important input into the needs analysis for 's 2007 Transit TDP update process. The workshops were held with the Board of Directors to discuss strategic direction and provide a forum for the Board members to generate ideas concerning potential future service enhancements, discuss proposals in detail, and establish priorities for the system in the near term and beyond. Also in attendance was the Executive Director, who participated in the proceedings, as well, and helped facilitate discussion on a number of issues. Tindale-Oliver & Associates, Inc. June TDP
157 Analysis of Board Comments, Ideas, & Priorities The first Board workshop was designed as the educational component of the strategic planning process. Elements presented at this workshop were used to set the stage for the second workshop, which would begin addressing the development of the strategic plan for. As such, the first workshop consisted of a presentation that provided current and historical demographic, economic, and travel data for Pinellas County and over the past five to ten years. Major topics covered at that workshop include: What is a strategic plan? Population and employment trends Travel patterns (local, regional, and national) Development trends History of service trends (ridership, financial, and performance) Current strategy and vision The second Board workshop was designed to assist in the development of s strategic plan for the future. Major discussion topics covered at that workshop are presented in Figure 6-2. For the purposes of summarizing the discussions at both strategic planning workshops, major topics of discussion have been grouped together and are summarized below. Strategic Plan Development Board members indicated that future outreach efforts should model the Town Hall approach to public involvement used by other communities. It was also noted that strategic goals may have to be revised for the next step of the strategic planning process. Transit Market Prioritization Specific issues related to the identification of transit markets were geared to the attraction of choice riders as opposed to those who are transit dependent. Some Board members believe that if the service is aimed at choice riders, it will also benefit transit dependent riders in most cases. The fact that Pinellas County and the City of St. Petersburg have revised zoning regulations and have created transit-friendly corridors also drew comment from Board members regarding the need to take advantage of these opportunities to attract choice riders to the transit service. Additionally, discussions also included how to address the needs of commuters versus non-commuters. Tindale-Oliver & Associates, Inc. June TDP
158 Figure 6-2 Agenda for Board of Directors Workshop At the second workshop, a survey form was distributed to the Board members which asked them to rank the top 5 target transit markets from among a list of 12 potential target markets. Based on the results of completed survey forms, the top 5 transit markets were: 1) Choice Rider 2) Commuters 3) Residents in High Density Areas Tindale-Oliver & Associates, Inc. June TDP
159 4) Inter-County Travelers 5) Current Riders Improvements and Expansion of Existing Service Based on a sample of preliminary on-board survey results, Board members were informed of the top-ranking service improvements requested by respondents. These included more frequent service on Route 4, one of the top ridership routes, which runs from South St. Petersburg to Gateway, and Route 18, the second most traveled route, which runs from downtown St. Petersburg to Tyrone to downtown Clearwater. Other service improvements noted by Board members related to frequency, later evening service, more weekend service, and improvements to bus stops and shelters. Ridership Objective At the second workshop, a survey form was distributed to Board members that asked them to select a preferred ridership objective from among a list of ridership objectives. Ridership objectives listed on the form were tied to a planning horizon year. Based on responses to the ridership objective survey form, Board members believe that should set a goal to carry approximately 20 million passenger trips in the year Compared with statistics of four transit systems across the country that have already attained the 20 million ridership benchmark, needs a 94 percent increase in ridership, a 25 percent increase in revenue miles, a 53 percent increase in the number of peak buses, and an estimated 40 percent increase in operating expenses to reach this level. Summary of Workshops In summary, two strategic planning workshops were held with the Board of Directors. Although the workshops resulted in a productive and beneficial dialogue among the participants, service improvement recommendations for integration into the 2007 TDP major update were not finalized. Consequently, a third workshop was recommended that will be conducted to establish specific service improvement priorities that address the issues raised during the first two workshops. MARKET RESEARCH STUDY /07 In Spring 2007, the Pinellas Suncoast Transit Authority () performed a transit market research study. The study was performed to obtain information on potential service improvements, to assess the travel characteristics of bus riders and non-riders, and to ascertain the perceptions of transit of bus riders, non-riders, and major area employers. Feedback received from the market research study will assist in determining future transit needs in Pinellas County. Tindale-Oliver & Associates, Inc. June TDP
160 Three tools were employed to gather feedback from the community. The three tools include an on-board survey, a household travel survey, and interviews with major area employers. Each market research tool is described below. On-board survey The on-board survey is a tool used by transit agencies to gather feedback on various aspects of the transit agency s operations and services directly from bus patrons. In addition, on-board surveys assist agencies in determining the demographic make-up and travel characteristics of their existing patrons. Household travel survey The household survey is typically employed by transit agencies as a tool for gathering input from non-riders. Similar to the on-board, the household survey helps the agency assess travel characteristics. Utilizing these data, the agency can then program appropriate improvements that help meet the transportation demands of non-riders. Employer interviews Interviews with major employers in the area assist transit agencies in targeting and/or tailoring transit services that meet the needs of major employers. Understanding the travel needs of the employees of large businesses also assists the transit agency in developing appropriate marketing and educational tools. This sub-section provides a brief overview of each component of the market research effort and includes salient conclusions drawn from the analysis of these efforts On-Board Survey In late January 2007, the Pinellas Suncoast Transit Authority undertook the conduct of an onboard survey of existing bus riders. The on-board survey effort was conducted on buses to collect rider input on current transit services and to provide direction for future improvements, marketing, and policies. Survey Approach The method utilized for surveying bus riders was the distribution of a self-administered on-board survey to all persons boarding surveyed bus routes. The survey questionnaire that was utilized was similar in format and in the types of questions asked to the survey instruments previously used by as part of other major on-board survey efforts. has been conducting major on-board survey research in conjunction with major updates of its Transit Development Plan (TDP) since The reason for keeping the survey similar to the previous versions was to allow for comparative analysis of current and historical data collected as part of each on-board survey. A total of 2,970 bus riders responded to the survey. Based on the number of total surveys prepared for distribution, 6,500, a response rate of 45 percent was Tindale-Oliver & Associates, Inc. June TDP
161 achieved through the on-board survey effort. Table 6-4 provides a demographic summary of an average bus rider. Table 6-4 The Average Bus Rider (2007) Category Average Rider Demographic Gender Male Ethnic Origin White Residency Classification Pinellas County Year Round Resident Age 35 to 54 Work Status Employed Hourly Wage $10 to $12 Annual Household Income $10,000 to $19,999 Days Worked per Week 5 Hours Worked per Week 38 On-Board Survey General Conclusions Results from the on-board survey provide insight into various aspects of the service. Salient conclusions drawn from the on-board survey analysis are summarized in this section. Bus riders are satisfied with service. The average overall satisfaction rating was 4.04 out of 5. Any dissatisfaction with the service was associated with bus stop infrastructure and service frequency. continues to capture a large number of work trips. Although the percentage of work trips is lower than 2004 levels, work trips still represent almost 50 percent of total trips. bus riders are regular users of the service. Over 80 percent indicate that they use the bus every day of the week. In addition, over 60 percent of bus users indicate as their only transportation option. Whereas older bus patrons prefer to use alternative fare payment options to cash, younger bus riders tend to use cash. The two largest work start periods are between 6:00 a.m. and 10:00 a.m. and between 3:00 p.m. and 6:00 p.m. In addition, a large proportion of bus riders indicate work end times that are later than 8:00 p.m. The percentage of bus patrons indicating that they access the website for information was higher in 2007 than in Website users tend to be younger, more affluent, and indicate that they are satisfied with the website s friendliness and usability. Respondents indicated more shelters, later service, and more frequent service as the three most important improvements needed. Tindale-Oliver & Associates, Inc. June TDP
162 2007 Household Travel Survey Results The purposes of the Household Transit Survey were to capture accurate and reliable travel patterns and socio-demographic characteristics of Pinellas County households (both transit using and non-transit using), assess community attitudes and awareness levels regarding transit use, and identify the perceived strengths and weaknesses of the transit service. Household Travel Survey General Conclusions General conclusions drawn from the household travel survey analysis are summarized in this section. Approximately one-third of respondents indicated that they knew who the local bus service provider is. Although performs extensive marketing efforts, there continues to be a need for ongoing educational programs and marketing of services throughout the county. The top three potential transit improvements indicated by household travel survey respondents who use transit are later service, more frequent service, and more shelters. These service improvements parallel the highest ranking service improvements noted by on-board survey respondents. The number one reason indicated by survey respondents who are non-riders for not using is that services are not convenient (37%). Nearly half of all non-riders (48%) stated they would consider to travel to work if gas prices reached $4 a gallon. Results from the household survey indicate that safety is not a major issue when considering using. The majority of respondents (79%) stated that safety was not a major concern. Non-riders preferred express, limited stop bus service that ran near their work or home (48%) over regional express bus services (29%) connecting to Pasco, Hillsborough, and/or Manatee Counties. Non-riders indicated that traffic congestion was more of a problem in the county than parking. Forty-eight percent of non-riders agreed that they were seriously delayed by traffic at least once a week as opposed to 22 percent who stated that they had encountered serious parking problems at least once a week. The majority of non-riders stated that using the bus one or two days a week would not save them money (57%). In addition, 56 percent of non-riders agreed that provides transit service that is good enough to use regularly. Many non-riders (48%) agreed with the perception of as a social service geared towards lower income people who cannot afford a car. Tindale-Oliver & Associates, Inc. June TDP
163 Major Employer Interviews In an effort to achieve greater understanding of the perception and transportation needs of the working community, interviews were held with human resources managers of four major employers in Pinellas County. Major employers interviewed included: Cavalier Telephone Nielsen Media Research Bay Pines VA Hospital Raymond James and Associates Three main topics discussed with the interviewed employers include transportation issues, transit marketing, and the benefits of transit. The main findings from these interviews are summarized in the section. Transportation Issues Employers indicated that most employees commute to work in their personal vehicles. As a result, major transportation issues consist of traditional transportation problems such as parking and peak-hour congestion. Transit Marketing Generally, the interviewed employers know little about services and programs. Transit information is not provided by any of the interviewed agencies to employees as part of any recruitment or orientation efforts, and several employers noted that transit would not be the most convenient travel mode for their employees to get to work. Public Transportation Issues Overall, the interviewed agencies believe a well-designed transit system could be used as an incentive to attract business and to encourage more people to use the bus. One employer did note that because of the relative convenience of automobile travel and the geographic dispersal of Pinellas County, building a public transportation system that is well utilized would be difficult. Tindale-Oliver & Associates, Inc. June TDP
164 Tindale-Oliver & Associates, Inc. June TDP
165 Section 7 BUDGET ESTIMATES INTRODUCTION Federal requirements include balancing revenues with cost estimates to prevent transportation plans from becoming project wish lists. Therefore, plans and capital improvement programs are required to be financially feasible. The five-year projections shown below reflect the cost of operating and maintaining the existing system at FY 2006/07 service levels. It is assumed that no millage rate increase will be required to support these projections. Table 7-1 Total Transit System Cost Estimate Capital & Operating Budget Summary (Projection in thousands of 2007 dollars) Total Transit System Cost Projected 2007/2008 Projected 2008/2009 Projected 2009/2010 Projected 2010/2011 Projected 2011/ Year Total Capital Expenses $10,000 $10,000 $10,000 $10,000 $10,000 $ 60,000 Operating Expenses $57,646 $58,846 $60,022 $61,222 $62,446 $300,182 Total System Costs $67,646 $68,846 $70,022 $71,222 $72,446 $360,182 * Note: Capital expenses are based upon s portion of the FY Five-Year Transportation Improvement Program (TIP) Update. Revenue Source Table 7-2 Total Transit System Revenue Estimate Operating Budget Summary (Projection in thousands of 2007 dollars) Projected 2007/2008 Projected 2008/2009 Projected 2009/2010 Projected 2010/2011 Projected 2011/ Year Total Ad Valorem Taxes $38,879 $39,657 $40,450 $41,259 $42,084 $202,329 State & Federal Grants $ 5,463 $ 5,572 $ 5,683 $ 5,797 $5,193 $ 28,428 Passenger Revenue $ 10,976 $ 11,196 $11,420 $11,648 $11,881 $ 57,121 Miscellaneous Revenue $ 2,328 $ 2,421 $ 2,469 $ 2,518 $2,568 $ 12,304 Total Revenue $57,646 $58,846 $60,022 $61,222 $62,446 $300,182 's future will primarily depend on its financial viability. Currently, approximately 67.6 percent of the revenue for 's FY 2005/06 operating budget is generated through ad valorem (i.e., property) taxes. The existing ad valorem millage rate is mills; this rate decreased from mills in FY 2006/07. The existing cap on this millage rate, as established by 's state enabling legislation, is 0.75 mills. Tindale-Oliver & Associates, Inc. June TDP
166 VISION PLAN Outlined in this section are several categories for service enhancements. The following is a list of service improvements for study and implementation over the next several years. These enhancements are currently unfunded. Recommendations for Enhanced Local and Premium Transit Service Routes 4, 14, 18, 19, 52, 59, 60, 74, and 79 These routes account for approximately 60 percent of total ridership and facilitate intra-county trips. Enhanced peak-period service has proven to be quite effective in promoting significant ridership growth, and additional peakperiod enhancement will continue this favorable trend. Five routes now carry approximately 5 million passengers per year and these route enhancements are priority (See Map 7-1). Express Service to Westshore Business District (New Route 301X) New express service originating from the current Park-and-Ride on Ulmerton Road would serve commuters working in the Westshore Business District in Tampa. A corridor development study is necessary prior to implementation. Bus Rapid Transit (BRT) Corridors for BRT development include: US 19, Ulmerton Road, and Central Avenue in St. Petersburg. Development of BRT would occur in coordination with the Pinellas Mobility Initiative (PMI) countywide BRT study to enhance transit ridership along the most productive route corridors. Recommendations for Enhanced Evening Bus Service Schedule Improvements Routes 4, 14, 18, 19, 52, 59, 60, 74, 79, and 80 are the highest priorities for additional evening service. Recommendations for Weekend Service Improvements Additional Sunday Service Routes 5, 11, 14, 38, 61, 66, 76, and 78 have greater than 60- minute service frequency on Sunday. It is recommended that these routes have 60-minute Sunday service. New Weekend Service Routes 62, 67, and 73 currently provide weekday and Saturday service only and it is recommended that hourly service be provided on these routes on Sunday. Tindale-Oliver & Associates, Inc. June TDP
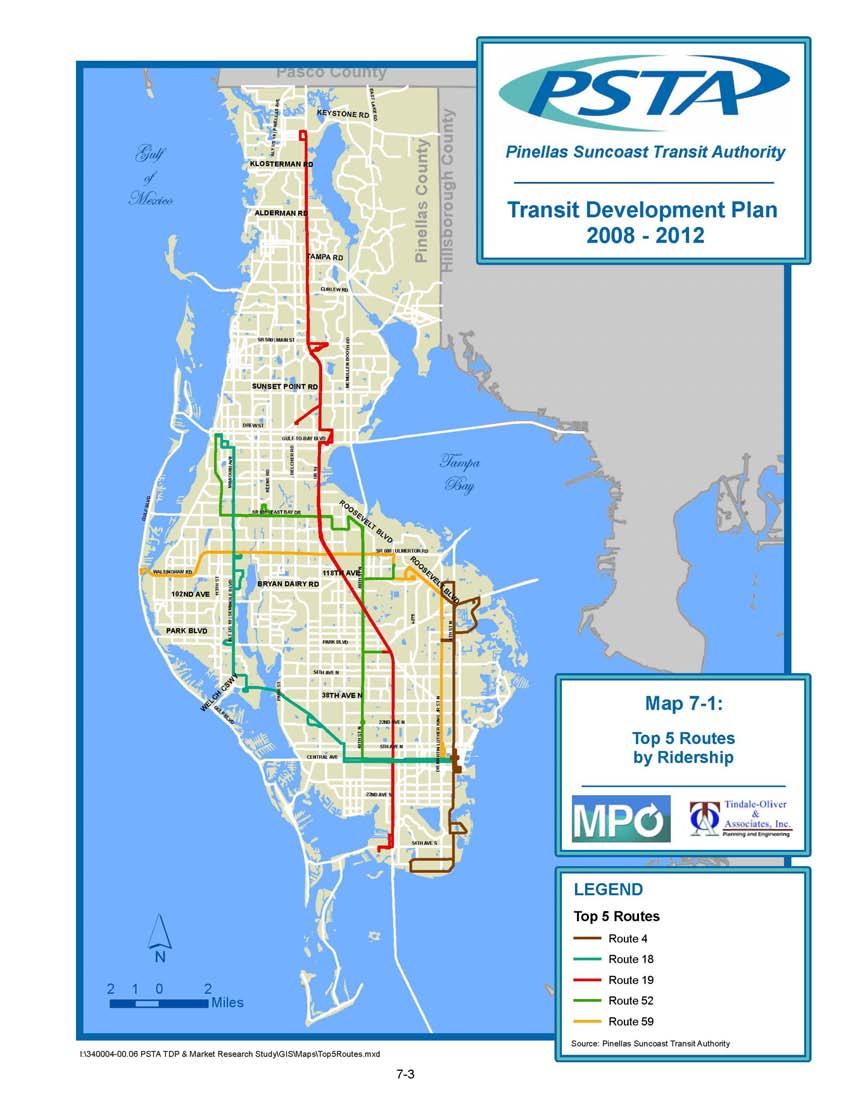
167
PUBLIC TRANSPORTATION PLAN
 PUBLIC TRANSPORTATION PLAN Introduction Public transportation is a vital element of the total transportation services provided within a metropolitan area. Not only does public transportation provide options
PINELLAS COUNTY MOBILITY PLAN SUMMARY REPORT
 PINELLAS COUNTY MOBILITY PLAN SUMMARY REPORT In September, 2013, the Pinellas County Mobility Plan Report was approved by the Metropolitan Planning Organization (MPO). This action endorsed a countywide
TBARTA 2015 Regional Transportation Master Plan 2040 Regional Long Range Transportation Plan AUGUST 2015
 TBARTA 2015 Regional Transportation Master Plan AUGUST 2015 Table of Contents 1.0 Introduction... 2 1.1 Updating the Master Plan... 2 1.2 About this Document... 2 2.0 Regional Long Range Transportation
EXECUTIVE SUMMARY REGIONAL TRANSPORTATION PLAN 2050
 EXECUTIVE SUMMARY REGIONAL TRANSPORTATION PLAN 2050 Introduction Goals Policies, and Performance Measures Growth Forecast and Planned Land Use Development Key Recommendations i Executive Summary April
Introduction. McLennan County Transit Need Study
 Introduction McLennan County Transit Need Study What is a Transit Need Study? 1. Identify Resources (Supply) Providers Vehicles Drivers 3. Perform a Gap Analysis Over supply or duplication of service Under
POLK COUNTY TPO Polk County 2060 Transportation Vision Plan Final Report. ADOPTED June 18, 2009
 POLK COUNTY TPO Polk County 2060 Transportation Vision Plan Final Report ADOPTED June 18, 2009 TABLE OF CONTENTS CHAPTER 1 Introduction and Prior Planning Effort...Page 1-1 CHAPTER 2 Population and Employment
TRANSIT SYSTEM SUMMARY REPORT
 Genesee County Shaping our Transportation Future Together 2035 Long Range Transportation Plan TRANSIT SYSTEM SUMMARY REPORT Introduction The Genesee County Transit Technical Report is one of 19 technical
Corpus Christi Metropolitan Transportation Plan Fiscal Year Introduction:
 Introduction: Traffic congestion in the Corpus Christi Metropolitan area is not as much a function of population growth as the function of the increase in single occupant trips. Using census data, the
Chapter 3 - Goals, Objectives, & Strategies
 Chapter 3 - This chapter presents goals, objectives, and strategies that have been developed as part of the Richmond Area MPO 2026 Long-Range Transportation Plan (LRTP) update. Strategies have been developed
Chapter 6: Regional Transportation
 Chapter 6: Regional Transportation Continued growth and development throughout the region magnifies the significance of connections to surrounding counties as economic and social interactions continue
Chapter 5 Transportation Draft
 Chapter 5 Transportation Draft Discussion Similar to the other elements in the Comprehensive Plan, the transportation element impacts the quality of life, economic development and public safety of the
Chapter 5 - Transportation
 Chapter 5 - Transportation Discussion Similar to the other elements in the Comprehensive Plan, the transportation element impacts the quality of life, economic development and public safety of the residents
The Policies section will also provide guidance and short range policies in order to accomplish the goals and objectives.
 4 Goals & Objectives INTRODUCTION The 2015-2040 MTP preserves and promotes the quality of life and economic prosperity of the MAB by providing a transportation system consistent with the regional goals.
Mobility Management STAFF SUMMARY REPORT
 Mobility Management STAFF SUMMARY REPORT COMPREHENSIVE PLAN AMENDMENTS Transportation Element Capital Improvement Element LAND DEVLOPMENT REGULATIONS Mobility Update Treasure Island PAGE INTENTIONALLY
MARION COUNTY COMPREHENSIVE PLAN 2035
 0 0 0 0 INTRODUCTION The Marion County Transportation Element Goals, Objectives and Policies are designed to provide a comprehensive, area-wide vision of Marion County s transportation systems and integration
MOBILITY 2045: A FOCUS ON TRANSPORTATION CHOICE:
 Mobility 2045: The Metropolitan Transportation Plan for North Central Texas is the defining vision for the multimodal transportation system in the Dallas- Fort Worth Metropolitan Planning Area. The plan,
Transportation OTHER FUNDS. Positions. Percent. Change
 Transportation Department Transportation OTHER FUNDS Percent Positions Change 2016-17 FY16 Budget FY17 Budget Transit $126,205,327 $149,766,850 $141,102,580 (6)% 1,073 1,074 Fleet Services $8,744,723 $8,613,770
EXHIBIT A SCOPE OF SERVICES FOR MODAL DEVELOPMENT (MD) SUPPORT - CONTINUING. Financial Project Nos
 SUPPORT - CONTINUING. Financial Project Nos") EXHIBIT A SCOPE OF SERVICES FOR MODAL DEVELOPMENT (MD) SUPPORT - CONTINUING Financial Project Nos. 411461-1-12-10 422799-2-12-12 FLORIDA DEPARTMENT OF TRANSPORTATION DISTRICT SEVEN Revised: 07/16/18 07/10/18
EXHIBIT A SCOPE OF SERVICES FOR MODAL DEVELOPMENT (MD) SUPPORT - CONTINUING Financial Project Nos. 411461-1-12-10 422799-2-12-12 FLORIDA DEPARTMENT OF TRANSPORTATION DISTRICT SEVEN Revised: 07/16/18 07/10/18
CHAPTER 1: INTRODUCTION/ GOALS AND OBJECTIVES
 CHAPTER 1: INTRODUCTION/ GOALS AND OBJECTIVES 1.1: INTRODUCTION ABOUT THE FREDERICKSBURG AREA METROPOLITAN PLANNING ORGANIZATION (FAMPO) Established in 1992, the Fredericksburg Area Metropolitan Planning
SOUTHEAST FLORIDA REGIONAL COMPACT CLIMATE CHANGE. Sustainable Communities & Transportation Planning
 SOUTHEAST FLORIDA REGIONAL COMPACT CLIMATE CHANGE Draft Regional Climate Action Plan Sustainable Communities & Transportation Planning SP-1 Develop criteria in collaboration with municipal and county planning
Transportation OTHER FUNDS. Positions. Percent. Change
 Transportation Department Transportation OTHER FUNDS Percent Positions Change 2014-15 FY14 Budget FY15 Budget Transit $118,294,509 $132,077,120 $135,910,350 3% 1,001 1,045 Fleet Services $9,460,561 $10,628,680
MEETING SUMMARY FOR APRIL 13, 2017
 SARASOTA/MANATEE METROPOLITAN PLANNING ORGANIZATION Performance Measures/Project Prioritization Process Ad Hoc Committee 7632 15 th Street East Sarasota, Florida 34243 3:00-5:00 PM MEETING SUMMARY FOR
CRTPA Regional Mobility Plan Attachment 1 Agenda Item 4E Page 1 of 11
 CRTPA Regional Mobility Plan Attachment 1 Page 1 of 11 INTRODUCTION Everyone wants to have the ability to move around the city, county, region, country and world in the way that they see fit, when they
VIA Long Range Plan Glossary
 VIA Long Range Plan Glossary Accessibility. Accessibility is the ability to reach opportunities (economic, social, etc.) within a certain geographical area. Americans with Disabilities Act (ADA). Passed
CHAPTER 2. VISION, GOALS AND MTP FRAMEWORK
 CHAPTER 2. VISION, GOALS AND MTP FRAMEWORK MTP VISION In order to create a framework for the 2040 Metropolitan Transportation Plan (MTP), a vision statement was drafted by the Vision/Goals Committee and
FLORIDA DEPARTMENT OF TRANSPORTATION PROCEDURE DEVELOPMENT OF THE
 FLORIDA DEPARTMENT OF TRANSPORTATION PROCEDURE DEVELOPMENT OF THE FLORIDA INTRASTATE HIGHWAY SYSTEM Topic No.: 525-030-250-f Office: Systems Planning Effective Date: May 16, 2002 DEVELOPMENT OF THE FLORIDA
Transportation OTHER FUNDS. Positions. Percent. Change
 Transportation Department Transportation OTHER FUNDS Percent Positions Change 2017-18 FY17 Budget FY18 Budget Transit $127,839,644 $141,102,580 $144,500,710 2% 1,074 1,083 Fleet Services $8,138,784 $8,535,790
Working with Transportation Concurrency Exception Areas
 Working with Transportation Concurrency Exception Areas September 2006 Presented by the Florida Department of Transportation Working with Transportation Concurrency Exception Areas Volume 1, September
FUTURE BUS RAPID TRANSIT PLANS
 ATTACHMENT 1 Preferred Configuration Saskatoon Bus Rapid Transit - Preferred Configuration FUTURE BUS RAPID TRANSIT PLANS Plan For Growth Transportation Plan BRT Plan October 2017 saskatoon.ca/engage 1
AIR QUALITY AND CLIMATE CHANGE EVALUATION GUIDANCE
 AIR QUALITY AND CLIMATE CHANGE EVALUATION GUIDANCE The following guidance provides additional details regarding the process followed by PSRC to evaluate projects for potential air quality benefits. As
CHAPTER 2: Goals, Objectives & Standards
 CHAPTER 2: Goals, Objectives & Standards Report Prepared by: Contents 2 GOALS, OBJECTIVES AND STANDARDS... 2-1 2.1 Goals, Objectives, Performance Measures, and Targets... 2-1 2.2 Service Standards... 2-6
MAP-21 Planning Factors & Performance Measures Technical Report
 MAP-21 Planning Factors & Performance Measures Technical Report Table of Contents Introduction 1 Summary Checklist 2 Scope of Planning Process / MAP-21 Planning Factors 3 Planning Factor One 3 Planning
2060 Florida Transportation Plan
 2060 Florida Transportation Plan Tampa Bay Regional Planning Council March 14, 2011 Huiwei Shen Office of Policy Planning Florida Department of Transportation What Is the Florida Transportation Plan? Florida
Draft MAP-21 Planning Factors & Performance Measures Technical Report
 Draft MAP-21 Planning Factors & Performance Measures Technical Report Table of Contents Introduction 1 Summary Checklist 2 Scope of Planning Process / MAP-21 Planning Factors 3 Planning Factor One 3 Planning
Summary of transportation-related goals and objectives from existing regional plans
 SMTC 2050 Long Range Transportation Plan Appendix A: Summary of transportation-related goals and objectives from existing regional plans SMTC 2050 Long Range Transportation Plan Summary of transportation-related
TRANSIT SERVICE GUIDELINES
 CHATHAM AREA TRANSIT AUTHORITY FEBRUARY 2014 Table of Contents 1. PURPOSE... 3 2. CAT SERVICE GUIDELINES... 3 3. TRAVEL MARKETS... 4 4. TRANSIT COVERAGE... 4 5. TRANSIT ACCESS... 4 6. BUS STOP SPACING
Chapter 1: The MPO Board includes representatives of four local governments and four transportation authorities
 Safe, Accountable, Flexible, And Efficient Transportation Equity Act: A Legacy for Users (SAFETEA-LU). The Imagine 2040 Plan will follow the guidelines as outlined in the current Federal Transportation
10.0 Congestion Management Process
 Livability 2040 Regional Transportation Plan 10-1 10.0 Congestion Management Process 10.1 CMP Summary The identification and evaluation of projects for the Livability 2040 Regional Transportation Plan
Town of Lexington Planning Board
 Town of Lexington Planning Board TRANSPORTATION DEMAND MANAGEMENT POLICY Adopted by Vote of the Board, September 16, 1998 Originally Adopted March 10, 1997 OBJECTIVES: This Policy focuses on meeting the
Community Transportation Coordinator Evaluation
 Transportation Disadvantaged Program Community Transportation Coordinator Evaluation July 1, 2011 to June 30, 2012 December 2012 Prepared by: Hillsborough County Metropolitan Planning Organization s Transportation
REGIONAL TRANSIT ACTION PLAN
 REGIONAL TRANSIT ACTION PLAN June 2005 Prepared for: WEST CENTRAL FLORIDA MPO CHAIRS COORDINATING COMMITTEE Prepared by: RENAISSANCE PLANNING GROUP, INC. TABLE OF CONTENTS EXISTING TRANSIT OPERATIONS IN
ACTIVE TRANSPORTATION ADVISORY COMMITTEE. Memphis MPO March 30, 2015
 ACTIVE TRANSPORTATION ADVISORY COMMITTEE Memphis MPO March 30, 2015 Agenda Welcome & Introductions Announcements and Briefings Livability 2040: Regional Transportation Plan Congestion Management Process
APPENDIX B - GLOSSARY FEBRUARY 2017
 APPENDIX B - GLOSSARY FEBRUARY 2017 DENVERMOVES Transit Denver Moves: Transit - ii - APPENDIX B TRANSIT AND MOBILITY GLOSSARY Amenities, stop or station: Objects or facilities (such as a shelter, bench,
2. Goals and Objectives
 Pedestrians in Charlotte s busy Uptown. CRTPO Mission The mission of the Charlotte Regional Transportation Planning Organization (CRTPO) is to plan for transportation options that ensure mobility, respect
1.0 INTRODUCTION. Athens Transit System Transit Development Plan 1.0 Introduction. 1.1 System Overview
 1.0 INTRODUCTION 1.1 System Overview Athens Transit System (ATS) is the public transportation provider for Athens-Clarke County Georgia. ATS bus transit services consist of 18 fixed routes (referred to
Tri-County Regional Planning Commission 2045 Regional Metropolitan Transportation Plan Goals and Objectives Adopted March 22, 2017
 Tri-County Regional Planning Commission 2045 Regional Metropolitan Transportation Plan Goals and Objectives Adopted March 22, 2017 One of the initial steps in the development of the TCRPC 2045 Metropolitan
- FACT SHEET - THE GUIDING PRINCIPLES
 THE GUIDING PRINCIPLES The General Plan begins with seven ideas that together create a vision for the City s future. When the City approved the General Plan in 1994, these idea were dubbed the Seven Guiding
Regional Rural & Coordinated Public Transportation Program
 Section 6: Transit Current Regulations The Transportation Equity Act of the 21 st Century, or TEA-21, emphasizes the importance of transit to local communities by providing flexibility in the financing
Contents i Contents Page 1 A New Transportation Plan Community Involvement Goals and Objectives... 11
 Contents i Contents 1 A New Transportation Plan... 1 Why develop a new plan?... 1 What area does the LRTP focus on?... 2 Why is this LRTP important?... 3 Meeting Requirements for Transportation Planning...
Chapter 3 Stakeholder Interviews and Summary of Needs
 Chapter 3 Stakeholder Interviews and Summary of Needs 42 CHAPTER 3 STAKEHOLDER INTERVIEWS AND SUMMARY OF NEEDS CHAPTER 3. STAKEHOLDER INTERVIEWS AND SUMMARY OF NEEDS An extensive stakeholder interview
NEW ORLEANS REGION TRANSIT COMPREHENSIVE OPERATIONS ANALYSIS SCOPE OF SERVICES. RPC Project LA90X361
 NEW ORLEANS REGION TRANSIT COMPREHENSIVE OPERATIONS ANALYSIS SCOPE OF SERVICES RPC Project LA90X361 Overview Summary The purpose of the Comprehensive Operations Analysis (COA) is to provide detailed review
Comprehensive Operations Analysis (COA) to support development of the. Public Meetings. January 28, 29 and February 2, 2015
 to support development of the. Public Meetings. January 28, 29 and February 2, 2015") Comprehensive Operations Analysis (COA) to support development of the Public Meetings January 28, 29 and February 2, 2015 1 Agenda Introductions DART Background and Services Phased Approach to 2040 Transit
Comprehensive Operations Analysis (COA) to support development of the Public Meetings January 28, 29 and February 2, 2015 1 Agenda Introductions DART Background and Services Phased Approach to 2040 Transit
2004 FEASIBILITY STUDY UPDATE
 Austin-San Antonio Intermunicipal Commuter Rail District 2004 FEASIBILITY STUDY UPDATE December 2004 EXECUTIVE SUMMARY INTRODUCTION Almost 3 million people in Central Texas, living and working between
Appendix E-1. FDOT MPO Program Management Handbook. (Excerpts)
") Appendix E-1 FDOT MPO Program Management Handbook (Excerpts) TABLE OF CONTENTS Chapter 4 Long-Range Transportation Plan Section Page 4.1 PURPOSE... 4-2 4.2 AUTHORITY... 4-2 4.3 SCOPE... 4-2 4.4 REFERENCES...
Appendix E-1 FDOT MPO Program Management Handbook (Excerpts) TABLE OF CONTENTS Chapter 4 Long-Range Transportation Plan Section Page 4.1 PURPOSE... 4-2 4.2 AUTHORITY... 4-2 4.3 SCOPE... 4-2 4.4 REFERENCES...
HILLSBOROUGH COUNTY METROPOLITAN PLANNING ORGANIZATION
 HILLSBOROUGH COUNTY METROPOLITAN PLANNING ORGANIZATION 2035 Long Range Transportation Plan Needs Assessment Segment Summary: Prepared for: Hillsborough County Metropolitan Planning Organization P.O. Box
Under recently updated FHWA guidelines, the LRTP must be updated every four (4) years. The most recent LRTP is the 2035 Plan, adopted in early 2009.
 years. The most recent LRTP is the 2035 Plan, adopted in early 2009.") PLANS, POLICIES AND PROCESSES OF THE MPO The Winston-Salem Urban Area MPO is responsible for creating and maintaining many documents essential to the on-going transportation planning effort. These documents
PLANS, POLICIES AND PROCESSES OF THE MPO The Winston-Salem Urban Area MPO is responsible for creating and maintaining many documents essential to the on-going transportation planning effort. These documents
Priorities are for AG comment at today's meeting. Four time frames proposed for implementation
 Prioritization Overview Priorities are for AG comment at today's meeting Four time frames proposed for implementation Prioritization Overview Some editing of Principles to read as implementation versus
Guiding Principles of the Plan:
 REGIONAL TRANSIT FEASIBILITY PLAN The Regional Transit Feasibility Plan continues to make progress, having completed the first step of the defined process to evaluate opportunities for premium transit
MULTI-MODAL TRANSPORTATION SYSTEM
 MULTI-MODAL TRANSPORTATION SYSTEM The population of Pierce County and the demand on the transportation system are both expected to increase significantly over the 20-year planning period. To keep our economy
Going Forward The Plan to Maintain & Improve Mobility Frequently Asked Questions (FAQs)
") Going Forward The Plan to Maintain & Improve Mobility Frequently Asked Questions (FAQs) What is Going Forward The Plan to Maintain & Improve Mobility (Plan) and why does the region need a Long Range Transportation
Going Forward The Plan to Maintain & Improve Mobility Frequently Asked Questions (FAQs) What is Going Forward The Plan to Maintain & Improve Mobility (Plan) and why does the region need a Long Range Transportation
Miami-Dade Transit. Alice N. Bravo, P.E. Director. Miami-Dade Transit 1
 Miami-Dade Transit Alice N. Bravo, P.E. Director Miami-Dade Transit 1 Miami-Dade Transit MDT is the largest transit agency in the State of Florida, and one of the largest departments within Miami-Dade
TCATS October 12-Michigan Works 5:30-7pm. NATS October 19-Niles District Library 6-7:30pm
 Goal Development Workshop TCATS October 12- Works 5:30-7pm NATS October 19-Niles District Library 6-7:30pm SAFETEA-LU Goals 2035 TwinCATS Goals 2030 TwinCATS Goals 1. Support the economic vitality of the
Subarea Mobility Enhancements. 5.1 Transit and Pedestrian Improvements
 Section Five Section 5: Subarea Mobility Enhancements 5.1 Transit and Pedestrian Improvements From the outset of the master planning process, one of the primary goals was to integrate transit and pedestrian-oriented
SCS Scenario Planning
 E SCS Scenario Planning Introduction As part of the 2035 MTP/SCS process, AMBAG developed a series of land use and transportation alternative scenarios for evaluation and testing to demonstrate how the
MEMORANDUM #4. DATE: November 4, Warrenton TSP Project Management Team. Ray Delahanty, AICP, DKS Associates Kate Petak, EIT, DKS Associates
 MEMORANDUM #4 DATE: November 4, 2015 TO: FROM: SUBJECT: Warrenton TSP Project Management Team Ray Delahanty, AICP, DKS Associates Kate Petak, EIT, DKS Associates Warrenton Transportation System Plan Update
The Role of Transportation Systems Management & Operations in Supporting Livability and Sustainability
 The Role of Transportation Systems Management & Operations in Supporting Livability and Sustainability Michael Grant, ICF International February 7, 2012 NTOC Webinar Highlights of FHWA/FTA Primer Background:
MANAGING EXISTING SYSTEMS EFFICIENTLY
 6 USING ITS TO REDUCE CAPITAL COSTS RTC implemented an ITS project to improve traffic operations on Plumb Lane, which eliminated the need for a $5 million intersection widening. The ITS project provides
Strategic Transit Plan
 Chapter VIII CHAPTER VIII Strategic Transit Plan TRANSIT VISION In developing and updating the Transportation Development Plan (TDP), it is necessary to recognize the goals and objectives of public transportation
City of Granite Falls 2017 Comprehensive Plan Update
 City of Granite Falls 2017 Comprehensive Plan Update 1) Certification report dated December 19, 2017 (see page 2). As of this Executive Board action taken at the January 25, 2018 meeting, the City of Granite
SUBURBAN EDGE COMMUNITY ROLE COUNCIL ROLE ALL COMMUNITIES SUBURBAN EDGE
 Orderly and Efficient Land Use Align land use, development patterns, and infrastructure to make the best use of public and private investment. Plan and stage development for forecasted growth through 2040
Pasco County MPO: Congestion Management Process PROCEDURES HANDBOOK
 : Congestion Management Process PROCEDURES HANDBOOK Final: March 2016 TABLE OF CONTENTS CONGESTION MANAGEMENT PROCEDURES HANDBOOK OVERVIEW... i Chapter 1: INTRODUCTION... 1-1 Causes of Congestion... 1-2
Transportation and Utilities
 4 Section 4 Transportation and Utilities 4.0 Introduction Transportation and utility systems are essential to accommodate and support development proposed in the Future Land Use Map. The following pages
APPENDIX A - PLANS AND POLICY REVIEW FEBRUARY 2017
 APPENDIX A - PLANS AND POLICY REVIEW FEBRUARY 2017 DENVERMOVES Transit Denver Moves: Transit APPENDIX A PLANS AND POLICY REVIEW 2035 Metro Vision Regional Transportation Plan (MVRTP) (2011) 2040 Fiscally
Chapter 4: Transportation and Land Use
 Chapter 4: Transportation and Land Use Transportation and land use together make possible the wide range of destination opportunities in the region. Transportation provides the connections, and, in turn,
Sustainability. Sustainability Principles. 1. Framework. Spokane Transit s definition of Sustainability is:
 Sustainability Spokane Transit s definition of Sustainability is: Sustainability at Spokane Transit is about providing services in ways that optimize our ability to meet the needs of present and future
APPENDIX A. Plan Survey Detail. Doug Kerr (Flickr)
") APPENDIX A Plan Survey Detail Doug Kerr (Flickr) Table of Contents Page APPENDIX A Plan Survey Detail... A-1 Statewide Plans and Policies... A-3 County Plans and Policies... A-6 Local Jurisdiction Plans
APPENDIX A Plan Survey Detail Doug Kerr (Flickr) Table of Contents Page APPENDIX A Plan Survey Detail... A-1 Statewide Plans and Policies... A-3 County Plans and Policies... A-6 Local Jurisdiction Plans
Proposed Comprehensive Update to the State of Rhode Island s Congestion Management Process
 Proposed Comprehensive Update to the State of Rhode Island s Statewide Planning Program January 2018 Summary Outline of of Action Steps 1. Develop Objectives for Congestion Management What is the desired
Transit, Intercity Bus, Taxi 8-1
 8-1 Introduction Public transit is a critical element of any transportation system. It both provides an alternative form of transportation to the traditional use of the automobile and provides mobility
REVIEW OF MPO LONG RANGE TRANSPORTATION PLANS AND REGIONAL MPO PLANNING ACTIVITIES AND PRODUCTS
 REVIEW OF MPO LONG RANGE TRANSPORTATION PLANS AND REGIONAL MPO PLANNING ACTIVITIES AND PRODUCTS Research Support for the Florida Transportation Plan Update Final Technical Memorandum Prepared for: Florida
10. PROJECT DEVELOPMENT, LEADERSHIP, AND OVERSIGHT GUIDELINES
 10. PROJECT DEVELOPMENT, LEADERSHIP, AND OVERSIGHT GUIDELINES It is important to note that the Transitway Guidelines are not intended to be prescriptive, but rather to provide a consistent basis for planning,
Chapter Five: Transportation
 Chapter Five: Transportation Purpose and Intent Transportation Goals and Policies Land Use Assumptions Airway Heights Transportation System Facilities and Services Pedestrian Transportation Public Transportation
Memorandum. FROM: Jim Ortbal Rosalynn Hughey Barry Ng TO: HONORABLE MAYOR, CITY COUNCIL. DATE: June 16, 2017
 CITY OF SANjOSE CAPITAL OF SILICON VALLEY TO: HONORABLE MAYOR, CITY COUNCIL SUBJECT: TRANSPORTATION POLICY UPDATE REQUIRED BY STATE LAW - LOS TO VMT Memorandum FROM: Jim Ortbal Rosalynn Hughey Barry Ng
Concurrency
 163.3180 - Concurrency (1)(a) Sanitary sewer, solid waste, drainage, potable water, parks and recreation, schools, and transportation facilities, including mass transit, where applicable, are the only
12 Evaluation of Alternatives
 12 Evaluation of Alternatives This chapter evaluates the effectiveness of the No-Build Alternative and the proposed METRO Blue Line Light Rail Transit (BLRT) Extension project based on the information
3.0 REVIEW OF PREVIOUS STUDIES
 3.0 REVIEW OF PREVIOUS STUDIES This section of the highlights the significant features from previous plans and studies that could impact the development of the I-20 East Transit Initiative. Much of the
Service Standards and Policies
 Planning, Development & Transportation Transfort/Dial-A-Ride 6570 Portner Road P.O. Box 580 Fort Collins, CO 80522.0580 970.224.6161 970.221.6285 - fax fcgov.com/transfort Service Standards and Policies
Winston-Salem Urban Area Metropolitan Planning Organization (WSUAMPO) Prioritization 3.0 Evaluation Criteria and Point Assignment Process
 Prioritization 3.0 Evaluation Criteria and Point Assignment Process") The following methodology has been developed by the Winston-Salem Urban Area Metropolitan Planning Organization (WSUAMPO) for the purpose of determining priorities for transportation funding, as carried
The following methodology has been developed by the Winston-Salem Urban Area Metropolitan Planning Organization (WSUAMPO) for the purpose of determining priorities for transportation funding, as carried
2040 UPDATE TO THE LONG RANGE TRANSPORTATION PLAN EXECUTIVE SUMMARY
 2040 UPDATE TO THE LONG RANGE TRANSPORTATION PLAN EXECUTIVE SUMMARY Grand Forks-East Grand Forks Metropolitan Planning Organization (GF-EGF MPO) Grand Forks Office 255 North 4 th Street Grand Forks, ND
New York Metropolitan Transportation Council. Plan Regional Transportation Plan A Shared Vision for a Sustainable Region
 New York Metropolitan Transportation Council Plan 2040 Regional Transportation Plan A Shared Vision for a Sustainable Region ADOPTED ON SEPTEMBER 4, 2013 Disclaimer This document was funded in part through
Chapter 12: Transportation Safety & Security CHARLOTTE COUNTY PUNTA GORDA MPO 2035 LONG RANGE TRANSPORTATION PLAN
 Chapter 12: Transportation Safety & Security CHARLOTTE COUNTY PUNTA GORDA MPO 2035 LONG RANGE TRANSPORTATION PLAN CHARLOTTE COUNTY PUNTA GORDA MPO 2035 LONG RANGE TRANSPORTATION PLAN Transportation Safety
What is the Transportation Policy Plan (TPP)?
?") Summary What is the Transportation Policy Plan (TPP)? The region s long range transportation plan Includes all modes of transportation: highways, transit, airports, freight, biking, pedestrians Meets the
Summary What is the Transportation Policy Plan (TPP)? The region s long range transportation plan Includes all modes of transportation: highways, transit, airports, freight, biking, pedestrians Meets the
4: Transportation and Land Use
 Chapter Figure 4-1: Recent development has brought more housing and mixed use Downtown Minneapolis - looking north from E 15th Street at the Grant Street / 11th Street exit 4: Transportation and Land Use
Attachment 1. Task Order Services, Schedule and Deliverables
 AECOM Project Number: AECOM Project Name: MCSA Task Order No.: Attachment 1 Task Order Services, Schedule and Deliverables SCOPE OF SERVICES TASK 1: PROJECT COORDINATION The AECOM approach includes an
8: Transportation Demand &
 GPATS Long-Range Transportation Plan 8: Transportation Demand & Emerging Technologies INTRODUCTION The transportation systems of cities, states, and nations are undergoing a period of transformation. As
Chapter 2 Transportation Element Goals, Objectives and Policies
 Chapter 2 Transportation Element Goals, Objectives and Policies City of Belleview Comprehensive Plan Adopted by Ord 2016-10 on July 5, 2016 GOALS, OBJECTIVES AND POLICIES Goal 2 Transportation...1 Objective
VISION STATEMENT, MISSION STATEMENT, AND GOALS AND OBJECTIVES
 VISION STATEMENT, MISSION STATEMENT, AND GOALS AND OBJECTIVES Vision Statement: Our vision is to provide a high quality, safe, efficient, and cost-effective multi-modal transportation system that supports
FY 2019 Unified Planning Work Program FINAL. Regional Intergovernmental Council. June 14, Kanawha Putnam Metropolitan Planning Organization
 FY 2019 Unified Planning Work Program FINAL Regional Intergovernmental Council Kanawha Putnam Metropolitan Planning Organization June 14, 2018 315 D Street. South Charleston, WV. 25303 The Unified Planning
September 2015 Governor s Transportation Vison Panel Discussion
 Discussion on Transit Revenue Scenario Vision Public Transportation Advisory Committee (PTAC) vision for Oregon is: As an integral part of the greater state transportation system, public transportation
Executive Summary and Staff Recommendation
 Executive Summary and Staff Recommendation January 2017 Project Background In 2010, NFTA completed an update to our 2001 Strategic Assessment. This assessment identified four corridors for potential rail
EVALUATION OF ALTERNATIVES CARRIED FORWARD
 1 EVALUATION OF ALTERNATIVES CARRIED FORWARD This chapter presents a comparative evaluation of the alternatives carried forward in this Final Environmental Impact Statement (EIS). The intent of this evaluation