Transport2025. Transport vision for a growing world city
|
|
|
- Dominick Parks
- 6 years ago
- Views:
Transcription

1 Transport2025 Transport vision for a growing world city MAYOR OF LONDON Transport for London
2 Contents Introduction by the Mayor...6 Foreword by the Commissioner...8 Executive summary Background The purpose of T T2025 fit within the wider policy agenda Work to date and methodology Stakeholder feedback 19 2 The London Plan and transport vision Structure of the document and approach London s challenges Supporting economic development Population growth Economic growth Transport and agglomeration Improving public transport Managing the road network 38 2 Transport Transport vision for a growing world city

3 4.2 Tackling climate change and enhancing the environment Climate change Air quality and noise Improving the urban environment Enhancing social inclusion Transport and accessibility Barriers to inclusion 44 5 Outcomes of the reference case Improving public transport Managing the road network Climate change and the environment Social inclusion 52 6 Transport strategies Strategy one renewing existing infrastructure Strategy two ensuring the existing system is efficient and safe Strategy three reducing the need to travel Strategy four influencing travel behaviour Strategy five reducing congestion and emissions Strategy six providing new capacity Full Public Private Partnership Crossrail Rail
4 Contents Other key rail schemes Bus Docklands Light Railway Light transit Walking Cycling Integration of the network Other modes Benefits of the T2025 programme Summary of T2025 programme Benefits of investing Economy Climate change and the environment Social inclusion Broader appraisal of the T2025 programme Consequences of not investing Implementation Timing and sequencing Costs Revenues Funding Other delivery constraints Transport Transport vision for a growing world city

5 8.6 Partnership approach Robustness and flexibility of the vision Comprehensive Spending Review Conclusion and next steps Conclusion Next steps 129 Appendices Summary table of modelling results List of figures and tables Indicative map of the 2025 transport network
6 Introduction by the Mayor London is in a strong position to meet not only its own but key UK goals for the economy, society and environment. The Capital's financial and business services are recognised by the Government as being at the cutting edge of the British economy. They are strongly internationally competitive and will also play a decisive role in regard to the rapidly emerging economies of China, Russia and India. The working age population of London is growing far more rapidly than the rest of the UK providing an unmatched labour supply that can accelerate the growth of UK GDP. London contains by far the greatest concentration of high-productivity jobs in the UK, in many sectors, and is the only part of the European economy that matches US levels of productivity, meaning that investment in London yields the highest return in the UK. Alongside this economic powerhouse, the regeneration of the Thames Gateway offers the opportunity to make the decisive contribution to delivery of the Government's sustainable communities agenda, while helping transform some of the most deprived communities in the country, and there is the additional momentum from the 2012 Olympics to build on. In terms of the environment, climate change is the single biggest challenge we face. London has a major part to play as a large and compact city with the lowest emissions of carbon per capita GDP in the country, and a high potential for further reductions aiding the country in meeting its climate change targets. The population and employment growth projected in the London Plan will increase total travel by four million journeys a day by If met by car travel this would create gridlock and unacceptable levels of carbon dioxide (CO2) emissions. These problems would reinforce each other as traffic slows its overall impact on CO2 and local air pollutants increase. It is therefore vital that the four per cent modal shift into public transport, walking and cycling achieved in London since 2000 continues to develop. Such a shift in travel patterns will also help improve London's public realm so it supports the high quality of sustainable urban living we all aspire to. The Transport 2025 (T2025) plan to reduce congestion and emissions is an innovative and essential initiative to achieving these goals. The package includes a Climate Change Action Plan and substantial on-going investment in public transport, together with measures to increase cycling and walking. The essential investments for Transport for London (TfL) include completing the Public Private Partnership (PPP) to rebuild the Tube, Crossrail and expanding the bus network, alongside the introduction of a national road user charging scheme. 6 Transport Transport vision for a growing world city

7 This T2025 vision document sets out a programme for the Capital that will maintain London's financial and business services at the cutting edge of UK economic competitiveness and improve the quality of life for Londoners in all parts of the city. It will support the maintenance of sustainable levels of economic growth and maximise productivity growth for the UK as a whole. At the same time it will address climate change by rigorous action to reduce CO2 emissions. These proposals build on the remarkable progress TfL has made for the past six years in improving and extending London's transport services, while reducing traffic congestion in the central area. They are the most comprehensive, robust and well-argued plans for London's transport network in the Capital's history. I am sure there will be strong support for the T2025 vision and programme from a wide range of stakeholders with an interest in the future of London's transport and its contribution towards the sustainable development of the Capital and the nation as a whole. Ken Livingstone Mayor of London 7
8 Foreword by the Commissioner T2025 is a major TfL policy initiative to produce a long-term vision for London's transport system. The need for T2025 is driven by the scale and complexity of the growth challenges facing London. Around 900,000 more jobs and over 800,000 more people will be in London by We need a clear transport vision and investment strategy to be in a position to support this growth effectively. The T2025 work has involved extensive analysis, research and appraisal. It builds on work we have undertaken to assess the future requirements of the strategic road network (Road Plan) and work to identify how best to upgrade the existing overground rail network (Rail 2025). At an event for stakeholders in June this year, we presented the first major T2025 report on the challenges and invited feedback. This generated a very positive response and many useful suggestions, which have been incorporated into the present document as far as possible. T2025 identifies the economic, environmental and social objectives and targets to support London's existing transport needs and the additional five million journeys that need to be made by public transport, walking and cycling every day by The conclusions of the T2025 work are clear and the choices stark. Even with a wideranging programme of demand management Executive summary 8 Transport Transport vision for a growing world city measures, transport demand will increase much faster than the currently funded level of capacity improvements. Without significant investment, crowding levels on public transport and traffic congestion would rise well beyond the existing unacceptable levels. T2025 outlines a comprehensive programme of transport improvements to meet the challenges and achieve the objectives. The first priority is to maintain and operate the existing system of infrastructure and services. We must do all we can to renew the existing system, manage travel demand and ensure the network is safe and efficient. But we cannot rely on these policies alone. Additional public transport capacity of around 40 per cent will be needed. The first priority in terms of new capacity is to rebuild the Tube by completing the full PPP. This will renew the assets, improve reliability and deliver additional capacity. The next priority is to deliver Crossrail to provide the capacity needed to support job growth in central London and the Isle of Dogs. To manage traffic congestion and contribute to the Mayor's climate change targets we have produced an innovative plan to reduce congestion and CO2 emissions in London. This package of measures includes enhanced public transport capacity, smart transport measures, a Climate Change Action Plan, technological improvements in the vehicle fleet, and the implementation of a national road user charging scheme in London.

9 Expanding the bus network will be critical to support London's growth, achieve mode shift in outer London and complement the introduction of road user charging. Londonwide improvements to walking and cycling and the public realm will also be necessary, with local light rail or light transit projects in some locations. We will also need Government to deliver the package of Rail 2025 improvements to enhance existing rail corridors. The T2025 programme is an integrated transport plan for London that uses each mode to its best advantage. The programme would achieve a very significant nine per cent mode shift from car and deliver 40 per cent extra public transport capacity. Crowding and congestion would be reduced below 2006 levels. By enabling London to grow and develop as envisaged in the London Plan, an estimated 180bn in GDP would be generated. The T2025 programme would make London a world leader in tackling global warming, contributing a significant 22 per cent towards the 30 per cent cut in London's CO2 emissions required by The remaining eight per cent can be achieved through changes to vehicle standards. The investment will also ensure that many of the transport-related causes of social exclusion are overcome. The T2025 programme is a significant one over the next 20 years but is absolutely necessary and achievable. Real progress has been made over the last six years in improving the transport system in London and we must maintain this momentum. Major successes have included a bus patronage increase of 40 per cent, a four per cent mode shift from car to public transport, reduced traffic congestion in central London, the introduction of the Oyster card, improvements on the Underground and Docklands Light Railway (DLR) network, and better walking and cycling facilities. Funding is a major challenge in delivering the programme but road user charging provides an important source of revenues to further fund the necessary transport investment and alternatives to car travel. The T2025 work will provide the foundation for a future update of the Mayor's Transport Strategy, which will be developed alongside the current work to revise the London Plan. A more immediate need for T2025 is to provide the strategic framework for TfL s discussions with Government in the forthcoming 2007 Comprehensive Spending Review. This document continues the important dialogue with our key stakeholders on London's transport challenges and strategies. I look forward to working in partnership with you as we strive to deliver the T2025 vision for transport in London. Peter Hendy, Commissioner Transport for London 9
10 Executive summary This document describes a 20-year transport vision for London to address the significant transport challenges arising from the major population and employment growth facing London. The document is supported by extensive modelling, analysis and appraisal, and reflects where possible the comments made by stakeholders in response to the June Transport 2025 document 'Transport 2025 Transport Challenges for a Growing City'. It recommends the transport policies and investments needed to support the growth and development of London as envisaged in the Mayor's London Plan to support its economic, social and environmental objectives. Transport challenges and vision London has a unique role to play in the UK economy. It is the country's financial powerhouse and generates a disproportionate share of economic growth which benefits the country as a whole. The city is set to grow and prosper in future, with over 800,000 extra people and around 900,000 extra jobs forecast over the next 20 years. To support this economic development there are two inter-related transport challenges. The first challenge is to improve London's public transport system to accommodate the growth of employment. This has two components, namely getting people to work on reliable radial links within acceptable levels of crowding; and accommodating the more dispersed growth of housing, employment and leisure trips in outer London and the suburbs, ensuring that as many trips as possible use public transport, walking and cycling. The second challenge is to effectively manage the road network, reduce traffic congestion and reduce carbon dioxide (CO2) emissions. Total travel is projected to increase by four million journeys every day by When the mode shift from car travel is taken into account, an additional five million daily journeys will need to be supported by public transport, walking and cycling. Transport Transport Vision for a Growing World City (T2025) identifies three transport objectives, consistent with the Mayor's vision for London. These are: Supporting economic development by improving public transport and managing the road network to reduce traffic congestion Tackling climate change and enhancing the environment by reducing CO2 emissions, improving air quality, reducing noise, and improving the urban environment Improving social inclusion by making transport more accessible and secure for users 10 Transport Transport vision for a growing world city

11 The T2025 vision is to create: A world class transport system that delivers the safe, reliable and efficient movement of people and goods that enhances London's economy, environment and social inclusion. The 2025 Reference Case Current plans and policies will fall well short of meeting the challenges. The historical gap between demand and supply would not just continue, but widen. The additional transport capacity provided in Transport for London's (TfL's) current investment programme would not be capable of supporting the underlying public transport demand increase of 40 per cent arising from London's growth. This would constrain the potential for London's job growth, particularly in the central area. Road congestion would increase by more than one third and CO2 emissions would decrease by only six per cent on 1990 levels, far short of the 30 per cent target. Limited progress would be made towards improving social inclusion. Transport strategies Six transport strategies have been identified to achieve the T2025 objectives and overcome the limitations of the reference case. They are as follows: Renewing existing infrastructure bringing assets up to a state of good repair and maintaining them in that condition Ensuring the existing system is efficient and safe improved road network management, better ticketing and information, extra security Reducing the need to travel using land use planning to reduce travel demand and car use Influencing travel behaviour providing travel information and incentives to encourage people to walk, cycle and use public transport Reducing congestion and emissions a package of measures to encourage mode shift from car travel, and reduce traffic congestion and CO2 emissions Providing new capacity a major programme of investment in public transport Policies that get the best performance from existing infrastructure and manage demand to make better use of available capacity will be exhausted first. However, these measures will not provide much additional capacity and will not impact on traffic congestion network-wide. In terms of the new capacity needed, the first priority is to rebuild the Tube by completing the full Public Private Partnership (PPP). This will renew the assets, improve reliability and 11

12 12 Transport Transport vision for a growing world city
13 deliver an additional 25 per cent capacity. The next priority is to deliver the capacity needed to support job growth in central London and the Isle of Dogs and serve the east-west core jobs corridor. Crossrail is the essential mass transit link to achieve these outcomes. Building on the first four strategies to make best use of the existing transport system, T2025 has defined a package of measures to reduce congestion and emissions. The package includes enhanced public transport capacity; action to change transport behaviour through smart transport measures such as workplace and school travel plans; targeted measures to cut CO2 emissions through the Greater London Authority's (GLA's) forthcoming Climate Change Action Plan; technological improvements in the vehicle fleet; and takes into account the implementation of a national road user charging scheme in London. Expansion of the bus network will be critical to support London's growth, achieve mode shift from car travel in outer London and should be able to complement the introduction of road user charging. The T2025 programme also includes a package of enhancements to the existing Tube and national rail network (Rail 2025); Docklands Light Railway capacity enhancement and extensions; light transit schemes; Londonwide improvements to walking and cycling and enhancements to the urban realm. Benefits Comprehensive appraisal work was undertaken to quantify the benefits of the T2025 programme, which include: Nine per cent mode shift from car to public transport, walking and cycling Crowding and congestion reduced below today's levels Business journey time savings and increases in productivity resulting in 180bn extra to UK GDP over 60 years CO2 emissions reduced by 22 per cent, making a major contribution to meeting the Mayor's emissions reduction target Nine per cent reduction in travel time from the 10 per cent most deprived areas in London to town centres and the central business district Delivering the vision The costs of the T2025 programme are significant, but should be seen in the context of London's contribution to the UK economy. It is estimated that the investment will help generate an additional 180bn in GDP and agglomeration benefits. The T2025 programme would also deliver increased income from fares as London's population grows and more people choose to use public 13
14 transport. Successful implementation of the T2025 programme relies on all key stakeholders working in partnership. Conclusion The T2025 vision identifies the comprehensive package of transport investments and policies needed to ensure that London thrives and prospers in future, and that the benefits of such growth are more widely felt. Without sustained transport investment, the limitations of the current transport network will increasingly become a constraint on London's economic development and the contribution it makes to the UK economy. In addition, little progress will be achieved in tackling the transport related causes of social exclusion, nor in addressing the global threat posed by climate change. The Government's 2007 Comprehensive Spending Review (CSR2007) is a crucial opportunity to secure the additional investment needed to begin to deliver the T2025 vision. TfL will look to T2025 as a basis for discussions with Government on CSR2007 about how London's transport needs can be met. T2025 will also form the foundation for a revision of the Mayor's Transport Strategy, and will be regularly reviewed. 14 Transport Transport vision for a growing world city
15 15
16 1 Background 1.1 The purpose of T2025 T2025 is a TfL policy initiative to produce a long-term vision for London s transport system. With the long lead times required for implementing transport infrastructure and many transport policies, it is essential to take a long-term view of London s transport needs and put in place the necessary work to ensure that infrastructure schemes and policies can be implemented when needed. T2025 will also ensure that shorter-term investments and initiatives are consistent with a long-term vision. The need for T2025 is also driven by the major growth challenges facing London. Almost one million additional jobs and one million more people are projected to be in London by London needs a clear transport vision and investment strategy to be in a position to support this growth effectively. The T2025 vision will support the Mayor s overall goal to develop the Capital as an exemplary, sustainable world city, based on sustained economic growth and giving all Londoners the opportunity to share in the city s future success. It is also based on improving public safety and security, reducing London s contribution to global warming and improving its environment and use of resources. Transport plays a critical role in achieving these broader goals for London. It affects all aspects of life, from getting to work to ensuring access to education, healthcare, shopping and leisure services. To fulfil this role, London must have a 21st century transport system that is safe and secure, reliable, accessible and efficient. More fundamentally, it has to have sufficient capacity to meet current needs and future growth. London will undergo significant spatial changes over the next 20 years and transport investment must be in place at the right time to support this development. Future transport investment must support the growth of the London Plan s Opportunity Areas and town centres across London. In addition, the Olympic Games in 2012 provide a major opportunity to regenerate east London and capture legacy benefits that will help to sustain the development of the Capital. T2025 defines the transport system needed to underpin this regeneration and economic development. 16 Transport Transport vision for a growing world city

17 1.2 T2025 fit within the wider policy agenda The transport vision needs to integrate transport into the wider policy agenda. The role for transport in cities has become much broader than in the past as transport is expected to maximise its contribution to goals such as safeguarding the environment and improving social inclusion. Planning London's future transport system necessitates going beyond simply looking at the number of services that can be provided. Issues like transport efficiency, Travel Demand Management (TDM) and the need to reduce CO2 will have a major impact on future transport planning. Transport provision is also affected by policies external to transport, for example land use planning and health care provision. The T2025 process has been fully integrated with the Mayor s London Plan and the Government s transport policies. It recognises the importance of sustained long-term investment in transport, a need compounded by decades of underinvestment in London s transport network. The Department for Transport s (DfT s) objectives are to support the economy, manage congestion, enhance social inclusion and improve the environment. T2025 reflects these objectives and those in the revised London Plan, as the basis for London s transport vision. 1.3 Work to date and methodology Work to date T2025 work, which started in early 2005, has been an extensive programme of work involving transport planning, modelling, policy development, appraisal and stakeholder engagement. The T2025 analysis is based on population and employment forecasts produced by GLA Economics as part of the London Plan. Detailed research and analysis of the problems and challenges to 2025 was undertaken, before solutions were identified. T2025 reviewed transport policy best practice, innovation and research, to identify the best transport policy solutions and define their potential contribution to the economic, environmental and social objectives. Strategic modelling was undertaken on a set of scenarios that represent integrated packages of solutions. Comprehensive appraisal work has been undertaken to support the recommended policies and 17

18 18 Transport Transport vision for a growing world city
19 investment needed to meet the challenges facing London over the next 20 years. The first major T2025 document, T2025 Transport Challenges for a Growing City, was released in June 2006 and formed the basis for stakeholder engagement. The comments received from stakeholders were an important input to this document. This vision document summarises the work to date. It describes the significant ongoing population and job growth facing London, and the economic, social and environmental challenges arising from this growth. It sets out the vision and objectives for transport in London and focuses heavily on the solutions and implementation. The benefits of investment are quantified and key implementation issues are discussed, particularly funding and delivery constraints. Analysis methodology A range of tools were used in the T2025 project. The primary transport modelling tool was the London Transportation Study (LTS) model. LTS is a conventional four stage transport model. It uses inputs on population and job growth, and current and future public transport and highway networks to provide estimates of future system performance. It is widely accepted as the best available tool for strategic transport assessment and to model infrastructure and policy options, which have multi-modal implications. A second model, Railplan, was used to support the LTS modelling. Railplan is a public transport assignment model, which takes public transport demand matrices created by LTS and assigns them to a detailed representation of the public transport system. In addition to transport modelling, wide-ranging analysis was also carried out to address the contribution of policies to the economy, social inclusion and the environment. This included: Agglomeration impacts work to assess the productivity benefits from the clustering of businesses in Greater London Social inclusion impacts analysis of the impact of various policy options and infrastructure investments on the travel times between areas of deprivation and main employment centres Environmental sustainability analysis of the impacts of the different scenarios on transport CO2 emissions 1.4 Stakeholder feedback Written submissions from 40 major stakeholder groups were received on the T2025 Challenges document, launched in June Overall, London businesses, community organisations and boroughs support the need for T2025. They welcomed the analysis and recognised the need for a strategic vision for transport in London. The overall T2025 framework of objectives and policy options was widely endorsed. 19
20 Specific issues raised were: Strong support for Crossrail, but concern about its timing Need to ensure the needs of outer London are better identified and addressed Growth should be accommodated on public transport, walking and cycling modes as much as possible The extent to which job growth should be in central London Need for greater emphasis on demand management measures Widespread acceptance of the role of road user charging as part of a national scheme, accompanied by investment in alternatives to car travel Need to better cover a range of more specific issues for example, Thameslink, freight, air transport, public realm, river services, orbital travel and land use planning Need to address implementation issues in the vision document The comments received from stakeholders have been very useful in developing this vision document. The quality and clarity of the submissions are an indication of the level of interest in transport planning in London. Several issues were raised by stakeholders which led to the consideration of additional policy measures or strengthening of certain proposals. Where stakeholders sought clarification and further detail on particular elements of the T2025 analysis or policy options, these have been included in the document wherever possible. A number of strategic issues, most notably the balance between central and outer London, divided opinion among stakeholders. In these cases, TfL has considered carefully the implications of any change in policy. In general, the overall framework of objectives and policy options, as well as the principles and directions in the Challenges document and the London Plan, have been carried through to the vision document. The launch of the T2025 vision document represents a further stage of engagement, which will inform future revisions of the Mayor s Transport Strategy and will guide TfL s future directions and priorities. T2025 complements the Mayor s current transport strategy by providing a longer-term vision and investment strategy. It is expected that the T2025 vision will be regularly reviewed and updated. The planning and evaluation tools established in T2025 provide TfL with a sound basis for ongoing high-quality planning and policy development. Modelling estimates are indicative and will be kept under review. The immediate use of T2025 will be to support TfL s submission to the Government for the CSR2007. Over the longer-term it will form the foundation for a revision of the Mayor s Transport Strategy. 20 Transport Transport vision for a growing world city

21 21
22 2 The London Plan and transport vision The Mayor s London Plan sets out how his vision will drive policy across the Capital, captured in six goals under three overall objectives: Economy To accommodate London s growth within its boundaries without encroaching on open spaces To make London a more prosperous city with strong and diverse long-term economic growth Environment To make London an exemplary world city in mitigating and adapting to climate change and a more attractive, well designed and green city To make London a healthier and better city for people to live in Social To promote social inclusion and tackle deprivation and discrimination To improve London s accessibility This gives rise to the three major challenges which form the strategic framework for T2025 namely supporting the economy, environment and social inclusion. The London Plan has many dimensions but these three have been identified as the core ones which transport can contribute the most to, and should therefore focus on. The T2025 vision is to create: A world class transport system which delivers the safe, reliable and efficient movement of people and goods that enhances London's economy, environment and social inclusion. To achieve the vision, a specific transport goal has been developed under each objective: Supporting economic development by improving public transport and managing the road network effectively in order to reduce congestion Tackling climate change and enhancing the environment by reducing CO2 emissions, improving air quality, reducing noise and improving the urban environment Improving social inclusion making transport more accessible and safer for all users 22 Transport Transport vision for a growing world city
23 23
24 3 Structure of the document and approach This document first describes the challenges associated with the three objectives (economic, environmental and social). After describing the challenges, an assessment is made of a hypothetical scenario based on TfL s current investment programme to This scenario, called the 2025 Reference Case, is evaluated using the modelling and other analysis to see how far it goes in meeting the challenges and achieving the objectives. Six transport strategies to achieve the objectives and overcome the shortcomings of the reference case are then described. The strategies follow a logical sequence of policy interventions. The general principle is that policies that get the best performance from existing infrastructure and manage demand to make better use of existing capacity, should first be exhausted before new capacity is provided. In evaluating the solutions, the analysis uses the results of the modelling, which was carried out on four scenarios. The purpose of the scenario modelling was to assess integrated packages of solutions which build on each other incrementally to produce the best overall strategy. The scenarios are: Scenario Reference Case Includes the funded investments in TfL s investment programme up to 2010 Scenario 2 PPP Involves renewing and enhancing Tube capacity, based on the full 30-year PPP to which the Government is committed by the contracts signed in 2002 and 2003 Scenario 3 Crossrail Provision of a new mass transit link running from east to west across London and additional bus capacity to support London s growth prior to 2016 Scenario 4 T2025 programme Includes enhancements to the national rail network; Crossrail 2; DLR and light transit schemes and a package of measures to reduce congestion and emissions that includes a climate change action plan, smart transport measures and road user charging 24 Transport Transport vision for a growing world city
. These are used to evaluate the effectiveness of the solutions.")
25 A full list of the schemes in each scenario is provided later in section 6, Table 2 Performance indicators Linked to the vision and objectives, key system performance indicators have been used to assess the modelling scenarios and conduct the appraisal of options (see Table 1). These are used to evaluate the effectiveness of the solutions. Table 1 Key T2025 performance indicators Objective Supporting economic development Tackling climate change and enhancing the environment Improving social inclusion Indicator and measure Increase in productivity benefits arising from greater agglomeration Agglomeration benefits, bn present value over 60 years Increase in GDP attributable to transport investment bn present value over 60 years Improvement in employment accessibility The change in the number of jobs accessible by public transport within 45 minutes travel time Reduction in public transport crowding Crowding percentage of Tube and rail networks over planning guidance capacity in am peak Reduction in traffic congestion Road congestion, total hours delay, am peak Reduction in CO2 emissions Percentage reduction in tonnes emitted per annum from transport Percentage mode shift from car travel to public transport, walking and cycling Improved access to employment from deprived areas Percentage of population in the 10 per cent most deprived areas of London within 45 minutes travel time of international and metropolitan centres 25

26 26 Transport Transport vision for a growing world city
27 London s challenges Supporting economic development Population growth London continues to experience sustained population growth. Since 1988, London s average population growth has been around 45,000 people each year. More recently, the growth rate has been even higher in 2005 London s population grew by nearly 90,000, the highest annual growth since London s population is projected to grow from 7.5 million in 2005 to 8.3 million by Housing and population growth will be spread across the Capital. Each of London s subregions will face significant growth of around 100,000 people or more. The biggest increase in housing is expected to be in the east, where a 10-year target of 140,000 new homes is proposed. The growth challenge extends beyond London. Around 500,000 additional homes are projected in the wider South East region by Many new housing areas are within commuting distance of London. An additional 150,000 commuting trips into London could be generated daily, creating significant additional commuting pressures on London s radial rail routes and the highway network in London Economic growth London s economic success is a significant driver of the national economy. London s tax export contribution to the national purse (which is taxes generated less public spending received) was conservatively estimated to be 13bn in 2004/05. And the faster London grows, the more it generates higher tax exports for the national benefit. Conversely, if London s economy suffers, the nation s finances suffer. London plays a distinctive role in the UK economy, which is reflected in its different economic structure. The Capital s economic activity is much more focused on financial and business services and less on manufacturing and the public sector than the rest of the UK. London accounted for 15 per cent of total UK employment in 2006, and for 19 per cent of the UK s GDP in In terms of the scale of its involvement in world capital markets, only New York and Tokyo are comparable with London. London s continued productivity and prosperity are linked to two key factors sustained investment in 27
28 Figure 1 Growth of population and employment to Millions Total population (m) Total employment (m) 28 Transport Transport vision for a growing world city
29 transport, and its ongoing ability to attract and retain highly skilled individuals. Economic growth has been significant in London over the past decade and there is evidence that London is experiencing strong sustainable economic growth. Gross value added is anticipated to increase by 80 per cent between 2003 and Employment is expected to grow by 20 per cent from 2003 to 2025, an increase of almost one million jobs (bringing the total to 5.5 million). Central London currently accounts for more than one third of all employment in London. By 2025, around 360,000 more jobs are predicted to be located in central London. The job growth will be concentrated in an east-west corridor stretching from White City through the City of London to the Isle of Dogs and Thames Gateway, including Paddington and King s Cross. In their responses to the T2025 Challenges document, several stakeholders raised the issue of decentralisation of employment, ie whether more employment could or should be located outside central London. In the development of the London Plan analysis was carried out of alternative land use patterns to test their feasibility. The conclusion was that employment in the financial and business services sectors would continue to be concentrated in the central area because it is the preferred location of business. It is unlikely that these market forces could be resisted. Such a strategy would undermine the agglomeration and productivity benefits that are at the heart of London s economy. In addition, the density, efficiency and attractiveness of the radial transport system to central London could not be replicated cost-effectively across numerous town centres. Notwithstanding this, the proposals in T2025 will improve the capacity and reliability of transport links to and between local town centres. Two-thirds of the employment growth (about 565,000 jobs) is projected to be located outside the central area. The London Plan, and therefore this document, recognise this and the distribution of the Plan s forecast economic growth reflects the aims of the Plan, namely to achieve: Regeneration of east London Maximum economic benefits through agglomeration (the City, Docklands) Sustainable development of new opportunity areas and areas of intensification in several parts of London Enhancement of the role of town centres across London 29

30 Figure 2 Major development hotspots Across London, there will be specific local hotspots where population and employment growth will be concentrated. These will generate significant additional demands on regional and local transport networks. There are key transport capacity enablers that must be in place to ensure these developments can proceed. Each location will need both effective mass transit linkages and local transport improvements to ensure their viability and sustainable development. London businesses consistently rank transport constraints, such as delays and crowding, among their greatest concerns. There are cost implications of people being late at work, loss of productivity, sickness absence, missed meetings and lost business due to public transport crowding, uncertainty and delays. Transport deficiencies also have an impact on the recruitment and retention of staff, with consequent cost implications for businesses. Severe rail crowding affects the attractiveness of London for inward investment if employers are faced with staff that are tired, stressed and uncomfortable on arrival at work. The financial and business services industry provides around 19bn a year to exports and is predominantly centred in London. It is also internationally geographically mobile and the UK economy, not just London, would be at risk if it moves elsewhere. 30 Transport Transport vision for a growing world city
31 31

32 4.1.3 Transport and agglomeration The Capital s highest value economic activity is tightly concentrated within the financial and business services sector and the creative industries, in London s central area and Docklands. A key reason why London can support such high densities is the availability and quality of public transport. Without the rail and Underground capacity into central London, it would be impossible to sustain such a dense employment cluster. London has the UK s highest productivity more than 20 per cent higher than the rest of the country giving the UK its international competitive edge. The close location of businesses to each other allows them to take advantage of agglomeration economies. Agglomeration is the process of employment clustering that produces: A larger, more specialised labour market More competing and complementary businesses and institutions A larger, more specialised client market Greater potential for contact and knowledge sharing Transport improvements support a higher effective density of development than would otherwise occur. Such improvements that contribute to a reduction in congestion, or an improvement in journey times, can extend the size of a cluster. Analysis shows that for major public transport infrastructure schemes in London, the agglomeration gains are of a similar magnitude to the transport user benefits that have been the traditional focus of appraisals. 32 Transport Transport vision for a growing world city

33 Furthermore, agglomeration has a significant environmental benefit. Public transport investment facilitates higher population and employment densities, which generate a substantially lower carbon footprint per person. Each Londoner s CO2 footprint is 40 per cent less than the average UK resident. If London is to capitalise upon these opportunities and retain its key role within the global marketplace, sustained investment in transport infrastructure is essential. To fulfil the potential for greater agglomeration, London will need the necessary transport infrastructure and services to move more people into, and out of, the central area. The growth of the economy can only be supported with an efficient, high capacity transport system. Having effective mass transit and local public transport systems is critical to supporting high density employment and economic development. Without this necessary investment, jobs and economic growth will be at risk. Analysis for T2025 demonstrates that the proposed T2025 programme would contribute an additional 180bn over 60 years to the UK economy from agglomeration and other economic benefits. Without the T2025 programme, modelling shows that up to 30,000 jobs in central London could be at risk. In addition, this investment is needed to support the continued growth and vitality of the economy outside central London, especially in local town centres, where the density of employment and population can be supported by efficient public transport networks, and improved walking and cycling links. 33
34 4.1.4 Improving public transport To support sustainable economic development there are two inter-related transport challenges. The first challenge is to improve London s public transport system to accommodate the growth of employment. This has two components, namely getting people to work on reliable radial links within acceptable levels of crowding; and taking account of the more dispersed growth of housing, employment and leisure trips in outer London, ensuring that as many trips as possible use public transport, walking and cycling. The second challenge is to effectively manage the road network and reduce traffic congestion. The population and employment growth in London will be in different locations thus maximising the task of getting people to work. Based on just the reference case investment, public transport demand in the morning peak is projected to grow by a minimum of 16 per cent by With the necessary investment in the T2025 programme, around 40 per cent of total travel could be accommodated on public transport in the future. This is critical to the sustainable growth and competitiveness of London. To provide for London Plan growth in a sustainable way, overall public transport demand is projected to increase from 10 million daily journeys in 2005 to 12.8 million in Total travel will increase from 27.2 million to 31.2 million journeys every day. The four million extra journeys every day will create a significant task across the network and at different times, ranging in nature from radial trips into central London, to dispersed trips in outer London. The concentrated nature of economic activity in central London means that commuting flows to central London are heavily dependent upon public transport, especially rail. The Underground and buses also play a critical role in distributing people around central London. The major radial public transport movement into central London every morning is expected to grow by an additional 240,000 trips into the central area, and a further 30,000 trips within it. The overall task will be to move more than 1.4 million people a day in and out of the central area by This will contribute to an increase in rail demand of around 40 per cent. 34 Transport Transport vision for a growing world city

35 Figure 3 Spatial distribution of employment and population growth Projected employment growth 2001 to 2025 Concentrated job growth in a central east-west corridor Large radial flows to central area Projected population growth 2001 to 2025 Population growth across London Dispersed travel across London 35

36 The magnitude and concentration of travel into central and inner London in the morning peak is very significant, reflecting the concentration of employment there. Looking beyond the radial mass transit demand into central London, the remaining transport task in London is also very significant and more diverse. Forty three per cent of all travel starts and finishes in outer London, where demand is more evenly split between car, public transport, walking and cycling. Commuting does not dominate the task as much. A range of trip purposes including leisure, education and shopping are more prominent; for example, education trips contribute significantly to peak Figure 4 Trip density by destination (am peak 2025) 36 Transport Transport vision for a growing world city
37 demand. For non-commuting trips, travel in outer London, trips into local centres and off-peak travel, bus is the dominant public transport mode, supporting two-thirds of all public transport demand. The reference case suggests that bus travel in London could grow by around 30 per cent by This growth will have a disproportionate effect on the performance of the public transport network because infrastructure and services are already heavily crowded, and contain little resilience. Figure 5 Spatial pattern of travel across London with mode shares (daily 2006) Outer 7% Inner 9% 2% Central 3% 5% 4% 9% 18% 43% Public transport Car Walking and cycling 37
38 Figure 6 Weekday trip purpose by time of day (2005/06) Million trips Trip start time Leisure Shopping/personal business Education Other work Commuting Managing the road network The previous section covered the first major transport challenge associated with the economic development objective. The second transport challenge is to manage the road network to reduce traffic congestion and CO2 emissions. The road network plays a vital role in London s economy and is a fundamental part of the transport system, supporting a wide range of uses. Managing the demand for car travel and its related congestion, as well as other adverse impacts, is central to maximising the network s use and value for the movement of people and goods. But the overall objective goes beyond managing traffic. The challenge is to use road capacity in a way that balances the needs of all road users. TfL has undertaken considerable work to 38 Transport Transport vision for a growing world city
39 better understand the issues and problems faced on London s roads and streets, and to develop a strategic approach for future policies. T2025 builds on this work to develop an effective and efficient road network for the movement of people and goods, as well as meeting the Mayor s objectives for improving the urban realm and local regeneration. But the overall objective goes beyond managing traffic. The challenge is to use road capacity in a way that balances the needs of all road users. The car remains an important mode of travel in London because of its convenience and flexibility. In outer London more than 50 per cent of all journeys are by car. Car travel is the most convenient and quickest option for many trips. But, cars can impose negative impacts on quality of life and the environment. Given the magnitude of the growth in travel expected in London, it is not a feasible or desirable option to attempt to support the four million extra journeys by car travel. Traffic levels overall have been stable on the strategic road network over the past five years. However, congestion levels have been rising because increasing demands by a range of uses has placed pressure on the fixed capacity. Effective road space for motor vehicles has been reduced due to the reallocation of road space to bus passengers, pedestrians and cyclists, and to improve road safety and the public realm. The traffic challenge is not confined to car travel. London s road network is vital for the 82 per cent of London s freight that is moved by road. Delivery and servicing operations are essential to support employment, business viability and economic growth. London will need to accommodate a projected 15 per cent increase in freight movement by 2025 in order to support economic growth and development. The majority of freight movements in the future will continue to be made by vans and lorries, given their flexibility and efficiency. Where appropriate, modal shift to rail and water will be encouraged to increase their mode share, although the scope for this is limited. Freight reliability needs to be enhanced, while reducing its impact on the environment and society. If freight cannot be moved around in an efficient and reliable way, business costs will rise, making industry less competitive and constraining London s economic development. At the local network level, kerb space for delivery can bring freight traffic into conflict with other users. A lack of places to deliver legally also increases fines and distribution costs. It also reduces the ability to make deliveries and so increases congestion, fuel use and emissions. Furthermore, pressures on road capacity have extended beyond transport uses. Road space has increasingly been unavailable as a consequence of works by utility companies. London s road network also comprises the bulk of the city s public realm. Enhancements to improve liveability often need to take road space away from motorised traffic. These increasing demands on a fixed road capacity have resulted in increasing congestion. Although the morning and 39
40 evening peaks are usually the busiest time for the road network, there are also considerable delays for road users at other times of the day and at weekends. Congestion has also been spreading rapidly into inter-peak periods and onto local roads. The widespread congestion across London is a real impediment to the Capital s economy, which threatens its future success as a world city. Congestion costs impose a major burden on business in London, making it less competitive and costing the equivalent of an estimated 1.6bn per annum. Congestion is twice as bad in London as other UK cities and causes major inefficiencies for business. Traffic congestion is not only a transport issue it degrades quality of life. Private road transport vehicles are the most significant contributor to CO2 emissions from transport, and the existence of traffic congestion further increases road transport emissions. Road freight emissions make up 23 per cent of London s transport CO2 emissions. Even without increases in freight movement, rising congestion could result in more freight emissions. Meeting the Mayor s climate change target can only be achieved if traffic congestion,and hence road transport emissions, are reduced. The challenge of capturing more travel on public transport, walking and cycling modes will require significant investment and policies to increase the attractiveness of alternatives to driving. Public transport will need the required road space to move large numbers of people efficiently and reliably. Continued road space re-allocation to public transport is therefore a critical requirement. In summary, over the past few years effective road capacity has been reduced by a range of interventions, both planned and reactive. There will be an ongoing need to re-allocate road space from private motor vehicles to other uses. The first policy goal in the future will be to eliminate inefficiencies, such as poor coordination of road works and inadequate enforcement. This will ensure that the maximum possible road capacity is available for use. The second goal will be to optimise the use of this capacity and find the best balance between the various demands of users and initiatives to enhance the urban environment. 4.2 Tackling climate change and enhancing the environment Climate change If London is to grow and become an exemplary, sustainable world city, it must use natural resources more efficiently, improve its re-use of resources and reduce waste and environmental degradation. Achieving these broad aims will make London a healthier and more attractive place to live in, visit and do business. However, there are growing pressures on London s environment due to current and projected growth in the number of people and economic activity. This growth will bring significant extra demand for scarce resources such as water and energy. In addition, the city has the poorest air quality in the UK. 40 Transport Transport vision for a growing world city

41 41
42 The most pressing challenge and one which is now at the heart of the Mayor s London Plan is the need to address climate change. The Stern report on the Economics of Climate Change confirmed that the potential global impacts are so serious that action to mitigate them must be put in place now. London has the opportunity to play a key role in reducing its energy consumption and carbon emissions, while increasing its use of renewable energy sources and becoming a more energy efficient city. The Further Alterations to the London Plan include the target of a 60 per cent reduction in CO2 emissions by 2050 (from 2000 levels). Over the period of the T2025 programme, a reduction of 30 per cent in CO2 emissions from 1990 levels is the target. Transport is a significant contributor to CO2 emissions, responsible for about nine million tonnes (21 per cent) of London s CO2 emissions. This includes ground-based aviation activities only (for example, landing and takeoff cycles) but excludes emissions from flights. Road transport is the largest emitter, generating about 80 per cent of the total, of which private vehicles and road freight account for around 50 per cent and 23 per cent of total emissions respectively. Reducing traffic demand and congestion is central to cutting CO2 emissions in London. Without intervention, surface transport emissions are projected to rise as London s population continues to grow. In addition, air travel is a very important contributor to CO2 emissions, as the revised London Plan makes clear. This document does not include this source of emissions in its analysis, as aviation policy is not within the Mayor s remit. Nevertheless, if aviation Figure 7 Sources of London s CO2 emissions Carbon dioxide emissions from London London transport emissions Domestic 44% Transport 21% Public transport 17% Groundbased aviation 11% Car and motorcycle 49% Industrial 7% Commercial 28% Road freight 23% 42 Transport Transport vision for a growing world city
43 CO2 emissions were included it would further highlight the need for action Air quality and noise Air pollution affects people s health and quality of life. It particularly affects the most vulnerable people in society such as the very young, older people and those with heart and lung conditions. The European Union has introduced legally binding targets for national governments to reduce air pollution to levels at which no or minimal effect on human health are likely to occur. Reducing pollution from vehicles and cutting overall traffic levels is a key part of the Mayor s air quality and transport strategies, and is also vital for achieving the Government targets. Noise is increasingly seen as a key quality of life issue, as it can increase stress, disrupt sleep or concentration and interrupt conversation. In a 2003 MORI poll of Londoners, 46 per cent considered noise a problem, with 24 per cent including noise in their three top priorities for improving the quality of the environment in London. Transport is a significant source of noise in London. The Mayor s Ambient Noise Strategy recognises the environmental and social significance of noise, and contains proposals for tackling noise in the Capital Improving the urban environment London enjoys high quality streetscapes and world class architecture. It also has many areas suffering neglect and under-investment. Improving the urban realm enables greater enjoyment of the city, improves Londoners quality of life and attracts business and tourism. Good urban design and high standards of maintenance are central to this aim. Incorporating these principles into TfL s work will help to make London's streets, spaces and transport systems safer, more attractive, more comfortable and easier to use. Improving the urban environment can also have a positive impact on travel behaviour. It can encourage people to walk, cycle or use public transport rather than travel by car. It does this in two ways: by making the conditions for using those modes more appealing and safer, and making high streets and town centres more attractive than out of town shopping centres and supermarkets, which are usually accessed by car. Improving the urban environment also enhances social inclusion by supporting modes of transport that are free or low cost to use. This particularly benefits those groups most dependent on walking and local bus services, including households on low incomes, older people, women, children and people from black, Asian and minority ethnic (BAME) backgrounds. It can also help to address some of the areas of London most in need of attention where poverty and urban decay go hand in hand. Through its impact on travel patterns and mode choice, such action also supports the T2025 objective of tackling climate change and enhancing the environment. 43

44 Thus, improving the urban environment supports all three T2025 objectives. 4.3 Enhancing social inclusion Transport and accessibility Despite its wealth, London has some of the worst areas of deprivation in the country. Some of these are concentrated in areas with relatively poor integrated transport and insufficient access to employment and essential services. At the same time, however, some deprived areas in London are well-served by public transport services. This demonstrates the complex nature of the social inclusion challenges in London. The causes of social exclusion are complex and multifaceted. Although transport plays an important role, the causes of exclusion go far beyond issues such as whether transport is available and physically accessible. Improving overall accessibility in London is key to tackling social exclusion. This involves action to address the availability and physical accessibility of services, as well as measures which respond to people s specific transport concerns: the cost of fares; lack of information on what is available; the fact that key services are located too far away or have inflexible opening times; and the fear of using public transport and walking at certain times. Solving accessibility problems can be about transport, but also about locating and delivering key activities that help people reach them. 44 Transport Transport vision for a growing world city
, with even greater gaps in the")
45 Better access to employment opportunities is an important issue to address as there is significant potential for London to contribute more to the growth of the UK economy. The level of participation in the labour market in London is lower than the average of the UK as a whole (around 70 per cent compared with 75 per cent nationally), with even greater gaps in the employment rate of women and for BAME groups. If London s employment rate increased to the UK level, an additional 274,000 workers would be available. Transport is vital to provide access to essential services such as education, healthcare, leisure facilities and places of worship. If people cannot access these services they will be unable to participate in the workforce or wider community activity and enjoy a good quality of life. It should be recognised that while transport can enable inclusion and greater participation in employment and social opportunities in the future, it is unlikely to provide the total solution to the problem. Making London a more inclusive place will require action to be taken not just in the field of transport, but across a range of policy areas Barriers to inclusion In understanding the role of transport in improving social inclusion in London, TfL has identified five key barriers to address: 1 Ensuring essential services and activities are located in accessible locations 2 Improving the availability and physical accessibility of transport 45
46 3 Reducing the cost of using public transport 4 Improving the safety and security of public transport and the public realm 5 Increasing journey opportunities Delivering high quality public transport, which can be used by all people regardless of physical abilities, is an important goal. Currently, while all bus services are low-floor, less than one-fifth of the Underground and rail networks offer step-free access from the street to the platform. This limits access to central London and employment opportunities for those who experience mobility difficulties. There is a strong link between deprivation and the affordability of transport. The 20 per cent most deprived areas in London also experience the lowest average household incomes. As a consequence, people in these areas may feel unable to make all the journeys they need to. The cost of personal or public transport is also a barrier for some socially excluded groups. TfL surveys have found that a high proportion of people living in deprived areas do not use public transport due to fear of crime or anti social behaviour. This is often due to concerns about the safety and security of the streets and public spaces that people need to use on their way to and from bus stops and stations, on public transport services, as well as for local walking journeys. There is also a significant link between road casualties and social deprivation, with the relationship being especially strong for children. Those living in deprived areas are three times more likely to be involved in a road accident than children living in other areas. London s streets and public spaces are the connecting links between most public transport journeys as well as being transport routes in their own right. Yet many streets are inaccessible or hard to negotiate for people with mobility problems. Streets and public spaces can also be poorly maintained and badly lit, creating concerns about personal security. Ensuring the door-to-door accessibility of trips is an essential part of improving London's overall accessibility. Improving travel horizons is about reducing long journey times and distances, providing better information and improving trust in public transport and wider personal security. There is a lack of confidence among some groups, such as women, older people and people from BAME groups, that journeys by public transport, particularly the last mile home, are not completely reliable and secure. This highlights the need to plan for and provide total journey quality, not just the link provided by the public transport network. 46 Transport Transport vision for a growing world city
47 47
48 5 Outcomes of the reference case Given the magnitude of the transport challenges, the next key question is whether current plans and policies can produce the system needed to support London s growth and achieve the three objectives outlined in section 2. To assist in evaluating the contribution of scenarios and policies, T2025 produced a hypothetical scenario called the T2025 Reference Case. The reference case includes TfL s investment programme to It includes committed DLR schemes and some national rail schemes. It basically represents the state of the network in 2025 that results from TfL s investment programme to For illustration purposes, only some elements of the PPP (those fully completed by 2010) are included in the reference case. It therefore excludes upgrades to the Victoria, Northern, Piccadilly, District, Metropolitan, Circle, Hammersmith & City and Bakerloo lines. In reality, investment is already going into these committed projects and the cost of not proceeding would be significant. Moreover, it is questionable whether life-expired assets on non-upgraded lines would still be able to function in The reference case therefore provides a comparator rather than a credible alternative. 5.1 Improving public transport The investments in the reference case are all critical for London, but modelling shows that these upgrades will fall well short of supporting the level of growth envisaged in the London Plan. While the schemes will add around five per cent to the capacity of the network, the key offsetting factor is that without further investment post 2010, assets and services will degrade. When this declining reliability is taken into account, effective capacity would not increase above 2006 levels. A key indicator of inadequate capacity is crowding, which could increase on the Tube and national rail by around 40 per cent in the peak by This is additional crowding on top of 2006 levels, where over one third of the network is already crowded (on the Tube this is where more than one person is standing for each person seated). Bus demand could grow by around 30 per cent. The underlying demand pressures without corresponding capacity changes result in a worsening performance not just in terms of crowding, but also in longer running times and more station delays. Without the full PPP upgrades, even maintaining output at current service levels will result in a worsening service because significant degradation of Tube 48 Transport Transport vision for a growing world city

49 infrastructure would occur. An average 30 per cent reduction in capacity, and 10 per cent increase in on-train times across the lines not upgraded, is possible by In reality, the decline is likely to be highly variable and uncertain. Much of the cost of the PPP upgrades is for renewing life expired assets, with capacity and performance enhancements building on the asset renewal. Not doing the renewal and upgrades on two thirds of the network will lead to progressive but unpredictable asset failure. The modelling of this scenario shows that large sections of the Tube network in central and inner London would be more crowded than the busiest parts of the network today. There could be days and weeks when a whole line or section of line is out of action, or running on severely reduced capacity as critical systems fail. On national rail, ongoing demand growth placing pressure on a fixed rail capacity will lead to more crowding on platforms and on trains. This will result in increased dwell times in stations and therefore increased journey times. The reference case Figure 8 Reference case outcomes (difference ) % +35% Percentage % +13% 0 0% PT demand PT capacity Rail and tube crowding Traffic demand Traffic congestion 49
50 assumptions included a 4.5 per cent reduction in train service reliability for all national rail services. In reality, the predicted passenger demand and crowding would only increase to a certain level, at which point alternative modes of transport would be sought or trips would not occur. An assessment of passenger volumes and crowding reveals that around 20,000 trips (equating to 30,000 jobs) would be at risk from predicted crowding being at unrealistic levels. Modelling indicates that a suppression of commuting and growth in the morning peak would occur. Delays would initially force people to try to use alternative modes and many would not be able to get to work. This would result in either economic growth being constrained or significant cost pressures being imposed on other modes (for example, radial bus services) to support the growth. The basic problem with investing only at the levels assumed in the reference case is that the historical public transport demand/supply gap which has built up in London, will not just continue but widen. Investment will lag behind growth even more than in the past. The reference case delivers no net additional public transport capacity, while the underlying public transport demands arising from London s growth and development will be 40 per cent higher than There is therefore insufficient capacity provided in the reference case to keep pace with the demand across all modes resulting from the levels of growth in the London Plan. Figure 9 Public transport demand and capacity gap in the reference case 2.00 Passenger kilometres indexed to Demand Capacity Transport Transport vision for a growing world city
51 5.2 Managing the road network In terms of the challenge of managing the road network, modelling of the reference case shows that congestion will rise significantly in the future. Forecasts show that the overall growth in travel resulting from population and job growth could increase traffic demand pressures by around 13 per cent, unless the right policies are in place to contain it. Twothirds of London s boroughs could experience traffic growth of per cent. Traffic congestion would increase significantly with the reference case, growing by more than one-third above the already widespread network congestion in An additional 60,000 vehicle hours delay in the morning peak could occur. This analysis was based on the assumption that current road capacity is not further reduced beyond 2006 levels. This assumption was used as a hypothetical base case because of the relatively low level of investment in the reference case. In the additional scenarios that build on the reference case that generate higher use of public transport, walking and cycling, road space needs to be re-allocated to support bus priority, walking and cycling needs. If road capacity is further reduced for private motor vehicles to meet these needs, congestion and emissions would rise even further unless the right policies are implemented to avoid this outcome. Overall, the policies and investment in the reference case will not reduce traffic congestion and thus will not support London s economic development. Without the right travel demand management measures, significant increases in traffic congestion will occur. The end result will be large increases in travel times and costs and the lack of appropriate transport alternatives all combining to make London less productive and less liveable. 5.3 Climate change and the environment The reference case would fail to deliver adequate improvement in tackling CO2 emissions. Several factors which will impact on the level of transport CO2 emissions in London in the future were considered in the analysis of the reference case: The total amount of traffic in London as the distance travelled by motorised vehicles has the largest impact on the actual amount of CO2 emitted. Under the reference case analysis, traffic demand could increase by 13 per cent The level of congestion in the future as motorised vehicles perform less efficiently in congested situations. The modelling suggests that congestion could increase by 35 per cent by 2025 The introduction of smart transport measures which impact on people s driving behaviour to encourage more efficient 51
52 driving and to change modes where possible. In the reference case analysis, a modest investment programme in smart transport measures was assumed, leading to an approximate one per cent reduction in both car and public transport trips Changes in the efficiency of vehicle engines as a result of the existing voluntary agreements between car manufacturers and national/european governments and reflecting changing consumer choice. This suggests that there could be a 15 per cent improvement in average vehicle carbon efficiency in the future Looking ahead, therefore, there are two trends pulling in opposing directions. The first is the overall growth in traffic and congestion which will act to drive CO2 emissions in London up; and the second is the likelihood of improvements in vehicle efficiency (and, to a degree, the impact of smart transport investment), which could mitigate the impact of the growth in traffic by reducing the amount of CO2 produced by each trip. The reference case outcomes fall well short of what is required on a number of counts: Heavy crowding on public transport services would limit modal shift away from the car Insufficient action would be taken to manage the demand for car use and prevent traffic and congestion levels rising even further Investment in walking, cycling and smart transport measures would not be sufficient to deliver real benefits for example, attracting new journeys by foot and bike, or through other changes in travel behaviour There would be insufficient technological improvement in the vehicle fleet, such as the transformation of the bus fleet to total hybrid technology and the transition to greater use of renewable energy sources by LU As a result, it is anticipated that under the reference case London s transport CO2 emissions would decline slightly from 8.6 million tonnes (mt) CO2 per annum in 1990 (the baseline year for the Mayor s CO2 target) to 8.1 mt CO2/pa in While this would be an advance on current day operations, it is insufficient to achieve the Mayor s target for CO2 reduction. It represents only a six per cent reduction on 1990 levels, compared to the 30 per cent needed. Further policies and investment are therefore needed to achieve the targets of reducing CO2 emissions in London. 5.4 Social inclusion The levels of investment and policies assumed in the reference case would make a relatively minor contribution to improving social inclusion in London over the next 20 years. There would be some local improvements up to 2010 in public transport services and reliability, for example the East London line extension. But few new services or initiatives would be introduced to benefit areas 52 Transport Transport vision for a growing world city

53 currently lacking in public transport. Initiatives to improve step-free access or station security would be limited due to lack of funding. In addition, the opportunities to improve conditions for walking and cycling and to enhance the urban realm, would be very limited denying local communities the benefits of such facilities. The analysis shows that in most employment areas there would be no improvement in access times from the main deprived areas in London. As a result, the T2025 goal to increase the participation of London s workforce would not be achieved. More generally, the transport investments which are in the reference case would not benefit some of the deprived communities most in need. Summary Considering these outcomes, the 2025 Reference Case would have serious negative consequences for London s long-term economic, social and environmental future. The Capital would fail to grow and develop as envisaged in the London Plan, and the potential benefits in terms of jobs growth and agglomeration would not eventuate. Climate change targets would not be met and social inclusion would not be improved. For these reasons, policies and investment that go beyond the reference case are needed. 53

54 54 Transport Transport vision for a growing world city
55 Transport strategies 6 Six transport strategies have been identified to overcome the shortcomings of the reference case and achieve the objectives. They are: 1 Renewing the existing system 2 Ensuring the existing system is efficient and safe 3 Reducing the need to travel 4 Influencing travel behaviour 5 Reducing congestion and emissions 6 Providing new capacity The strategies follow a logical sequence of policy interventions. The general principle is that policies that get the best performance from existing infrastructure and manage demand to make better use of existing capacity, should be exhausted before new capacity is provided. However, the implicit assumption is that the first priority is to keep maintaining and operating the current system. The core system of infrastructure and services supporting existing activity must be retained. This is a prerequisite to enhancing the system. 6.1 Strategy one renewing existing infrastructure Renewal is the repair and replacement of assets to provide reliable and safe services. Timely, ongoing renewal helps reduce future maintenance costs. The most important renewal task facing TfL is on the Underground. The delivery of the PPP will achieve a state of good repair on the Underground around Achieving a state of good repair will reduce Underground delays caused by asset failure by 30 per cent. Renewal also delivers effective new capacity. The Tube will require ongoing investment to maintain the assets in a state of good repair once that condition has been reached. Investment in the bus fleet over the period will result in a more rapid transition to a low carbon fleet by utilising hybrid technology, which should deliver CO2 emission savings of up to 40 per cent per vehicle. Depending upon the rate of technological development, there will be opportunities to move to even more CO2 efficient alternatives prior to 2025, such as through the greater use of biofuels and hydrogen. Continually improving the bus fleet to be more environmentally efficient will also improve air quality and reduce noise pollution. TfL is at the 55
56 forefront of implementing new technology for buses. Since March 2006, 59 per cent of buses comply with the Euro III standard and the first Euro IV have now been introduced, with nitrogen oxide (NOx) abatement technology fitted as standard. On the road network TfL s aspiration is to maintain a state of good repair of the assets. In this way, work on both TfL and borough principal roads will be focused on removing the historic under-investment within the next five years. However, the ongoing cost of maintaining London's road assets in a state of good repair over the next 20 years will place significant continuing demands on TfL s resources. For example, investment will soon be required in London s ageing traffic signalling infrastructure and on highway structures, lighting and tunnels. It is essential that all transport assets are renewed and then replaced at the end of their useful life. Keeping infrastructure in a state of good repair will require an increasing proportion of transport funding. Letting assets run down and allowing systematic failure must be avoided to ensure that the capacity and reliability of the network is maintained. 6.2 Strategy two ensuring the existing system is efficient and safe Whereas renewal is about improvements to existing transport infrastructure, operational efficiency is about the operation and management of infrastructure and services. Public transport Public transport efficiency measures can deliver a range of benefits including lower costs, improved reliability and capacity, greater safety and security, enhanced accessibility, and better information. These will all improve the attractiveness of public transport and therefore increase usage. They must support the infrastructure investments to maximise the use and benefits of new capacity. Extracting maximum capacity and reliability from the current network Getting more capacity and reliability from the current network can be achieved through improved vehicle design, control systems, and improved incident-response systems. More automated operations can take advantage of technology and improve efficiency. Improving safety and security Further improvements in actual and perceived security will be made through the use of CCTV on more vehicles, stations and in town centres, more Help points, and the increased availability, visibility and helpfulness of staff in customer areas of the Underground, rail networks and bus stations. Better enforcement and policing are also needed. Improving ticketing and information Provision of multi-modal real-time information accessed through a range of mechanisms will be possible in the future. A fully integrated smartcard system across all modes is essential. 56 Transport Transport vision for a growing world city
57 57
58 In summary, there are many different public transport operational improvements that need to be implemented in London. The first priority must be to make the best possible use of current resources used in providing the existing system. Improving operations beyond this requires choices to be made between improving the quality of existing services or providing more services on existing infrastructure or providing new infrastructure. Operational efficiency is not a stand-alone answer to London s public transport needs. The basic infrastructure must first be in place. Road network The way the road network is managed by TfL and the boroughs is critical in shaping demand, controlling operations, providing information and coordinating works. The best available policy tools need to be used by TfL and the boroughs to avoid any unnecessary reduction in available road space, ensure that maximum capacity is available from the existing network, and allocate capacity appropriately between the competing demands. The measures include: On-street parking and loading controls better controls are needed to reduce the disruption and congestion caused by stationary vehicles Congestion Charging in central London the efficiency of the highway network will be managed through the continued operation of the extended central London Congestion Charging scheme and planned western extension Network Management Duty this involves implementation of TfL's Network Management Duty under the recent Traffic Management Act, including the development of Network Management Planning and corridor plans Improved signal control ongoing programme of renewal of London s traffic signals, to replace outdated equipment and improve functionality Better management of street and road works through LondonWorks (in partnership with London s boroughs), utilising the overrun charge (subject to Government legislation) Improved traffic operational management and on-street enforcement improved management of disruptions and contraventions through more effective enforcement of parking controls, bus lanes and moving vehicle contraventions Real-time traffic and incident management via the London Traffic Control Centre. Intelligent Transport Systems technology can be used to provide real-time information for monitoring, network information, signal adjustment and enforcement purposes Reducing bottlenecks identification and implementation of solutions (where practical) for existing pinch-points or traffic congestion hotspots Freight operations supporting business through a range of measures to improve freight servicing and minimise impacts. 58 Transport Transport vision for a growing world city
59 Maximising the contribution of these public transport and road network operational initiatives would deliver additional effective capacity compared to a situation without these measures. This will be important to maximise the efficiency of the existing system and support increasing needs like growth in freight, additional bus lanes, and walking and cycling requirements. The boroughs Local Implementation Plans (LIPs) will be important in implementing these measures which are critical for making the most of the existing road network and minimising the effects of traffic congestion and disruption. Despite their benefits, the road network operational interventions above can only improve congestion marginally in particular locations and improve management of disruption. They will not have a substantial impact in reducing traffic congestion across London. Climate change and the environment As a result of the PPP upgrades across the LU network, a number of benefits in terms of improved energy efficiency performance of the network could also be delivered. This includes instruction in energy-efficient train driving, more automatic train operation and other traction and non traction energy efficiencies. These measures will help reduce CO2 emissions arising from LU s operation and use. Social inclusion Improving accessibility and reducing social exclusion will require measures that address the availability, acceptability, affordability and personal safety of transport. This will require measures to increase the geographic coverage of step-free stations, clear audio and visual information, and the provision of more CCTV on vehicles and at stations. This will need to be complemented with adequate staff and police presence and availability. Road safety can be enhanced through engineering, enforcement and education initiatives. Streets and public spaces can be made safer, more accessible and more attractive. It is essential that the London bus fleet continues to remain fully accessible when the fleet is renewed and groups representing people with mobility impairments are consulted during the design of new vehicles. Support infrastructure, such as bus lanes, bus stop design, walking routes to stops and other bus priority measures also need to be enhanced to allow bus passengers with mobility difficulties to benefit from a fully accessible bus fleet. The proportion of LU and national rail stations which are step-free should also be increased. A target of two-thirds of rail and Underground stations offering step-free access by 2025 would create a much improved network of accessible journey opportunities across London. This represents a challenging yet achievable target. It balances the need to provide a comprehensive network of step-free access stations with the significant scale of the work and the resources needed to deliver it. Adequate information about the provision of step-free services also needs to be available. Complementary measures surrounding stations and bus stops, providing an accessible link between transport provision 59
60 and homes, places of work and services are also important. Improving door-to-door services is a critical dimension in managing and providing for the needs of disabled and older Londoners. TfL will work with the boroughs and service providers to reshape the current services around the principle of a single service. This would need consistent eligibility criteria; an application and assessment process as an entitlement strategy; standardised fares across London; and the use of a wide range of suppliers with consistent performance standards, to ensure people unable to use mainstream public transport receive a better and fairer service in the future. Better coordination of the door-to-door service with mainstream public transport will also ensure that disabled and older people who can use public transport some of the time will have access to the advice and support they need. Safety is a key element to improve accessibility for BAME groups, women and younger people in particular. All transport modes should develop more comprehensive and well-publicised programmes to improve safety in vehicles, at the stations and along connecting walking routes. Special attention should be given to transport interchanges between different modes. This includes providing better waiting environments at bus stops with more shelters, adequate lighting and seating; greater provision of apparent rather than covert CCTV, Help points and staff presence; increased visibility of British Transport Police at Underground/ national rail stations; and more on-street taxi rank facilities with marshals. Summary Getting the most from London s transport infrastructure through renewal and operational efficiency is essential. However, these measures alone will neither address all the existing needs nor support the growth and development of the Capital because they do not deliver additional capacity. The next policy to consider is to manage the demand for travel. 6.3 Strategy three reducing the need to travel Renewal and efficiency focus on the supply side of transport by ensuring that the performance of the network is maximised and costs minimised. A further way to get better use out of the existing system is to change the demand for travel. TDM involves measures to influence travel behaviour to get better use and higher value for users from the existing transport system. The first type of TDM measure is land use planning. Stakeholders stressed the need to use land use planning to help reduce the demand for travel. As advocated in Planning Policy Guidance note13: Transport, policies to reduce the need to travel can encourage more journeys to be made locally by ensuring that key facilities are located in close proximity to residential areas. In addition, the delivery of higher density development that locates housing, employment, and essential services within close proximity of each other, supports the development of public transport to serve 60 Transport Transport vision for a growing world city
61 these areas. Planning new development in this way can help ensure that people have a choice of transport options, and are not overly dependent on car travel to meet their needs. This can have a positive impact on accessibility and social inclusion. Land use planning policy can also have a significant impact on parking provision and hence affect car travel demand. In areas of good public transport accessibility, some London boroughs have taken the lead in promoting the development of low car or car free housing whereby a new residential development is allowed with restrictions imposed on the provision of off and on-street parking. Reducing car parking provision in areas with good accessibility is important in two ways. Firstly, it encourages people to carefully consider if they need to own a car at all, thereby encouraging walking, cycling and public transport use. Secondly, it releases land that would have otherwise been devoted to parking, to be used for more productive purposes such as increasing development floor space, creating amenity space, or enabling additional accommodation to be provided. Together, policies aimed at integrating land use, parking and transport can play an important role in influencing future transport demand. 6.4 Strategy four influencing travel behaviour The provision of travel information and appropriate incentives can influence behaviour and encourage people to use public transport, walk and cycle more often. It helps people to be more aware of the costs of car travel and the alternatives available to them. The primary target of these measures (called smart transport measures) is to reduce car travel and consequently increase the demand for public transport, walking and cycling. These measures can also encourage better use of the public transport system. For example, teleworking and teleconferencing have the potential to reduce some longer distance commuting trips by public transport in specific locations. In addition, some shorter bus trips could convert to walking or cycling. T2025 has identified a wide-ranging programme of investment in smart transport measures which would evolve over a 10-year period and be maintained thereafter. Some of the benefits of smart transport measures investment can be delivered relatively quickly as investment levels increase. Therefore, the T2025 analysis envisages the impacts of such investment increasing over a 10-year period up to 2016, and being maintained thereafter. In this way, a five per cent reduction in car trips and a three per cent reduction in public transport trips is possible by 2016, with similar impacts on travel demand in ensuing years. The impacts would be localised and would require all the measures to be implemented fully and behavioural changes sustained. The proposed investment in smart transport measures represents the optimum that could realistically be delivered, given the level of resources required across London. 61
62 Regarding the long-term role of smart transport investment beyond 2016, travel plans for schools, workplaces and residential developments will need to be continually reviewed and updated to ensure that they are relevant and challenging. In addition, personalised travel planning should continue to target around 200,000 people a year in response to the ongoing changes in population in London. These initiatives will take place alongside wider activity by TfL to inform people of their transport options and the impacts of different transport choices. Smart transport measures investment represents an important part of the future T2025 policy package. On its own, however, it will not have sufficient impact across London to support either existing or future travel needs. Therefore, policies that go beyond these measures are needed. Public transport fares and pricing Public transport pricing can also be used to change the demand for public transport. A variety of fare concessions on public transport is available in London. These include: Free travel at all times of day for disabled people Free travel after the morning peak for all those over-60 Half-price Oyster travel for job seekers entering training or looking for full-time work Free bus travel for the under-16s, and for 16 and 17-year-olds in full time education Half-price Oyster travel for all other 16 and 17-year-olds Reduced rate of travel for students Free travel for under-11s on the Underground after the morning peak if accompanied by an adult As well as facilitating travel for the directly affected groups, these concessions contribute to reducing costs for low income households. Apart from these specific concessions, the overall level of fares is a key affordability issue. T2025 analysis has assumed that fares rise at RPI only during the vision period. This is an assumption for analytical purposes only and clearly could not limit the discretion of the Mayor to change fares in future. While discounts and concessions encourage more use of public transport, pricing can also be used to reduce peak demands, either through higher fares overall or differential prices at different times of the day. Current research suggests, however, that differential pricing would have only a marginal impact on demand, given the magnitude of growth facing London. Unacceptably high fare increases in the peak would be needed to make a significant difference. Raising fares too high risks undermining the overall T2025 objectives. Those least able to pay would face a greater barrier to accessibility. While working hours are becoming more flexible, many workers do not have discretion on their time of travel and would not be able to change their commuting trip. These workers would simply have to pay the higher peak fare. In addition, the policy 62 Transport Transport vision for a growing world city
63 would impact on the cost of getting to work, limit mode shift from car and constrain economic growth. TfL would work with DfT on any future proposal to introduce differential pricing on rail, where it would have the biggest impact (if Oyster cards were in use on all modes). Parking policy The availability of car parking space is a key determinant influencing whether people choose to drive or not. Future policies for parking could therefore play a role in managing the demand for car travel in London. Improved management of car parking supply could be achieved at the local level by London boroughs and in the limited circumstances where TfL or GLA are responsible for car park management. It could involve the imposition of time limits on parking, either by time of day, or length of stay. In addition, more consistency between parking and planning policies and development control is needed to ensure that new developments do not contribute to an oversupply of car parking provision. In general, parking issues are localised and policies should continue to be developed in response to specific local issues by the boroughs. There is also potential to consider a more strategic approach to the management of parking. TfL will work with the boroughs to consider future options. Summary Overall, smart transport measures and parking policies can assist in the short term at the local level in containing growth in congestion in some areas. But the problem of traffic congestion cannot be resolved using these measures alone. 6.5 Strategy five reducing congestion and emissions The desired outcomes The goal of reducing traffic congestion and emissions is critical to supporting economic development and meeting the Mayor s climate change target of a 30 per cent cut in CO2 emissions in London by Achieving this goal would deliver wide-ranging benefits across London. It would enhance the attractiveness of London as a place to live, work and visit, and the overall quality of life for Londoners would be dramatically improved. Less traffic and congestion will result in cleaner air and less noise. Less fossil fuel consumption through reduced traffic volumes and traffic delays will produce lower emissions of exhaust pollutants and CO2. Reducing air pollution, noise and the adverse amenity impacts of heavily trafficked roads will make London s roads safer and encourage more people to walk, cycle and enjoy the urban environment. Reducing congestion will improve road network journey times and reliability thereby supporting essential freight and business travel, and enhancing economic development. Heavy and light rail, the Tube and buses will be the main public transport alternatives 63
64 outside central London. This will require significant expansion of capacity on each of these modes and effective network priority to support increased bus capacity. More reliable and faster bus journey times can be achieved if congestion levels are reduced. This is essential to achieve mode shift from car travel at the lowest possible bus operational cost. If congestion continues to rise, bus costs will increase just to maintain current levels of service. London s public spaces are a vital asset and significant efforts have been made to enhance their value. Implementing further improvements, like the Mayor s 100 Public Spaces programme and revitalising town centres, relies heavily on having the necessary road space to deliver projects. Achieving these desired outcomes is a major challenge given the increasing pressures being placed on London s road network. These demands on a fixed network capacity have resulted in road space re-allocation from private motor vehicles and rising congestion. The goal in the future is to make the most efficient use of road space and balance the needs of all users, focusing on the efficient movement of people and goods (not vehicles). The transport task is to deliver the necessary road space re-allocation in the future, but at the same time reduce congestion. A strategy based on providing new road capacity to support growth would not be effective or sustainable. There are major physical and environmental constraints to Figure 10 T2025 mode share targets m journeys m journeys Cycle 1% Cycle 5% Walk 21% Car 41% Walk 22% Car 32% Public transport 37% Public transport 41% 64 Transport Transport vision for a growing world city
65 increasing road capacity. And even if there was space available for road widening, a policy based on road expansion would not be an efficient way to move people and would simply lead to even more traffic demand. The Government investigated a road-building approach with the London Assessment Studies in the late 1980s but this was proven to be unachievable and ineffective delivering only a very small increase in total London road capacity, costing billions and requiring extensive property demolition. Therefore, growth must be captured on public transport, walking and cycling, and existing traffic levels must be reduced to re-allocate road space for these uses. To achieve the economic, social and environmental objectives, challenging mode shifts are necessary. London has achieved a four per cent mode shift from car between 2000 and The T2025 vision builds on this, with a target of increasing the mode share of public transport, walking and cycling from 59 per cent to 68 per cent (41 per cent public transport, 22 per cent walking, five per cent cycling). This means that around five million extra journeys each day will need to be made by public transport, walking and cycling to support the growth envisaged in the London Plan. These targets reflect the level of transport behavioural change needed to work towards achieving the climate change target; and the reduction in traffic and congestion needed to free up sufficient road space to ensure the efficient movement of people and goods, thus supporting economic development. The mode shifts result in traffic and congestion reductions (compared to the reference case) of around 15 per cent and 30 per cent respectively. The mode shifts are challenging but achievable with the right investment and policies. The range of policy measures available A package of different measures is needed to deliver this strategy. The precise mix will evolve over time and be defined in detail in the future. There are four generic measures: Expansion of public transport capacity, walking and cycling Improvements to the public transport network will be crucial in ensuring that London s growth in population and employment can be accommodated in as sustainable a way as possible. But even major necessary public transport investment would not have a significant impact on reducing traffic congestion and emissions on its own. Similarly, there are many initiatives which can increase the attractiveness of walking and cycling, modes that do not generate any CO2 emissions. T2025 modelling showed that the addition of the PPP and Crossrail would only have a marginal impact on reducing traffic delays in London. Traffic congestion would still be 30 per cent higher than 2006 levels with these investments in place. Investment in the alternatives to driving, on their own, will not generate mode shifts large enough to achieve the T2025 targets. The investments must be accompanied by measures that directly address the incentives and disincentives for car travel. Technological change The reference case assumed that improvements in the carbon efficiency of the 65
66 vehicle fleet will occur as a result of existing agreements between car manufacturers and national and European governments, and wider changes in consumer purchasing choice. Currently, it is expected that the average amount of CO2 emitted by cars in the future could reduce by at least 15 per cent. This will have an important impact in mitigating the effects of rising traffic. But on its own it is insufficient to deliver the level of CO2 reductions needed to meet the Mayor s target. Furthermore, although technological change will help reduce emissions, it will not reduce congestion. The Climate Change Action Plan TfL will work to help implement the GLA s forthcoming Climate Change Action Plan. Central to this are a number of measures which will directly impact on the level of transport CO2 emissions in future. These include proposals for: Eco-driving initiatives to improve the fuel efficiency of people s driving techniques, through advice aimed at individuals and vehicle fleet managers. This has the potential to improve fuel consumption by up to 15 per cent The introduction of hybrid buses across the bus fleet to cut emissions Reductions in freight vehicle emissions as a result of changing delivery restrictions; improved driver behaviour; greater use of biofuels and improved trip consolidation and route planning Increasing the proportion of LU s energy requirements from renewable energy sources. Currently, around 17 per cent of the Underground s energy requirements are sourced through green electricity tariffs. TfL is keen to use its market position to promote the development of additional renewable electricity capacity in the UK through its purchasing power. It will also look to improve overall energy efficiency of operations through driver training and other initiatives by buying more renewable power These targeted measures will bring important efficiency and operational benefits across the transport network. Together they could help reduce transport CO2 emissions by up to 10 per cent from 1990 levels. Without further action to manage the demand for travel, however, London will not meet the Mayor s climate change target. Demand management As outlined in strategy four, smart transport measures can play an important role in both encouraging people to travel more often by sustainable modes, and by reducing car and public transport trips in some circumstances. This would have a beneficial impact on reducing growth in traffic and congestion, although on their own these measures would be insufficient to reduce traffic to the level necessary to deliver adequate emissions reductions. Parking policies can also be a useful tool to influence traffic generation at particular sites. However, they do not impact on through-traffic and have limited impacts as a generic tool to manage congestion and traffic across the network. 66 Transport Transport vision for a growing world city

67 These policy measures can contribute in the short-term to contain some localised congestion. But the scope to influence road traffic patterns network-wide through these measures has rapidly reduced. For example, there is increasingly limited opportunity to route traffic away from congested areas or to shift movements to less congested times of day. They are therefore not strategic network tools to tackle rising carbon emissions. If the cost of motoring increased significantly, it could reduce some car travel. The T2025 modelling assumed that fuel prices would remain constant in real terms from 2007 onwards, in line with Government guidance on the issue. Even if costs rose significantly higher, demand would not reduce enough to achieve the T2025 objectives and climate change targets. The fuel price elasticity of car travel is relatively low because of the car s inherent flexibility and the fact that users generally do not consider the full marginal cost of each trip, including the cost of congestion and pollution. These first four measures therefore, will not achieve the necessary reductions in congestion and emissions. 67

68 68 Transport Transport vision for a growing world city
69 The role for road user charging Road user charging (RUC), as pointed out by the Government, will be an element of the policy mix to reduce congestion and emissions. RUC involves charging directly for road use by time of day, distance, level of congestion or area. The DfT s Road Pricing Feasibility Study suggested that RUC would bring substantial benefits, particularly in urban areas. The Government has stated that it wants to take forward RUC. Its aim is to have a national distance-based charging scheme using satellite technology. National RUC applied London-wide would support the other policy measures to reduce traffic congestion, thus reducing journey times and increasing reliability. It could also incorporate higher charges for the most polluting vehicles. This would ensure the policy would achieve the dual objectives of reducing congestion and emissions. RUC would change demand in two ways by providing an incentive towards behavioural change and mode shift, and influencing people to use more fuel efficient and less polluting vehicles. Apart from its effectiveness in reducing traffic congestion and emissions, RUC enhances economic efficiency. It is different to other policy measures because it can efficiently allocate road space and hence maximise value from the network. RUC is a better way of allocating scarce road space than physically taking space away from private motor vehicles. A risk with other measures that reduce car traffic is that freed-up road space could be quickly taken up again by new car travel. Pricing provides the mechanism to ensure that does not occur. In addition to its congestion reduction capability, RUC is effective in reducing CO2 emissions in four ways: Charging tends to reduce overall levels of vehicular traffic, which reduces fossil fuel consumption It improves traffic flow which can again help reduce fuel consumption The revenues raised can be applied to carbon offset arrangements, which means further reductions Charging can be adjusted to favour the vehicles with the lowest emissions. Analysis of such a wide combination of measures to reduce congestion and emissions shows that the combined impact of technological change, demand management, Climate Change Action Plan measures, the T2025 public transport investment, and RUC would permit: A reduction in London s CO2 emissions from transport of nearly 22 per cent from 1990 levels thus making a significant contribution to the Mayor s target. The remaining eight per cent reduction in CO2 necessary could be delivered through strengthened legislation by national and European governments to improve the carbon efficiency of new vehicles A nine per cent mode shift from car to public transport, walking and cycling A 30 per cent reduction in congestion compared to the 2025 Reference Case. 69
70 Figure 11 CO2 emissions reduction from the T2025 programme (excludes aviation) level % 30% Million tonnes CO 2 pa base 2006 Reference case T2025 programme Impact of vehicle efficiency legislation/ruc impact on most polluting vehicles Mayor s 2025 target Implementing the package effectively RUC would provide a source of transport funds. Key to the successful and acceptable delivery of this package of measures to reduce congestion and emissions, will be the hypothecation of the revenues from RUC to ensure the full package is funded and implemented. The smart transport measures described earlier will play a supporting role by informing people of the transport options available to them and encouraging them to try alternative and more sustainable ways of getting about even if this is just for a few journeys a week. These programmes will provide a crucial step in helping people adjust to the wider implementation of RUC in London, and to benefit from the changes it delivers. 70 Transport Transport vision for a growing world city
71 6.6 Strategy six providing new capacity Why more capacity is needed The first five transport strategies covered a range of policies and operational initiatives to improve the performance of existing infrastructure and services, and manage demand to make better use of capacity. The renewal, operational efficiency initiatives and demand management measures are essential policy solutions to help meet the transport challenges. However, the achievement of all five strategies is dependent on having the necessary public transport capacity in place to improve the alternatives to car travel. Providing new public transport capacity is essential if growth is to be supported in a sustainable and cost-effective way. Selecting the right amount and type of new capacity As mentioned earlier, the additional transport capacity needed for such a dense growing city as London must be primarily in the form of public transport. There will be a significant improvement in connectivity in east London with the delivery of the Thames Gateway Bridge. This will link the development areas in the Thames Gateway and serve the industrial development areas of the Lea Valley, providing a boost to regional road freight connectivity and an alternative to the Blackwall Tunnel and Woolwich Ferry. To help identify the right amount and type of public transport capacity to 2025, strategic modelling was undertaken. This focused on four major proposals, namely PPP, Crossrail, Rail 2025 and a package of longer-term rail and light rail/transit schemes. The analysis used the capacity for each scenario and predicted the 2025 travel demand for each mode. The future performance of the network in terms of crowding and congestion was estimated. Predictions of traffic levels from the model were used to estimate CO2 levels. Separate analysis was then done to predict the agglomeration and GDP benefits for each scenario. The analysis used the key indicators in table 1 to identify the contribution of each scenario, namely: GDP Employment accessibility Crowding Congestion CO2 emissions Mode shift from car Accessibility from deprived areas. Appendix 1 gives a summary of the model results. More detail of the schemes assumed in the scenarios is given in Table 2 and the indicative map of the T2025 transport network given in Appendix 2. 71
72 Table 2 Components of T2025 modelling scenarios Scenario Reference Case National rail Channel Tunnel Rail Link to St. Pancras Chiltern Railways upgrade Heathrow Express extension to Heathrow Terminal 5 London Overground phases 1 and 2: East London line extension from Dalston to West Croydon and Crystal Palace and Gospel Oak to Barking line upgrade Rail reliability increase journey times by 4.5% LU Piccadilly line extension to Heathrow Terminal 5 PPP line upgrades on Waterloo & City and Jubilee lines Reliability an average 30% drop in capacity and 10% increase in on-train times on all lines not fully upgraded by March 2010, ie Victoria, Northern, Piccadilly, sub surface (Circle, District, Metropolitan, Hammersmith & City) and Bakerloo lines DLR DLR Bank to Lewisham three-car upgrade DLR extension to Woolwich DLR Stratford International Canning Town Bus and transits Bus service increase of 2.4% to be achieved by 2010 Greenwich Waterfront and East London Transit schemes phase 1 Other Thames Gateway Bridge Smart transport measures modest investment assumed Rail, Tube and bus fares increase by RPI to Transport Transport vision for a growing world city
73 Scenario 2 Full PPP (includes Scenario 1) LU Full PPP improvements (Upgrades of Victoria, Northern, Piccadilly, sub surface (Circle, District, Metropolitan, Hammersmith & City) and Bakerloo lines Scenario 3 Crossrail (includes Scenario 1 and Scenario 2) National rail Crossrail Bus Increase in bus supply of 20% from 2006 to 2025 Scenario 4 T2025 programme (includes Scenario 1- Scenario 3) National rail Rail 2025: Capacity enhancements to existing lines and East London line extension from Surrey Quays to Clapham Junction Thameslink programme Crossrail 2 DLR DLR capacity enhancement Poplar to Stratford DLR extension to Dagenham Dock Light transit Thames Gateway bus transit schemes (further phases of Greenwich Waterfront and East London Transit) West London Tram and Cross River Tram Tramlink extensions LU Northern line segregation of services Enhanced line upgrades beyond PPP Bus A further increase in bus supply of 20% (total 40% 2006 to 2025) Congestion and Emissions Reduction Plan Other A package of measures to reduce congestion and emissions, including smart transport measures, vehicle technology change, a Climate Change Action Plan and a national road user charging scheme in London Silvertown Link 73
74 Based on the modelling and T2025 analysis, the priorities for new public transport capacity were identified as follows: PPP the reference case showed the dramatic degradation of infrastructure and services that would result from the lack of investment in public transport over the 20-year period. To overcome this, the first priority is to rebuild the Tube by completing the full PPP. This will renew the assets, improve reliability and deliver an additional 25 per cent capacity. The full PPP will also deliver agglomeration benefits of around 20bn. Crossrail the next priority is to deliver the capacity needed to support job growth in central London and the Isle of Dogs, and serve the eastwest core jobs corridor. Crossrail is the essential mass transit link to achieve these outcomes. Modelling shows that Crossrail provides a 10 per cent boost to capacity in the right places, significantly reducing crowding on Tube and rail networks. It will deliver GDP benefits of 20bn comprising agglomeration and other productivity benefits. T2025 programme the next priority includes Rail 2025 proposals and a package of other longer term rail and light transit schemes. Rail 2025 involves upgrading the existing rail network in London and the South East to ensure that employment growth in London is supported by efficient and effective radial links. The programme also includes the key priority of ensuring that the local networks and systems are enhanced to integrate with, and complement, the regional schemes. This includes DLR and light transit facilities that provide important local network connections. In addition, Crossrail 2 is proposed to address the major northeast/southwest corridor through London. T2025 analysis indicates that all the above investment will be crucial in meeting London s future needs. Both the individual components and the package have strong business cases and offer very good value for money. The three big schemes PPP, Crossrail and Rail 2025, supported by bus expansion deliver the 40 per cent extra public transport capacity needed. The programme delivers a significant reduction in crowding of more than 40 per cent below 2006 levels. But there has not been over-investment, crowding is still relatively high, with more than 20 per cent of the network still heavily crowded in The public transport investment, combined with the strategy to reduce congestion and emissions, will support the growth of London s economy and enhance agglomeration. Implementing the schemes will increase the employment catchment area of central London (the number of people within 45 minutes of central London employment) by almost 25 per cent. Total GDP benefits from the package is 180bn comprising agglomeration benefits and productivity savings from journey time savings for business users. Analysis suggests that the T2025 programme has the right balance and mix between the modes in terms of the new capacity. Demand on each main mode grows in line with the additional capacity assumed, while demand 74 Transport Transport vision for a growing world city
75 Figure 12 Public transport capacity 70 Seat kilometres (am peak period, millions) Reference Case Full PPP Crossrail T2025 programme Figure 13 Crowding on national rail and Underground 60 Per cent passenger kilometres crowded Reference Case Full PPP Crossrail T2025 programme 75
76 for car travel is contained and walking and cycling increased. Crowding on the Tube and national rail is reduced below 2006 levels. An assessment of demand and capacity growth since 2001 showed that with the T2025 programme, capacity would finally grow at the same rate as demand. A sustainable transport outcome would be achieved. The mass transit network is the core of the system. However, the regional system needs good local links to ensure journeys are seamless and efficient. Improvements to local facilities will therefore be an essential part of the programme. This includes bus services, light rail and light transit schemes in some areas, walking and cycling links, interchanges and enhancements to the public realm. An overall mode shift of nine per cent from car is possible with the proposed T2025 investment and policies. This shift is critical to achieving climate change targets and supporting economic development. The T2025 programme also enhances social inclusion. The package produces a nine per cent reduction in the average travel time from the 10 per cent most deprived areas to the 10 metropolitan and two international centres. A more detailed appraisal of the T2025 programme is given in section 7. More detail is provided below on the components of new capacity, what each component delivers individually and its contribution to the integrated package, starting with the regional network. Figure 14 Public transport demand and capacity gap with the T2025 programme 2.00 Passenger kilometres indexed to Demand Capacity Transport Transport vision for a growing world city

77 77
78 Proposed elements of new capacity The regional network Full PPP The first major priority should be to complete the full scope of the PPP on time to reverse the effects of decades of neglect on Tube assets and start to respond to the projected employment and population increase over the next decade. The PPP delivers capacity enhancement on the back of essential asset renewal. The full PPP will deliver an average capacity increase of 25 per cent across the Tube network. The increase in peak capacity into central London will be 28.5 per cent. Reliability, journey quality, station facilities and information will also be improved. However, the PPP is governed by some of the most complex and lengthy contracts in the UK public sector, which makes the successful management and improvement of the system a constant challenge for TfL. The major upgrade work in the PPP must also be completed while safely operating existing Figure 15 Increase in peak Underground capacity into central London enabled by the PPP to 2025 Cumulative increase in peak capacity into central London 30% 20% 10% 0% Waterloo & City line 25% 33% 20% Jubilee line 19% 25% Victoria line Northern line Circle, Hammersmith & City and Metropolitan lines Piccadilly line Bakerloo line District line Network total 28.5% from Note: Circles show percentage increase from 2006 in peak capacity for each individual line 49% 47% 38% 78 Transport Transport vision for a growing world city
79 train services and serving ever higher numbers of journeys. In the reference case, a 30 per cent reduction in capacity and 10 per cent increase in ontrain time across the lines not upgraded were assumed leading to an overall reduction in Tube capacity of 12 per cent. The capacity enhancements both prevent this decline from occurring and deliver an additional 25 per cent capacity. On completion of these line upgrades, LU will be able to operate higher frequencies (around 30 trains per hour (tph) during the peaks) with reduced journey times compared to 2006 levels. An increase in off-peak and weekend services will also be implemented to meet increasing demand levels at these times. Further improvements beyond this are not currently part of the core PPP scope but will need to be developed further. In addition to the work committed under the PPP contracts directly, other improvements to ensure the full benefits of the PPP can be realised need to be funded and delivered. These include: Power upgrades to allow the new trains to deliver faster journey times by operating at higher top speeds and higher rates of acceleration Tunnel cooling systems, to compensate for the heat effects of higher volumes of customers and trains Station capacity enhancements at key interchanges in central London to capture the full potential of the additional capacity provided by the investment in train services Station accessibility projects to provide more step-free journey opportunities The analysis of the full PPP, separate from the reference case, has demonstrated the benefits and criticality of completing the full PPP programme. Crowding on the Tube will be reduced by 30 per cent compared to the reference case. This modelling output underestimates the potential real impacts because the reference case assumed (unrealistically) that assets beyond their useful life would still work in The full PPP also delivers agglomeration benefits of around 20bn. The PPP supports an increase in peak Tube demand of around 32 per cent relative to Despite the PPP benefits for the Tube, however, public transport capacity falls well short of matching forecast increases in demand because modes other than the Tube are not expanded. The Tube cannot take all the strain of London s growth. A strategy based on investment only in the Tube therefore impacts on other modes. With the addition of the PPP capacity alone, severe crowding would be experienced along most national rail links into central London. Rail crowding is 30 per cent higher than in Bus demand growth is around 20 per cent higher than 2006, exceeding the capacity growth of 2.4 per cent. Bus and rail would not be able to take the strain of growth without the necessary capacity to move the extra people. Without further public transport investments, bus and rail operational costs will rise, if growth is to be supported. Although the PPP results in Tube crowding being reduced below 2006 levels, almost 40 per cent of the network is still heavily crowded. 79
80 Furthermore, there is severe crowding in critical corridors including: The east-west corridor, including Central and sub-surface lines North-south routes, including the Victoria, Piccadilly and Northern lines via the City The Jubilee line, especially in the Docklands area In summary, the PPP is essential to rebuild the Tube and support some of London s growth. This programme is contractually committed but requires sustained funding. Additional capacity on other modes is also needed to prevent conditions deteriorating and growth being suppressed Crossrail Following the PPP, Crossrail is the next major priority because the growth of the central London economy must be fully supported. Crossrail is the transport spine needed to underpin the most rapid economic growth areas of London and is the most critical addition to the transport network. It will enable the City and Canary Wharf to keep their global edge, support renewal of the West End, help to lock in the benefits of the 2012 Olympics in Stratford, and transform the Thames Gateway through links to northeast and southeast London. Crossrail will also facilitate journeys from Heathrow to London s business districts, thereby improving the Capital's international gateways. Crossrail is the only option that can deliver the capacity needed to support job growth in central London and the Isle of Dogs, improve the east-west core jobs corridor and support the development of new areas and the additional jobs in the Thames Gateway. Without Crossrail, London will be prevented from developing its second business centre in the Isle of Dogs and therefore maximising its contribution to the UK economy. No other transport scheme has arisen during the T2025 process that can deliver these outcomes. T2025 modelling fully validates these strategic roles and the importance of Crossrail. Crossrail provides the largest increase in public transport capacity where it is most needed. Crossrail adds 10 per cent to the overall capacity of the public transport network above the full PPP scenario. An additional 5.8 million passenger kilometres is added to peak capacity. Public transport demand increases by around 25 per cent from National rail boardings rise by around 15 per cent compared to the full PPP scenario. Crossrail and the PPP deliver significant crowding relief on the Tube and DLR, where crowding is reduced by 45 per cent compared to the reference case, with crowding on rail reduced by 23 per cent. Crossrail supports development potential in excess of 260,000 jobs and 70,000 people within the key opportunity areas alone (Isle of Dogs City fringe, Lower Lea Valley, Paddington). Crossrail is vital if development in the Isle of Dogs is to increase to accommodate 200,000 jobs by It will make a vital contribution to improving 80 Transport Transport vision for a growing world city
81 81

82 82 Transport Transport vision for a growing world city
83 accessibility and the attractiveness of the Thames Gateway to the east of Canary Wharf, through its cross-river links to southeast London, and potential links to a DLR extension to Barking Riverside via an interchange at Custom House. Crossrail will deliver a step change in capacity that will attract new investment and economic development. It will serve significant pockets of new residential areas where central area workers will live, for example in areas of the Thames Gateway and beyond in the South East region. These areas will not attract skilled workers without effective radial public transport. Employment accessibility is significantly enhanced by Crossrail, with an additional 90,000 people now able to access jobs within 45 minutes by public transport. The radial network serving London s job growth areas does not have the necessary resilience to manage shocks or additional growth. For example, there is over-reliance on the Jubilee line and DLR for commuting to the Isle of Dogs. The Jubilee line is predicted to remain heavily crowded even after the additional 45 per cent capacity improvement from PPP. Crossrail would deliver this necessary resilience and no part of the Jubilee line would suffer from heavily crowded conditions. Crossrail has considerable benefits for outer London also. It links key outer London town centres, delivering regeneration benefits. Twenty per cent of the development in Southall forecast to take place by 2021, is attributable to Crossrail, equating to nearly 1,000 residential units and 1,700 jobs. Crossrail provides a big boost to the accessibility of other centres including Ilford, Hayes and Harlington, and Romford. Wider analysis, separate to the transport modelling, shows that Crossrail would facilitate up to 13,000 extra jobs in central London by 2016, and about 30,000 by These jobs will be in an area which is 35 per cent more productive than the UK average. Crossrail increases agglomeration benefits within and between the central area and Isle of Dogs. GDP and productivity benefits are also maximised. Crossrail alone would help generate net benefits of nearly 20bn to UK GDP over 60 years Rail 2025 Despite all of the benefits and criticality of Crossrail, on its own it will not be a sufficient response to support London s growth and achieve the objectives outlined in section 2. Commuting in London also relies heavily on the national rail network. T2025 modelling of the full PPP and Crossrail shows an increase in crowding on national rail lines above 2006 levels. More than 40 per cent of the national rail network would still be heavily crowded. Furthermore, a consequence of the strategy to reduce congestion and emissions is that even greater demands would be placed on public transport, including rail, as a result of the mode shift from car. For these reasons, enhancements to the national rail network are essential. 83
84 There is minimal investment in rail capacity funded and committed to proceed in London. The reference case actually shows a slight decline in rail capacity to 2025 because reliability will decline without the necessary investment. The rail system is part of an interconnected transport network in London. For this reason, TfL has been looking at the potential for London s overground railway network to help meet future demand. This Rail 2025 work has identified what needs to be done on rail to best contribute to London s transport vision and integrate with other modes. However, national rail is a Government and DfT responsibility. The national rail network is one part of a much wider network serving the South East. Long distance commuting in London is growing rapidly and originates from areas well beyond London s boundaries. TfL will continue to work closely with Government to maximise the contribution of T2025 and Rail 2025 to the DfT s 30-year strategy and associated High Level Output Statements. The Rail 2025 work shows that meeting growing rail demand in London can be achieved most effectively through a combination of solutions to complement Crossrail. The solutions include Thameslink and a package of other cost-effective measures. Thameslink Thameslink is a major rail infrastructure project that will enhance the rail network in London and the South East. It would significantly increase capacity on the rail network to and through London, via St. Pancras in the north and Blackfriars and London Bridge in the south. Thameslink supports key development opportunities in the vicinity of King s Cross, London Bridge and Cricklewood supporting in excess of 75,000 jobs and 32,450 people to these sites alone. Recent progress was made when Government granted Transport and Works Act (TWA) powers for the scheme. The benefits of Thameslink in London are: Quicker and easier journeys for business and leisure travellers Longer and less crowded trains on main commuter routes Less need to transfer to the Tube or change trains A substantial increase in the number of trains travelling through the core route (St. Pancras to Blackfriars) during peak times (from eight to a capability of 24tph in each direction) Increased capacity on the most crowded sections of the network Investment/redevelopment at London Bridge, Farringdon and Blackfriars stations Improved connection to the new Channel Tunnel Rail Link (CTRL) hub at St. Pancras and King s Cross Removal of the bottleneck at London Bridge Upgrades at more than 50 stations to facilitate longer trains 84 Transport Transport vision for a growing world city

85 Rail 2025 package In conjunction with Crossrail and Thameslink, Rail 2025 recommends a package of lower cost measures, including: Radial infrastructure Longer trains to serve southwest London, including upgrading Waterloo station Longer trains and increasing the number of tracks from two to four on the Lea Valley line between Cheshunt and Tottenham Hale Conversion of the Euston to Watford line, from Harrow & Wealdstone northwards, to an extension of the Bakerloo line Lengthening trains and platforms on Southern and Southeastern lines Additional capacity in the Thames Gateway through longer c2c trains and integration with DLR and CTRL services Provision of additional rolling stock, with reconfiguration and refurbishment of existing stock to make best use of infrastructure Figure 16 Rail 2025 corridor capacity increases to
86 Orbital rail network London Overground is the first step in the creation of an orbital rail network. It will be formed by: Initially joining up the east and north London lines, and in the long-term, the east and south London lines, including new high capacity rolling stock Completing the East London line extensions Electrification of the Gospel Oak to Barking line Increasing frequencies to provide new orbital routes and an integrated service linking some of London s busiest town centres and interchange hubs. Benefits from Rail 2025 These phased Rail 2025 investments (coupled with Crossrail) would increase peak capacity, reduce crowding on London's radial routes and join up these routes with improved orbital rail services (including the East London line extensions). The measures would unlock extra capacity from the existing rail network through extra trains, platform lengths, additional cars on trains and, in some cases, simpler operating patterns. Additional solutions such as redesigning carriage interiors would also enable more passengers to travel on each train. The additional capacity should be matched with improvements to service quality. The Rail 2025 proposals, together with Crossrail, would add around per cent capacity to the rail network. Combined with Crossrail and PPP, public transport demand would increase by around 40 per cent from Rail 2025 delivers significant crowding relief on the national rail network. Crowding on national rail would be reduced by more than 50 per cent compared to the reference case. It will also improve reliability and accessibility, as well as rail capacity. Rail 2025 will deliver significant benefits for outer London. The orbital and radial networks will form part of an enhanced integrated system that will be capable of meeting the public transport task and desired mode shift from car associated with the congestion and emissions reduction plan. People will have opportunities to travel around and across London without having to come into the congested central area. This is a long standing aspiration of many outer London boroughs and was raised in their responses to the T2025 Challenges document. Rail 2025 would directly support employment growth in the high value sectors in central London, supporting productivity improvements and delivering GDP benefits of up to 20bn. An additional 30,000 people would be within 45 minutes of employment opportunities due to reductions in journey times. The package of PPP, Rail 2025 and Crossrail is a complementary set of rail solutions vital for London s economic growth and agglomeration. The solutions serve different markets and are not substitutable for each other. The Tube and rail networks are the most efficient ways to move more people to and from existing residential areas to existing work places. However, they do not improve employment 86 Transport Transport vision for a growing world city
87 Figure 17 London Overground Step-free access from the platform to the street (existing and planned) 87
88 accessibility in those areas less well served by rail, or in areas of new development. Nor do they serve the east-west jobs corridor. Only Crossrail can deliver these outcomes Other key rail schemes T2025 modelling shows that the delivery of the major schemes PPP, Crossrail, Thameslink and Rail 2025, provide the majority of the rail improvements needed to support London s growth. However, even with this investment, around one quarter of the network would still be crowded in And within this, there are some critical growth corridors that will remain heavily crowded. The most crowded corridor in 2025 is predicted to be the northeast to southwest corridor. In particular, additional capacity is needed to relieve the Victoria and Piccadilly lines, and support major development sites. Residual crowding is also evident on the inner south London central London corridor. T2025 has therefore identified two further long-term rail options, namely Crossrail 2 and segregation of Northern line services. These were included in the modelling of the T2025 programme scenario. Crossrail 2 Crossrail 2 would open up rail access to key regeneration areas in northeast London through Hackney and potentially into the Lea Valley, provide new journey opportunities and much needed relief for the Victoria line across central London. It would increase total rail and Underground capacity in the central area by about six per cent. It would be logical to progress major tunnelling work on Crossrail 2 after Crossrail. Crossrail 2 would provide capacity for more than 100,000 passengers during the morning peak. It would deliver journey time savings of between five and 10 minutes for areas adjacent to the new line in southwest London. In northeast London it will bring even bigger improvements and new journey opportunities, thus improving social inclusion. In the central area, more than half of Crossrail 2 passengers would be transfers from the Underground, particularly from the Victoria and Northern lines. This will provide essential congestion relief for both the lines and key interchanges. Segregating Northern line services A potential solution to serve the inner south London to central London corridor is a combination of three initiatives namely Cross River Tram for the inner section; Rail 2025 upgrades on the south eastern line; and strategically recasting Northern line service patterns to provide greater capacity on the north-south alignment through the City and West End. More detailed investigation of the most effective package will be undertaken. Following the PPP Northern line upgrade, the line will operate 30tph on the southern Morden to Kennington section, but the branches through central London will be operating at only 22-25tph and will remain crowded. The limit on capacity is the need to inter-work services to different destinations via different branches. It is 88 Transport Transport vision for a growing world city
89 89

90 90 Transport Transport vision for a growing world city
91 possible to achieve higher frequencies and capacity using the existing infrastructure if junction capacity limitations can be overcome. A segregation of services would deliver simpler service patterns on the line. This will allow more trains to be run through both the West End and City branches enabling 30tph services on the central London branches. This will provide roughly 25 per cent extra capacity and crowding relief on these busy sections. With the core infrastructure being capable of supporting these service patterns, the main requirements are some additional trains (and stabling) and station capacity improvements at Camden Town Bus Rail, Tube and bus are the mass people movers in London, serving 99 per cent of all public transport demand. The bus has been a big success story in London since 1999, achieving a patronage increase of 40 per cent, and four per cent modal shift from car. The shifts have been highest in central London, assisted by congestion charging and bus priority measures. But mode shift has also occurred in outer London, despite the absence of pricing measures to influence car travel. As demonstrated earlier, boosting rail capacity is critical to supporting London s economy. However, new rail schemes like Crossrail and Thameslink will only come online in the long-term. Yet London s population and economy is continuing to grow. Between 2006 and 2016 there is predicted to be an additional 440,000 jobs and 530,000 extra people in London, generating up to two million extra journeys every day. Bus is the only feasible and available option to support this growth. Modelling suggests that bus demand (in terms of passenger kilometres) could increase by around 35 per cent by Bus boardings could increase by almost 50 per cent. Through their inherent flexibility and capacity, buses have a unique role to play in the future that other modes cannot meet. The multipurpose nature of the bus mode is a key reason why bus services carry more people than any other public transport mode (half of the public transport market). The bus system binds the whole public transport network together, penetrating all parts of London and connecting to the rail and Tube networks. T2025 has identified 10 key roles for the bus system in London: Getting people to work in central London, town centres and other key employment locations Acting as a feeder and distributor mode to and from rail and Underground stations Serving medium-volume corridors, such as radial flows to local centres Providing orbital and other non-radial connectivity Supporting regeneration by providing the first public transport service in new residential areas Providing public transport links to schools, shopping centres, retail outlets, healthcare and leisure facilities 91
92 Serving local journeys (eg linking residential areas to town centres) Providing a 24-hour service to support the 24-hour economy Providing the night bus network that offers London s night workers safe travel options and affordable public transport Providing an accessible network across London. A core objective for the bus within these roles is to attract car users to public transport, especially in outer London, where bus is often the only public transport option. Given the continued growth and lead times for major new infrastructure, bus capacity will need to be expanded by around 20 per cent by 2016 to serve these 10 roles and support growth prior to major rail schemes being delivered, and then to integrate with these facilities. To achieve the necessary reductions in congestion and emissions, a further increase in bus provision of around 20 per cent will be required to provide an attractive alternative and support the modal shift away from the car, especially in outer London. Figure 18 Bus accessibility 2006 Based on Public Transport Accesability Level methodology 92 Transport Transport vision for a growing world city

93 Both the quality and quantity of services will need to be increased to support London s growth and the viability of town centres and other sub-regional economic nodes. Bus network enhancement needs to serve three main purposes, namely: Increase capacity London-wide to meet overall demand generated from population growth, including those areas not served by rail or LU Enhance service volume to improve network connectivity, support development and regeneration, eg Thames Gateway, opportunity areas and areas of intensification Increase capacity to complement the congestion and emissions reduction plan to achieve the necessary mode shift from car. A key success factor in delivering this extra bus capacity will be the implementation of effective bus priority measures, within the context of improved corridor management addressing the needs of all road users. Priority needs to be provided over substantial proportions of corridors from end-to-end Figure 19 Bus accessibility 2025 Based on Public Transport Accesability Level methodology 93
94 to ensure continuing reliability in the face of increasing traffic congestion. Effective bus priority will be needed to get more capacity for the same cost through higher speeds and greater reliability. Delivering the required reductions in traffic and congestion will be essential to deliver these outcomes. In addition to their role in supporting the economy, buses play a key role in improving social inclusion by providing a lower-cost travel alternative and increasing accessibility through a network with wide coverage. Ninety-nine per cent of people in London are within walking distance of a bus stop. The proposed bus improvements form a core element of the congestion and emissions reduction plan described in strategy five. This plan contains an integrated package of policies and investment to address the future needs of inner and outer London. Unlike the radial task to central London, the transport plan for outer London is multi-dimensional because the problems and solutions are more varied. Working with the boroughs through their LIPs, the right mix needs to be designed for each situation, combining road user charging, public transport improvements, smart transport measures, corridor management, walking and cycling, and public realm enhancements. Some stakeholders raised concerns about the potential for improved bus services to tackle the needs of outer London. TfL considers that these issues will be successfully addressed if such services are delivered as part of a package of measures to reduce congestion and emissions. Key to this success will be enhancements to the local network. The local network So far the future mass transit network that London needs has been described. This regional system must be integrated with, and supported by, local transport facilities. This includes light rail and light transit schemes in some areas, walking and cycling links, interchanges, and the public realm. The regional and local networks are complementary and mutually supportive, forming an integrated system. The lack of an effective core network of rail and Tube infrastructure cannot be compensated for by even the best local networks. People cannot serve all their needs locally with short trips, especially their journey to work. The mass transit network is the core of the system. However, the regional system needs good local links to ensure that journeys are seamless and efficient. In addition, shorter journeys that occur locally should be efficient, safe and reliable Docklands Light Railway The DLR is a high-frequency, fully accessible light rail network for inner east and southeast London. It provides a fully segregated transit link between the two finance and business districts of the City and the Isle of Dogs. The DLR will continue to facilitate the ongoing regeneration of Docklands and the Thames Gateway. The 2025 Reference Case 94 Transport Transport vision for a growing world city
95 95
96 contains the committed DLR extensions to Woolwich and to Stratford International. The full programme includes an extension to Dagenham Dock, which will support regeneration in the Thames Gateway and provide interchanges with the c2c services and the Thames Gateway bus transit schemes. The six kilometre DLR extension will form part of the transport infrastructure required to attract investment to the Royal Docks, Canary Wharf and the City by enhancing travel facilities for residents and commuters. Services would operate from Canning Town via Custom House and can be extended to Stratford International station via West Ham in due course. Canning Town would provide an interchange with the Jubilee line. Canning Town and Custom House will also allow interchange with other DLR services. Additional capacity will also be generated from the current DLR network by service frequency, installing a new signalling system, lengthening trains and improving internal train layout Light transit Light transit covers a range of intermediate mode options between rail and conventional bus. The main options in London are trams and bus transit facilities. Based on transport efficiency grounds, the warrant for consideration of a segregated tram or light rail mode is between 2,500-3,000 passengers/direction/hour. There are several high-volume bus corridors that could theoretically warrant light transit consideration in the future, mainly in central London and the approaches. However, it is unlikely to be feasible or cost-effective to develop an extensive network of trams and segregated busways in London within any reasonable timeframe. It is not a networkwide solution to transport needs, but a supporting initiative at the local level in high volume corridors. The tram schemes currently being investigated in London include Cross River Tram (CRT), West London Tram (WLT) and a Tramlink extension to Crystal Palace. These were included in the T2025 full programme. Preliminary scoping of work on an Oxford Street tram has also started. CRT is complementary to the rail system and works with the local public transport network to boost north-south capacity in central London. CRT provides crowding relief for the Tube and serves large regeneration areas. WLT is primarily a higher capacity alternative to bus, with localised regeneration benefits. Tramlink extensions serve different purposes. Some are mainly driven by regeneration needs (eg the extension to Crystal Palace). Others are an alternative to rail or bus (eg Sutton- Wimbledon, Streatham-Purley). Tramlink extensions would enhance radial and orbital travel in south London. Bus transit is the best mode where densities and demand do not warrant the provision of a fixed track system, but passenger volumes are higher than can be efficiently supported by conventional bus priority systems. Bus transit schemes are currently being progressed in east London 96 Transport Transport vision for a growing world city
97 with the first phases of the East London Transit and Greenwich Waterfront Transit schemes in the implementation phase. The transit schemes will use the Thames Gateway Bridge to provide an integrated cross-river public transport service in east London. A network study is underway to identify a long-term bus transit system for east London, giving priority to serving new development areas where segregated routes can be protected. Implementation of the proposed light transit package could add around 0.5 per cent to public transport network capacity. The schemes mainly serve relatively short trips and have important local benefits. The extent to which light transit schemes can be delivered in London will depend on the level of road space available, regeneration benefits, the level of local support, overall impacts and the outcomes of public inquiries and funding Walking Almost every journey in London involves walking at some point. Walking is not only free, it is also environmentally friendly, convenient and a healthy way to travel, making minimum use of transport capacity. The Mayor has established a target to increase the number of walking trips per person by 10 per cent by This is reflected in the T2025 analysis, which indicates that walking s mode share would increase from 21 per cent to 22 per cent in future, with more than one million extra trips taking place every day by Increasing the amount of walking in London will not take place without specific action to address the barriers to walking. Currently, walking is often seen as the weakest link in multi-modal trips due to passenger concerns about safety, security and the environment of less populated areas. The attractiveness of walking needs to be improved by ensuring that homes, shops, schools and parks are close enough together to allow people to walk for everyday journeys. It requires land use planning policies and development control decisions to achieve high-quality, dense, mixed-use developments. Initiatives that mitigate the impact of high traffic volumes and poor air quality will also improve the walking environment. In the near future, a multitude of small scale initiatives, taken forward at the local level by the boroughs, will help to make walking more attractive. Future borough spending allocations should recognise the need for these initiatives and other local investments to improve the quality, safety and accessibility of local transport networks. These initiatives are essential to make streets and spaces more attractive and more accessible, so encouraging people to walk more often. Initiatives to make walking in London easier and safer New crossings Better pedestrian signals Reducing street clutter Improving the street scene 97
98 Better signage and lighting Building informal crossings such as islands and refuges Replacing subways and footbridges with surface level protected crossings Exploring new route and way-finding technology. In addition to these important pan-london initiatives, a number of major projects are proposed to boost walking in London. These include: The Mayor's 100 Public Spaces initiative to improve the urban realm in key areas of London A network of strategic walking routes Developing plans for a pan-london walking way-finding concept called Legible London to encourage more people to walk for short distances. Ultimately, success in making London a walkable city will depend on longer-term action extending beyond the specific initiatives identified above. The continuation of works to transform key parts of central London, such as Parliament Square and Oxford Street, and to extend this to new areas, will combine to improve the attractiveness of the total walking experience in London. Enhancing the urban realm is a critical success factor for walking. TfL will continue to work with the boroughs on a programme to improve the urban environment. This includes ensuring all projects follow clear design principles to support the creation of: Convenient connections so that people can access the places they want to get to by the most direct way Clear and easy to understand routes and spaces so that people can find their way around easily Streets and spaces for everyone so that all users have enough space to use the street in comfort Active and engaging spaces so that people are happy to walk, sit, shop, eat, reflect and enjoy the space. TfL has also been developing proposals for a London-wide Low Emission Zone (LEZ) to improve local air quality. The earliest date that this could be implemented is It would initially target reductions in particulate matter (PM10) emissions from heavy goods vehicles (HGVs), buses and coaches. Vehicles would be required to meet the Euro III standard by 2008, while the proposed minimum standard for 2012 is Euro IV. The LEZ could be expanded to include light goods vehicles (LGV). The LEZ will create a better environment for pedestrians. Outside the central area, the choice to walk in future will be influenced in a number of ways. Ensuring that new developments are located within easy walking distance of key facilities and that attractive access routes are provided will be important. In addition, the role of personalised travel planning, as well as school, work and residential travel plans, will be important in encouraging people to 98 Transport Transport vision for a growing world city
99 99

100 100 Transport Transport vision for a growing world city
101 choose to walk for shorter journeys when possible. The impact of wider policy initiatives, such as RUC, will also play a part in influencing people s transport choices, with the likelihood that short car journeys may often be replaced by walking in future Cycling London has experienced unprecedented growth in cycling in recent years. The aim is to build on this success in the future with a target to increase cycling trips by more than 400 per cent by This could increase the mode share of cycling in London from one per cent now up to five per cent by 2025, equating to more than one million extra trips every day. As with walking, investment to increase levels of cycling in London will bring direct benefits to cyclists themselves (through safer, quicker journeys and improved activity levels for health). Cycling also provides a realistic alternative to many journeys currently undertaken by car and bus. Cycling, like walking, is particularly beneficial in terms of the climate change agenda, since there are no CO2 emissions from these modes of travel. In the period up to 2010, a range of specific initiatives has been identified to encourage increased levels of cycling in London. Many of these initiatives will be delivered at borough level and should be reflected in borough spending priorities. While individually the impact of many of these initiatives will be small, cumulatively they will improve the experience and attractiveness of cycling in London. Cycling initiatives in London Infrastructure improvements eg completing 1,000km of the London Cycling Network+ and developing local network initiatives Marketing and promotion eg by providing more cycle maps, events and advertising Awareness and training programmes eg through strategies to increase cycling awareness among young people and to provide training for all age groups Parking eg provision of new parking sites in town centres, at public transport interchanges and schools and colleges Integration with other programmes eg through improved land use planning, travel planning processes and by using corridor management to incorporate cycle facilities where possible In the longer-term, the impact of other policy measures described in this document will be crucial in encouraging increased cycling activity. In particular, investment in smart transport measures will directly impact on people s propensity to cycle. The widespread implementation of travel plans be it for schools, workplaces, or residential development will act to encourage people to purchase a bike and provide training on how to use them. Even more significant for cycling is likely to be the implementation of the congestion and 101

102 102 Transport Transport vision for a growing world city
103 emissions reduction plan. By improving traffic conditions on London roads, cycling will be made more attractive. It also offers the possibility of devoting more road space to cycling and provides the financial incentive for people to consider cycling for certain journeys as an alternative to car use. The initiatives outlined here, together with improvements to the urban realm through town centre schemes, will contribute to a better environment for cycling in London. As with walking and smart transport measures, the medium-term programme to 2016 for cycling will be reviewed at that time to identify what the priorities should be to Integration of the network Interchange in London must be fast, reliable, convenient and safe. Infrastructure on key lines joins together at stations and interchanges. These nodes will continue to be a major constraint on service quality and system performance without enhancement to match the line upgrades. This is particularly important to secure the benefits of new rail capacity from the PPP, Crossrail and Rail On the Tube, the extent to which benefits will flow from the Underground line upgrades depends on the ability of people to enter and exit the Underground network quickly and easily. Certain Underground stations are already operating at capacity. Underground station congestion relief schemes have been proposed to eliminate bottlenecks at key locations including King s Cross, St. Pancras, Bank, Victoria, Tottenham Court Road, Paddington, plus Baker Street, Camden Town and Bond Street. These station improvements will increase interchange capacity with rail services, provide connections with new lines such as Crossrail, and make the Underground network more accessible for mobility-impaired people. This will enable speedy and convenient transfer from the radial to the orbital network and other access modes. This will increase the attractiveness of the public transport network and therefore increase patronage. On national rail, the approaches to central London rail termini are already major bottlenecks in the system. Effective distribution of people from the mainline rail termini is essential to ensure reliable journeys. Rail 2025 has identified a programme of priority schemes to relieve congestion at these stations. A programme of other multi-modal interchanges (eg bus/rail) across London will also be needed, incorporating facilities for cyclists where appropriate Other modes Rail freight T2025 recommends the development of rail routes to enhance effective rail freight capacity across London. There are a number 103
104 of targeted capacity and capability schemes within London that would have a significant impact. These include gauge enhancement to enable the lower cost movement of high cube deep sea containers on standard wagons and line capacity improvements such as enhanced signalling capability or line speed increases. These should reconcile train frequency aspirations for both freight and passenger traffic, as well as the provision of diversionary routes, which take pressure off key junctions and provide an alternative during line closures for engineering work. Also, within and around London, there is a need for a number of new rail freight terminals. These should be linked to consolidation centres to increase the agglomeration and efficiency of logistics operations, and to provide suitable sites in appropriate locations to support the construction industry in London. A rail freight terminal is also needed in London to realise the potential of the CTRL for reducing freight haulage costs and increasing rail s share of trade flows. There is also the need for targeted rail capacity and capability schemes outside London, in particular the route serving Felixstowe from Ipswich to Peterborough and Nuneaton, to provide diversionary routes to relieve pressure on key London routes. River services As highlighted by several stakeholders in their responses to the T2025 Challenges document, T2025 recommends making greater use of London s waterways and in particular the River Thames by both passenger and freight transport. This can be achieved by: The development of new piers at several points along the river Extending routes and improving the regularity and frequency of current services Facilitating continued growth in use of the River Thames for the transport of tourists and commuters Encouraging riverboat operators to continue to invest in their fleets to improve accessibility and the passenger experience Managing the Woolwich Ferry to improve reliability and ensure value for money Encouraging and facilitating river and canal investment, including new depots and inter-modal transfer facilities to road freight Safeguarding and encouraging the use of wharf space for potential multi-modal interchanges on London s navigable waterways. While the river will not be a mass mover of people, it can take some pressure off the main public transport modes. It is also an attractive option for visitors to London and could be a significant mover of freight such as construction materials and waste. 104 Transport Transport vision for a growing world city
105 105

106 106 Transport Transport vision for a growing world city
107 Access to airports and other international links London s economy and the quality of life the Capital provides depends to a large extent on the capacity and range of its strategic transport networks. Working with international operators and other transport providers, TfL plays a key role in ensuring sufficient access to the main airports around London, to CTRL stations, and to main Channel and North Sea ports. Airports are significant generators of transport demand. Fifty-three per cent of passengers to Heathrow and 36 per cent and 40 per cent of passengers to Gatwick and Stansted respectively originate in London. In addition to the local effects of these movements around airports, impacts occur at key central London terminals notably Paddington and Victoria. Of particular importance is Heathrow, the world s busiest international airport, which currently handles around 70 million passengers a year. Improvements to public transport are key to ensuring that airports are served in a sustainable way and public transport mode share is increased. Heathrow Terminal 5, which is due to be opened in 2008, will relieve passenger congestion within the airport. Key transport projects to improve surface access in the short-term will be the extension of the Piccadilly line and Heathrow Express, as well as integration of bus and coach services. In the longer term, Crossrail will play a significant role in serving the airport and Airtrack would also play a role in providing a direct rail service from Waterloo, Clapham Junction and southwest London. Long-term proposals for expansion of the capacity of these international links are under consideration. The Government has published its initial views on further expansion to airports over the next 30 years in the White Paper: The Future of Air Transport (December 2003) and will provide a report on progress by the end of Proposals to expand port capacity in east London, in the Thames estuary, and in the eastern part of the wider South East region are supported in principle by the Mayor, as long as they are brought forward in conjunction with improvements in access. The access needed by substantial numbers of employees associated with these sites also needs consideration. The production of travel plans by airport employers, working in partnership with TfL, and other partners will be key to improving sustainable access by staff. 107
108 7 Benefits of the T2025 programme 7.1 Summary of the T2025 programme The T2025 programme represents a significant and necessary programme of investment in London to meet the economic, social and environmental objectives arising from the London Plan. The main components of the programme are: 2025 Reference Case includes the current investment programme to 2010 PPP completion of the 30-year full PPP to renew assets, improve reliability and deliver 25 per cent additional Tube capacity Crossrail essential east-west mass transit link, boosting capacity to support the central east-west jobs corridor and increase agglomeration T2025 programme includes Rail 2025; longer-term rail options including Crossrail 2; DLR and light transit schemes; and a package of measures to reduce congestion and CO2, emissions, including a national road user charging scheme across London 7.2 Benefits of investing Comprehensive appraisal has been undertaken to quantify the benefits of the T2025 programme. Overall, the programme will significantly improve accessibility and mobility for people and goods in London. This will be achieved by increasing public transport capacity and enabling better use to be made of available road space by reducing congestion, as well as making London easier to get around by walking and cycling. The policies will support and enable the growth of London s economy, with consequential benefits for the UK economy as a whole, given the Capital s pivotal wealth creation role. The quality of life experienced by Londoners will be boosted and the environment will improve. The impact of the policies is summarised below: Economy Public transport capacity and employment accessibility An increase in Tube, rail and bus capacity is the main driver of meeting the economic s objectives. London s finance and business services sectors are continuing to grow in the West End, City and Docklands, and by 2025 demand will have grown for travel in these areas by up to 300,000 trips in the am peak. The PPP line upgrades, Crossrail and Rail 108 Transport Transport vision for a growing world city

109 Figure 20 Public transport accessibility to employment 2006 Figure 21 Public transport accessibility to employment with the 2025 programme 109
110 2025 schemes are all essential to support this and other London employment growth. Implementing these schemes will increase the capacity of the public transport network by about 40 per cent and increase the employment catchment area of central London (the number of people within 45 minutes of central London employment) by almost 25 per cent. Crowding The additional capacity will mean that despite the increase in demand, crowding will be reduced on rail modes by 60 per cent compared to the reference case. Crowding will be reduced by more than 45 per cent on 2006 levels. This does not mean the network is not crowded, nor that over-investment has occurred. More than 20 per cent of the system would still be heavily crowded. The T2025 programme would simply allow London to both support growth and achieve some catch-up with past under-investment. Travel time savings and reliability Public transport service frequency increases and improved schedules will reduce scheduled journey times. The average Underground train journey time would be four minutes quicker than now, while scheduled bus waiting time will be reduced by almost 40 per cent. Public transport reliability would also be significantly improved, with average bus excess wait time reduced by 30 per cent to under one minute per journey. In parallel, Underground reliability will be improved by over 30 per cent compared to The increased service frequency and reliability will reduce the time spent travelling and save users 5.7bn per annum. Traffic and congestion The congestion and emissions reduction package will reduce traffic congestion by 30 per cent compared to the reference case. This will achieve more efficient use of the highway network, allowing greater reliability for passenger and freight trips. Traffic would be reduced by 14 per cent and car speeds would be 10 per cent higher compared to the reference case, delivering faster and more reliable journeys. This will particularly benefit those businesses and freight carriers dependent on the road network, saving up to 750m per year in congestion costs. Freight In addition to the benefits of reduced road congestion, freight operators will also benefit from a re-allocation of road space made possible by the congestion reduction plan. Journey time and reliability will benefit from further provision of inset loadings bays to minimise conflicts between moving traffic and parked vehicles making deliveries or loading, and the better management of the overall flow of traffic through junction design and management. Agglomeration and GDP Business journey time savings contribute to increased GDP, as the time saved is assumed to be used productively. The GDP benefit from time savings arising from the T2025 programme is 90bn. In addition 110 Transport Transport vision for a growing world city
111 to this, there are 90bn GDP benefits resulting from productivity gains from greater agglomeration. The 90bn agglomeration benefit is made up of the following components: Move to more productive jobs this includes the benefits resulting from jobs changing location into central London with its higher productivity. Improving access to central London will mean that more workers are willing to work there, increasing central London employment Agglomeration benefits (increase in productivity) this values the increase in productivity of all existing central London jobs resulting from the increase in employment density. It is a different gain from the move to more productive jobs in this case people stay in the same job but benefit from an increase in productivity Increased labour force participation this benefit results from lower commuting costs leading to higher labour force participation rates Imperfect competition due to time savings from improvements to the transport system, a company can increase output and reduce the price of its goods/services. Therefore, firms and consumers are better off if firms increase production. Since the benefits do not entirely fall to the firms that directly receive the transport benefits, the usage of only time savings would underestimate the true impact of a transport scheme. The imperfect competition indicator measures this additional benefit This gives a total contribution to UK GDP of around 180bn over 60 years. The T2025 programme would enable all the growth forecast within the London Plan to be accommodated and support the full potential of London s economy Climate change and the environment The policies and investments outlined in this vision, and notably the mode shift they help achieve, will improve London s environment and help fulfil international commitments to address global warming. As a result of the T2025 programme, CO2 emissions would be reduced by around 22 per cent below 1990 levels, despite the increase in the number of trips being made. The programme s provision of new public transport capacity, together with investment in energy efficient improvements across the transport network, improved facilities for walking and cycling, and measures aiming at influencing travel choice and managing the demand for travel, will be key to achieving the climate change and mode shift targets. Mode shift Despite the growth in population and economic activity, the policies in the T2025 vision will reduce traffic levels below 2006 levels. The provision of additional public transport capacity and the application of travel demand management policies to encourage mode shift, will reduce car s mode share from 41 per cent to 111
112 32 per cent, while walking and cycling will increase from 22 per cent to 27 per cent, and public transport will increase from 37 per cent to 41 per cent mode share. The scale of reduction in London s transport emissions would be unprecedented across the world s capital cities and would put London at the forefront of action to address climate change. It is estimated that the Mayor s full CO2 reduction target could be met if supporting legislation to improve the carbon efficiency of new vehicles is forthcoming from national and European government or a greater impact of RUC on the most polluting vehicles is achieved. London s townscape and urban environment will be enhanced by better balancing the provision for pedestrians and through high quality traffic management measures. This action to improve the public realm and boost walking and cycling will make it easier for people to get about, without cost, on foot and by bike, and contribute to the vitality of local communities, high streets and town centres. The vision will contribute to London s health and fitness as the number of cycling and walking trips would increase by more than 20 per cent Social inclusion The package of policies makes significant progress in addressing the transport related causes of deprivation and inequality in London by helping to improve access to employment, as well as encouraging greater use of public transport and local walking and cycling journeys. In terms of physical accessibility, an additional one third of Underground stations would be made step-free, and further public transport supply will increase the availability of transport services. The full T2025 programme would make significant progress towards addressing the first social inclusion barrier of ensuring essential services and activities are located in accessible locations. The indicator of this is the change in the proportion of the population in the 10 per cent most deprived areas of London within a 45 minute journey of international and metropolitan centres. The full T2025 programme significantly improves this outcome at important destinations compared with today. The package produces a nine per cent reduction in the average travel time from the 10 per cent most deprived areas to the 10 metropolitan and two international centres. The rail and Underground networks will be much easier to use for more people, especially those who have mobility impairments, or travel with children or luggage, as a result of the provision of stepfree facilities to about two-thirds of stations and measures to help people get on and off trains. Those stations not provided with stepfree facilities will be near alternative stations that are accessible. The real impact of these 112 Transport Transport vision for a growing world city
113 changes and other investments will be better understood in future as TfL takes forward research to better define a metric which looks at the extent to which unmet travel needs among disabled Londoners are different to that of non-disabled Londoners. Road safety, where major improvements have already been made, will continue to be improved with a reduction of two-thirds in the number of people killed or seriously injured on the roads. Personal security will be significantly improved by the increased availability of staff at stations and on trains, and the provision of CCTV throughout the public transport network s vehicles and stations. CCTV and regeneration projects will also improve on-street security, as will investments to improve the design and maintenance of streets and public spaces. London s streets and public spaces will be safer, more accessible and easier to use. These policies enhance the liveability of London, making it a more attractive place to live and work in, and thus supporting its world city status. Figure 22 Percentage of the population in 10% most deprived areas in London within 45 minutes travel time to international (i) and metropolitan centres Percentage Knightsbridge (i) West End (i) Bromley Croydon Ealing Harrow Hounslow Ilford Kingston Romford Sutton Wood Green 2006 T2025 programme 113

114 114 Transport Transport vision for a growing world city
115 7.3 Broader appraisal of the T2025 programme In addition to the key performance indicators set out in Table 1, the T2025 programme has been assessed against a broader set of indicators to ensure that the impacts on other areas of performance are recognised and understood. An initial high level assessment of the T2025 programme has been made against the reference case following the transport appraisal framework recommended by DfT. This initial high level appraisal demonstrates that the T2025 programme makes a significant improvement in the large majority of the policy objectives; notably, accessibility, safety and integration of the transport schemes with other local and governmental policies. The programme ontributes to the reduction of particulates and CO2 emissions. It also improves townscape, physical fitness and journey ambience. 7.4 Consequences of not investing The previous sections described the benefits of the T2025 programme. Analysis suggests that the following consequences could arise if the right policies and investment beyond the reference case programme are not implemented. Economy Without additional capacity beyond the reference case, the extent of crowding on rail and the Underground could increase by around 40 per cent by There would be insufficient Underground capacity to cater for the higher levels of demand. Station closures and delays, due to unsafe levels of crowding, would be more frequent. The lack of investment beyond the reference case would severely inhibit the growth in jobs and population in London. The additional four million trips every day resulting from growth could not be accommodated. As public transport demand continues to exceed supply in the future and rail investment does not materialise, then either bus provision or costs would have to rise even further, or people would not be able to get onto severely crowded services. This would be significantly worse in peak periods and would adversely affect the ability of Londoners to get to work. One practical consequence may be that some major planning applications would have to be refused as there would simply not be the transport capacity in place to support them. These impacts would constrain economic growth in central London and the potential increases in agglomeration, and productivity would not be fully realised. This growth would not then necessarily happen elsewhere in the UK as a substitute: jobs lost to London would be established in other global business centres instead. Without the right public transport investments and road network management policies, traffic pressures could increase by 115
116 up to 13 per cent, leading to an increase in congestion of around 35 per cent. Average bus excess wait time could increase by 30 per cent as a result of traffic congestion from cars. An increase in delay of this scale could cost road users an extra 400m per annum in lost time in addition to the current cost of 1.6bn, further constraining London s economic growth and productivity. The Capital s townscape and urban environment would be compromised by the higher levels of traffic and congestion in town centres. Social inclusion Without the right transport policies in place, most of the transport related causes of deprivation and inequality in London would remain. By 2025, only about one fifth of journey opportunities would be made stepfree on the Underground and rail networks. The levels of investment and policies assumed in the reference case would not do enough to improve social inclusion in London over the next 20 years. There may be some early improvements in public transport services and reliability. But few new services or initiatives would be introduced to benefit areas currently lacking in public transport. Funding to improve access by bike and foot would be limited and other initiatives to improve step-free access or station security would be limited. It is likely that the Thames Gateway and other regeneration areas would develop in a cardependent way. This would result in a permanent pattern of low density, less efficient land use activities, thereby missing the opportunity to achieve sustainable development patterns offered by the scale of redevelopment expected. London's liveability overall could worsen with one in 10 more properties affected by significant levels of road traffic noise and no improvement to the public realm. Environment Without the T2025 programme, London could not play its part in helping the UK meet its international commitments to address global warming. Climate change targets would not be met and traffic congestion could rise by 35 per cent. Potential air quality improvements that are expected with the LEZ and new engine technology, would be eroded by increased traffic volumes. In addition, most of the CO2 reductions from renewal and efficient operation would not be realised. Overall therefore, failure to support growth through significant policy intervention could severely inhibit economic growth with greater risks, social polarisation, greater pressure on public services and poorer environmental conditions. 116 Transport Transport vision for a growing world city

117 117
118 8 Implementation 8.1 Timing and sequencing The T2025 programme represents a significant programme of investment and activity to The right sequencing and blending of policy options is needed to maximise the value of individual initiatives. Supply and demand policies are highly inter-dependent. Demand management policies need to be accompanied by increases in public transport capacity and improvements to walking and cycling. Similarly, increases in public transport capacity may not deliver their full benefits unless they are accompanied by road space re-allocation and traffic management, or station capacity improvements to support Tube and rail upgrades. Demand management is also needed to ensure new capacity delivers maximum value and the benefits of mode shift from car travel are locked in. Operational enhancements will be particularly important in the short and medium-term. On the road network, the short-term options involve TfL and the boroughs working to achieve more effective management of the network through corridor management, bus priority and improved enforcement and reduced disruption. Demand management measures can be implemented in the short to medium-term and can be applied flexibly as the network evolves and challenges emerge in new areas. Major new schemes like Crossrail and Thameslink will not be in place in the medium -term. Improvements to buses, walking and cycling can be delivered quickly, and will play an important role in supporting London s growth and mode shift from car travel. The congestion and emissions reduction plan should be progressively implemented, starting with the expansion of smart transport measures to influence travel behaviour and the Climate Change Action Plan followed by a national RUC scheme across London. 8.2 Costs The T2025 programme is a significant and necessary package of investment and expansion in transport infrastructure and services. The cost of T2025 is made up of capital costs and operating costs. The most significant capital costs are associated with the full PPP, Crossrail and, at a lower scale, DLR and light transit schemes. The capital cost of the Rail 2025 proposals for the rail network, which is a Government responsibility, is approximately 10bn. Operating and maintaining the existing transport network is the largest component in 118 Transport Transport vision for a growing world city
119 Figure 23 Indicative programme of the T2025 major schemes Channel Tunnel Rail Link Piccadilly Line & Heathrow Express extensions to Terminal 5 Thames Gateway Bridge DLR extension to Woolwich East London and Greenwich Waterfront Transits Phase 1 DLR 3 car upgrade Bank Lewisham DLR Stratford International Canning Town London Overground Phases 1 & Jubilee line upgrade Northern line upgrade Victoria line upgrade Circle, Hammersmith & City and Metropolitan lines upgrade District line upgrade Piccadilly line upgrade Bakerloo line upgrade Congestion & Emissions Reduction Plan Crossrail Southern Trains upgrade Southeastern upgrade Thameslink upgrade West Anglia upgrade c2c upgrade London Overground further enhancements East London line extension to Clapham Junction South West Trains upgrade Silverlink County upgrade DLR Phase 2 capacity enhancement DLR extension to Dagenham Dock West London Tram Tramlink extension to Crystal Palace Cross River Tram Crossrail 2 Silvertown link 119
120 terms of operating cost. The main additional operating costs are associated with the 40 per cent increase in bus service included in the full T2025 programme. While recognising that such investment needs are very significant, the important role that London plays as a catalyst for the wider national economy needs to be recognised, including the potential 180bn GDP benefits to the economy. The specific nature of London s economy, its high average levels of productivity and its contribution to both tax revenues and GDP, means that investment in London is very good value for the UK as a whole. TfL s average annual expenditure set out by the 2006/07 TfL Business Plan to 2009/10 is about 6.3bn pa, made up mainly of operating costs (about 4bn pa), PPP renewal and maintenance (about 1.3bn pa) and the remainder of the TfL Figure 24 Indicative gross costs (excluding inflation) Costs in billions at 2006 prices ( ) T2025 programme Additional bus Crossrail Full PPP TfL Investment Programme Maintain and Operate Note: Excludes national rail and Crossrail 2 costs. These costs could be financed so that the size of the peak between 2011 and 2016 could be reduced. 120 Transport Transport vision for a growing world city
121 investment programme (about 1bn pa). The balance is made up of debt funding and contingency. The TfL investment programme will be delivered around 2010 or soon after, beyond which there is no agreed and funded investment plan. A short description of figure 24 s cost layers is given below Maintain and Operate is the cost to TfL of continuing current levels of service on buses, streets, walking, cycling and Underground service delivery. This is the TfL Business Plan operating expenditure (minus the PPP) extrapolated from 2009/10 through to 2024/25. It also includes renewal of TfL s existing infrastructure (except LU that is delivered through the PPP) TfL Investment Programme is the TfL Five-Year Investment Programme including overhang of projects committed before 2009/10 but with costs post 2009/10 The Full PPP costs up to March 2010 are for the PPP contractual deliverables including line upgrades, station refurbishments and other asset renewal and maintenance up to this date. This includes capital renewal and operating maintenance elements. The Full PPP also includes costs beyond In addition to continuing the delivery of line upgrades, station refurbishments and other asset renewal and maintenance as set out in the current PPP contract, this layer also includes PPP enabling works, which are outside the PPP contract but essential for the realisation of the benefits delivered. These include critical station congestion relief schemes and tunnel cooling The Crossrail layer is the cost of Crossrail capital and ongoing operating costs Additional bus costs are those associated with the 40 per cent increase in bus service to meet London s growth and complement the congestion and emissions reduction plan described in strategy five T2025 programme includes Northern line service segregation, the DLR extension to Dagenham Dock, light transit schemes, further Tube congestion relief schemes, step-free access projects, smart transport measures, Climate Change Action Plan, urban realm schemes, walking and cycling facilities. 121
122 8.3 Revenues The T2025 programme would result in higher income for TfL. This would be from higher fares income from the extra journeys on public transport due to population and employment growth and the overall mode shift to public transport. Fares revenue in the full programme is expected to increase from 2.5bn per annum in 2006 to 3.6bn per annum in 2025, an increase of 1.1bn (excluding increases from inflation). Figure 25 Indicative TfL revenue by source (excluding inflation) Revenue in billions at 2006 prices ( ) Central London Congestion Charge and other income London Underground and TfL Rail Bus and Tram 122 Transport Transport vision for a growing world city
123 123
124 8.4 Funding Current funding levels will fall well short of addressing the investment need. To meet this gap, the following sources of additional funding are possible: Road user charging, as part of a national scheme Increase in Government grant Innovative sources of funding, such as business rate supplements and land value capture Combining the costs and revenues, the chart below shows the funding requirement net of TfL revenue income from the T2025 programme up to The sources of funding listed could contribute to meeting this requirement. The profile of the funding requirement does not take account of potential financing through borrowing, which Figure 26 Indicative total net costs (excluding inflation) Net cost in billions at 2006 prices ( ) Note: Excludes national rail and Crossrail 2 costs. These costs could be financed so that the size of the peak between 2011 and 2016 could be reduced. 124 Transport Transport vision for a growing world city
125 could reduce the size of the peak between 2011 and It is vital to have long-term funding security to enable delivery of large capital schemes with long lead times. TfL will explore options with Government through the CSR2007 process. 8.5 Other delivery constraints Resources In addition to funding, delivery of the T2025 programme requires considerable land and labour. Land is required for both the new schemes and depots, and for the construction period. Sites in central London are particularly scarce. The availability of skilled labour including engineers, project managers and labourers could also be a constraint. In particular, competition from high levels of investment in other sectors, notably the Olympics and other infrastructure such as housing, water supply, energy supply etc. This can best be mitigated by establishing a robust long-term plan that provides sufficient certainty and lead time to source such resource requirements at reasonable cost. Throughout the investment period it will remain critical to ensure network resilience is maintained that access to central London, or other major employment centres is not impeded to the detriment of the businesses located there. There is a need to minimise disruption during construction. Renewal and upgrade works also have short-term disruptive effects that need to be contained. Approvals and powers A major constraint to the successful and timely delivery of projects is the process of obtaining planning and other consents for the relevant capital projects. The planning process is long, sometimes running over several years for large schemes. There is a need to increase certainty and improve procedures and timescales. Infrastructure projects inherently have long lead times. Additional time taken up in the approvals processes further adds to the uncertainty and cost of delivery. Measures to streamline the planning process and provide greater certainty are needed. The length and complexity of the process brings considerable risk to the overall programme in terms of having the appropriate resources and funding in place, and with inter-project dependencies or conflicts. For transport projects there is the additional complexity of ensuring sufficient trained staff are in place when the infrastructure becomes available for service. 8.6 Partnership approach The transport system in London is complex, multi-dimensional and varies greatly spatially. In addition, there is complexity and interdependencies between the policies and 125
126 projects that need to be delivered. This means that many different agencies need to be involved in the implementation and heading in the same direction. A regional approach is needed to ensure that policies are implemented efficiently and consistently. Furthermore, many policies have implications beyond transport, eg smart transport measures will place greater emphasis on employers. A number of key organisations would need to work with TfL in the delivery of the 2025 programme. At national level, the DfT will be a key partner in providing necessary funding and also through its role in overseeing the management of the rail network and strategic road network outside London. A significant number of projects and policies outlined in this document will need to be delivered in partnership with the boroughs through the LIPs process. This will include parking policies, development control, public realm initiatives, improved walking and cycling facilities, the promotion of smart transport measures and through their role in managing borough A roads and the residential road network. TfL will also aim to work with a range of other bodies, including the Metropolitan and British Transport Police on policing and enforcement issues, and with a wide range of private sector companies including public transport operators, financers and developers. A partnership approach is therefore essential for the successful implementation of the T2025 programme. 8.7 Robustness and flexibility of the vision A very significant issue which has recently arisen helps demonstrate that there is minimal risk that the T2025 programme is unnecessary or providing excess capacity. Recent forecasts by the GLA predict a population of between 8.35 million and 8.71 million by 2026 (11 per cent to 15 per cent growth). All the T2025 work has assumed the lower figure of 8.35 a population growth rate of 11 per cent over the 20 years. The higher figure would mean there would be an extra 360,000 people in London above the T2025 analysis, ie a further four per cent growth. Even greater levels of investment than that included in T2025 may well be needed. The vision is also robust in that it increases capacity on all modes, rather than being concentrated on just one. The best mode for the task has been selected to suit each situation. London has become increasingly reliant on the bus and, with only the PPP, would be over reliant on the Underground for access to central London. Greater balance and resilience is built into the T2025 programme through capacity expansion across the modes. There are very strong cases for all the T2025 proposals. The basic density and high volume corridors of London drive the benefit cost ratios of investments and the business cases. 126 Transport Transport vision for a growing world city

127 All projects are underpinned by a strong demand and need London is trying to catch up with years of under-investment and contain deteriorating conditions Comprehensive Spending Review T2025 is a strategic vision containing an integrated transport package of transport improvements for London. Each of the schemes within the T2025 programme is value for money in its own right. Collectively they provide the transport that will enable London s growth to be supported in a sustainable way over the next 20 years. Any plan is capable of being adapted to match available funds to some extent, but the outcomes for London will be quite different without the T2025 programme. It is necessary to commence the investment now in order to have the capacity in place through the period to It will also be important to continue progress and demonstrate quick wins on new initiatives. CSR2007 is the next opportunity to make a start on this investment. The spending review is essential to provide funding for the implementation of the necessary investment. 127
128 9 Conclusion and next steps 9.1 Conclusion The Transport 2025 vision defines the major transport challenges and policy solutions to support London s growth over the next 20 years. The 900,000 extra jobs and over 800,000 extra people will place huge additional strain on London s transport network that is already at capacity with little resilience. T2025 identifies the economic, environmental and social objectives and targets to support existing needs and the projected additional five million journeys that must be supported by public transport, walking and cycling every day by The key priorities identified in T2025 are: Complete the full PPP to rebuild the Tube and increase its capacity Build Crossrail as the crucial spine to support the expansion of the central London economy Implement a plan to reduce congestion and CO2 emissions, including a national road user charging scheme across London Expand the bus network to support London's growth, achieve mode shift in outer London and complement the introduction of road user charging Deliver a package of Rail 2025 and light rail/light transit projects The T2025 programme will achieve a nine per cent mode shift from car and deliver 40 per cent extra public transport capacity. Crowding and congestion will be reduced below 2006 levels. The programme is a significant one over the next 20 years but is absolutely necessary and achievable. By enabling London to grow and develop as envisaged in the London Plan, an estimated 180bn GDP benefits will result. The T2025 programme would help London lead the fight against global warming, contributing a significant 22 per cent towards the 30 per cent cut in London's CO2 emissions required by The remaining eight per cent can be achieved through changes to vehicle standards. The investment will also ensure that many of the transport related causes of social exclusion are overcome. 128 Transport Transport vision for a growing world city

129 9.2 Next steps It is envisaged that the T2025 vision will be regularly reviewed (eg every three to five years). The next key activities will be focused on the following: Engagement on the vision document TfL welcomes feedback on this document and discussions with major stakeholders on its implementation Supporting the London Plan T2025 will support the Alterations to the London Plan and the Examination in Public planned for spring 2007 Transport policy development T2025 will feed into development of new policy through the statutory process the main mechanism in London will be through the revision of the Mayor's Transport Strategy. At a more local level, implementation will be based upon close partnership working with boroughs and other stakeholders Funding T2025 will be used as TfL's vision and policy framework moving forward, particularly with regard to funding discussions in the forthcoming CSR2007 Delivery TfL will work with all its partners to implement the policies and investment projects as quickly as possible to ensure the vision outcomes are realised. 129
130 Appendix 1 Summary table of modelling results Demand Total Journeys (millions per day) Morning peak trips (millions car & PT) Vehicle km (am peak hour, millions) Car km (am peak hour, millions) Reference Case Scenario Change from % 9% 13% 8% Public Transport Passenger Kilometres (am peak period) Bus Underground National rail DLR Trams and transits Total PT passenger km (Includes DLR CTL Transits) 2,726 8,611 14, ,360 3,481 8,658 17, ,530 28% 1% 22% 62% 34% 16% Public Transport Capacity (inc. reliability effects) Rail seat km (during peak period) Underground, DLR and CTL seat km (during peak period) Bus seat km inc. transits (during peak period) Total PT capacity 24,391 10,612 11,878 46,881 23,790 9,557 12,306 45,653-2% -10% 4% -3% Mode Shares Car Public transport Walking and cycling Total Congestion Delays (vehicle hours, London average am peak hour) 000s % Crowding (% passenger kilometres crowded, peak period) Tube/DLR National rail Tube/DLR/National rail combined % 45% 37% Environment Total TfL CO2 emissions, million tonnes per annum Change from 1990 (8.6m) -6% 130 Transport Transport vision for a growing world city
131 131 Full PPP Scenario ,245 11,388 17, ,734 24,911 13,143 12,307 50, % 10% 12% 7% 19% 32% 20% 62% 29% 24% 2% 24% 4% 7% % -12% 29% 12% Change from 1990 (8.6m) -5% 1% 1% -1% -1% -7% 32% -2% 0% -4% 7% 5% 38% 0% 10% % -30% -11% -18% 1% Crossrail Scenario ,381 10,768 18, ,591 27,333 13,143 14,323 54, % 11% 12% 6% 24% 25% 29% 37% 19% 27% 12% 24% 21% 17% % -32% 11% -5% Change from 1990 (8.6m) -4% 1% 2% -1% -2% -3% 24% 6% -16% -12% 10% 15% 38% 16% 20% % -45% -23% -31% 2% T2025 Programme Scenario ,711 10,364 21, ,316 34,264 13,773 16,599 64, % 5% -3% -14% 36% 20% 47% 48% 423% 38% 40% 30% 40% 38% % -55% -41% -46% Change from 1990 (8.6m) -21.5% 0% -4% -14% -21% 7% 20% 21% -9% 289% 19% 44% 44% 35% 42% % -64% -60% -61% -17% Change from 2006 Change from 2025 Ref case Change from 2006 Change from 2025 Ref case Change from 2006 Change from 2025 Ref case
132 Appendix 2 List of figures and tables Figure 1 Growth of population and employment to Figure 2 Major development hotspots...30 Figure 3 Spatial distribution of employment and population growth...35 Figure 4 Trip density by destination (am peak 2025)...36 Figure 5 Spatial pattern of travel across London with mode shares (daily 2006)...37 Figure 6 Weekday trip purpose by time of day (2005/06)...38 Figure 7 Sources of London's CO2 emissions...42 Figure 8 Reference case outcomes (difference )...49 Figure 9 Public transport demand and capacity gap in the reference case...50 Figure 10 T2025 mode share targets...64 Figure 11 CO2 emissions reduction from the T2025 programme (excludes aviation)...70 Figure 12 Public transport capacity...75 Figure 13 Crowding on national rail and Underground...75 Figure 14 Public transport demand and capacity gap with the 2025 programme...76 Figure 15 Increase in peak Underground capacity into central London with the PPP to Figure 16 Rail 2025 corridor capacity increases to Figure 17 London Overground...87 Figure 18 Bus accessibility Figure 19 Bus accessibility Figure 20 Public transport accessibility to employment Figure 21 Public transport accessibility to employment with the 2025 programme Figure 22 Percentage of the population in 10% most deprived areas within 45 minutes travel time to international and metropolitan centres Figure 23 Indicative programme of the T2025 major schemes Figure 24 Indicative gross costs (excluding inflation) Figure 25 Indicative TfL revenue by source (excluding inflation) Figure 26 Indicative total net costs (excluding inflation) Table 1 Key T2025 performance indicators...25 Table 2 Components of T2025 modelling scenarios Transport Transport vision for a growing world city
133 Other formats This document is also available in audio, Braille and a range of other languages. To order the format you require, please tick the relevant box in the list below. Audio (English) Arabic Braille Hindi Bengali Punjabi Chinese Spanish French Turkish Greek Urdu Gujarati Vietnamese Include your name and address and return to: Transport for London Victoria Street London SW1H 0TL Name: Address: Website: tfl.gov.uk enquire@tfl.gov.uk Telephone: Postcode: 133
134 Appendix 3 Indicative map of the T2025 transport network 134 Transport Transport vision for a growing world city
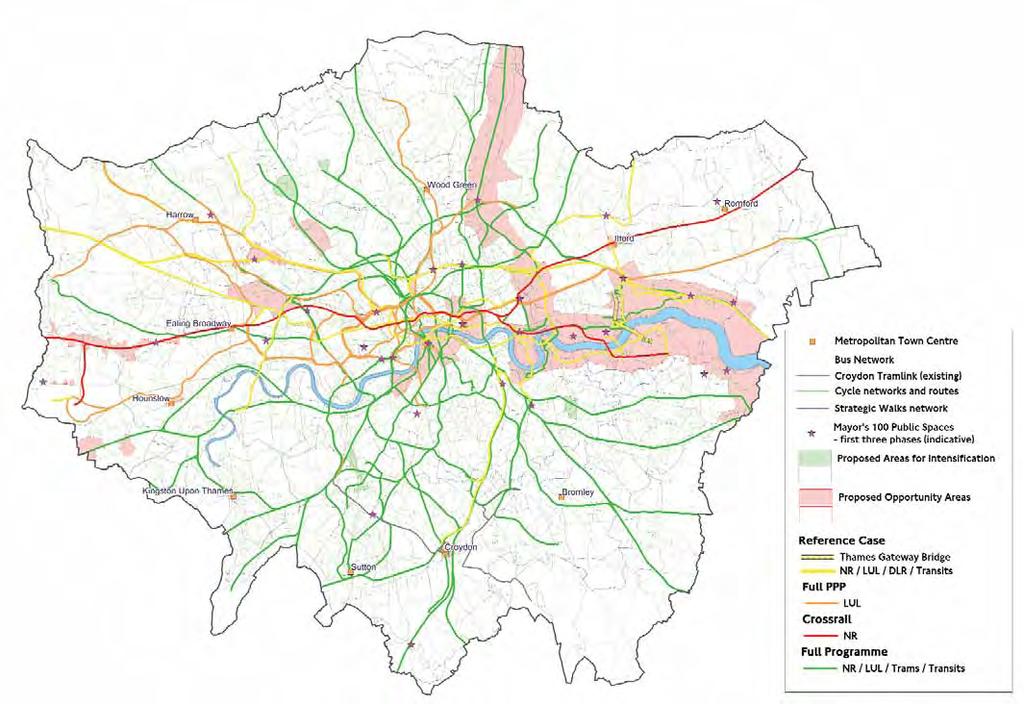
135 135
The London Land-Use and Transport Interaction Model (LonLUTI)
") The London Land-Use and Transport Interaction Model (LonLUTI) October 2014 Contents 3 Introduction 4 Why do we need transport models? 6 TfL s suite of models 8 What is LonLUTI? 12 How was LonLUTI developed?
The London Land-Use and Transport Interaction Model (LonLUTI) October 2014 Contents 3 Introduction 4 Why do we need transport models? 6 TfL s suite of models 8 What is LonLUTI? 12 How was LonLUTI developed?
Commission for Travel Demand Submission from Transport for London March 2017
 Commission for Travel Demand Submission from Transport for London March 2017 Introduction TfL is the strategic transport authority for London, governed by the Mayor of London and responsible for delivering
Executive Summary. Introduction
 Executive Summary 01 Introduction The City of Southampton lies at the western end of the South Hampshire sub-region. The wider urban South Hampshire area, consisting of Southampton, Eastleigh, Fareham,
Response of the Road Haulage Association to Transport for London. Consultation on Mayor s Transport Strategy.
 Response of the Road Haulage Association to Transport for London. Consultation on Mayor s Transport Strategy. Background about the RHA 2 October 2017 1. The Road Transport Industry is a dynamic, business
Department for Transport. March 2018
 Consultation response Proposals for the creation of a Major Road Network Department for Transport March 2018 Jonathan Bray Director Urban Transport Group Wellington House 40-50 Wellington Street Leeds
Volvo Research Foundation Future Urban Transport Symposium
 Urban freight for liveable cities Volvo Research Foundation Future Urban Transport Symposium 15 th October 2012 Peter Hendy CBE Commissioner, Transport for London Contents Freight in London London Freight
17 April To whom it may concern, Response to the consultation on the draft Strategic Transport Plan
 Royal Town Planning Institute 41 Botolph Lane London EC3R 8DL Tel +44(0)20 7929 9494 Email contact@rtpi.org.uk Website: www.rtpi.org.uk Registered Charity Numbers England 262865 Scotland SC 037841 Patron
Action Today to Protect Tomorrow: London s efforts to curb traffic growth
 Eleventh Biennial Conference on Transportation Energy and Environmental Policy Action Today to Protect Tomorrow: London s efforts to curb traffic growth Mark Evers Transport for London Transport for London
Delivering a Sustainable Railway. Summary
 Delivering a Sustainable Railway Summary July 2007 Present success, future ambition Delivering a Sustainable Railway is the most positive statement about the growth and development of rail for over 50
The Victorian Transport Plan (Department of Transport, 2008).
.") 18 TRANSPORT Planning should ensure an integrated and sustainable transport system that provides access to social and economic opportunities, facilitates economic prosperity, contributes to environmental
18 TRANSPORT Planning should ensure an integrated and sustainable transport system that provides access to social and economic opportunities, facilitates economic prosperity, contributes to environmental
Draft Mayor's Transport Strategy 2017 ASLEF s Response September 2017
 Draft Mayor's Transport Strategy 2017 ASLEF s Response September 2017 1. The Associated Society of Locomotive Engineers and Firemen (ASLEF) is the UK s largest train driver s union representing approximately
Consultation response. February 2014
 Department for Transport National road and rail networks: draft national policy statement Consultation response pteg Support Unit Wellington House 40-50 Wellington Street Leeds LS1 2DE 0113 251 7445 info@pteg.net
ANNEX F BRESSAY LINK. STAG 1: APPRAISAL SUMMARY TABLES (ASTs)
") ANNEX F BRESSAY LINK STAG 1: APPRAISAL SUMMARY TABLES (ASTs) Table F1 STAG 1 Appraisal Summary Table: Do Minimum Proposal Details Name and address of authority or organisation promoting the proposal:
ANNEX F BRESSAY LINK STAG 1: APPRAISAL SUMMARY TABLES (ASTs) Table F1 STAG 1 Appraisal Summary Table: Do Minimum Proposal Details Name and address of authority or organisation promoting the proposal:
SWDP 4: Moving Around South Worcestershire. SWDP 4: Moving Around South Worcestershire. Managing Travel Demand
 SWDP 4: Moving Around South Worcestershire Managing Travel Demand A. Proposals must demonstrate that: the layout of development will minimise demand for travel, they offer genuinely sustainable travel
IPSWICH NORTHERN ROUTES STUDY. Stage 1 Progress
 IPSWICH NORTHERN ROUTES STUDY Stage 1 Progress 17 th January 2017 STUDY CONTEXT 2 The study is being funded in partnership with the Suffolk district and borough councils. Work forms part of the Suffolk
A Vision-Led Approach to Strategic Planning in Greater Manchester TPS AGM. Nicola Kane, TfGM 24 th May 2018
 A Vision-Led Approach to Strategic Planning in Greater Manchester TPS AGM Nicola Kane, TfGM 24 th May 2018 Our vision is to make Greater Manchester one of the best places in the world to grow up, get on
Ottawa Transportation Master Plan 2013
 Introduction Ottawa s 2013 Transportation Master Plan (TMP) update sets a new standard for sustainable transportation planning in Canada. The plan, unanimously approved by Ottawa City Council, sets forward
ITC / CURACAO Seminar Managing Congestion in the West Midlands
 ITC / CURACAO Seminar Managing Congestion in the West Midlands 22 March 2007 Tom Magrath Projects Director, Centro West Midlands agenda Growth and regeneration City Region Development Plan to drive future
Transportation, Mobility and Access
 Transportation, Mobility and Access In The City of North Vancouver A Discussion Paper Prepared to Inform the Direction of a New Official Community Plan 2021 & Beyond Dragana Mitic Assistant City Engineer
Input from Engineers Ireland Into the Department of Transport s Statement of Strategy
 Input from Engineers Ireland Into the Department of Transport s Statement of Strategy 2008 2010 Table of Contents Page Executive Summary 3 Department of Transport Mandate and Mission (2005-2007) 4 The
Government response to the Auckland Plan. Introduction. Alignment of Auckland Plan with Government priorities
 Government response to the Auckland Plan Introduction 1. The Government welcomes the release of the Auckland Council s first Auckland Plan and congratulates Mayor Len Brown and the Council on reaching
2. Context for LTP Greater Manchester s Vision for the Future
 11 2. Context for LTP3 2.1. Greater Manchester s Vision for the Future The third Greater Manchester Local Transport Plan (LTP3) provides a clear set of investment priorities and complementary activities
DAVID CARTER, DIRECTOR OF INFRASTRUCTURE
 REPORT TO: WECA COMMITTEE DATE: 30 NOVEMBER 2018 REPORT TITLE: DIRECTOR: AUTHOR: TRANSPORT UPDATE DAVID CARTER, DIRECTOR OF INFRASTRUCTURE JASON HUMM, HEAD OF TRANSPORT Purpose of Report: 1. To update
State Transit Authority. Corporate Plan June 2016 (Issue 5) State Transit Authority. Corporate Plan June 2016 (Issue 5) 1
 State Transit Authority. Corporate Plan June 2016 (Issue 5) 1") Corporate Plan 2012-2017 June 2016 (Issue 5) Corporate Plan 2012-2017 June 2016 (Issue 5) 1 Contents Chief Executive s Message...3 Our Business...4 Our Challenges...4 Our Ambition...5 Our Initiatives...5
Corporate Plan 2012-2017 June 2016 (Issue 5) Corporate Plan 2012-2017 June 2016 (Issue 5) 1 Contents Chief Executive s Message...3 Our Business...4 Our Challenges...4 Our Ambition...5 Our Initiatives...5
THE APPLICATION OF SCOTTISH TRANSPORT APPRAISAL GUIDANCE TO THE ROAD TRAFFIC REDUCTION ACT. Paul Finch FaberMaunsell
 THE APPLICATION OF SCOTTISH TRANSPORT APPRAISAL GUIDANCE TO THE ROAD TRAFFIC REDUCTION ACT 1. INTRODUCTION Paul Finch FaberMaunsell In March 2002, the Scottish Executive published their Transport Delivery
Local Transport Plan 4
 Central Bedfordshire Council Executive 5 April 2016 Local Transport Plan 4 Report of Cllr Nigel Young, Executive Member for Regeneration (nigel.young@centralbedfordshire.gov.uk) Advising Officers: Marcel
Making the Journey A Manifesto for Transport
 Making the Journey A Manifesto for Transport 1 What is the UK s Transport Network? The local and national infrastructure that delivers transport by rail, road, air and water. This includes the operation
SECTOR ASSESSMENT (SUMMARY): URBAN TRANSPORT 1
: URBAN TRANSPORT 1") Greater Dhaka Sustainable Urban Transport Project (RRP BAN 42169) Sector Road Map SECTOR ASSESSMENT (SUMMARY): URBAN TRANSPORT 1 1. Sector Performance, Problems, and Opportunities 1. Dhaka, the capital
Greater Dhaka Sustainable Urban Transport Project (RRP BAN 42169) Sector Road Map SECTOR ASSESSMENT (SUMMARY): URBAN TRANSPORT 1 1. Sector Performance, Problems, and Opportunities 1. Dhaka, the capital
Peter Hewitt. Transport for London
 Peter Hewitt Transport for London What the modelling community needs to crack! Peter Hewitt 23 NOVEMBER 2016 Surface Transport s recent history on modelling TfL strategic planning: - LTS, SATURN through
Transport choices for everyone
 Getting around easily. Well connected routes. Integrated transport options. Great public transport. A well planned city. Proofed for the future. Personal safety. Enjoyable journeys. River walkways. Choices
UK Road Pricing Feasibility Study: Modelling the Impacts Elizabeth Cox 1 UK
 Abstract UK Road Pricing Feasibility Study: Modelling the Impacts Elizabeth Cox 1 UK In July 2003, the UK government set up a comprehensive study to examine how a new system of charging for road use could
Local Transport Plan. Implementation Plan ( )
") Local Transport Plan Implementation Plan (2011-2015) www.cheshireeast.gov.uk/travel Contents 1 Introduction 2 Initiatives to Ensure a Sustainable Future 3 Initiatives to Create Conditions for Business
Local Transport Plan Implementation Plan (2011-2015) www.cheshireeast.gov.uk/travel Contents 1 Introduction 2 Initiatives to Ensure a Sustainable Future 3 Initiatives to Create Conditions for Business
GLA Draft Central Activities Zone Supplementary Planning Guidance (Sept 2015) London First Consultation Response
 London First Consultation Response") GLA Draft Central Activities Zone Supplementary Planning Guidance (Sept 2015) London First Consultation Response 8 th December 2015 London First is a business membership organisation with the mission to
GLA Draft Central Activities Zone Supplementary Planning Guidance (Sept 2015) London First Consultation Response 8 th December 2015 London First is a business membership organisation with the mission to
A Better Connected South Hampshire
 A Better Connected South Hampshire DfT Local Sustainable Transport Fund Bid December 2011 Executive Summary Executive Summary Transport for South Hampshire (TfSH) is delighted to submit a business case
Project Appraisal Using PRISM Simon Hubbard 28 th September 2004
 Project Appraisal Using PRISM Simon Hubbard 28 th September 2004 Introduction : Overview of Presentation - Option Appraisal Policy Context - Potential PRISM Applications - Use of the Model / Scale of the
Rural Economy and Connectivity Committee. Transport (Scotland) Bill. Key themes arising from the online survey
 Bill. Key themes arising from the online survey") Rural Economy and Connectivity Committee Transport (Scotland) Bill Key themes arising from the online survey Introduction As part of the Rural Economy and Connectivity Committee scrutiny of the Transport
Rural Economy and Connectivity Committee Transport (Scotland) Bill Key themes arising from the online survey Introduction As part of the Rural Economy and Connectivity Committee scrutiny of the Transport
Network Operation Planning - A new approach to managing congestion
 Network Operation Planning - A new approach to managing congestion Andrew Wall VicRoads, Melbourne, VIC, Australia 1 Introduction Congestion is an unavoidable aspect of most urban cities. However, there
3. THE RANGE OF PROJECTS PROPOSED FOR EVALUATION
 Prioritisation process for funding of competing Transport related projects (Auckland Perspective) Ayokunle Martins (Land Transport Programme Coordinator) Auckland Regional Transport Authority ABSTRACT
Long-term Plan Transport Proposal. 29 October 2014
 Long-term Plan Transport Proposal 29 October 2014 2 Table of Contents Introduction... 4 The Two Networks... 5 What will it cost?... 12 What are the benefits?... 15 Meeting the government s transport objectives...
Greater Manchester Local Transport Plan / /11
 Greater Manchester Local Transport Plan 2 2006/07 2010/11 March 2006 Contents 1 2 3 4 Foreword Summary Introduction 1.1 The Greater Manchester Area and its Regional Context 1.2 Challenges for Greater Manchester
Around 33 million journeys are currently made on Metrolink every year. This is forecast to increase to 44 million journeys by 2019.
 1. Introduction Transport for Greater Manchester oversees transport and travel across Greater Manchester, home of the UK s largest regional economy outside London and a diverse population of over 2.7 million
Local Transport Plan 3 March Frank Baxter Travel and Transport Policy Manager Southampton City Council
 Local Transport Plan 3 March 2012 Frank Baxter Travel and Transport Policy Manager Southampton City Council 02380 832079 Transport enables delivery of aspirations Port growth New housing Low Carbon City
Fishermans Bend Integrated Transport Plan Peer Review John Kiriakidis, GTA Consultants 28/03/2018
 Fishermans Bend Integrated Transport Plan Peer Review John Kiriakidis, GTA Consultants 28/03/2018 GTA creating transport that works 01 Preliminaries GTA creating transport that works Review scope : Review
Regional Travel Demand Management Plan
 Regional Travel Demand Management Plan Adopted October 2009 Quality for life Regional Travel Demand Management Plan Adopted October 2009 For more information, contact: Greater Wellington 142 Wakefield
Government Policy Statement on Land Transport 2018/ /28. DRAFT (FOR ENGAGEMENT ) NOT GOVERNMENT POLICY February 2017
 NOT GOVERNMENT POLICY February 2017") DRAFT (FOR ENGAGEMENT ) NOT GOVERNMENT POLICY February 2017 Government Policy Statement on Land Transport 2018/19 2027/28 DRAFT GOVERNMENT POLICY STATEMENT Contents 1 Land transport context 1 A: Role of
DRAFT (FOR ENGAGEMENT ) NOT GOVERNMENT POLICY February 2017 Government Policy Statement on Land Transport 2018/19 2027/28 DRAFT GOVERNMENT POLICY STATEMENT Contents 1 Land transport context 1 A: Role of
That will also contribute to achievement of a number of objectives and policies in the Regional Policy Statement.
 Board of Inquiry MacKays to Peka Peka Expressway Proposal Submitters Evidence Public Transport Voice 5 October 2012 Executive Summary Increasing modal share for public transport is a key outcome in the
Transformation of Oxford Street
 Transformation of Oxford Street 3 January 2018 ABOUT US Heart of London Business Alliance serves as the voice for 500 businesses and 100 property owners in the Piccadilly & St James s and Leicester Square
Stop Climate Chaos Scotland Response to Scottish Government Consultation on Building Scotland's Low Emission Zones December 2017
 Stop Climate Chaos Scotland Response to Scottish Government Consultation on Building Scotland's Low Emission Zones December 2017 Summary Stop Climate Chaos Scotland (SCCS) is a civil society coalition
Transportation Master Plan Introduction
 1. Introduction Building a Liveable Ottawa 2031 has set out a process to guide the completion of a fiveyear update of the City s Official Plan, Transportation Master Plan, Infrastructure Master Plan, Cycling
Swindon Joint Strategic Needs Assessment Bulletin
 Swindon Joint Strategic Needs Assessment Bulletin Bulletin: Economic Strategy Land and Infrastructure Key Points: Capacity constraints on Swindon s road and rail network pose a threat to securing sustainable
Passenger service for the Dudding Hill line: brief for feasibility study
 Appendix 1: Specification for a Study Passenger service for the Dudding Hill line: brief for feasibility study Introduction The West London Alliance is currently investigating ways of accommodating the
Low Emission Bus Workshop: Local Challenges in Leeds. Gwyn Owen
 Low Emission Bus Workshop: Local Challenges in Leeds Gwyn Owen Summary of Key Transport Challenges Significant population growth of up to 15% by 2028 to 860,000 Most congested part of the Leeds highway
METRO VANCOUVER MOBILITY PRICING INDEPENDENT COMMISSION FINAL TERMS OF REFERENCE. Revised - June 30, 2017
 METRO VANCOUVER MOBILITY PRICING INDEPENDENT COMMISSION FINAL TERMS OF REFERENCE Revised - June 30, 2017 Contents 1. POLICY CONTEXT... 3 2. PROBLEM... 3 3. MANDATE... 4 4. SUPPORTING REGIONAL OBJECTIVES
Shaping our future. A summary of BC TRANSIT S STRATEGIC PLAN 2030
 Shaping our future A summary of BC TRANSIT S STRATEGIC PLAN 2030 INTRODUCTION: THE NEED TO SHAPE OUR FUTURE Many different factors energy constraints, an aging society, the desire for better personal health
Consultation on Integrated Transport Block Funding FINAL. March Consultation Response. pteg Support Unit
 Consultation Response Consultation on Integrated Transport Block Funding FINAL Pedro Abrantes pteg Support Unit Wellington House 40-50 Wellington Street Leeds LS1 2DE 0113 251 7445 info@pteg.net 1. pteg
Smart Travel Choices for South East Queensland: Broadening, Strengthening and Sustaining the Impact of Transport Planning, Infrastructure and Services
 Smart Travel Choices for South East Queensland: Broadening, Strengthening and Sustaining the Impact of Transport Planning, Infrastructure and Services Pia Walmsley, Michelle Mee Queensland Transport 1
Asset Management Plan Strategic Context
 Asset Management Plan 2012 2015 Strategic Context Asset Management Plan 2012 2015 Strategic Context Quality Record Sheet REPORT STATUS Final ORIGINATOR Asset Management Unit Infrastructure Division Contributors:
Call for evidence: London Assembly investigation on Future Rail. July Currently, what are the main challenges for London's rail network?
 Call for evidence: London Assembly investigation on Future Rail July 2018 The Associated Society of Locomotive Engineers and Firemen (ASLEF) is the UK s largest train driver s union representing approximately
Feedback on the 2015 Government Policy Statement
 7 October 2016 Andrew Jackson Deputy Chief Executive Ministry of Transport PO Box 3175 Wellington 6140 Dear Andrew Feedback on the 2015 Government Policy Statement I write to you today in response to the
Greater Cambridge City Deal Executive Board. A428/A1303 Better Bus Journeys Scheme Public Consultation Outcomes and Next Steps
 Report To: Greater Cambridge City Deal Executive Board 3 rd March 2016 Lead Officer: Graham Hughes, Executive Director of Economy, Transport and Environment, Cambridgeshire County Council A428/A1303 Better
This document has been developed to provide context to the Board as part of the strategic planning process. Regional development and travel trends
 1 This document has been developed to provide context to the Board as part of the strategic planning process. Regional development and travel trends and forecasts are provided, including population, employment,
National Infrastructure Commission. Draft remit for consultation
 National Infrastructure Commission Draft remit for consultation THE NATIONAL INFRASTRUCTURE COMMISSION Labour established the Armitt review of infrastructure planning in 2012. Ed Balls announced at the
Improving air quality: national plan for tackling nitrogen dioxide in our towns and cities
 Improving air quality: national plan for tackling nitrogen dioxide in our towns and cities About Living Streets We are Living Streets, the UK charity for everyday walking. We want to create a walking nation,
IHT SPRING CONFERENCE MARCH 2008
 IHT SPRING CONFERENCE MARCH 2008 DYNAMIC NETWORK MANAGEMENT SMART Systems in London Jason Robinson Chief Engineer, Urban Traffic Control Directorate of Traffic Operations Transport for London Presentation
Getting around in Essex A bus and passenger transport strategy summary
 Getting around in Essex A bus and passenger transport strategy summary Working in partnership with 2 Contents Introduction 5 Section One Buses are important to Essex 6 Buses make life better for people
MOBILITY 2045: A FOCUS ON TRANSPORTATION CHOICE:
 Mobility 2045: The Metropolitan Transportation Plan for North Central Texas is the defining vision for the multimodal transportation system in the Dallas- Fort Worth Metropolitan Planning Area. The plan,
Country Report on Sustainable Urban Transport
 Country Report on Sustainable Urban Transport United Nations ESCAP- KOTI Contents 1. Introduction... 2 1.1 Background and status of urban transport systems... 2 1.2 Background and status of public transit
Contents. Overview of Sustainable Glasgow. Strategic approach to energy planning. Current and planned projects
 Sustainable Glasgow Contents Overview of Sustainable Glasgow Strategic approach to energy planning Current and planned projects City in transition A city in transition from heavy industry, with
The evolution of public transport policy in Hong Kong since 1981
 Smart Construction Research RESEARCH ARTICLE The evolution of public transport policy in Hong Kong since 1981 Li Zhe Wuhan Organize Research, Hubei, Wuhan Abstract: Counting only the usable land, the population
A more detailed description of Transportation, and its programs and initiatives can be found at
 Business Plan 2018 21 Transportation Accountability Statement This business plan was prepared under my direction, taking into consideration our government s policy decisions as of March 7, 2018. original
London 2012 Games: A Mobility Management Legacy. Iain Macbeth Business Engagement Programme Manager Transport 1 for London
 London 2012 Games: A Mobility Management Legacy Iain Macbeth Business Engagement Programme Manager Transport 1 for London Transport for London 2012 - a busy summer! 2-5 June Queen s Diamond Jubilee 21
Executive Summary ma. White. Black. paving blo. ving blocks. 0 mm wide
 4450 1250 min min max 120 Concrete blo 1500 ma White ving blocks 0 mm wide Black paving blo RAC Foundation for Motoring Motoring towards 2050 Roads and Reality 7 Road congestion is already seriously harming
Auckland Integrated Transport Plan
 Auckland Integrated Transport Plan (AITP) Glossary Auckland Council Auckland Transport New Zealand Transport Agency KiwiRail Auckland Integrated Transport Plan Draft Auckland Plan Auckland Plan (AC) (AT)
1. Background to the West Midlands 1.1 West Midlands and Future Transport
 1. Background to the West Midlands 1.1 West Midlands and Future Transport The West Midlands is at the heart of the UK s motorway network with the M6, M5, M40, M42 converging on and passing through the
Draft Mayor s Transport Strategy: Joint response from 15 Central London BIDs
 Draft Mayor s Transport Strategy: Joint response from 15 Central London BIDs London Bridge Waterloo Victoria Marble Arch Baker Street Heart of London Paddington Hatton Garden MidTown Northbank South Bank
Hilary Holden, City Access Programme. City Access congestion reduction proposals: Consultation Responses and Next Steps
 Report To: Greater Cambridge City Deal Executive Board 25 January 2017 Lead Officer: Hilary Holden, City Access Programme City Access congestion reduction proposals: Consultation Responses and Next Steps
Queensland Freight Strategy
 Department of Transport and Main Roads Queensland Freight Strategy Advancing Freight in Queensland 1 The State of Queensland, March 2019. Published by the Department of Transport and Main Roads, 1 William
Long Term Rail Strategy Key Messages. Based on updated draft strategy January 2018
 Long Term Rail Strategy Key Messages Based on updated draft strategy January 2018 The North of England plays a vital role in powering the UK economy. It is home to 16 million people and 7.2 million jobs
The Association of Directors of Public Health Improving air quality: reducing nitrogen dioxide in our towns and cities
 The Association of Directors of Public Health Improving air quality: reducing nitrogen dioxide in our towns and cities The Association of Directors of Public Health (ADPH) is the representative body for
Step 4: Strengthened Transport Networks
 Step 4: Strengthened Transport Networks 1. What we want to achieve The transport network has a crucial enabling role in supporting our shared ambitions for growing and rebalancing the economy. Our vision
Delivering Smarter Transport. Networks for Auckland. Tony McCartney Group Manager Road Corridor. December 2013
 Delivering Smarter Transport 1 Networks for Auckland Tony McCartney Group Manager Road Corridor December 2013 2 Transforming Auckland s Transport System In three years transport in Auckland will look very
PUBLIC TRANSPORT LONG TERM VISION FOR MILTON KEYNES
 PUBLIC TRANSPORT LONG TERM VISION FOR MILTON KEYNES CONSULTATION January 2004 We are seeking comments on the final results and recommendations from a study (November 2003) of a long term vision for public
Illawarra Business Chamber/Illawarra First. Submission on NSW Draft Freight and Ports Plan
 Illawarra Business Chamber/Illawarra First Submission on NSW Draft Freight and Ports Plan Illawarra Business Chamber A division of the NSW Business Chamber Level 1, 87-89 Market Street WOLLONGONG NSW 2500
This presentation is one of the support materials prepared for the capacity building program Building Leaders in Urban Transport Planning (LUTP).
.") 1 Cluster 1/Module 2 (C1/M2): Complexity of Urban Transport. This presentation is one of the support materials prepared for the capacity building program Building Leaders in Urban Transport Planning (LUTP).
1 Cluster 1/Module 2 (C1/M2): Complexity of Urban Transport. This presentation is one of the support materials prepared for the capacity building program Building Leaders in Urban Transport Planning (LUTP).
SLP Response to the London Housing Strategy
 SLP Response to the London Housing Strategy 1. Introduction 1.1. The South London Partnership (SLP) is a sub-regional collaboration of five London boroughs: Croydon, Kingston upon Thames, Merton, Richmond
Transport Select Committee Rail Infrastructure Investment Inquiry
 Consultation Response Transport Select Committee Rail Infrastructure Investment Inquiry Tom Ellerton and Jonathan Bray Urban Transport Group Wellington House 40-50 Wellington Street Leeds LS1 2DE 0113
Energy (including greenhouse gas emissions from energy)
") Page 1 of 16 Energy (including greenhouse gas emissions from energy) Draft provisions for the Regional Policy Statement FOR FURTHER INFORMATION Tami Woods DDI: 04 801 1032 X/08/05/01 March 2007 Powerdocs#
Page 1 of 16 Energy (including greenhouse gas emissions from energy) Draft provisions for the Regional Policy Statement FOR FURTHER INFORMATION Tami Woods DDI: 04 801 1032 X/08/05/01 March 2007 Powerdocs#
Strategic Transport Forum 7 th December 2018
 Strategic Transport Forum 7 th December 2018 Agenda Item 3: Transport strategy: vision and principles Recommendation: The Forum is recommended to: a) Consider and endorse, subject to amendments agreed
u Framework Outline Business Case Executive Summary November 2015 u
 u Framework Outline Business Case Executive Summary November 2015 u 1. Executive Summary This document supports a recommendation that the acceleration of digital modernisation on the railway should be
Strategic Transport Plan Position Statement. June 2017
 Strategic Transport Plan Position Statement June 2017 Transport for the North s Vision A thriving North of England, where modern transport connections drive economic growth and support an excellent quality
Welsh Government M4 Corridor Enhancement Measures (CEM) Participation Report Executive Summary
 Participation Report Executive Summary") M4 Corridor Enhancement Measures (CEM) Participation Report Executive Summary Issue 5 August 2013 This report takes into account the particular instructions and requirements of our client. It is not intended
M4 Corridor Enhancement Measures (CEM) Participation Report Executive Summary Issue 5 August 2013 This report takes into account the particular instructions and requirements of our client. It is not intended
Response to Comments from the United Kingdom on the Approval by Mail: CTF Philippines: Cebu Bus Rapid Transit Project (IBRD)
") November 14, 2012 Response to Comments from the United Kingdom on the Approval by Mail: CTF Philippines: Cebu Bus Rapid Transit Project (IBRD) 1. In the section on Sustainability (p17) it is stated that
November 14, 2012 Response to Comments from the United Kingdom on the Approval by Mail: CTF Philippines: Cebu Bus Rapid Transit Project (IBRD) 1. In the section on Sustainability (p17) it is stated that
5 Kapiti Coast: Community, Transport and Travel Behaviour
 5 Kapiti Coast: Community, Transport and Travel Behaviour 5.1 Population Of all territorial authorities in the region, Kapiti Coast has the highest population. It also has the fourth highest population
ANNEX C. Economic Assessment. Parking Proposals Comments of the Economic Development Team
 ANNEX C Economic Assessment Parking Proposals Comments of the Economic Development Team This report summaries the views of the Economic Development Team on the proposed changes to parking charges in Milton
Dear Board of County Commissioners, Mayor Flitner, and Town Councilors,
 May 27, 2015 Dear Board of County Commissioners, Mayor Flitner, and Town Councilors, Thank you for this opportunity to comment on the public review draft of the Integrated Transportation Plan (ITP). The
How the NZTA s Investment and Revenue Strategy guides our investment in the land transport system
 How the NZTA s Investment and Revenue Strategy guides our investment in the land transport system The NZTA creates transport solutions for a thriving New Zealand. Our job is to help New Zealanders travel
South East Manchester Multi-Modal Strategy
 South East Manchester Multi-Modal Strategy Key Messages - Consultation Draft May 2018 Contents Background... 1 Context...4 Vision... 5 Strategic priorities... 6 Principal intervention areas... 7 Early
SUBMISSION TO THE CONSULTATION ON THE GREATER MANCHESTER SPATIAL FRAMEWORK
 Standish Voice Speaking up for Standish SUBMISSION TO THE CONSULTATION ON THE GREATER MANCHESTER SPATIAL FRAMEWORK Chapter 1 Introduction Question 6: Do you agree that we need a plan for jobs and homes
Information sheet: STRATEGIC CASE: DEFINING PROBLEMS AND BENEFITS WELL
 NZ TRANSPORT AGENCY Business Case Approach information sheet Strategic case: defining problems and benefits well June 2017 Information sheet: STRATEGIC CASE: DEFINING PROBLEMS AND BENEFITS WELL This information
5.0 BUILDING OUR STATE
 5.0 BUILDING OUR STATE 36 2036 WILL MARK SOUTH AUSTRALIA S BICENTENARY. Obviously, we have much to be proud of and grateful for, but I think most South Australians feel things could be a lot better. Where