The Modelling of Roadway Development to Support Longwall Mining
|
|
|
- Homer Gray
- 6 years ago
- Views:
Transcription
1 ACARP Australian Coal Association Research Program The Modelling of Roadway Development to Support Longwall Mining Prepared by: Ernest Baafi, Geoff Gray, Ian Porter, Osvaldo Rojas and School of Civil, Mining and Environmental Engineering University of Wollongong C17019 November 2009
2 Disclaimer No person, corporation or other organisation ( person ) should rely on the contents of this report and each should obtain independent advice from a qualified person with respect to the information contained in this report. Australian Coal Research Limited, its directors, servants and agents (collectively ACR ) is not responsible for the consequence of any action taken by any person in reliance upon the information set out in this report, for the accuracy or veracity of any information contained in this report or for any error or omission in this report. ACR expressly disclaims any and all liability and responsibility to any person in respect of anything done or omitted to be done in respect to information set out in this report, any inaccuracy in this report or the consequences of any action by any person in reliance, whether wholly or partly, upon the whole or any part of the contents of the report.
3 Table of Contents ABSTRACT...1 ACKNOWLEDGEMENTS...2 EXECUTIVE SUMMARY INTRODUCTION Overview Objectives Methodology Project Stages Appreciation of the Roadway Development Process Collection of Operating Data Development of the Modelling System Validation of the Modelling System SIMULATION TECHNOLOGY THE MODELLING OF ROADWAY DEVELOPMENT OPERATIONS Roadway Development Process Miner Cycle Shuttle Car Cycle Interaction Between Miner and Car Cycles Support Operations Face Operations Boot End and Outbye Services Panel Advance Equipment Availability and Shift Schedules Data Requirements Data Analysis Issues with Data Collection Reporting and Selection of Key Performance Indicators SYSTEM COMPONENTS Overall System Design Excel Interface The Arena System End User Interaction with the System USING THE SYSTEM CASE STUDIES Overview Case Study Mine Overview Roadway Development Data and Cycle Times Historical Delay Data Historical Roadway Development Performance Simulation Results Case Study Mine Overview Roadway Development Data and Cycle Times Historical Delay Data Historical Roadway Development Performance Simulation Results DATA RELATED ISSUES TECHNOLOGY TRANSFER...46 APPENDIX A...47 APPENDIX B...54
4 ABSTRACT The practice of longwall mining is potentially an efficient and cost effective means of extracting coal from underground seams, however, for production targets to be achieved not only must the longwall perform as expected but roadway development must be kept ahead of the longwall advance. The evaluation of development options is a challenging exercise due to the interactions between mining, tramming and clearance operations. In particular, the high levels of variability and uncertainty in operations make it difficult to assess how a particular configuration may perform. A modelling system, RoadSIM, based on the ARENA simulation tool has been produced to assist in the analysis of the roadway development process. The RoadSIM system provides a means for assessing the operational capacity of roadway development practices at a particular coal mine. The simulation model provides a what if tool to allow a range of equipment, configuration and operating practices to be assessed in terms of achievable advance rates and equipment utilisation. Output from the simulation is in the form of a dynamic visualisation as well as summary reports and detailed logs of operations over time. Page 1
5 ACKNOWLEDGEMENTS The authors would like to thank Gary Gibson of Gary Gibson & Associates, Frank Hendricks of BHP Billiton - Illawarra Coal, Richard Porteous of Xstrata Coal and the following members of the ACARP Roadway Development Task Group for their valuable input during the model development and also making mine operational data available for RoadSIM model configuration and validation: Guy Mitchell, BMA Bob Miller, Centennial Coal Robert Gordon, BHP Billiton - Illawarra Coal Jim Sandford, Xstrata Coal Roger Wischusen, ACARP Special thanks to Associate Professor Michael Boyd of the University of Wollongong for assisting with the statistical analysis of mine delay data. Page 2
. The result of this collaboration is a modelling system able to be used to review and explore options related to gate road development.")
6 EXECUTIVE SUMMARY BACKGROUND (SMS) and the University of Wollongong (UoW) have collaborated on the Australian Coal Association Research Program (ACARP) project The Modelling of Roadway Development to Support Longwall Mining" (Project C17019). The result of this collaboration is a modelling system able to be used to review and explore options related to gate road development. Longwall mining is recognised as an efficient and cost effective means of extracting coal from underground seams, however, effective longwall operation requires that roadway development must be kept ahead of the longwall advance. The development process requires the coordination of a range of mining equipment operating in challenging working conditions. For efficient operations to be possible the equipment used must be matched to the local environment and mining conditions. A number of options can exist for laying out and configuring any roadway development system, however, evaluating the relative performance of these options can be difficult. The result of this project is a dynamic simulation system referred to as RoadSIM. RoadSIM is a computer simulation that has been specifically developed to model roadway development operations in a typical two heading configuration. Through RoadSIM it is possible to investigate the impact changes in equipment configuration and/or operational procedures may have on performance indicators such as development rates, time to complete a pillar or equipment utilisation. Page 3
7 Executive Summary PROJECT OBJECTIVE The project objective was to provide the coal mining industry with a tool that could assist in improving the overall productivity of roadway development. In particular, the project was to develop a modelling system capable of being used to assess the impact on development rates of various roadway development options. The system was intended to allow professionals, that may have only a general knowledge of simulation, to be able to build, customise and use simulation models of a range of roadway development processes. These simulation models were to be capable of being used to analyse current roadway development operations as well as being able to assess the impact on performance of potential changes in procedures and/or equipment. TECHNOLOGY EMPLOYED To achieve the desired objectives a computer simulation modelling system has been developed that utilises the technique of animated discrete event simulation. Discrete event simulation provides a proven technique to study the interaction between components of a complex system. It is especially well suited to evaluate the performance of roadway development operations. In addition, the simulation technology has the ability to explicitly allow for the randomness/variability inherent in the mining operation. For example, modelling can consider variability in shuttle car tramming times, loading and discharging times, the time to complete support operations and process availability. The system has been developed using "industry standard" simulation software (Arena) so that it may be expanded in scope and detail if required. The computer models built using RoadSIM can be used to analyse current roadway development operations as well as assess the impact on performance of potential changes in procedures and/or equipment. PROJECT STAGES The development of the modelling system involved a number of stages. These included: appreciation of the roadway development process; collection of operating data; development of a modelling system; validation of the modelling system; and what if analysis. During the course of the project SMS and UoW worked with industry personnel to gain an understanding of the development process in different environments. Two mine sites provided additional data to assist in both configuring the modelling system and to provide a means of validating model output against recent operations. Page 4


8 Executive Summary RoadSIM - SYSTEM CAPABILITY RoadSIM is able to simulate two heading roadway development configurations, including all operations from the boot end to the development face. The simulation provides an animated display plus a range of output statistics that can be used to assess the performance of roadway development options. The statistics reported (see figures below) provide information on: expected development rates (m/operating hour); time to complete a pillar; utilisation of continuous miners. The system is capable of considering aspects of roadway development such as: Pillar Layout o pillar length; o cut-through length; o cut-through to Boot End distance; o heading width and height. Continuous Miner Operation o number of continuous miners (CM) in the model; o miner types, either a Miner-Bolter (ie mining and bolting are executed sequentially) or a Bolter-Miner (ie mining and bolting are executed in parallel); o the sequence followed by the miner/s in each heading. Shuttle Car Operation o number of cars in the model; o route followed by each car, note each car can only service a single miner; o shuttle car capacity, loading and discharge rates and wheeling velocity. Face Operations o standard face operations are included (e.g. stone dusting, supplying miner, installing vent tubes); o other face operations (e.g. cutting breakaway, niche, etc). Support Operations o time required to complete support operations. Boot End and Out-bye Operations o boot end with or without bunker; o bunker capacity and feed rate onto the out-bye conveyor. Page 5
9 Executive Summary Availability o patterns of weekly operating shifts and planned maintenance; o unplanned delays including duration and mean time between failure. EVALUATING ROADWAY DEVELOPMENT OPTIONS Once the model is validated for a specific site it can be used to explore options by varying the input parameters. The model is set up for a "what if" type of analysis. This allows the user to put forward alternate equipment/ operations and predict the likely impact on production rates. Typically RoadSIM would be used to consider the impact on development rates of aspects of operations such as: pillar and cut through dimensions; number of shuttle cars in use; cycle times for cutting and loading at the development face; cycle times for bolting; shuttle car tramming speeds; cycle time for discharge of a shuttle car; delays effecting out-bye services; and delays effecting face operations. Page 6
10 1.0 INTRODUCTION 1.1 Overview Longwall mining is an efficient and cost effective means of extracting coal from underground seams, however, effective longwall operation requires that roadway development must be kept ahead of the longwall advance. The development challenge is how best to achieve the required development rates in a cost effective manner. The development process requires the coordination of a range of mining equipment operating in difficult working conditions. For efficient operations to be possible the equipment used must be matched to the local environment and mining conditions. A number of options can exist for laying out and configuring any roadway development system, however, evaluating the likely relative performance of these options can be difficult. Dynamic system simulation provides a proven technique to study the interaction between components of a complex system. It is especially well suited to evaluate the performance of roadway development operations as dynamic system simulation is one of the few analysis techniques that has the ability to explicitly allow for the randomness/variability inherent in any mining system. Examples of this variability may include: shuttle car tramming time; loading and discharging time; time to complete support operations; and availability of equipment. (SMS) and the University of Wollongong (UOW) have collaborated on the Australian Coal Association Research Program (ACARP) project The modelling of roadway development to support longwall mining. The result of this collaboration is a modelling system (RoadSIM) able to be used to review and explore options related to gate road development. The RoadSIM modelling system is a computer simulation system developed specifically to model roadway development operations in a typical two heading configuration. RoadSIM as an analysis tool provides a means of investigating the likely impact of changes in equipment configuration and/or operational procedures on performance indicators such as: development rates; time to complete a pillar; and equipment utilisation. This document describes the modelling system developed, its validation against existing operations and its potential for use within the industry. Page 7
11 Introduction 1.2 Objectives The project objective was to provide the coal mining industry with a tool that could assist in improving the overall productivity of roadway development, in particular, the project was to develop a modelling system capable of being used to assess the impact on development rates of various roadway development options. The system was intended to allow professionals, that may have only a general knowledge of simulation, to be able to build, customise and use simulation models of a range of roadway development processes. These simulation models were to be capable of being used to analyse current roadway development operations as well as being able to assess the impact on performance of potential changes in procedures and/or equipment. 1.3 Methodology To achieve the desired objectives the technique of Dynamic System Simulation was selected as the appropriate technology for the development of the modelling system. The modelling system focuses on two heading gate road development, however the system has been developed using industry standard simulation software so that it may be expanded in scope and detail if required. To assist in the development of the modelling system SMS and UOW worked with, and drew on the experience of, two mine sites running different equipment configurations. The mine sites that provided this assistance are referred to as Mine 1 and Mine 2 in this document 1.4 Project Stages The development of the modelling system involved a number of stages. These included: appreciation of the roadway development process; collection of operating data; development of a modelling system; and validation of the modelling system. Figure 1.1 depicts the RoadSIM modelling approach. Deleted: Figure 1.1 Page 8
12 Introduction Figure RoadSIM Methodology Map Roadway Development Process Design & Build Roadsim Tool Kit Collect Operating data Build Case Study Models Validate Case Study Collect and analyse historical performance Models Refine Tool kit and Models Acceptable? Deliver Roadsim & Present Results Appreciation of the Roadway Development Process SMS and UOW worked with industry representations to gain an understanding of the roadway development process from the perspectives of a number of different operators. The basic operations identified were: Two heading development using one continuous miner and one shuttle car; Two heading development using one continuous miner and two shuttle cars; Two heading development using two continuous miners and two shuttle cars (Figure 1.2). Deleted: One Deleted: One Deleted: Figure 1.2 Page 9
13 Introduction Figure Basic Two Heading Development Collection of Operating Data For the project to be successful the modelling system developed needed to be validated against existing operations. Operating data from two case study mines was collected so as to allow the models to be configured and to allow model performance to be compared against historical operations. The data collected was reviewed, analysed and then used to allow the modelling system to be tested Development of the Modelling System The modelling system was designed and developed with consideration to the project objectives. A modelling system based on the use of an EXCEL interface and the ARENA simulation engine was developed Validation of the Modelling System The validation of the modelling system essentially involves ensuring the model is capable of representing historical operations in a reasonably accurate manner. This tends to be an iterative process whereby the model is first setup to represent operation in terms of: pillar configuration; equipment capacities; cycle times; and availability. Model output is then compared against historical performance using measures such as: advance rates in metres per operating hour; time to complete 1000m of linear panel advance; and equipment utilisation. If the model fails to provide reasonable results its logic and assumptions are reviewed, the model upgraded and the process repeated. The process is repeated until the model provides a reasonable representation of historical performance. Page 10
14 2.0 SIMULATION TECHNOLOGY The RoadSIM computer simulation system is based on the application of dynamic system simulation technology, also known as discrete event simulation, Monte Carlo simulation, simulation modelling or simply dynamic simulation, it is a well established analytical technique. The technology is based around a computer model which progressively updates the state of the system over time based on the logical rules and mathematical relations inbuilt in the system itself. Once developed the model can be used to simulate the operation of a system - either existing or proposed - over a time period of interest. The simulation model will respond to given inputs much as would be expected in the real world. The model can be used to "experiment", testing various ideas and options to get an understanding of how the real system may behave given changes to the system such as alternate layouts, different operating strategies and various other potential system modifications. Two characteristics differentiate simulation modelling from other types of modelling. The first is the inclusion of the time element. The model will pass through many different states during a period of simulated time, reflecting the changing state of the real-life system over time. As the passage of time is modelled explicitly, the model can be used to monitor the likely state of the system and be used to collect realistic performance statistics. The second characteristic is the inclusion of variability. A simulation model will include the randomness/variability which characterises any real-life system. Examples of this randomness include the time to load a shuttle car, time to discharge coal at the boot end, time to place supports, timing of breakdown and delays and the time to repair equipment. The impact of variability on the performance of a system can be quite significant, typically it will result in non-achievement of theoretical capacity. The option of realistic animation greatly aids the understanding of how the system will function. It allows the visualisation of the dynamics of the system, facilitating study of the interactions between system components in a manner which is simply not possible by manual analysis. It can also assist in the identification of potential problem areas which may not be immediately obvious from the summary statistics generated by the simulation model (Figure 2. 1). In addition, a realistic animation can assist in communicating to various stakeholders what the implications are of changing roadway development equipment and configurations. Deleted: Figure 2. 1 Page 11

15 Simulation Technology Figure Snapshot of an Animated Display In summary, simulation technology offers the ability to replicate the operation of reallife, complex and highly interacting systems. The system under review may exist or may still be at the concept stage. Using this technology it is possible to determine the likely performance of a range of layouts and equipment options without the need to expend capital upfront or interfere with existing operations. Page 12
16 3.0 THE MODELLING OF ROADWAY DEVELOPMENT OPERATIONS RoadSIM has been developed to simulate the typical activities of a 2 heading gate road development operation from the face to the boot end. These activities include the operation of the continuous miner/s, shuttle car/s and outbye services and their interactions. One of the key advantages of RoadSIM is that it can be used as a what if analysis tool to assess the relative performance of possible changes to current roadway development operations and/or equipment. RoadSIM has the functionality to record a range of data and statistics on the status and conditions of each part of the system throughout the simulation process. This information is used to distil KPIs to assess the performance of the roadway development configuration being simulated. Using the data entry workbook the user can configure RoadSIM to operate with: 1 Continuous miner and 1 shuttle car; 1 Continuous miner and 2 shuttle cars; or 2 Continuous miners and 2 shuttle cars. For each configuration RoadSIM can be used to look at a range of different equipment capacities and/or availabilities. 3.1 Roadway Development Process Initially, information on the roadway development process was collected through numerous discussions with industry experts as well as site visits to underground roadway development operations. The information was then synthesised into a process map for each of the two main activity cycles that take place during roadway development: the miner cycle and the shuttle car cycle. These process maps were then used to assist in developing the logic and rules that form the core of the simulation system. A description of the miner and car cycles is presented in the following sections. Page 13
17 The Modelling of Roadway Development Operations Miner Cycle The Miner cycle comprises of a series of steps or activities that are completed in a predefined sequence. Differences in the Miner cycle were identified when the continuous miner operating is a bolter-miner or when it is a miner-bolter. Bolterminers have the ability to cut coal in parallel to installing roof and rib bolts for support. Miner-bolters are constrained to complete the cutting and loading of coal before they can start support operations. The miner-bolter cycle considered in the model includes the following steps: 1. Miner waits for car to arrive at face; 2. Miner cuts coal and loads car; 3. Steps 1 and 2 can be repeated if more than one car is loaded for every miner advance; 4. Miner initiates and completes support operations; 5. Miner advances and sets up to re-initiate cycle. The bolter-miner cycle considered in the model includes the following steps: 1. Miner initiates supports operations; 2. Miner waits for car to arrive at face; 3. Miner cuts coal and loads car; 4. Steps 2 and 3 can be repeated if more than one car is loaded for every miner advance; 5. Miner completes support operations; 6. Miner advances and sets up to re-initiate cycle Shuttle Car Cycle The shuttle car cycle considered in the model includes the following steps: 1. Car waits for miner to start cutting coal at face; 2. Car loads coal at the face; 3. Car trams to boot end; 4. Car discharges at boot end; 5. Car trams to face and re-initiates cycle. Car tramming times are determined by car characteristics such as maximum speed, acceleration, deceleration and possible traffic interactions when more than one car is operating in the same area Interaction Between Miner and Car Cycles The miner and car cycles do not operate independently. They synchronise every time coal is cut and loaded on a car. The model assumes that a miner would not normally be able to start cutting coal unless a car is ready to be loaded at the face. This ignores the common practice of cutting small quantities of coal and dumping it Page 14

18 The Modelling of Roadway Development Operations on the floor for deferred loading on a car. Similarly, a car that is positioned at the face cannot proceed with its activity cycle until the miner is ready to start cutting and loading the car. Figure 3.1 illustrates each cycle and how they interrelate. Figure Car and Miner Activity Cycles The interaction between the miner and car cycles can result in both cycles having an impact on the development rates achievable with a particular miner-car configuration. Typically, when the miner is close to the boot end the miner cycle time determines the development rate achievable. As the miner advances away from the boot end, the potential exists for the shuttle car cycle time to become the constraint on development Support Operations Support operations are modelled as a single activity that requires a predefined amount of time to complete. The duration of support operations depends on the roof and rib bolting density required for the particular area of roadway development being simulated. If the miner selected in the simulation is a bolter-miner then support operations are initiated at the beginning of the miner cycle and they are allowed to progress in parallel with the cutting of coal. If the miner selected in the simulation is a minerbolter then support operations can only be performed after the cutting of coal is completed Face Operations Face operations are activities other than those included in the miner and car cycles that take place during roadway development and have an impact on roadway drivage rates. The model includes as standard face operations the following: installation of vent tubes; supplying the miner with consumables; stone dusting. Face operations are modelled as delays (scheduled by time or distance cut, ie not random or unforseen) in the miner cycle. Page 15
19 The Modelling of Roadway Development Operations The model has the flexibility to include a series of custom defined face operations to better reflect the activities of specific roadway development operations. These may include the cutting of cable niches, GEBs, breakaways, holing through, etc Boot End and Outbye Services Cars approaching the Boot End can discharge either into a bunker of given capacity or directly on the outbye conveyor. Both options are included in the model. When discharging into a bunker delays may occur whenever the bunker reaches its full capacity Panel Advance The model includes the time required to complete a panel advance or belt extension each time a pillar has been fully developed. During a panel advance no other roadway development activity takes place Equipment Availability and Shift Schedules Production and maintenance shift schedules are customisable. development activities take place only on production shifts. Roadway The model also takes into account equipment availability by generating a pattern of random breakdown events that create delays to the usual operations of the miner, shuttle cars and the boot end. Delay properties such as mean time between failure (MTBF) and mean time to repair (MTR) should be selected to reflect either historical performance of roadway development operations or best estimates of likely future operations. 3.2 Data Requirements An important aspect of configuring a simulation model able to adequately replicate a real roadway development operation is to provide the model with accurate data collected from the process. The type of data required to run RoadSIM can be summarised in three broad groups: 1. process parameters and cycle time data; 2. historical delay data; and 3. historical performance data (for model validation). Process parameters and cycle time data include: pillar layout data (pillar length, cut-through length, heading width, etc.); continuous miner and shuttle car configuration data (miner type, car loading and discharge rates, car maximum speed, etc.); Page 16
20 The Modelling of Roadway Development Operations continuous miner sequence data (cutting sequence followed by the miner/s along the pillar); support operation data (time to complete support based on required bolting density); shift pattern data (including production, maintenance and scheduled downtime). Historical delay data is used to extract key statistical indicators on the frequency and duration of delays so that they can be replicated in the simulation model using Arena s random number generation capabilities. Historical performance data such as development rates, average time to complete a pillar and metres cut per shift are used to validate the results of the model. These data are not required for running the model, but are used to test that the model setup is capable of generating results which are a reasonable representation of past operations. In Section 6 two case studies are presented that illustrate the use of historical performance data for validation. 3.3 Data Analysis Equipment availability information is extracted from historical delay data. Most mining operations have a system in place to record planned and unplanned process delays. Once collected, historical delay data can be analysed to extract statistics including: Mean Time Between Failure (MTBF); probability distribution for the recorded time between failure; Mean Time To Repair (MTTR); probability distribution for the recorded time to repair. The above statistical information is then used in the model to replicate the random behaviour of unplanned delays. Each coal mine usually has a different way of categorising delay data, so in order to offer a level of standardisation of the reporting of delays in the model, a set of delay categories were defined. The delay categories used in RoadSIM including their definitions are listed in Table 3.1. Page 17
21 The Modelling of Roadway Development Operations Table Delay Categories Used in the Model Delay Category Mine Process Planned Unplanned Outbye Services Unplanned Panel Engineering Planned Unplanned Panel Process Planned Unplanned Sequence Move Planned Unscheduled Planned Description Planned labour availability delay Unplanned labour availability delay Unplanned outbye services delay Planned maintenance Unplanned breakdowns of miner and/or car Delay due to planned face operation Delay due to unplanned mining conditions Delay due to sequence (panel) advance Delay due to planned downtime 3.4 Issues with Data Collection Data was collected from two mine sites for analysis and used with the model. Details on the application of RoadSIM to these two roadway development operations are presented in Section 6. Most process parameter data were generally readily available, however, some cycle time data can be more difficult to obtain unless some form of onboard monitoring is in place. Examples are the time required to complete support operations or the car tramming time to the boot end. In these cases, either some form of time and motion data collection is necessary or the experience of operating personnel can be used to obtain an indicative estimate of the cycle times. Difficulties were also encountered when analysing historical delay data. The main issue being the lack of standardisation in recording downtime, both within the industry and between individual mine sites within a company. The downtime classification settled on for modelling was that shown in Table Formatted: Justified Formatted: Font: Not Bold Deleted: 3.5 Reporting and Selection of Key Performance Indicators After the completion of a simulation run, the model generates several output reports. The Key Performance Indicator (KPI) Report summarises the KPI s obtained from a particular run of the model. They include: number of days required to complete 1000 m of linear panel advance; average number of days required to complete a pillar; Page 18

22 The Modelling of Roadway Development Operations development rates (metres per operating hour or run hour). KPI s provide a quick snapshot of the roadway development performance achieved. Additional reports provide more detail on both miner and shuttle car utilisation. The utilisation categories used in the model are listed in Table 3.2 and a sample chart of the output is shown in Figure 3.2. Deleted: Figure 3.2 Table Miner Time Utilisation Definitions Time Category Available Time Scheduled Production Time Operating Time Run Time Net Run Time Description Total time in a week (= 24x7 hours per week) Total Available time less scheduled downtime, maintenance time and shift handover Scheduled Production time less Panel Advance Time Operating time less recorded delays Reported Run time less unrecorded delays Figure 3.2 Miner Utilisation Sample Chart Page 19

23 4.0 SYSTEM COMPONENTS The RoadSIM modelling system is an application developed to run under Microsoft's Windows operating system. The modelling system is based around Microsoft's Excel spreadsheet application and Rockwell's Arena modelling system. This section of the document outlines the relationship between the various system components. 4.1 Overall System Design The relationship between the various model components is shown in Figure 4.1. Figure RoadSIM System Components EXCEL ARENA S1C1 S1C1 S1C1 Project Workbook Input Sheets Case Run Data RasAzZawrTrafficStudy Model Logic Other Model Input Performance Report Custom Reports Model Reports and Log Files Animation 4.2 Excel Interface Excel has been used to provide a familiar interface for data entry and reporting. An Excel workbook is used to: allow case run data to be defined; manage the saving and retrieval of case run data; initiate model runs; retrieve and review reports generated by the model; format/display reports as required. Page 20
24 System Components 4.3 The Arena System The Arena model contains the detailed logic defining the roadway development operations. The Arena simulation system is used to: mimic operations over time; add appropriate randomness; provide an animated display of operations; generate detailed reports defining performance indicators observed during the running of the model. 4.4 End User Interaction with the System An Excel workbook is used to setup case runs for analysis and initiate the running of the RoadSIM Arena model (see Figure 4.1). Most process data and parameters are entered into the workbook and only limited interaction with the Arena system is required. Sample screenshots of the Excel workbook interface are provided in Appendix B. Page 21
25 5.0 USING THE SYSTEM After RoadSIM has been configured to replicate the operations of interest, the next step is to confirm that the output results generated by the model are consistent with historical performance data, this is known as model validation. A successful model validation process gives the User confidence that RoadSIM has been configured appropriately to replicate historical performance. After verification, RoadSIM can be used as a what if analysis tool to assess the impact on roadway development performance of a range of alternatives, including changes in equipment, configuration and operating practices. In essence, running alternative scenarios using RoadSIM allows the analyst to see how their operations would have performed if their equipment, configuration and/or practices had been different. The process is illustrated in Figure 5.1. Figure Using RoadSIM for Analysis Typically RoadSIM would be used to consider the impact on development rates of aspects of operations such as: pillar and cut through dimensions; number of shuttle cars in use; miner type; cycle times for cutting and loading at the development face; cycle times for bolting; shuttle car tramming speeds; Page 22
26 Using the System cycle time for discharge of a shuttle car; delays effecting out bye services; and delays effecting face operations. As an example of the system s use, options may be considered to reduce the amount of time required to setup and install roof/rib bolts. In this case the model could be set up and run with a range of possible times for support to be completed. The model output would then be used to provide an indication of the likely times to advance a 1000 linear metres. Figure 5.2 shows the results of this hypothetical analysis. From the graph it can be seen that the development time can be decreased by reductions in bolt cycle time up to a point where the operation becomes constrained by other factors. Figure Sample Analysis Page 23
27 6.0 CASE STUDIES 6.1 Overview In the early stages of the project two mine sites were selected and used to benchmark model performance. The case study mines were used to ensure that the modelling system had sufficient functionality to replicate operations and that model output provided results inline with historical operations. Two separate companies made data available to assist in the development of RoadSIM. In this report the mine sites are referred to as MINE 1 and MINE 2. These mines provided data on: process parameters; cycle times; historical delay information; and development rates achieved. 6.2 Case Study Mine Overview Data from Mine 1 referred to a development period of operations between January and May Gate road development operations were based on a two heading configuration using one bolter-miner supported by one shuttle car. Pillars were 102 m long and 40 m wide, centre to centre. Roof and rib conditions required a bolting density of 6 roof bolts and 3 rib bolts on each rib with an average time to complete support operations of 12 minutes. Historical performance indicated an Operating Time of 62% of total calendar time and a Run Time of 24% of total calendar time (definitions are summarised in Table 3.2) with an average development rate of 4 metres per run hour. The average time to complete a pillar, which includes the time to complete a sequence move, was 11 days Roadway Development Data and Cycle Times Table 6.1 summarises the process parameters data and cycle times collected for Mine 1. Page 24
28 Case Studies Table Process Parameters and Cycle Time Data for Mine 1 Units Value Pillar Layout and coal density Pillar length m 102 Cut-through length m 40 Cut-through to Boot End m 20 Heading width m 5.2 Mining height m 3.4 Coal density t/m3 1.5 Continuous Miner Type n/a Bolter-Miner Metres advanced in each cutting cycle m 0.92 Shuttle Car Car capacity t 13 Max car loading rate t/h 420 Max car discharge rate t/h 420 Max wheeling speed m/min 95 Number of cars loaded in each cutting cycle # 2 Support Operations Total bolting time min 12 Boot End Bunker capacity t 8 Out-bye conveyor rate t/h 720 Face Operations Install vent tubes every m 4 Install vent tubes duration min 4 Stone dusting every (distance) m 25 Stone dusting every (time) h 24 Stone dusting duration min 30 Supply CM every m 15 Supply CM duration min 15 Panel advance Average time to complete panel advance h 24 Most of the data described in Table 6.1 were easily obtainable, such as the pillar layout data, the continuous miner specifications and car characteristics, however, other data were more difficult to find as they were not routinely recorded. Examples include the time required to complete support operations and the car maximum achieved wheeling speed. In these cases, further discussion with mine personnel provided indicative estimates of cycle times and parameter values. Page 25

29 Case Studies Mine 1 operated on a shift schedule consisting of three 10 hour shifts per day Monday to Thursday. Two 12 hour shifts were scheduled for Fridays, while a single 12 hour shift was scheduled for Saturdays and Sundays. A total of 15 hours of planned maintenance was scheduled per week. Figure Sequence Followed by the Miner in a Pillar for Mine 1 The sequence followed by the miner in the pillar is depicted in Figure 6.1. The boot end is positioned in Heading A. At the beginning of the sequence, the miner is positioned in Heading A, 30 m from the cut-through. The miner then cuts along Heading A, overdriving 30 m past the next cut-through entry point. The miner back flits and initiates the cut-through breakaway. Miner cuts along the cut-through, holing into Heading B and overdriving to create a 2 metre deep niche. Miner flits back to Heading B starting 10 m into the heading from the cut-through. The miner finally cuts along Heading B to the 10 m mark past the next cut-through. In addition to the above sequence, the miner is required to cut cable niches at the 93 m and 110 m mark along Heading A. Each niche may take up to one hour to complete. During a normal cutting cycle the bolter-miner advanced, on average, 0.92 m. Two shuttle cars were usually loaded in each cutting cycle requiring, on average, around 2 minutes to complete each load. Page 26
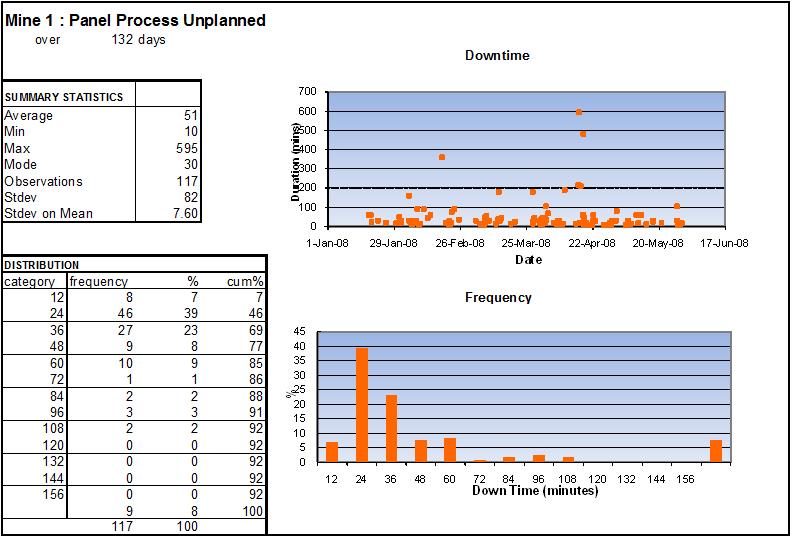
30 Case Studies Historical Delay Data Historical delay data for Mine 1 were made available covering a total period of one year. For each delay event, information included the starting time of the delay, the duration, the shift in which the event occurred, and the delay categories associated with the event. These categories included a major, minor and detailed delay category. A first step in the analysis of the data was to match the reported delay categories with those defined in RoadSIM (listed in Table 3.1). A direct association of the delay categories was not always possible, so some level of discretion was required to select the most appropriate category out of those listed in Table 3.1. Once the delay data was organised in the relevant categories, it was analysed to detect and remove any outliers. Reviewing the data, it was decided to focus the analysis on a sub-period of approximately four and a half months that showed a more uniform profile of delay event durations. This was also to match the period of time for which information on the number of metres cut per shift was available. Table 6.2 Historical Delays for Mine 1 Delay Duration (min) Mean Time Total Duration (% of Delay Category Between Events Operating Time) Min Avg Max (hours) Mine Process Planned 0.5% Mine Process Unplanned 0.2% Outbye Services Unplanned (short delay) 9.0% Outbye Services Unplanned (long delay) 16.7% Panel Engineering Unplanned 6.3% Panel Process Unplanned 5.0% Table 6.2 summarises the information extracted from the delay data. It shows the average, min and max duration of the delay for each category, as well as the mean time between events. The proportion of operating time the miner was delayed on each delay category is also shown in Table 6.2. Figure 6.2 shows a histogram chart of the delay duration for the Outbye Services Unplanned category. This type of chart is useful to estimate profile for the delay durations. The profile determined (probability density distribution) is then used in the model to generate a similar pattern of delay durations. Page 27
31 Case Studies Figure Histogram of Delay Durations for Outbye Services Unplanned Category Frequency (%) Outbye Services Unplanned (short) Delays Delay Duration (minutes) Similar histograms were generated for the other delay categories listed in Table 6.2 and they are included in Appendix A Historical Roadway Development Performance Historical development performance data were used to validate the results obtained using RoadSIM. It is usually the case that, initially, there will be some discrepancies between historical performance and the results reported. In such cases, adequate calibration of the model can better align the simulation results with historical performance. For Mine 1, surveying data was made available indicating the date and the number of metres cut by the miner in a pillar up to that point in time. The surveying data covered the same total period of time for which delay data was analysed. Survey data allowed the average number of days it took to complete a pillar, from first coal to first coal, to be estimated. In addition, data were made available indicating the number of metres cut in each production shift. These data were used to calculate development rates achieved in terms of metres per run hour and metres per operating hour. The data are summarised in the histogram chart of number of metres cut per shift shown in Figure 6.3 and Table Historical Performance Indicators for Mine 1 Deleted: Table Historical Performance Indicators for Mine 1 Page 28

32 Case Studies Table Historical Performance Indicators for Mine 1 Page 29
33 Case Studies Figure Histogram of Metres Cut Per Shift for Mine 1 Frequency (%) Histogram of metres cut per shift (Mine 1) metres Frequency % Simulation Results The model was set up to replicate the simulation of a pillar s development many times over. Each replication of the model considered the same pillar, but different occurrences of unplanned delays. This was done so that overall average results would be a realistic estimate based on a range of possible fast and slow development rates. Table 6.4 presents a comparison between historical performance for Mine 1 and the results obtained using RoadSIM. Circled in red are the key performance indicators, including the average pillar cycle time and the development rate (in metres per operating hour and metres per run hour). The simulation results provide a reasonable match with the historical performance. The model predicted an average pillar cycle time of 11.1 ± 0.5 days compared to an historical average of 11 days. Formatted: Font: Not Bold Formatted: Font: Not Bold, Check spelling and grammar Deleted: Table 6.4 Page 30

34 Case Studies Table Comparison Between Historical Performance and Simulation Results for Mine 1 Page 31

35 Case Studies Reported development exposure rates also show a close correspondence to historical rates. The reported rate of metres per operating hour is close to, but slightly below, historical performance. However, the possibility exists that there may have been some error in estimating the historical rate as the calculation involved manually reviewing survey data and correlating it with delay records. Figure Miner Utilisation in Mine 1 Figure 6.4 shows a chart of the miner utilisation, this is a graphical representation of the percentages reported in Table 6.4. It can be seen that scheduled production time accounts for 65.4% of the total time simulated, whilst operating time accounts for 56.4% of the time. The percentage of time the miner is actually performing any development work amounts to only 23%. Formatted: Font: Not Bold Formatted: Font: Not Bold, Check spelling and grammar Deleted: Table 6.4 Figure 6.5 compares the histograms between the historical metres cut per shift and the metres cut per shift reported using RoadSIM. It can be seen that the overall range and distribution of metres cut per shift is similar in both charts. This indicates that RoadSIM has been able to adequately replicate not only the overall average rate, but the likely range the development rates experienced at Mine 1. Page 32
36 Case Studies Figure Comparison Between Historical Metres Cut Per Shift and Simulation Results Frequency (%) Histogram of metres cut per shift (Mine 1) metres Frequency % Frequency (%) Histogram of metres cut per shift (Model) metres Frequency % Figure 6.6 shows two examples of how the development rate of metres per run hour varies against the position of the miner in the pillar. The two charts show the results from two different pillars simulated with the model. The horizontal axis indicates the total number of metres cut in the pillar. Based on the sequence followed by the miner (see Section 6.1) the number of metres cut represents the position of the miner in the pillar. When development is constrained by the car tramming between the face and the boot end, one can expect to see a degradation of the reported development rate the longest the distance between the face and the boot. Figure 6.6 does not seem to indicate that this is the case for Mine 1. No significant degradation in the development rate of metres cut per run hour seems to be detectable. This can be explained by the fact that Mine 1 uses a bolter-miner for development which allows cutting and bolting to happen concurrently. Formatted: Font: Not Bold Formatted: Justified Deleted: Figure 6.6 Formatted: Font: Not Bold, Check spelling and grammar Formatted: Font: Not Bold Formatted: Font: Not Bold, Check spelling and grammar Deleted: Figure 6.6 Page 33
37 Case Studies Figure 6.6 Typical Development Rates Against Position in the Pillar at Mine Advance Rate (m/run time hr) Rate (m/run time hr) Rate (m/run time hr) Metres Cut Advance Rate (m/run time hr) Metres Cut 6.3 Case Study Mine Overview The data available for Mine 2 referred to development operations between May and September Gate road development operations were based on a two heading configuration using two miner-bolters supported by one shuttle car each. Pillars were 125 metres long and 45 metres wide, centre to centre. Roof and rib conditions required a bolting density of 6 roof bolts and 3 rib bolts on each rib with an average time to complete support operations of 22 minutes. Historical performance indicate an average Operating Time of 57% of total calendar time and an average Run Time of 40% of total calendar time (definitions are summarised in Table 3.2) with an average development rate of 1.8 metres per run hour for each miner. The average time to complete a pillar, which includes the time to complete a sequence move, was 9 days. Page 34
38 Case Studies Roadway Development Data and Cycle Times Table 6.5 summarises the process parameters data and cycle times collected for Mine 2. Most of the data described in Table 6.5 as easily obtainable, such as the pillar layout data, the continuous miner specifications and car characteristics. However, other data was more difficult to find as it is not routinely recorded. Examples include the time required to complete support operations and the car maximum achieved wheeling speed. In these cases, further discussion with mine personnel provided indicative estimates of cycle times and parameter values. Mine 2 operated on a shift schedule consisting of three shifts per day Monday to Friday. Day and night shifts had duration of 10 hours, whilst the afternoon shift had a duration of 8.5 hours. Two 12 hour shifts were scheduled for Saturdays and Sundays. A total of 17 hours of planned maintenance was scheduled per week. The sequence followed by the two miners in the pillar is depicted in Figure 6.7. The boot end is positioned in Heading A. Miner 1 operates in Heading A, while Miner 2 operates in Heading B. At the beginning of the sequence, Miner 1 is positioned in Heading A, 20 m from the cut-through. The miner then cuts along Heading A to the 125 m mark where it initiates the cut-through breakaway. Miner 1 cuts along the cutthrough, holing into Heading B. It then flits back to the cut-through entry point and cuts along Heading A for another 20 m inbye. Miner 2 starts 20 metres from the cutthrough in Heading B. Miner 2 cuts along Heading B until it reaches the 145 m mark Deleted: Figure 6.7 During a normal cutting cycle each miner advanced, on average, 1.2 m. Two shuttle cars were usually loaded in each cutting cycle requiring, on average, around 2.5 minutes to complete each load. The average distance travelled by the car in Heading A was 129 m, requiring on average 1.7 minutes for tramming. The average distance travelled by the car in Heading B was 157 m, requiring on average 2 minutes for tramming. In both cases the average wheeling speed was 78 m/min. Page 35
39 Case Studies Table Process Parameters and Cycle Time Data for Mine 2 Units Value Pillar Layout and coal density Pillar length m 125 Cut-through length m 45 Cut-through to Boot End m 30 Heading width m 5 Mining height m 3 Coal density t/m3 1.4 Continuous Miner Type n/a Miner-Bolter Metres advanced in each cutting cycle m 1.2 Shuttle Car Car capacity t 13 Max car loading rate t/h 300 Max car discharge rate t/h 750 Max wheeling speed m/min 80 Number of cars loaded in each cutting cycle # 2 Support Operations Total bolting time min 22 Boot End Bunker capacity t 0 Out-bye conveyor rate t/h 750 Face Operations Install vent tubes every m 2.4 Install vent tubes duration min 2 Stone dusting every (distance) m 30 Stone dusting every (time) h 24 Stone dusting duration min 30 Supply CM every m 30 Supply CM duration min 30 Panel advance Average time to complete panel advance h 22 Page 36

40 Case Studies Figure Sequence Followed by Two Miners in the Pillar for Mine Historical Delay Data Historical delay data for Mine 2 were made available covering a total period of approximately 7 months. As with Mine 1, information included the starting time of the delay, the duration, the shift in which the event occurred and the delay categories associated with the event. Similar to the analysis carried out for Mine 1, it was first necessary to match the reported delay categories with those defined in RoadSIM (listed in Table 3.1). A direct association of the delay categories was not always possible, so some level of discretion was required to select the most appropriate category out of those listed in Table 3.1. Once the delay data was organised in the relevant categories, it was analysed to detect and remove any outliers. Reviewing the data, it was decided to focus the analysis on a sub-period of approximately 3 months. This is the period for which historical information on achieved development rates and the number of metres cut per shift was available. Page 37
41 Case Studies Table Historical Delays for Mine 2 Delay Category Total Duration (% of Operating Time) Delay Duration (min) Min Avg Max Mean Time Between Events (hours) Mine Process Planned 13.8% Mine Process Unplanned 2.3% Outbye Services Unplanned 6.7% Panel Engineering Unplanned 8.5% Panel Process Unplanned 7.1% Formatted: Font: Not Bold Table 6.6 summarises the information extracted from the delay data. It shows the average, min and max duration of the delay for each category, as well as the mean time between events. The proportion of operating time each miner was delayed on each delay category is also shown. Figure 6.8 shows a histogram chart of the delay duration for the Mine Process Planned delay category. This type of chart is useful to estimate a probability density distribution for the delay duration. The probability density distribution is then used in the model to replicate a similar pattern of delay durations. Figure Histogram of Delay Duration for Mine Process Planned Delay Category Deleted: Formatted: Font: Not Bold Formatted: Font: Not Bold, Check spelling and grammar Deleted: Table 6.6 Formatted: Justified Formatted: Font: Not Bold Deleted: Frequency (%) Mine Process Planned Delays Delay Duration (minutes) Historical Roadway Development Performance Historical development performance data were used to validate the results obtained using RoadSIM. It is usually the case that, initially, there will be some discrepancies between historical performance and the results reported. In such cases, adequate calibration of the model can better align the simulation results with historical performance. For Mine 2, data were made available indicating the average number of days it took to complete a pillar, from first coal to first coal, during the period of time for which delay data was analysed. Page 38
42 Case Studies In addition, data were made available indicating the number of metres cut in each production shift. The data are summarised in the histogram chart of number of metres cut per shift shown in Figure 6.9 Figure 6.9 Historical roadway development performance indicators at Mine 2 during the period of time analysed are summarised in Table 6.7. Table 6.7- Historical Performance Indicators for Mine 2 Formatted: Font: Not Bold Formatted: Font: Not Bold, Check spelling and grammar Deleted: Figure 6.9 Formatted: Justified Deleted: Page 39
43 Case Studies Figure Histogram of Metres Cut Per Shift for Mine Simulation Results The model was setup to simulate a total of 20 pillars. This was so that the resulting confidence interval on the reported average pillar cycle time was reduced to an acceptable level. Table 6.8 presents a comparison between historical performance for Mine 2 and the results obtained using RoadSIM. Circled in red are the key performance indicators, including the average pillar cycle time and the development rate (in metres per operating hour and metres per run hour). It can be seen that the simulation results match closely the historical performance. Observe that the predicted average pillar cycle time is 8.9 days with a confidence interval of ±0.3 days which is equivalent to the statement that: in 95% of cases the average pillar cycle time can have a value between 8.6 and 9.2 days. In addition, Table 6.8 highlights the similarity between the historical percentage of operating time spent on each delay category and the percentage of delay reported by RoadSIM. Deleted: Table 6.8 Deleted: Table 6.8 Page 40
44 Case Studies Table Comparison Between Historical Performance and Simulation Results for Mine 2 RoadSIM Simulation Model KPI Report Data from Mine 2 RoadSIM Ouput CONFIGURATION Pillar Length (m) Cut Through Length (m) Boot to Cut Through Length (m) Miners Operating 2 2 Shuttle Cars Operating 2 2 MODEL OUTPUT Development Rate (days/1000m) Pillar Cycle Time First Coal - First Coal (days) Confidence Interval (days +/-) Pillar Advance (days) Exposure Rates m/operating hour m/running hour Miner Utilisation (% of Simulation Time) Scheduled Production Time Available Operating Time Reported Run Time Net Run Time Delay Categories (% of Operating Time) Mine Process Planned Mine Process Unplanned Outbye Services Unplanned Panel Engineering Unplanned Panel Process Unplanned Unrecorded Delay Miner Waiting Time (minutes/operating hour) Miner Waiting on Shuttle Car Miner Waiting on Support Operations Shuttle Car Waiting Time (minutes/operating hour) Car Waiting on Miner Car Waiting to Discharge -- 1 Boot End Waiting Time (minutes/operating hour) Feeder Waiting on Coal Feeder Blocked by Outbye Services -- 4 Page 41
45 Case Studies Figure 6.10 shows a chart of the miner utilisation in Mine 2 taken as the average between Miner 1 and Miner 2, this is a graphical representation of the percentages reported in Table 6.8. It can be seen that scheduled production time accounts for 74.8% of the total time simulated, whilst operating time accounts for 64.2% of the time. The percentage of time both miners are actually performing any development work accounts to 36.5%. Deleted: Figure 6.10 Formatted: Caption Formatted: Font: Not Bold Formatted: Font: Not Bold, Check spelling and grammar Formatted: Font: Not Bold Formatted: Font: Not Bold, Check spelling and grammar Deleted: Table 6.8 Formatted: Font: Not Bold Page 42
46 Case Studies Figure 6.11 Figure Average Miner Utilisation in Mine 2 Deleted: Figure 6.11 compares the histograms of the historical metres cut per shift and the metres cut per shift reported using RoadSIM. It can be observed that the overall range of metres cut per shift is similar in both charts. Individual percentages reported for each bin in the histogram (bottom chart) are somewhat comparable to the historical data (top chart), however, the alignment between the two charts is not as close as it may have been expected. This seems to indicate that even though RoadSIM has been able to replicate the overall historical performance at Mine 2 (see Table 6.8) the performance at a more detailed shift level is not as precise. Deleted: Table 6.8 Page 43
47 Case Studies Figure Comparison Between Historical Metres Cut Per Shift and Simulation Results 16.0 Histogram of metres cut per shift (Model) Frequency (%) Frequency % metres Figure 6.12 shows two examples of how the development rate of metres per run hour varies against the position of the miner in the pillar. The two charts show the results for the miner operating in Heading A, from two different pillars simulated with the model. The horizontal axis indicates the total number of metres cut in the pillar. Based on the sequence followed by Miner 2 (see Section 6.7) the number of metres cut represents a certain position of the miner in the pillar. When development is constrained by the car tramming between the face and the boot end, one can expect to see a degradation of the reported development rate the longer the distance between the face and the boot. Figure 6.12 Deleted: Figure 6.12 Deleted: Page 44
48 Case Studies It seems that this is indeed the case at Mine 2. This can be explained with the fact that Mine 2 uses miner-bolters for development which do not allow cutting and bolting to happen concurrently. Thus car tramming time has a direct impact on the duration of the cutting cycle and therefore on the achieved development rate. Figure 6.12 Typical Development Rates for Miner 2 Against Position in the Pillar 3.00 Advance Rate (m/run time hr) 2.50 Rate (m/run time hr) Metres Cut Page 45
49 7.0 DATA RELATED ISSUES The effort required to provide suitable data for running RoadSIM will vary significantly from operation to operation. The level of detail required and the precision needed of data will also depend on the intended use of the RoadSIM results. Typically data will be required to define: equipment performance; availability; delay profiles; and development rates achieved. Without onboard data logging it can be difficult to assess cycle time for equipment, other than by direct measurement or by using best estimate values obtained from experienced operators. However, if the assumptions are too far out this should be picked up during model validation. If any doubt still exists as to the reliability of particular data items then a sensitivity analysis can be conducted using the model to determine how significant that data item is too estimates of overall performance. Determining overall historical system availability should not prove too time consuming, care, however, needs to be taken with definitions of terms such as available time or operating time as they can vary from mine to mine. Determining downtime profiles for various types of delays can be time consuming. The lack of standardisation in terms of delay categories has made it difficult for the RoadSIM system to obtain data directly from all mine downtime report or logs. In the case study mines varying degrees of effort were required to suitably categorise downtimes into the RoadSIM categories before they can be entered into the model setup. The development rates achieved are required for model validation, rather than configuration or analysis of options. These data in general are reasonably accessible. Even when not directly available they can usually be determined by correlating metres advanced from survey reports with recorded operating hours per shift. Subsequent work has indicated that useful results can still be obtained from RoadSIM even without detailed downtime data. If unplanned downtime is omitted from the model setup the modelling can still be used estimate (though not quite as accurately) the advance rate per hour of runtime. Assuming overall system availability is known metres/run hour can then be scaled up to allow estimates of say days to advance 1000 m(linear). This approach requires less time/effort to set up the model and may be useful for broad brush reviews. Page 46
50 8.0 TECHNOLOGY TRANSFER During the course of the project a number of activities were undertaken to introduce the concepts and technology to industry. Some of the activities were funded by ACARP others were undertaken separately. The principal activities undertaken to allow technology transfer throughout the project included: Delivery of a paper at the 2009 Coal Conference in Wollongong Attendance and short presentations at general ACARP workshops in: o Pokolbin; o Penrith; and o Mackay; Conducting full day RoadSIM workshops in: o Wollongong; and o Mackay; Delivery of a paper at the APCOM 2009 Conference in Vancouver, Canada; Setting up demonstration systems at the case study mine sites. Page 47


51 APPENDIX A Sample Downtime Recording Typical Categorisation Of Delays Page 48
52 Downtime Summary for Case Study Mine 1 Delay Duration (min) Mean Time Total Duration (% of Delay Category Between Events Operating Time) Min Avg Max (hours) Mine Process Planned 0.5% Mine Process Unplanned 0.2% Outbye Services Unplanned (short delay) 9.0% Outbye Services Unplanned (long delay) 16.7% Panel Engineering Unplanned 6.3% Panel Process Unplanned 5.0% Page 49

53 Delay Duration Analysis for Case Study Mine 1 Page 50
54 Page 51
55 Downtime Summary for Case Study Mine 2 Delay Category Total Duration (% of Operating Time) Delay Duration (min) Min Avg Max Mean Time Between Events (hours) Mine Process Planned 13.8% Mine Process Unplanned 2.3% Outbye Services Unplanned 6.7% Panel Engineering Unplanned 8.5% Panel Process Unplanned 7.1% Page 52
56 Delay Duration Analysis for Case Study Mine 2 Page 53
57 Page 54


58 APPENDIX B Sample RoadSIM Excel Interface Figure B.1 - Sample Case Run Parameters and Pillar Layout Figure B.2 - Sample Miner Parameters Page 55


59 Figure B.3 Sample Delay Parameters Figure B.4 - Sample Simulation KPI Results Page 56
A Simulation Model for Roadway Development to Support Longwall Mining
 University of Wollongong Research Online Coal Operators' Conference Faculty of Engineering and Information Sciences 2009 A Simulation Model for Roadway Development to Support Longwall Mining G. Gray Simulation
underground coal mine delay data analysis system
 University of Wollongong Research Online Faculty of Engineering and Information Sciences - Papers: Part A Faculty of Engineering and Information Sciences 2012 underground coal mine delay data analysis
Identification Selection Definition Execution. Schedule.
 SCHEDULE DEVELOPMENT Schedule development is the identification, definition and sequencing of activities that are required to be performed for successful completion of the project scope. Identification
Uptime Maintenance and Support Services - Appendix. Dimension Data Australia Pty Limited. Uptime Support Services Agreement
 Uptime Support Services Agreement Uptime Maintenance and Support Services - Appendix Dimension Data Australia Pty Limited 27 May 2013 Version 1-01 Appendix A. 1. Definitions and Interpretations 1.1 For
Managing the geotechnical aspects of longwall face recovery
 University of Wollongong Research Online Coal Operators' Conference Faculty of Engineering and Information Sciences 2010 Managing the geotechnical aspects of longwall face recovery David Hill Strata Engineering
3. MINING SYSTEM AND RESOURCE RECOVERY
 3. MINING SYSTEM AND RESOURCE RECOVERY (SMP Guideline Section 6.1) 3.1. MINING METHOD Longwalls 705 to 710 will be extracted using a longwall retreating system of mining, an established method of coal
Bolting Platform for installing roof support above an operational conveyor system.
 Description: Bolting Platform for installing roof support above an operational conveyor system. Organization: Glencore Oaky North Mine The Problem Strata conditions over the main trunk conveyor system
Decision Support for Storage and Shipping Using Discrete Event Simulation Part 2. Javier Vazquez-Esparragoza and Jason Chen.
 Decision Support for Storage and Shipping Using Discrete Event Simulation Part 2 By Javier Vazquez-Esparragoza and Jason Chen KBR Technology Houston, TX USA 1 SUMMARY Over the past two decades, KBR has
IMPLEMENTATION, EVALUATION & MAINTENANCE OF MIS:
 IMPLEMENTATION, EVALUATION & MAINTENANCE OF MIS: The design of a management information system may seem to management to be an expensive project, the cost of getting the MIS on line satisfactorily may
Review: Simple schedule risk modelling with Safran Risk
 Creating value from uncertainty Broadleaf Capital International Pty Ltd ABN 24 054 021 117 www.broadleaf.com.au Review: Simple schedule risk modelling with Safran Risk With a view to exploring alternative
Simulation Software. Chapter 3. Based on the slides provided with the textbook. Jiang Li, Ph.D. Department of Computer Science
 Simulation Software Chapter 3 Based on the slides provided with the textbook 3.1 Introduction Many features common to most simulation programs Special-purpose simulation packages incorporate these common
Discrete Event simulation
 Discrete Event simulation David James Raistrick Shrink Wrap Conveyor Line Submitted in partial fulfilment of the requirements of Leeds Metropolitan University for the Degree of Advanced Engineering Management
Assessing Extensions of Time Tony Farrow Trett Consulting March 2006
 Assessing Extensions of Time Tony Farrow Trett Consulting March 2006 Contracts require the Works to be completed by a set date, subject to the Contractor s entitlement of extensions of time under the Conditions
Entry Development Product Overview
 Entry Development Product Overview Systems approach Leveraging the approach taken in longwall systems, Joy Global works with clients to tailor complete development systems to meet the goals of high levels
Activities supporting the assessment of this award [3]
![Activities supporting the assessment of this award [3]](/thumbs/96/128485615.jpg "Activities supporting the assessment of this award [3]") Relevant LINKS BACK TO ITQ UNITS [1] Handbook home page [2] Overview This is the ability to use a software application designed to record data in rows and columns, perform calculations with numerical data
Relevant LINKS BACK TO ITQ UNITS [1] Handbook home page [2] Overview This is the ability to use a software application designed to record data in rows and columns, perform calculations with numerical data
Quality assurance programs for management excellence. Are they relevant to the coal industry?
 University of Wollongong Research Online Coal Operators' Conference Faculty of Engineering and Information Sciences 2012 Quality assurance programs for management excellence. Are they relevant to the coal
RESOLVE Case Study: Stochastic Scenarios in Field Planning
 Page 1 I NTRODUCTION Production from oil or gas fields is associated with various events and associated field activities that are performed throughout field life. These are performed usually with the aim
Introduction to Longwall Mining and Subsidence
 Introduction to Longwall Mining and Subsidence Prepared by Mine Subsidence Engineering Consultants Level 1 / 228 Victoria Avenue Chatswood NSW 2067 PO Box 3047 Willoughby North NSW 2068 Tel. (02) 9413
White Paper. Transforming Contact Centres using Simulation-based Scenario Modelling
 White Paper Transforming Contact Centres using Simulation-based Scenario Modelling Meet Your KPI s, Deliver Consistently High Service and Reduce Customer Churn to Increase Your Bottom Line Results PM@SIMUL8.com
The Use of Simulation for Bulk Cargo Terminal Planning and Design
 The Use of Simulation for Bulk Cargo Terminal Planning and Design What is Simulation Simulation is the imitation of real system Based on knowledge and assumptions of system To obtain insights in the behavior
profitable productive professional
 profitable productive professional Estimating is core at the of all business processes. Benchmark Estimating Software is award winning software that will transform the way your business wins business.
Discrete Event Simulation: A comparative study using Empirical Modelling as a new approach.
 Discrete Event Simulation: A comparative study using Empirical Modelling as a new approach. 0301941 Abstract This study introduces Empirical Modelling as a new approach to create Discrete Event Simulations
Understanding and Managing Uncertainty in Schedules
 Understanding and Managing Uncertainty in Schedules Realistic Plans for Project Success Presented by: John Owen MPUG Project Integration Month July 20 th, 2016 John Owen 2 1981-1985 Worley Engineering
Simulation Using. ProModel. Dr. Charles Harrell. Professor, Brigham Young University, Provo, Utah. Dr. Biman K. Ghosh, Project Leader
 T H R D E D T 0 N Simulation Using ProModel Dr. Charles Harrell Professor, Brigham Young University, Provo, Utah Director, PROMODEL Corporation, Oram, Utah Dr. Biman K. Ghosh, Project Leader Professor,
Production Line Simulation
 Production Line Simulation A A Valuable Tool for Improvement Presented by: John Moore, VP of Operations Roeslein & Associates, Inc. Roeslein Background Consulting Unitizing Engineering Pre-Assembly Project
AutoTest 4 Automatic Tablet Testing System
 AutoTest 4 Automatic Tablet Testing System Precise measuring of weight, thickness, diameter, hardness Reliable orientation of all tablet shapes Fast and intuitive operation Ideal for professional QC and
AutoTest 4 Automatic Tablet Testing System
 AutoTest 4 Automatic Tablet Testing System Precise measuring of weight, thickness, diameter, hardness Reliable orientation of all tablet shapes Robust design for demanding IPC environments For stand-alone
Making Better haulage decisions through Discrete Event Simulation
 Making Better haulage decisions through Discrete Event Simulation Mine haulage is often the one of the highest cost components of the mining process. In the current climate, pressure is on mining companies
Determining the Effectiveness of Specialized Bank Tellers
 Proceedings of the 2009 Industrial Engineering Research Conference I. Dhillon, D. Hamilton, and B. Rumao, eds. Determining the Effectiveness of Specialized Bank Tellers Inder S. Dhillon, David C. Hamilton,
SIMULATION - A KEY TOOL TO ACCELERATE AND ADD CONFIDENCE TO POSTAL NETWORK CONFIGURATION. Niels Erik Larsen
 Proceedings of the 2003 Winter Simulation Conference S. Chick, P. J. Sánchez, D. Ferrin, and D. J. Morrice, eds. SIMULATION - A KEY TOOL TO ACCELERATE AND ADD CONFIDENCE TO POSTAL NETWORK CONFIGURATION
Automated Black Box Testing Using High Level Abstraction SUMMARY 1 INTRODUCTION. 1.1 Background
 Automated Black Box Testing Using High Level Abstraction Dake Song, MIRSE, USA Dr Uli Dobler, FIRSE, Germany Zach Song, EIT, Canada SUMMARY One of the big bottlenecks of modern signalling projects lies
Value driver modelling with Archimedes FACX for optimising mining company operations. Ilya Golubinskiy, PwC Russia 9 February 2011
 Value driver modelling with Archimedes FACX for optimising mining company operations Ilya Golubinskiy, Russia 9 February 2011 Value driver modelling can help a mining company s management to address a
Time Management PLANNING
 Time Management 6.1 Plan Schedule Management: The process of establishing policies, procedures and documentation for planning, developing, managing, executing and controlling the project schedule # Schedule
The economics of extended pre-strip stripping
 University of Wollongong Research Online Coal Operators' Conference Faculty of Engineering and Information Sciences 2013 The economics of extended pre-strip stripping Retief Nel Mehmet S. Kizil University
Software Engineering
 Software Engineering Project Management 1 Objectives To explain the main tasks undertaken by project managers To introduce software project management and to describe its distinctive characteristics To
Improve Process Performance by Validating Systems and Preparing Operations
 Improve Process Performance by Validating Systems and Preparing Operations Maximize efficiency and safety with Digital Twin technology Mimic Simulation Software. Achieving production goals in the face
Cut and fill productivity. Operating procedures. Introduction. 1. Approach of the model
 Model: Level: Cut and fill productivity Micro Operating procedures Introduction The goal of the model is to calculate realistic productivity from data collected on site and to estimate the effect when
SIMULATION APPROACH TO OPTIMISE STOCKYARD LAYOUT: A CASE STUDY IN PRECAST CONCRETE PRODUCTS INDUSTRY
 SIMULATION APPROACH TO OPTIMISE STOCKYARD LAYOUT: A CASE STUDY IN PRECAST CONCRETE PRODUCTS INDUSTRY Ramesh Marasini, Nashwan Dawood School of Science and Technology, Univerisity of Teesside, Middlesbrough
SDD: Total Productive Maintenance REV1: 2014 January 31. Page 1 of 21. Step 1
 Page 1 of 21 Page 2 of 21 Contents 1. Introduction... 3 2. Planned maintenance benefits... 4 3. Planned maintenance responsibilities... 5 3.1 The role of the production department... 6 3.2 The role of
THE IMPORTANCE OF PLANNING DURING PROJECT EXECUTION
 THE IMPORTANCE OF PLANNING DURING PROJECT EXECUTION Dr. Dan Patterson, PMP Chief Design Officer, PLANNING & SCHEDULING Introduction Twenty-five years ago, I was taught that project management was built
Application of Benefit-Cost-Risk Formula and Key Change Indicators to Meet Project Objectives
 Application of Benefit-Cost-Risk Formula and Key Change Indicators to Meet Project Objectives Pejman Khojasteh Risk Consultancy Limited 17 Millwell Crescent, Chigwell, Essex, IG7 5HX pejman_khojasteh@riskconsultancy.co.uk
Cintra iq Implementation Methodology (C.I.M) Document for public distribution
 Document for public distribution") Cintra iq Implementation Methodology (C.I.M) Document for public distribution Table of Contents Document history... 3 Background... 4 Stages... 4 Project Initiation... 5 Pre Implementation & Requirements
Cintra iq Implementation Methodology (C.I.M) Document for public distribution Table of Contents Document history... 3 Background... 4 Stages... 4 Project Initiation... 5 Pre Implementation & Requirements
User Guidance Manual. Last updated in December 2011 for use with ADePT Design Manager version Adept Management Ltd. All rights reserved
 User Guidance Manual Last updated in December 2011 for use with ADePT Design Manager version 1.3 2011 Adept Management Ltd. All rights reserved CHAPTER 1: INTRODUCTION... 1 1.1 Welcome to ADePT... 1 1.2
Coal mine goaf gas predictor (CMGGP)
") University of Wollongong Research Online Coal Operators' Conference Faculty of Engineering and Information Sciences 2010 Coal mine goaf gas predictor (CMGGP) Les Lunarzewski Lunagas Pty Ltd Publication
University of Wollongong Research Online Coal Operators' Conference Faculty of Engineering and Information Sciences 2010 Coal mine goaf gas predictor (CMGGP) Les Lunarzewski Lunagas Pty Ltd Publication
Application of computer simulation to rail capacity planning. W.M. Barter Comreco Rail Ltd., York, England - www:comreco-rail.co.
 Application of computer simulation to rail capacity planning W.M. Barter Comreco Rail Ltd., York, England - www:comreco-rail.co.uk Abstract Developing arrangements for "open access" to rail networks, together
Stone Dust Barrier. Contact details Pierre Vassard Cell Fax Web page:
 Stone Dust Barrier Contact details Pierre Vassard Cell. +27 83 629 7677 Fax. +27 13 932-2214 E-mail. pvassard@mweb.co.za Web page: www.dubaco.co.za 1 Index Page 1. Introduction........ 3 2. Concentrated
UPGRADE OF SHAFT CONVEYOR USING HIGH SPEED TRIPPER DRIVE TECHNOLOGY (CASE STUDY MATLA COAL NO. 2 MINE, SHAFT CONVEYOR) Alan Exton
 Alan Exton") UPGRADE OF SHAFT CONVEYOR USING HIGH SPEED TRIPPER DRIVE TECHNOLOGY (CASE STUDY MATLA COAL NO. 2 MINE, SHAFT CONVEYOR) Alan Exton INTRODUCTION The continuous requirement to upgrade existing conveyor infrastructure
UPGRADE OF SHAFT CONVEYOR USING HIGH SPEED TRIPPER DRIVE TECHNOLOGY (CASE STUDY MATLA COAL NO. 2 MINE, SHAFT CONVEYOR) Alan Exton INTRODUCTION The continuous requirement to upgrade existing conveyor infrastructure
IEC Is it pain or gain?
 IEC 61508 Is it pain or gain? Clive Timms, Director, C&C Technical Support Services Ltd. Introduction IEC 61508 (Ref. 1) provides designers and operators with the first generic internationally accepted
ENGINEERS AUSTRALIA ACCREDITATION BOARD ACCREDITATION MANAGEMENT SYSTEM EDUCATION PROGRAMS AT THE LEVEL OF PROFESSIONAL ENGINEER
 ENGINEERS AUSTRALIA ACCREDITATION BOARD ACCREDITATION MANAGEMENT SYSTEM EDUCATION PROGRAMS AT THE LEVEL OF PROFESSIONAL ENGINEER Document No. Title P05PE Australian Engineering Stage 1 Competency Standards
THE IMPORTANCE OF PLANNING DURING PROJECT EXECUTION
 THE IMPORTANCE OF PLANNING DURING PROJECT EXECUTION A BASIS White Paper by Dr. Dan Patterson, PMP Introduction Twenty-five years ago, I was taught that project management was built upon the premise of
Project Time Management
 Project Time Management Project Time Management Project Time Management includes the processes required to manage timely completion of the project. Plan schedule management The process of establishing
Strata Monitoring Data Management and Application
 Strata Monitoring Data Management and Application Presentation Outline 1. Overview Strata Monitoring 2. Data Management Processes and Current Challenges 3. Possible Solutions 4. Application of SMA Strata
Bagged stonedust barriers
 Bagged stonedust barriers X Contents Bagged stonedust barriers 2 Specification for a bagged stonedust barrier to the extension of flame 2 Types of barrier 4 Specification for a conventional stone dust
Using Application Response to Monitor Microsoft Outlook
 Using Application Response to Monitor Microsoft Outlook Microsoft Outlook is one of the primary e-mail applications in use today. If your business depends on reliable and prompt e-mail service, you need
The concept of linear scheduling
 2010 The concept of linear scheduling TILOS Linear project GmbH 22.06.2010 THE CONCEPT OF LINEAR SCHEDULING INTRODUCTION Traditional scheduling software for the construction industry is dominated by Primavera,
The EDEM BulkSim Solution:
 The EDEM BulkSim Solution: Maximizing the Reliability and Performance of Conveyor Transfer Equipment A white paper from DEM Solutions Rev. 2.0 CONTENTS INTRODUCTION...2 THE COST OF TRADITIONAL DESIGN METHODS...3
Chapter 3.0. Underground monitoring of roof and support behaviour
 Chapter 3.0 Underground monitoring of roof and support behaviour 3.1 Introduction One of the most important prerequisite in the design of a support system is to understand the roof and support behaviour
ViziRail Description
 ViziRail Description Table of Contents ViziRail Train Scheduling Software... 3 Timetabling and Trains... 4 Train Graphing... 9 Possessions... 14 Speed Restrictions... 16 Train Notices... 17 Train Control
Feeder-Breakers Product Overview
 Feeder-Breakers Product Overview Total control The latest in VFD technology... Various material types and belt Service Leader Zero Harm conveyor capacities require flexibility in the feeder-breaker discharge
A Best Practice for the Implementation of a Pavement Management System For Small and Medium Airports
 A Best Practice for the Implementation of a Pavement Management System For Small and Medium Airports Architectural & Engineering Services Civil Engineering Directorate Airport Engineering ATR-045 Real
Actual vs Forecast. A productivity and cost improvement enabler for exploration drilling rigs.
 Actual vs Forecast A productivity and cost improvement enabler for exploration drilling rigs. Requirement The team at BHP Billiton Mitsubishi Alliance (BMA) realised that in order to efficiently manage
Innovation. Carbon Fibre Vent Tube Project. Xstrata Coal Oaky North
 Innovation Carbon Fibre Vent Tube Project Xstrata Coal Oaky North In Brief Analysis showed that the establishment and maintenance of our ventilation ducting was a major contributor to various injury types
PMBOK Guide Fifth Edition Pre Release Version October 10, 2012
 5.3.1 Define Scope: Inputs PMBOK Guide Fifth Edition 5.3.1.1 Scope Management Plan Described in Section 5.1.3.1.The scope management plan is a component of the project management plan that establishes
The use of the Animate Transfer toolbar and various transportation-related modules will be illustrated in three examples in the sequel.
 316 Modeling Transportation Systems button of the Animate toolbar. A graphical Storage T-bar graphically depicts the entities in a storage facility. The Seize button allows the modeler to define a so-called
BUSINESS PROCESS MODELLING A BUSINESS FRACTAL APPROACH
 BUSINESS PROCESS MODELLING A BUSINESS FRACTAL APPROACH Dr Antonie van Rensburg Department of Industrial and Systems Engineering, University of Pretoria ABSTRACT The role and position of operations management
Project vs Operation. Project Constraints. Pankaj Sharma, Pankaj Sharma,
 Project vs Operation PROJECTS OPERATIONS Temporary Ongoing Unique Repetitive Closes after attaining the objectives Objective is to sustain business Prototyping the new car model Assembly line production
Technical Services. Laerdal Services. Consulting. Education. Support.
 Technical Services Laerdal Services Consulting Education Support www.laerdal.com Index Product Installation...4 Preventive Maintenance...7 Extended Warranty Coverage Plan...11 Laerdal Technical Services
RAILROAD & CO. +Street. Version 9. Manual
 RAILROAD & CO. +Street Version 9 Manual September 2017 RAILROAD & CO. +Street Control of Car Systems Version 9 Manual September 2017 Copyright Freiwald Software 1995-2017 Contact: Freiwald Software Kreuzberg
PMP Exam Preparation Course Project Time Management
 Project Time Management 1 Project Time Management Processes Define Activities Sequence Activities Estimate Activity Resources Estimate Activity duration Develop Schedule Control Schedule In some projects,
TickITplus Implementation Note
 Title Understanding Base Practices Requirement Sizing Date April 2015 Reference TIN015-1504 Originator Dave Wynn Version v1r0 Key Terms Base Practices, Implementation, Requirements, Sizing, Estimating,
Risk Management Update ISO Overview and Implications for Managers
 Contents - ISO 31000 highlights 1 - Changes to key terms and definitions 2 - Aligning key components of the risk management framework 3 - The risk management process 4 - The principles of risk management
Measuring Bulk Solids on a Conveyor
 A comparison of the two main ways to measure mass flow of bulk solids on conveyors. Many industrial operations need to make mass flow measurements of dry bulk solid materials on conveyor belts, and on
A Systematic Approach to Performance Evaluation
 A Systematic Approach to Performance evaluation is the process of determining how well an existing or future computer system meets a set of alternative performance objectives. Arbitrarily selecting performance
AutoTest 4 Automatic Tablet Testing System
 AutoTest 4 Automatic Tablet Testing System Precise measuring of weight, thickness, diameter, hardness Reliable orientation of all tablet shapes Fast and intuitive operation Ideal for professional QC and
Tuesday 24 June 2014 Morning
 Tuesday 24 June 2014 Morning A2 GCE MATHEMATICS (MEI) 4773/01 Decision Mathematics Computation * 3 1 4 5 2 9 4 3 8 0 * Candidates answer on the Answer Booklet. OCR supplied materials: 12 page Answer Booklet
Bearing capacity of a glass fibre reinforced polymer liner
 University of Wollongong Research Online Faculty of Engineering - Papers (Archive) Faculty of Engineering and Information Sciences 2011 Bearing capacity of a glass fibre reinforced polymer liner Jan Anton
Availability target of the railway infrastructure: an analysis
 Availability target of the railway infrastructure: an analysis Ambika P. Patra, MTech, Luleå University of Technology Uday Kumar, PhD, Luleå University of Technology Per-Olof Larsson Kråik, PhD, Swedish
USER MANUAL. A product of:
 USER MANUAL A product of: Haldan MES by: Haldan Consulting 81B Haupt Street Sidwell Port Elizabeth 6061 South Africa Tel: +27 (0) 41 451 3825 Email: info@haldan.co.za Website: www.haldan.co.za Individual
Microsoft Excel or Microsoft Project? Why Microsoft Office Project 2007 is Easier and More Effective for Managing Projects
 Microsoft Excel or Microsoft Project? Why Microsoft Office Project 2007 is Easier and More Effective for Managing Projects Summary: Using the right tool gives project managers a distinct advantage when
2015 HDR, all rights reserved.
 2015 HDR, all rights reserved. How do you Spell Capacity on a Railroad? - A Primer on Railroad Operations Design Kevin Keller, PE HDR Engineering, Inc. 2015 HDR, all rights reserved. Outline Introduction
USER MANUAL. Promotional copy. A product of:
 USER MANUAL Promotional copy A product of: Haldan MES by: Haldan Consulting 81B Haupt Street Sidwell Port Elizabeth 6061 South Africa Tel: +27 (0) 41 451 3825 Email: info@haldan.co.za Website: www.haldanmes.com
SDPS for Windows: An Integrated Approach to Ground Deformation Prediction
 SDPS for Windows: An Integrated Approach to Ground Deformation Prediction D. Newman, Appalachian Mining and Engineering, Inc./Geolab Z. Agioutantis Department of Mineral Resources Engineering, Technical
Perspectives. Selecting your. Workday implementation partner
 Perspectives Selecting your Workday implementation partner Typically, Workday implementation costs are lower as the project duration can be shorter and require fewer resources compared to traditional HR
DELTA MARITIME ASSET MANAGEMENT SYSTEM
 Airport Business Centre Thornbury Road PLYMOUTH PL6 7PP tel: 0203 286 5836 email: info@deltasys.co.uk Last Update 16 th July 2014 DELTA MARITIME ASSET MANAGEMENT SYSTEM This document defines the overall
Underground Coal Solutions
 Underground Coal Solutions INTEGRATED PLANNING TOOLS FOR UNDERGROUND COAL OPERATIONS Strong technical solutions tailored to specialized industry needs Deswik has developed a fresh and innovative range
The Foundation of Sound Technology Investment: The Total Economic Impact Methodology
 2003 Giga Research, a wholly owned subsidiary of Forrester Research, Inc. Copyright and Material Usage Guidelines September 26, 2003 The Foundation of Sound Technology Investment: The Total Economic Impact
Asta Powerproject Enterprise POWERFUL PROJECT, PORTFOLIO AND RESOURCE MANAGEMENT SOFTWARE. elecosoft.com
 Asta Powerproject Enterprise POWERFUL PROJECT, PORTFOLIO AND RESOURCE SOFTWARE WHY INVEST IN A PROJECT, PORTFOLIO AND RESOURCE SOLUTION? Project management is now recognised as a strategic business tool
Tassc:Estimator technical briefing
 Tassc:Estimator technical briefing Gillian Adens Tassc Limited www.tassc-solutions.com First Published: November 2002 Last Updated: April 2004 Tassc:Estimator arrives ready loaded with metric data to assist
A TUTORIAL ON ERGONOMIC AND PROCESS MODELING USING QUEST AND IGRIP. Deidra L. Donald
 Proceedings of the 1998 Winter Simulation Conference D.J. Medeiros, E.F. Watson, J.S. Carson and M.S. Manivannan, eds. A TUTORIAL ON ERGONOMIC AND PROCESS MODELING USING QUEST AND IGRIP Deidra L. Donald
Reliability demonstration for complex redundant systems in railway applications
 WIT Press, www.witpress.com, ISBN -853-86- Reliability demonstration for complex redundant systems in railway applications R. Bozzo\ V. Fazio*, P. Firpo^ S. Savio* ' Dipartimento di Ingegneria Elettrica
Chapter 3 Assembly Systems. Screen Titles
 Chapter 3 Assembly Systems Screen Titles System Input / Output Methods of Assembly Manual Assembly Automated Assembly Flexible Assembly Choice of Assembly Assembly Economics Assembly Line Components Assembly
FaciliWorks. Desktop CMMS Software. Making Maintenance Manageable
 FaciliWorks Desktop CMMS Software Making Maintenance Manageable Why Your Facility Needs CMMS Software Improve productivity Control operations and maintenance costs Maximize asset uptime Prevent mistakes
Environmental Aspects of Mine Planning
 University of Wollongong Research Online Coal Operators' Conference Faculty of Engineering and Information Sciences 2004 Environmental Aspects of Mine Planning W. Tyrrell BHP Billiton - Illawarra Coal
Instructions_for_use_of_RPM_Conservation_P03_ docx
 Instructions_for_use_of_RPM_Conservation_P03_120924.docx Monday, September 24, 2012 Michael Schilmoeller There is strong interest in the Council's conservation targets among the regional stakeholders.
Test your Understanding-The Answers
 Table of Contents Module 1 Project management methodology... 2 A. Introduction to Project Management... 2 B. The Phases of Project Management... 2 C. Project Management Methodology questions... 2 Module
Decision Support Tools Overview
 Decision Support Tools Overview This document presents a brief overview of Decision Support Tools as an introduction. 23/03/2015 1 SEAMS Copyright The contents of this document are subject to copyright
Alec Kimber Australian Nuclear Science & Technology Organisation
 Decommissioning and Dismantling of the Moata Reactor Alec Kimber Australian Nuclear Science & Technology Organisation A History of Moata Constructed at ANSTO in 1961 ARGONAUT type reactor Built as a 10
Let s not forget that the largest fire and explosion in Europe since 1945 at Buncefield was partly caused by an error in testing that happened months
 1 Of course, human factors applies to everything we do, in and out of work. In work, we should consider all elements of the organisation, work group and task, operations, maintenance, planning, management
What does the Cloud CFO solution provide?
 What does the Cloud CFO solution provide? For group finance facing the chore of a slow manual consolidation process using spreadsheets, Cloud CFO offers a novel and powerful solution that will: Accelerate
Scheduling Work at IPSC
 Scheduling Work at IPSC Overview The purpose of this document is to describe and lay out the specific steps for how Work Orders will be scheduled in Maximo at IPSC. In general, Work Orders will be planned