DENVER REGIONAL COUNCIL OF GOVERNMENTS 1290 BROADWAY, SUITE 100 DENVER, CO
|
|
|
- Donald Lewis
- 6 years ago
- Views:
Transcription
1
2 DENVER REGIONAL COUNCIL OF GOVERNMENTS 1290 BROADWAY, SUITE 100 DENVER, CO Preparation of this report has been financed in part through grants from the U.S. Department of Transportation, Federal Transit Administration, and Federal Highway Administration ii
3 Table of Contents TABLE OF CONTENTS... III 1. INTRODUCTION... 1 A. What is the Metro Vision Regional Transportation Plan?... 1 B. Relationship to DRCOG s Metro Vision... 3 C. Federal Requirements... 4 D. Public Involvement and Decision-Making Process Cooperative Decision-Making Process TRANSPORTATION CHALLENGES AND PLANNING ASSUMPTIONS... 9 A. Growth Challenges... 9 B. Land Development Challenges C. Social Challenges D. Transportation Challenges E. Environmental Challenges F. Funding Challenges METRO VISION INTEGRATION A CONNECTED MULTIMODAL REGION METRO VISION REGIONAL TRANSPORTATION PLAN SYSTEM COMPONENTS A. Regional Roadway System Roadway System Background Congestion Management Process B. Public Transportation Rapid Transit System Fixed Route Bus and Other Transit Services C. Active Transportation (Bicycle and Pedestrian Travel) D. Transportation Demand Management Transportation Demand Management Background Transportation Demand Management Structure and Providers in the Denver Region Transportation Demand Management Strategies E. Technology Connected Vehicles and Autonomous Vehicles F. Safety Safety Background Federal Safety Emphasis Areas and Targets Safety Improvements iii
4 G. Aviation H. Freight and Goods Movement I. Transportation System Management and Operations Improvements Roadway Operational Improvement Projects System Management and Operations Improvements J. Transportation Security Transportation Security Partners Transportation Security Improvements K. Asset Management and System Preservation Roadway System and Bridge Preservation Transit System Preservation Pedestrian and Bicycle Facility Preservation L. Conclusion FISCALLY CONSTRAINED RTP FINANCIAL PLAN Introduction A. Background B. Financial Plan Preparation Process Revenues System Category Needs/Costs & Allocations Regionally Significant Projects Evaluation & Prioritization C. Summary Fiscally Constrained Revenue and Expenditure Results Needs & Expenditure Allocations FISCALLY CONSTRAINED REGIONAL TRANSPORTATION PLAN A. Freeways, Interchanges, and Roadways B. Freight and Goods Movement C. Rapid Transit D. Fixed-Route Bus and Other Transit Service E. Managed Lanes F. Other Modes, Services and Facilities G. Vision (Unfunded) Projects H Fiscally Constrained RTP System Characteristics I. Amendments to the 2040 FCRTP PERFORMANCE AND OUTCOMES OF THE 2040 FISCALLY CONSTRAINED RTP A. Transportation System Performance Measures Travel and Mobility Performance Measures Facility and Infrastructure Condition Performance Measures iv
5 3. FAST Act Performance Measures and Targets Energy Consumption Performance Measures Metro Vision Performance Measures B. Environmental Justice C. Environmental Mitigation D. Air Quality Conformity E. Conclusion Appendices Appendix 1: Regionally Significant Roadway Capacity Project Selection Process Appendix 2: 2040 Fiscally Constrained Park-n-Ride Lots and Transit Stations Appendix 3: Staging of Fiscally Constrained Roadway Projects (2015, 2025, 2035 and 2040) Appendix 4: Fiscally Constrained Roadway and Rapid Transit Capacity Improvements and Cost Allocations (FY ) Appendix 5: 2040 MVRTP Freight and Goods Movement Component Appendix 6: 2040 MVRTP Coordinated Transit Plan Appendix 7: 2040 MVRTP Active Transportation Component Appendix 8: Consideration of FAST Act Federal Planning Factors Appendix 9: Adopting Resolution List of Acronyms List of Key Agency Websites DRCOG Board and Committee Members v
6 List of Figures Figure 1.1: DRCOG Region... 2 Figure 1.2: DRCOG Committee Structure for Transportation Decision-making... 7 Figure 2.1: DRCOG Region Population, Households, and Employment Figure 2.2: Work Trips Between DRCOG Region and Neighboring Counties Figure 2.3: Location of New Households: Figure 2.4: Location of New Employment: Figure 2.5: Existing Urban Centers and Rural Town Centers Figure 2.6: Weekday Vehicle Miles Traveled (VMT) and VMT per Capita in the DRCOG Region Figure 2.7: Key Congested Locations in 2014 and Figure 2.8: Air Quality Violation or Exceedance Days in the DRCOG Region Figure 4.1: 2040 Regional Roadway System Figure 4.2: DRCOG Congestion Management System Process Figure 4.3: TDM Service Providers Figure 4.4: Airports Serving the Denver Region Figure 5.1: Revenues Available for Use in the Denver Region Figure 5.2: 2040 Unconstrained Costs and Fiscally Constrained Revenues by Expense Category Figure 6.1: 2040 Fiscally Constrained Roadway Network Figure 6.2: Fiscally Constrained Rapid Transit, Park-n-Ride and Station Locations Figure 6.3: 2040 Managed Lanes System Figure 6.4: 2040 FCRTP Fiscally Constrained and Unfunded Roadway Capacity Projects Figure 6.5: 2040 Fiscally Constrained and Unfunded Rapid Transit Projects Figure 7.1: CDOT Highway Performance Report Card Figure 7.2: CDOT Pavement Conditions Figure 7.3: RTD State of Good Repair Scoring Example Figure 7.4: RTD Performance Measure Report Example Figure 7.5: 2040 Fiscally Constrained Regionally Funded Projects and Environmental Justice Areas Figure 7.6: Fiscally Constrained Regionally Funded Projects and Environmental Justice Areas - Central Urban Area Figure 7.7: Regional Open Space and Floodplains Figure 7.8: Threatened and Endangered Species Habitat vi
7 Figure 7.9: Large Mammal Habitat Figure 7.10: Wildfire Risk List of Tables Table 2.1: DRCOG Region Population, Households, and Employment Table 4.1: DRCOG Region Summary Safety Data Table 5.1: 2040 Fiscally Constrained RTP Costs and Revenues Table 5.2: 2040 Fiscally Constrained RTP Revenues (2016 to 2040) Table 5.3: 2040 FCRTP Estimated CDOT Program Distribution Revenue Allocations and Amounts Table 5.4: Metro Vision Transportation System Unconstrained Costs and 2040 Fiscally Constrained RTP Expenditures (2016 to 2040) Table 5.5: 2040 Fiscally Constrained RTP Expenditures (2016 to 2040 in millions of year of expenditure dollars) Table 6.1: 2040 Fiscally Constrained RTP System Characteristics Table 6.2: Amendments to the 2040 Fiscally Constrained RTP Table 7.1: Transportation System Mobility Performance Measures Table 7.2: Safety Performance Measures Table 7.3: Metro Vision Foundational Measures Table 7.4: Minority Means of Transportation to Work Table 7.5: Means of Transportation to Work by Worker Earnings vii
8 viii
9 1. INTRODUCTION The Denver region s quality of life depends greatly on mobility, or the ease of moving people and goods from place to place. Such places should also be accessible by a variety of travel options. Rapid growth in the region poses a challenge to providing adequate mobility. By 2040, an additional 1.1 million residents and almost 700,000 jobs will place much greater demands on the transportation system. The 2040 Metro Vision Regional Transportation Plan (2040 MVRTP) addresses these challenges and guides the development of the Denver region s multimodal transportation system. The 2040 MVRTP includes the components of the transportation system that can be funded through 2040 as well as envisioned and unfunded components. The 2040 MVRTP is closely integrated with DRCOG s Metro Vision. Specifically, the 2040 MVRTP is based on Metro Vision s policy framework, and it includes and implements Metro Vision s transportation element. A. What is the Metro Vision Regional Transportation Plan? DRCOG is the designated metropolitan planning organization for the Denver region. As such, it is federally charged with developing a long-range regional transportation plan. The MVRTP presents the region s vision for a multimodal transportation system needed to respond to future growth and demographic trends. This vision is not constrained by financial limitations. Incorporated within the MVRTP is the 2040 Fiscally Constrained Regional Transportation Plan (2040 FCRTP), which addresses federal requirements for a long-range transportation plan (Chapter 5). Specifically, the 2040 FCRTP defines transportation elements and services to be provided over the next 25 years based on reasonably expected revenues. The revenues will fund construction of many types of projects, as well as maintain and operate the transportation system. The system includes roadway, transit, bicycle, and pedestrian facilities and services. Expected revenues fall far short of fully addressing future transportation needs and desires. However, the 2040 FCRTP does provide for high-priority strategic investments in the Denver region s multimodal transportation system. The fiscally constrained projects and strategies of the MVRTP will be implemented by many agencies across the region. Examples include the Colorado Department of Transportation (CDOT), the Regional Transportation District (RTD), DRCOG, and local governments. DRCOG s short-range Transportation Improvement Programs (TIPs) will identify federally funded projects to be completed over a four-year period. Chapter 1 Introduction 1

10 Regionally significant projects must be identified in a fiscally constrained long-range plan before they can be constructed. Further, the federal Clean Air Act Amendments of 1990 require transportation plans, programs, and projects in air quality non-attainment/maintenance areas to conform to the State Implementation Plan (SIP) for air quality. The MVRTP defines transportation facilities, improvements, and services for the entire DRCOG region. It includes the metropolitan planning area s Transportation Management Area (TMA) and the mountains and plains portions of the DRCOG area, as shown in Figure 1.1 below. Figure 1.1: DRCOG Region 2 Chapter 1 Introduction
11 To address current and future challenges, the MVRTP: Enhances the relationship between transportation and land use development; Provides for maintenance of a well-connected multimodal system; Incorporates transportation management actions to increase the existing system s efficiency; Includes travel demand management efforts to reduce single-occupant vehicle trips; Identifies transit and roadway improvements to increase the system s people and freight movement capacity; Adds bicycle and pedestrian facilities; Prioritizes improvements given limited expected revenues; Encourages coordination between neighboring communities and between agencies, and Supports Metro Vision Plan outcomes and objectives addressing growth and development, transportation, environmental quality, housing, and the economy. DRCOG developed the 2040 MVRTP in cooperation with local governments, CDOT, RTD, the Regional Air Quality Council (RAQC), and the Air Pollution Control Division (APCD) of the Colorado Department of Public Health and Environment (CDPHE). Decisions were made through DRCOG s transportation committee structure and by the DRCOG Board of Directors with significant public and stakeholder input. DRCOG also coordinated with CDOT s 2040 Statewide Transportation Plan, and with RTD s implementation of its FasTracks rapid transit system. B. Relationship to DRCOG s Metro Vision Metro Vision is the region s shared aspirational vision for the future of the DRCOG region. It fulfills DRCOG s duty to develop and adopt a regional plan for the physical development of the region s territory. While advisory, local jurisdictions can choose to adopt it as their official plan. Its six core principles are that Metro Vision: Protects and enhances the region s quality of life; Is aspirational, long-range and regional in focus; Offers ideas for local implementation; Respects local plans; Encourages communities to work together, and Is dynamic and flexible. Metro Vision integrates growth and development, transportation, environmental quality, housing, and the economy into a single comprehensive foundation for regional collaboration and shared decision- Chapter 1 Introduction 3
12 making. Its transportation section describes that the DRCOG region aspires to have a connected multimodal transportation system that provides everyone with viable travel choices. The region will have a multimodal approach to move people and goods, with transportation facilities and services tailored to the needs and desires of individual communities. Over time, a greater share of travel will comprise public transit, bicycling, walking and carpooling. The region s transportation system will adapt quickly to major trends affecting the region, such as significant population growth, a rapidly aging population, new technology, an evolving economy and changing residential and workplace styles. Transportation and land-use planning will be integrated to improve the region s quality of life. Specifically, Metro Vision s transportation element, A Connected Multimodal Region, outlines a strategic planning framework for the transportation system organized around two regional outcomes: The regional transportation system is well-connected and serves all modes of travel. The transportation system is safe, reliable, and well-maintained. Regional and supporting objectives, performance measures and 2040 targets, and strategic initiatives for transportation and other topics (known as themes) help to achieve the regional outcomes. The MVRTP helps implement the transportation theme of Metro Vision. Chapter 3 of the MVRTP contains Metro Vision s transportation theme (A Connected Multimodal Region) and further discusses the relationship between both plans. C. Federal Requirements Developing the 2040 MVRTP spanned two iterations of federal surface transportation legislation: Moving Ahead for Progress in the 21st Century (MAP-21) 2012 Fixing America s Surface Transportation Act (FAST Act) 2015 The MVRTP addresses applicable federal requirements for the region s long range transportation planning contained in these legislations. There are several requirements for which final federal rulemaking guidance has not yet been completed, such as for the FAST Act s performance-based planning requirements. The MVRTP (including the 2040 FCRTP) address key federal requirements, including: Fiscal constraint. Reasonably expected revenues will be available to pay for the project costs identified in the 2040 FCRTP. Project costs do not exceed available revenues. 4 Chapter 1 Introduction
13 Air quality conformity. The MVRTP conforms with all applicable air quality SIPs. Predicted emissions of pollutants from mobile sources through 2040 do not violate established budget limits. Public involvement. The MVRTP planning process includes meaningful and accessible opportunities for public input and engagement. Environmental justice. Regionally funded fiscally constrained projects provide extensive benefits to areas with identified concentrations of low income and/or minority populations. These areas will not face disproportionate negative impacts. Freight and transit. The MVRTP contains a detailed freight and goods movement component and the federally-required Coordinated Public Transit Human Services Transportation Plan. Planning factors. The MVRTP and metropolitan planning process consider projects and strategies that will address the ten planning factors relating to safety, security, economic vitality, and other national priorities, including the two planning factors added by the FAST Act addressing resiliency and reliability of the transportation system, and enhancing travel and tourism. Performance-based planning process. Though the federal rule-making and implementation of the requirements are not yet complete, the MVRTP sets the stage for the region s future performance-based planning process. Planning emphasis areas. The MVRTP addresses the topics identified by FHWA and FTA as planning emphasis areas for the metropolitan planning process, such as the performancebased planning process discussed above, and regional cooperation between DRCOG, RTD, and CDOT, and foundational theme of this MVRTP. Each of these federal requirements is discussed in the appropriate section or appendix of the MVRTP. D. Public Involvement and Decision-Making Process The framework for involving the public in the MVRTP and 2040 FCRTP process is defined by Public Involvement in Regional Transportation Planning, adopted by the DRCOG Board in Public participation was encouraged throughout the development of the MVRTP, the 2040 FCRTP, and the Chapter 1 Introduction 5
14 Metro Vision Plan. DRCOG held numerous workshops, stakeholder meetings, interactive online forums (such as MindMixer), and other public participation events. The public and stakeholders provided input towards developing the MVRTP and 2040 FCRTP through the following example activities: Notification of events and review documents via the DRCOG website; Scenario planning workshop and plans update kickoff (June 2012); DRCOG Listening Tour (Spring 2012); CDOT Telephone Town Hall meetings (May 2014); DRCOG/Denver Regional Mobility and Access Council (DRMAC) Transit Forum (May 2014); Citizens Advisory Committee (13 meetings from April 2013 to December 2014) Metro Vision Planning Advisory Committee (21 meetings from January 2013 to December 2014) CDOT/DRCOG Transit Open House (May 2014); CDOT Statewide Freight Advisory Council (July, September, and November 2015); More than 25 DRCOG Board and committee meetings covered transportation topics, and Public hearings in January and February 2013, July 2013, April 2014, January 2015, January 2016, August 2016, and March Transportation issues and topics were also a focus of numerous activities of DRCOG s Sustainable Communities Initiative, such as corridor working groups and committees, neighborhood focus groups, and others. Events were advertised through the DRCOG website and other publications, news releases to the local media, including minority publications and radio stations, postcards, blasts, and public hearings. Summaries of testimony received at the public hearings are available at DRCOG. 1. Cooperative Decision-Making Process Transportation issues cross the boundaries and responsibilities of individual jurisdictions and organizations. The DRCOG Board of Directors considers public input and advice of numerous committees, including the Regional Transportation Committee (RTC), the Transportation Advisory Committee (TAC), and other specialized committees. The relationships between the various committees is illustrated in Figure 2. The RTC, which includes elected public officials, Colorado Transportation Commissioners, and RTD Board members, reviews regional transportation issues and DRCOG transportation program issues and provides policy recommendations to the DRCOG Board. Figure 1.2 illustrates the committee structure in place as the MVRTP was developed. Each of the partners in the transportation planning process brings a unique perspective. CDOT is responsible for the management, construction and maintenance of state highways, as well as statewide 6 Chapter 1 Introduction
15 multimodal transportation planning efforts. RTD is responsible for the development, maintenance and operation of a public transportation system within its geographic area. RTD also provides service meeting Americans with Disabilities Act (ADA) requirements. DRCOG s local governments bring particular knowledge of their local areas and represent residents of their communities. The Air Pollution Control Division (APCD) and Regional Air Quality Council (RAQC) reflect the air quality interests of the state and the region. DRCOG is responsible for overall regional transportation, growth, and development planning. DRCOG coordinates with the planning efforts of RTD and CDOT, representing the various perspectives of its more than 50 local governments. Figure 1.2: DRCOG Committee Structure for Transportation Decision-making DRCOG Board Voting members are local elected officials. Regional Transportation Committee (RTC) Voting membership is: DRCOG (5): board members, exec. director CDOT (4): commissioners, exec. director RTD (4): board members, general manager Others (3) Transportation Advisory Committee (TAC) Voting membership is staff/representatives of: counties and municipalities CDOT RTD DRCOG Regional Air Quality Council interest groups Work groups Ad hoc committees PUBLIC INPUT Meetings/ workshops Events Surveys Website Interactive participation Comments at meetings Public hearings Chapter 1 Introduction 7
16 8 Chapter 1 Introduction
17 2. TRANSPORTATION CHALLENGES AND PLANNING ASSUMPTIONS This chapter discusses the major long range planning challenges and regional planning assumptions used to develop the MVRTP. There are many challenges to be considered in the regional transportation planning process relating to growth and development, multimodal travel, the environment, funding, and other issues. Challenges are not inherently negative, but are major issues the region is confronting and addressing. A. Growth Challenges Population and economic growth. The population of the Denver region is expected to increase from about 3.1 million in 2015 to 4.3 million by 2040, an increase of 37 percent. The number of jobs is forecast to increase from 1.7 million in 2015 to almost 2.4 million by 2040, an increase of 40 percent. By 2040, people living in, working in, and visiting the region will make almost 19 million total person trips per day. Of these, DRCOG s forecasts suggest about 12.3 million vehicle trips will be made by cars, trucks, and buses traveling more than 117 million miles per weekday. Table 2.1 and Figure 2.1 display past, current, and forecast population, households, and employment for the Denver region. Population and employment growth outside the current DRCOG planning area in Elbert County, El Paso County, Larimer County, and Weld County will also affect the Denver region. Congestion on major interregional highways such as I-25, I-70, US-85, and US-287 will be impacted by the increase in commuter and visitor trips to and from the region. The estimated number of work commuters between neighboring counties and the Denver region in 2010 are shown in Figure 2.2. According to American Community Survey (ACS) data, almost 64,000 workers traveled into the region and about 26,000 residents traveled out of the region to work. Chapter 2 Transportation Challenges and Planning Assumptions 9
18 Table 2.1: DRCOG Region Population, Households, and Employment Population Households Employment Denver TMA Mountains & Plains DRCOG Region Total ,607,400 3,112,800 4,264, ,000 1,258,300 1,797, ,100 1,694,100 2,363,600 14,800 27,100 40,000 6,700 11,000 16,700 5,400 11,900 20,400 1,622,200 3,139,900 4,304, ,700 1,269,300 1,814, ,500 1,706,000 2,384,000 Figure 2.1: DRCOG Region Population, Households, and Employment Millions DRCOG Region Demographic Data 1980, 2015, and Population Households Employment Source: US Census; DRCOG estimates & projections Chapter 2 Transportation Challenges and Planning Assumptions

19 Figure 4. Work Trips between DRCOG Region and Neighboring Counties Figure 2.2: Work Trips Between DRCOG Region and Neighboring Counties Chapter 2 Transportation Challenges and Planning Assumptions 11
20 B. Land Development Challenges Location of growth. DRCOG developed the land use demographic information for the period using the UrbanSim model in consultation with DRCOG s local governments and the State Demography Office. Most of the expected increase in the region s population and employment will occur within defined growth areas. Figures 2.3 and 2.4 conceptually illustrate the relative distribution of new households and employment between 2015 and In addition, some of the new growth will occur in urban centers (Figure 2.5). However, growth will also occur in outlying areas. As the region s urban development expands, some people and businesses will inevitably have to make longer trips, placing greater demands on the transportation system. In some areas, urban centers will absorb a significant amount of growth and offer more convenient accessibility via bus or rail transit and opportunities for shorter nonmotorized trips via walking and bicycling. Less efficient development patterns. Developments with no pedestrian connections or bicycle facilities, and those with separated or disconnected residential and commercial areas, can result in an increased reliance on the automobile. The lack of direct pedestrian or bicycle access between subdivisions and arterial streets, commercial centers, and other community resources (e.g., bus stops) discourages walking and bicycling. Lower development densities. Many residential areas are developing or will develop at lower housing unit densities and cannot be served cost-effectively with conventional public transit. Lower density suburban office parks are also more difficult to serve efficiently with conventional public transit. This has implications for access to jobs and workers, as well as mobility for the growing older adult population. C. Social Challenges Increased travel. Vehicle miles traveled (VMT) increased 4.7 percent annually between 1990 and 2000, but remained flat between 2006 and Starting in 2012, VMT began increasing again, growing each year through In 2015, the region s VMT increased by four percent, the highest annual percentage growth since the late 1990s. VMT will continue to increase through 2040 due to growth in population (37% increase) and employment (40% increase). Past VMT trends and future forecasts are displayed in Figure Chapter 2 Transportation Challenges and Planning Assumptions
21 Figure 2.3: Location of New Households: Chapter 2 Transportation Challenges and Planning Assumptions 13

22 Figure 2.4: Location of New Employment: Chapter 2 Transportation Challenges and Planning Assumptions

23 Figure 2.5: Existing Urban Centers and Rural Town Centers Chapter 2 Transportation Challenges and Planning Assumptions 15
24 Figure 2.6: Weekday Vehicle Miles Traveled (VMT) and VMT per Capita in the DRCOG Region Weekday Vehicle Miles Traveled (VMT) and VMT per Capita in the DRCOG Region Trend and Forecast 140 VMT Per Capita 30.0 Vehicle Miles Traveled (millions) VMT per Capita Source: US Census (historical); DRCOG forecast Jobs/housing balance. In areas that lack a good balance of jobs and housing, there are fewer opportunities to live close to work. It is also less likely that non-motorized modes can be used to travel to work. A good balance of jobs and housing provides more opportunities to live close to work, though that outcome is not assured. People change jobs frequently and housing costs impact where workers can live. Growth of older adult population. The region s older adult population is growing much faster than the general population. Between 2015 and 2040, the number of area residents aged 60 and older is expected to almost double, from approximately 560,000 to 1.1 million. Even more dramatically, the population of those 75 and older is forecast to increase 200 percent by Additionally, many older adults will choose to age in place, creating the need for the region s communities to retrofit existing transportation facilities and expand transportation services to serve the rapidly growing aging population. Finally, according to the most recent ( ) American Community Survey data, the non-institutionalized population of individuals with 16 Chapter 2 Transportation Challenges and Planning Assumptions
25 disabilities is almost 270,000, or almost 10 percent of the region s total population. As the older adult population significantly increases, a similar increase in individuals with disabilities is also anticipated. The Coordinated Transit Plan (Appendix 6) discusses these issues in further detail. D. Transportation Challenges Automobile dominance. As is true nationally, the automobile (including cars, vans, pick-ups, and sport utility vehicles) is the region s dominant form of household transportation. And for most trips, the automobile contains only a single occupant. The American Community Survey (ACS) data showed that about 75 percent of workers traveled alone in their automobiles to work. About seven percent worked at home, and the remaining 18 percent carpooled, walked, bicycled, or took transit. As discussed in Chapters 3 and 7, DRCOG s Metro Vision establishes a performance target for non-sov mode share to work of 35 percent by Mobility options for persons without a car. According to the 2010 Census Transportation Planning Package (CTPP), about 70,000 households in the Denver region did not have an automobile available. People living in these households may choose not to have a car, or may not drive because of health or income reasons. They still have a need to travel to work, health facilities, schools, stores, and other destinations. Friends or family members may provide rides, but it is important to also offer public transit services, carpool assistance, ridesharing and carsharing services, and facilities for convenient walking and bicycling trips. Traffic congestion. Growth in the region s population, driving, and VMT has outpaced the increase in highway capacity over the past 20 years. The result is about 380 miles of freeways and arterials identified with severe recurring congestion in 2015 (corridors with a DRCOG congestion mobility grade of D or F as shown in Figure 2.7). The number of congested miles is forecast to increase to about 550 miles by Figure 2.7 identifies key congested locations on the regional roadway system anticipated in Traffic crashes. There will likely be more annual crashes in 2040 because of the growth in population and VMT. However, the number and severity of crashes in the future (fatalities and serious injuries) will be highly dependent on technological, legislative, law enforcement, and social actions. The 64,000 reported crashes for the Denver region in 2013 (the latest year available) resulted in approximately 21,000 injuries and 180 fatalities, and millions of hours of congestion delay for travelers. Chapter 2 Transportation Challenges and Planning Assumptions 17
26 Recreational traffic. The Denver region s quality of life depends in part on the abundant recreational opportunities nearby. Thousands of people travel to and from recreational activities in the mountainous areas of Colorado, both within the Denver region and adjacent to it. Traditionally, they travel around the same general time. Roadways such as I-70 and US-285 experience extreme congestion during weekend peak periods, such as Sunday afternoon traffic returning to the region. Local communities are impacted by this congestion, which affects the ease of making local trips, emergency vehicle response, as well as noise, air, and water quality. While innovative smaller-scale traffic management approaches are being used in the I-70 mountain corridor, large scale solutions are beyond the region s and state s funding abilities. Future unknowns, including technology. There are many unknown and unpredictable trends that will influence transportation and mobility between now and These include fuel prices and availability, personal habits, alternative fuels, connected and driverless vehicles, and others. Technology is rapidly evolving and could have significant implications that are unknown. E. Environmental Challenges Air quality. Emissions from mobile sources, such as automobiles and trucks, are a major contributor to air pollution. Past trends in emission violations for the Denver region are illustrated in Figure 2.8. The number of pollutant violations recorded in the region has decreased from the 1980s, primarily due to automobile pollution control equipment, the state s inspection and maintenance program, the oxygenated fuels program, and changes in street sanding and sweeping practices. Ground-level ozone is currently of greatest concern in the Denver region. It is formed in the summertime when volatile organic compounds and nitrogen oxides mix and react in the presence of sunlight. In 2012, the Denver Metro/North Front Range was designated by the U.S. Environmental Protection Agency (EPA) as a Marginal nonattainment area for the 2008 federal ozone standard. Results for the three-year period showed that the region did not achieve the standard by the designated attainment date of July As a result, the region was redesignated to a Moderate nonattainment area and the Regional Air Quality Council (RAQC), the lead air quality planning agency for the region, in coordination with the Air Pollution Control Division (APCD), has prepared a State Implementation Plan (SIP) for this standard. The SIP was approved by the Air Quality Control Commission (AQCC) and will be submitted to EPA for approval. The ozone SIP identifies control measures and the motor vehicle emissions budgets the 18 Chapter 2 Transportation Challenges and Planning Assumptions
27 region must use for air quality conformity upon a finding of adequacy by EPA. In 2015, the EPA further strengthen the ozone standard, referred to as the 2015 Ozone National Ambient Air Quality Standard (NAAQS), which will require even greater efforts by the region to attain. Even with continued technological improvements to pollution control equipment, expected VMT growth may jeopardize air quality. Consequently, ongoing efforts to promote optional modes of travel and pursue technological improvements and cleaner fuels need to be made. Water quality. Water pollution is caused by many factors related to regional development, including the construction and operation of transportation infrastructure. Growth in traffic can cause increased runoff of pollutants created by brakes and tires. As the physical transportation network expands, the amount of impervious surface increases, resulting in greater runoff. Chapter 2 Transportation Challenges and Planning Assumptions 19

28 Figure 2.7: Key Congested Locations in 2014 and Chapter 2 Transportation Challenges and Planning Assumptions
29 Figure 2.8: Air Quality Violation or Exceedance Days in the DRCOG Region F. Funding Challenges Limited funds. Funding for the region s multimodal transportation system through 2040 is anticipated to be less than needed to fully implement the entire Metro Vision transportation system (Chapter 5). However, the revenues expected to be available for operations, maintenance, and preservation will enable the continued provision of an adequate and operational transportation system. A portion of new capacity expenditures will also be used for reconstruction and rehabilitation. The unconstrained Metro Vision transportation system includes both unfunded and delayed funded needs as well as very long term concepts (such as intercity rail) that are not an immediate need so much as a future vision that the region is exploring. Even so, there is still clearly a need for additional transportation funding, to keep pace with anticipated growth, complete FasTracks and other projects, and address other mobility needs. Additional federal, state, local, and private revenue sources must be found. Chapter 2 Transportation Challenges and Planning Assumptions 21
30 22 Chapter 2 Transportation Challenges and Planning Assumptions
31 3. METRO VISION INTEGRATION Metro Vision is the region s shared aspirational vision of the future of the DRCOG region. It fulfills DRCOG s duty to develop and adopt a regional plan for the physical development of the region s territory. While advisory, local jurisdictions can choose to adopt it as their official plan. Its six core principles are that Metro Vision: Protects and enhances the region s quality of life; Is aspirational, long-range and regional in focus; Offers ideas for local implementation; Respects local plans; Encourages communities to work together, and Is dynamic and flexible. Metro Vision integrates growth and development, transportation, environmental quality, housing, and the economy into a single comprehensive foundation for regional collaboration and shared decisionmaking. As noted in Chapter 1, Metro Vision s transportation element (theme), A Connected Multimodal Region, outlines a strategic planning framework for the transportation system organized around two regional outcomes: The regional transportation system is well-connected and serves all modes of travel. The transportation system is safe, reliable, and well maintained. In addition to regional outcomes, each theme has regional and supporting objectives, performance measures and 2040 targets, and strategic regional and local initiatives to help achieve the regional outcomes. The MVRTP helps implement the transportation theme of Metro Vision by funding multimodal projects, project categories, programs, services, and other activities to address and help achieve the regional outcomes described above. The remainder of this chapter directly incorporates Metro Vision s A Connected Multimodal Region theme in its entirety. Performance measures and associated 2040 targets are discussed further in Chapter 7. Chapter 3 Metro Vision integration 23

32 A Connected Multimodal Region The Denver region aspires to have a connected multimodal transportation system that provides everyone with viable travel choices. The region will have a multimodal approach to move people and goods, with transportation facilities and services tailored to the needs and desires of individual communities. Over time, a greater share of travel will comprise public transit, bicycling, walking and carpooling. The region s transportation system will adapt quickly to major trends affecting the region, such as significant population growth, a rapidly aging population, new technology, an evolving economy and changing residential and workplace styles. Transportation and land-use planning will be integrated to improve the region s quality of life. Current transportation needs far outweigh available funding. This necessitates difficult tradeoffs and choices, such as balancing the need for additional multimodal capacity with maintenance and system preservation needs. The region must leverage a range of funding solutions to build and maintain transportation infrastructure and services. Coordinated regional and statewide actions must be taken to increase transportation funding. The overall vision for the region s transportation system is organized around two regional outcomes: The regional transportation system is well-connected and serves all modes of travel. The transportation system is safe, reliable and well-maintained. These outcomes focus on building and maintaining a world-class multimodal transportation system. Supporting objectives and initiatives will help the region achieve these outcomes. The companion 2040 Metro Vision Regional Transportation Plan implements the transportation element of Metro Vision. The 2040 Metro Vision Regional Transportation Plan defines the specific transportation system the region envisions and the portions that can be funded through Map Fiscally Constrained Roadway System Capacity Improvements SOURCE: Regional Transportation Plan 24 Chapter 3 Metro Vision integration
33 Why is this important? Our region needs a connected, multimodal transportation system in order to: Operate, maintain and expand the system with limited funding. The region must operate and maintain our existing multimodal transportation system while accommodating more than 1 million new residents and 600,000 more jobs by However, transportation funding is limited. Our region must continue to facilitate the movement of people, goods and services to ensure the Denver region remains economically competitive. Providing a range of travel options will facilitate useful and convenient mobility for all travelers. New and reconstructed roadways must be designed to optimize movement of people and vehicles alongside system management and operations that leverage existing capacity and enable safe travel for all users. Make connections that increase access and travel choices. Our region continues to make significant investments in transit, such as the Regional Transportation District s FasTracks rapid transit system while also envisioning future intra- and inter-regional transit connections. Although the completed portions of the FasTracks program have expanded regional mobility, such improvements cannot be fully realized without easier connections for those walking, biking, driving, sharing a ride, or riding a bus to first- or final-mile connections to transit. Our region and local jurisdictions continue to increase the viability of walking and bicycling by expanding the bicycle and pedestrian network and providing additional supportive infrastructure. Providing all of these travel choices can help reduce vehicle miles traveled, ground-level ozone and other air pollutants, which can lead to improved individual and environmental health. A transportation system that serves users of all modes of travel also helps ensure that people of all ages, income levels and abilities remain connected to their communities and have the means to access services, amenities and employment opportunities. Embrace new technologies and innovations. Carshare, rideshare and bikeshare programs are already significant travel options within the region. Emerging transportation innovations, such as connected and driverless cars, have the potential to dramatically influence future personal mobility. Broader use of technology and other innovations (such as broadband, smartphones and trip-planning tools) has the potential to connect multimodal transportation system users to the information they need in order to manage travel, avoid and reduce congestion; optimizing available capacity. Chapter 3 Metro Vision integration 25
, bicycle and pedestrian facilities, and air and freight rail linkages.")
34 What is our vision? Outcome 4: The regional transportation system is well-connected and serves all modes of travel. The transportation system integrates regional and local roadways and streets, transit (bus and rail), bicycle and pedestrian facilities, and air and freight rail linkages. The transportation system connects the region to the rest of the state and beyond, and will evolve to include future technology and mobility innovations as appropriate. Regional Transportation Plan As the federally designated transportation planning agency for the Denver region, DRCOG develops the Metro Vision Regional Transportation Plan to guide the region s future multimodal transportation system. The Metro Vision Regional Transportation Plan is integrated with the Metro Vision plan to address the mobility needs of people of all ages, incomes and abilities. It identifies the desired vision for our transportation system in a scenario under which funding is unconstrained. It also defines the fiscally constrained multimodal system to be implemented by 2040 using revenues that are reasonably expected to be available. In addition to funding construction of major roadway and rapid transit projects, revenues must also be used to maintain and operate the transportation system, and for transit service, bicycle, pedestrian and other types of projects. Denver Union Station After a multiyear rehabilitation and restoration project, the historic Denver Union Station reopened in 2014 as a hub of multimodal transportation options for the entire region. A regional coalition including DRCOG joined forces to develop the plan to revitalize the historic structure and surrounding properties. Today bus, light rail, commuter rail, bikeshare, ride-hailing and other travel options converge at Denver Union Station a premier example of our vision of a connected multimodal transportation system. Denver Union Station has also emerged as a primary anchor in the central business district and is a primary catalyst for hundreds of millions of dollars in private development and investment. 26 Chapter 3 Metro Vision integration
35 What improvements do we need to continue to make? Regional Objective 4: Improve and expand the region s multimodal transportation system, services and connections. The region will continue to invest in a well-connected, multimodal transportation system to improve mobility and accommodate anticipated increases of 1.16 million people and more than 600,000 jobs by Transportation system investment initiatives may include expanding transit service and coverage, improving on-street and off-street bicycle and pedestrian facilities, widening and adding new roadways, and promoting travel options. The resulting transportation system will increase mobility choices within and beyond the region for people, goods and services. Supporting Objectives: Improve the capacity of the multimodal regional roadway system. Improve the region's comprehensive transit system, including the timely completion of the FasTracks program. Improve bicycle and pedestrian accessibility. Improve interconnections of the multimodal transportation system within and beyond the region for people and freight. Expand travel demand management services and strategies. What might we do to make progress? Strategic Initiatives Ideas for Implementation Voluntary Options Available to Regional Organizations Voluntary Options Available to Local Organizations Collaboration Maintain a fiscally constrained regional transportation plan that defines long-range multimodal projects, services and programs to address mobility needs. Adopt Transportation Improvement Program project selection policies that consider all transportation users. Coordinate with the Regional Transportation District and other transit providers to implement major projects and services. Coordinate with Denver Regional Mobility and Access Council and transit operators to increase transportation for vulnerable populations, such as older adults, people with disabilities and low-income populations. Collaboration Coordinate with the Regional Transportation District and other transit providers on transit service, facilities and infrastructure components of development projects, such as bus bulbs and queue jump lanes. Coordinate with neighboring jurisdictions to ensure a well-connected system across boundaries. Coordinate with public transit providers to improve regionally funded local service, maintaining the right to buy-up service for increased frequency and coverage. Coordinate local comprehensive plan and transportation plan updates with neighboring and affected jurisdictions. Coordinate transportation system improvements and operations to consider issues of land-use compatibility. Chapter 3 Metro Vision integration 27
36 Strategic Initiatives Ideas for Implementation Voluntary Options Available to Regional Organizations Voluntary Options Available to Local Organizations Facilitate coordination between jurisdictions in expanding and connecting the region s bicycle and pedestrian network. Encourage integrated land use and transportation planning among state and regional agencies, local governments, and the development community. Coordinate information and services among all transportation providers. Work with partners to expand the regional travel demand management program consisting of outreach, promotion, trip-planning and marketing activities to shift commute choices to non-singleoccupant vehicle modes, including carpools, vanpools, transit, bicycling and walking, as well as telework and alternative work schedules. Continue and expand marketing consisting of advertising campaigns and events such as Bike to Work Day and Walk and Bike to School Day. Conduct a regionwide evaluation of potential bus rapid transit corridors via a joint effort of the Regional Transportation District, DRCOG, the Colorado Department of Transportation, and other stakeholders. Work with stakeholders from across the region to develop a vision for a hierarchical, high-comfort, low-stress bicycle network for the region that can accommodate most ages and abilities. Coordinate with local governments to balance primary park-and-ride functions with opportunities for transit-oriented development. Collaborate with local and regional stakeholders in transportation planning activities to address the needs of mobility-limited populations Facilitate coordinated local and regional investment in datasets to improve transportation planning and investment. Education and Assistance Encourage and support fare structures and subsidy programs that keep transit service affordable for all users. Provide tools, informational forums and resources to jurisdictions regarding bicycle- and pedestrianfacility design, guidance and implementation. Coordinate planning efforts to ensure real estate needed for the expansion of multimodal transportation facilities is identified and preserved for mobility uses. Policies and Regulations Implement parking supply and pricing mechanisms, such as shared, unbundled, managed and priced parking in locally defined activity centers to manage parking availability and provide incentives for walking, bicycling, carpooling and transit use. Adopt and implement street and development standards to improve multimodal connectivity in a variety of contexts (urban, suburban and rural) while considering unique land-use settings, such as schools, parks and offices. Adopt policies and development regulations that support transit. Address the needs of mobility-limited populations in local transportation plans and policies. Adopt and implement local street standards and other development codes and standards that address multimodal connectivity objectives in a variety of land-use contexts, such as cut-throughs for pedestrians and bicycles in cul-de-sacs. Ensure Americans with Disabilities Act standards are met or exceeded in constructing or retrofitting facilities such as curb cuts and ramps. Adopt local multimodal transportation plans that address connections within and between jurisdictions and communities. Adopt land-use standards around airports, railroad lines and facilities to guide compatible long-range development. Reserve adequate rights-of-way in developing and redeveloping areas, as feasible, for pedestrian, bicycle, transit and roadway facilities. Investments As a supplement to other funding sources, including federal funds, finance roadway preservation, operational and expansion projects through local capital improvement programs. Fund projects that address multimodal connectivity through non-metropolitan planning organization programs. Provide on-street and off-street bicycle and pedestrian infrastructure that is comfortable, safe and convenient. 28 Chapter 3 Metro Vision integration
37 Strategic Initiatives Ideas for Implementation Voluntary Options Available to Regional Organizations Voluntary Options Available to Local Organizations Conduct activities to inform and promote the use of travel demand management strategies and services by transportation management associations/organizations and local travel demand management providers, such as ride-sharing, vanpools, carpools and school carpools. Investments Consider the use of managed lanes in new roadway capacity projects where feasible. Support bicycle-sharing programs regionwide. Include major roadway and transit capacity projects in DRCOG s fiscally constrained Regional Transportation Plan once construction funding is identified for such projects. Invest in and manage in the region s multimodal transportation system to improve freight and goods movement within and beyond the region. Upgrade existing facilities (sidewalks, crosswalks, bus stops and shelters) to improve transit access for older adults and mobility-limited populations. Fund first- and final mile bicycle and pedestrian facilities and connections to transit such as sidewalks, bicycle facilities, bike-sharing, wayfinding, bicycle parking, shelters and carsharing at transit stations. Continue to allocate resources to support corridor planning efforts, infrastructure improvements and other efforts to spur further public/private investment. Provide funding, tools, informational forums, and resources to jurisdictions, transportation management associations/organizations, nonprofits, and other travel demand management stakeholders to increase travel demand management awareness and use. Maintain and enhance airport capacity throughout the region. Improve transportation linkages to major destinations, markets and attractions beyond the region. Connect populations in need of transportation service to new and improved services. Explore strategies to create multimodal connections between smaller scale suburban centers and the region s existing and emerging employment centers Provide wayfinding signage for bicyclists, pedestrians and transit users to reach key destinations. Provide first- and final-mile bicycle and pedestrian facilities and connections to transit such as sidewalks, bicycle facilities, bike-sharing, wayfinding, bicycle parking and shelters and carsharing at transit stations. Implement off-street sidewalks and multi-use paths that are comfortable for a wide array of users by providing separation from traffic. Conduct local activities to inform and promote the use of travel demand management strategies and services by transportation management associations/organizations and local travel demand management providers. Promote educational and promotional events to encourage bicycling and walking, such as Safe Routes to School. Reserve adequate rights-of-way in developing and redeveloping areas, as feasible, for pedestrian, bicycle, transit and roadway facilities. Expand mobility options within urban centers and other locally defined activity centers. Implement transportation improvements that enhance transit-oriented development opportunities. Chapter 3 Metro Vision integration 29

38 Strategic Initiatives Ideas for Implementation Voluntary Options Available to Regional Organizations Voluntary Options Available to Local Organizations Develop transportation service options to address mobility needs of older adults and mobility-limited residents. 30 Chapter 3 Metro Vision integration

39 What is our vision? Outcome 5: The transportation system is safe, reliable and wellmaintained. Educational, enforcement and engineering approaches enhance safety to reduce crashes, serious injuries and fatalities. Coordinated operations and management of the system maximizes capacity and reliability for all users. Transportation system physical components are well-maintained to extend their useful life and provide a quality travel experience. Traffic Operations Since 1989, DRCOG has been working to reduce traffic congestion and improve air quality through its Traffic Operations program. Through the program, DRCOG, the Colorado Department of Transportation and local governments coordinate traffic signals on major roadways in the region. One of the first transportation planning agencies to conduct this type of program, DRCOG remains a national leader among agencies involved in traffic signal coordination. In 2015, the program retimed 259 signals on travel corridors in the region, reducing daily travel time for motorists along those corridors by more than 1,600,000 hours and reducing fuel consumption by 800,000 gallons. Additionally, pollutant emissions were reduced by 90 tons, while annual greenhouse gas emissions were reduced by 8,000 tons. Congestion management process Through its congestion management process, DRCOG works with local, state and national partners to alleviate congestion and help people and businesses avoid or adapt to it. DRCOG uses travel demand reduction and operational strategies to effectively manage transportation facilities. DRCOG has developed a toolkit for addressing congestion through construction, demand management, real-time information and operational strategies. Many of the strategies are implemented through DRCOG programs such as its travel demand management program, Way to Go, and its Traffic Signal System Improvement Program and Intelligent Transportation Systems management and operations. This process and its associated strategies enables DRCOG to monitor performance of the region s transportation system (summarized in annual reports), as well as identify, evaluate and implement strategies through the Metro Vision Regional Transportation Plan and short-range Transportation Improvement Program. The congestion management process is integral to DRCOG s performancebased planning process. Coordination among regional partners reduces congestion. Associated strategies such as signal timing and providing commute alternatives assist in improving air quality in the region. Chapter 3 Metro Vision integration 31
40 What improvements do we need to continue to make? Regional Objective 5: Operate, manage and maintain a safe and reliable transportation system. The region will optimize the multimodal transportation system to improve the safe and reliable flow of people and goods. System optimization will include projects and initiatives that make the multimodal transportation system s capacity as productive as possible. The multimodal system will require maintenance to continue safe and sound conditions. Safety projects and other related initiatives will reduce fatalities and serious injuries for all travel modes. The region will also increase the deployment of technology and mobility innovations to improve reliability and optimize capacity. Supporting Objectives: Maintain existing and future transportation facilities in good condition. Improve transportation system performance and reliability. Improve transportation safety and security. What might we do to make progress? Strategic Initiatives Ideas for Implementation Voluntary Options Available to Regional Organizations Voluntary Options Available to Local Organizations Collaboration Collaborate with the Colorado Department of Transportation, the Regional Transportation District local governments and other regional stakeholders to implement and monitor asset management techniques. Work with the Colorado Department of Transportation, the Regional Transportation District and other regional stakeholders to expand effective Transportation Systems Management and Operations projects, incident management procedures and processes, transportation demand management initiatives, and other innovative tools and techniques to safely optimize performance. Coordinate efforts of the Colorado Department of Transportation, the Regional Transportation District, local governments and other regional stakeholders to most efficiently use the existing multimodal system while planning for future use. Collaboration Monitor and manage transportation systems (including traffic signal systems) in collaboration with neighboring jurisdictions. Participate in federal, state and regional initiatives related to safety and homeland security initiatives. Partner with local law enforcement agencies and advocacy groups on education and enforcement activities related to all road users. Accurately monitor and maintain crash and traffic safety data for all transportation modes. Support the use of congestion pricing and other tolling techniques. Policies and Regulations Develop specific plans and strategies to operate roadways more efficiently (such as traffic signal coordination and better management of traffic incidents). Develop and implement access management principles along major streets. Enforce traffic and ordinances as they apply to all users of the transportation system. 32 Chapter 3 Metro Vision integration

41 Strategic Initiatives Ideas for Implementation Voluntary Options Available to Regional Organizations Voluntary Options Available to Local Organizations Way to Go and travel demand management stakeholders continue to work with local jurisdictions and employers to distribute information about and encourage the use of technology, including multimodal real-time trip planning. Collaborate with public safety stakeholders to assess threats to and vulnerabilities of the transportation system, including consideration of national and regional homeland security initiatives, and establish and implement resolution processes in response. Coordinate with federal, state, regional and local agencies to implement applicable homeland security plans and initiatives. Facilitate interagency coordination on safety and homeland security initiatives. Work with communities and transportation providers to identify and address challenges faced by mobility-limited populations and employment sectors with non-traditional work schedules. Education and Assistance Consider supporting alternative pricing and revenue-producing strategies that directly reflect the cost of vehicle travel to the user. Investments Support cost-effective improvements to driver, passenger, pedestrian and bicyclist safety. Maintain transportation system assets (vehicles and facilities) in a state of good repair per federal requirements. Implement Transportation Systems Management and Operations projects. Implement other active demand management strategies. Develop and implement strategies that enhance security. Investments Maintain transportation facilities in good condition and implement asset management principles and techniques. Implement access management projects to optimize the efficiency of roadways, reduce conflict points and improve safety. Implement projects that reduce the likelihood and severity of crashes involving motor vehicles, freight and passenger trains, buses, bicycles and pedestrians. Chapter 3 Metro Vision integration 33
42 How will we know how we are doing? Performance Measures Performance measures are critically important in monitoring the region s progress toward Metro Vision themes and outcomes. They are used to obtain regular measurement of outcomes and results. They also generate reliable data to help local governments and partners evaluate policies, programs and initiatives. As part of its reporting on plan progress toward becoming a connected multimodal region DRCOG will use the performance measures outlined below. Large urban areas such as metropolitan Denver are vibrant places offering a variety of employment, service and recreation opportunities in locations regionwide. Therefore, at some points in time, traffic congestion is inevitable. Plan performance measures related to congested travel conditions establish targets that are higher than current baseline measurements, but below currently forecasted future levels of congestion. Measure Where are we today? (Baseline) Where do we want to be? (2040 Target) Non- single occupant vehicle (Non- SOV) mode share to work 25.1 percent (2014) 35.0 percent Daily vehicle miles traveled (VMT) per capita 25.5 daily VMT per capita (2010) 10.0 percent decrease from 2010 Average travel time variation (TTV) (peak vs. off-peak) 1.22 (2014) Less than 1.30 Daily person delay per capita 6 minutes (2014) Less than 10 minutes Number of traffic fatalities 185 (2014) Fewer than 100 annually 34 Chapter 3 Metro Vision integration
43 4. METRO VISION REGIONAL TRANSPORTATION PLAN SYSTEM COMPONENTS The Denver region s transportation system consists of a multimodal network of integrated regional transportation facilities and services. Integration refers to travel modes acting in unison, such as a roadway with bike lanes and sidewalks, as well as transfers between modes, such as from rail to truck. An integrated network is essential to encourage travel and mobility choices. System components do not function in isolation buses and bicyclists travel on roadways, for example, and automobile drivers may transfer to transit at park-and-ride lots. System facilities and services are provided by both public and private entities. The estimated total cost to implement, operate, and maintain the complete Metro Vision transportation system from 2016 to 2040 is $152.5 billion. However, only $105.8 billion is estimated to be available through The MVRTP contains a vision plan not constrained by costs, outlining the region s total transportation needs, as well as the 2040 Fiscally Constrained Regional Transportation Plan (Chapters 5 and 6), which includes those projects, services, and other components that can be implemented given reasonably expected revenues through The Metro Vision transportation system was updated from 2035 to 2040 using several methods. DRCOG staff solicited additions, deletions, or changes to unfunded vision roadway projects while updating the Regional Roadway System network (see below). For the regional transit network, DRCOG staff worked with RTD and CDOT s Division of Transit and Rail to incorporate corridor recommendations from major studies, such as RTD s Northwest Area Mobility Study and CDOT s high speed rail studies. This chapter describes the components of the region s multimodal Metro Vision transportation system. A. Regional Roadway System The majority of person travel and local freight movements in the Denver region occur on roads and highways using motor vehicles, such as passenger cars and trucks, buses, commercial vehicles, and service vehicles. Pedestrians and bicyclists are also important users of the roadway system. The 2040 transportation system will both shape and be shaped by growth and development in the Denver region. Several roadways will also serve as external connectors beyond the region. 1. Roadway System Background The Denver region has numerous freeways, tollways and managed lanes, arterials, collectors, federal land access roads, and local streets. For transportation planning purposes, DRCOG designates a Regional Chapter 4 Metro Vision Regional Transportation Plan System Components 35
44 Roadway System (RRS) consisting of freeways, tollways, major regional arterials, and principal arterials (freeways may include managed lanes or optional tolled segments). The RRS is the planning network DRCOG uses for air quality conformity analysis and for establishing transportation project eligibility for the FCRTP and TIP. The RRS identifies both existing and planned roadways (freeways, major regional arterials, and principal arterials). RRS-designated principal arterials do not necessarily match those shown in local government plans, which may have more customized roadway classification designations. The RRS includes all state highways in the DRCOG region and many non-state (local) roadways. The designated DRCOG RRS has been an important component of long-range transportation plans for more than 20 years. The RRS represents the most heavily traveled and important connecting roadways in the region. It accounts for over 75 percent of the VMT traveled in the region. The 2035 RRS was updated to 2040 as the first step in preparing the 2040 FCRTP, described in Chapter 5. The 2040 RRS is shown in Figure 4.1. It reflects a base existing network and future roadways and interchanges throughout the region. It is known as the Metro Vision Regional Roadway System because it includes fiscally constrained and unfunded (Metro Vision) roadway corridors and facilities. To be clear, the RRS is comprised of existing and future roadway corridors, not projects. However, fiscally constrained roadway projects included in the 2040 FCRTP must be located on an RRS facility. Many of the specific attributes of the 2040 RRS are not known at this time, particularly for future facilities. Exact alignments for new roadways and design elements, such as the number of lanes, will be determined through future project-specific studies. Alignments depicted in Figure 4.1 are best estimates at this time. The number of lane miles on the fiscally constrained RRS will increase from 7,156 in 2015 to approximately 8,400 by The total Metro Vision RRS network (fiscally constrained and unfunded) includes an additional 930 lane miles, or 9,300 total. Lane-miles represent the number of through-lanes multiplied by the roadway length. For example, a four-lane road that is three miles long equals 12 lanemiles. Parking lanes and turning lanes are not included. 36 Chapter 4 Metro Vision Regional Transportation Plan System Components

45 Figure 4.1: 2040 Regional Roadway System Figure Regional Roadway System Chapter 4 Metro Vision Regional Transportation Plan System Components 37
46 Roadways on the 2040 RRS are classified as one of three facility types: Freeway/Tollway. Divided highways with access restricted to grade-separated interchanges. Most are completely free, though some may be tolled fully (tollways, such as E-470 and Northwest Parkway). Others may be partially tolled and include specific managed Bus and/or High Occupancy Vehicle (HOV) or High Occupancy Toll (HOT) lanes as part of the facility, such as I-25 north and US-36. About 33 percent of all vehicle miles traveled in the region are on the freeway system. Major regional arterials. Divided and undivided roadways that provide for key intraregional connections and high traffic volumes by minimizing left turns, side access, and cross-streets. They permit at-grade access and crossings, but some intersections with other major facilities might be grade-separated. They form the backbone of the regional roadway system along with freeways. Examples include Wadsworth Boulevard, Colorado Boulevard, and SH-119. Principal arterials. Major connecting streets primarily serving through-traffic, with at-grade intersections and side access permitted but regulated. Several principal arterials in older established areas serve as multimodal streets with a high amount of pedestrian, transit, and commercial activity. Principal arterial examples include Alameda Avenue, Kipling Street, 104 th Avenue, and SH-42/95 th Street. Interchanges are also part of the roadway system and include the following types: Freeway-to-freeway interchanges (e.g., I-70 at I-25); Arterial-at-freeway interchanges (e.g., Alameda Avenue at I-225), and Grade-separated arterial interchanges that replace at-grade intersections (e.g., Evans Avenue at US-85). The 2040 RRS network includes fiscally constrained projects and unfunded vision projects on its roadway facilities as follows: Freeways/tollways: 2,319 fiscally constrained lane miles, 257 additional vision lane miles Major regional arterials: 1,143 fiscally constrained lane miles, 97 additional vision lane miles Principal arterials: 4,906 fiscally constrained lane miles, 578 additional vision lane miles Managed lanes (Bus/BRT/HOT/HOV): 71 centerline miles, 45 additional vision miles) Freeway interchanges: 236 fiscally constrained, nine additional vision interchanges Grade-separated arterial interchanges: 33 fiscally constrained, 22 additional vision ones 38 Chapter 4 Metro Vision Regional Transportation Plan System Components


47 Managed lane (BRT, HOV, and HOT lanes) investments are emphasized for the region s freeway corridors. I-25, US-36, I-70, and C-470 all have fiscally constrained managed lane projects identified. Several freeway corridors will also have rapid transit lines added within or parallel to the right-of-way to make them true multimodal travel corridors. Road widening projects are identified for E-470 and to key sections of I-25, I-225, and I-270. Peak period managed lanes will be added to the I-70 mountain corridor. Many arterials will be widened, primarily in suburban areas. New arterials will also be added to serve growing parts of the region within regionally defined growth areas. Roadways provide the conduit for regional and statewide automobile travel; local, regional, and statewide bus travel, and freight and goods movement. Without improvements, even more roadways will experience more severe congestion (see Figure 2.7). Multimodal improvements that serve bicyclists, pedestrians, or transit users will be considered for all future roadway improvements, as applicable. E-470 and the Northwest Parkway are currently the only entirely tolled highways in the region. The initial phase of Jefferson Parkway is planned for completion in the timeframe. CDOT Managed Lanes Policy CDOT s Policy Directive 1603 requires the agency to strongly consider managed lanes during the planning and development of capacity improvements on state highway facilities that are or will be congested. In 2015, the Transportation Commission approved a resolution clarifying that HOV 3+ will be free for all CDOT toll facilities unless demonstrated to be infeasible. As noted previously, managed lanes will be added to several regional freeways. These projects include a tolling component, typically variable tolling by time of day for automobiles with less than three occupants, and free for three or more carpoolers and buses, known as high-occupancy vehicles (HOV). While collector and local streets are not depicted as part of the regional roadway system, they are important for providing access to and through local developments and neighborhoods, and many are included in DRCOG s regional travel model. The costs to build and maintain local streets, including collectors and minor arterials, are included in the 2040 FCRTP. Similarly, roads operated by federal and state land agencies are not part of the regional roadway system, but they provide access to, within, and through the region s recreational playgrounds. Their costs are also included in the 2040 FCRTP. Chapter 4 Metro Vision Regional Transportation Plan System Components 39

48 2. Congestion Management Process On an average weekday in 2015, almost 14 million trips were made by residents and visitors in the Denver region. More than nine million were motor vehicle trips. Household, service, and commercial vehicles are driven over 81 million miles per day on the streets and highways of the Denver region. Drivers and passengers face more than 300,000 hours of congestion delay per day. All of these measures are expected to increase significantly by 2040 with the population and employment growth of the region. It is therefore important that DRCOG work with its partners to improve the reliability of travel times on the region s transportation system and provide multiple mobility choices. DRCOG administers a congestion management process (CMP) as part of its congestion mitigation program (Figure 4.2) in accordance with federal requirements. The CMP s three themes to mitigate congestion are: Help people adapt to congestion. Help people avoid congestion. Alleviate congestion with capacity and operational projects. Figure 4.2: DRCOG Congestion Management System Process Congestion Mitigation Program (CMP) - Define CMP roadway network & segment attributes - Develop performance measures - Collect current and forecasted traffic data - Evaluate regional congestion & identify congested corridors using a scoring system based on calculated travel delays - Identify congested intersections and bottleneck locations Monitor Effectiveness - DRCOG s annual reporting of performance measures - Evaluate benefits of completed projects and programs Incorporate Strategies into the Transportation Planning Process - Use CMP results to help evaluate projects for funding in RTP & TIP - Identify and evaluate projects and programs that reduce congestion - Promote Congestion Mitigation Toolkit (avoid, adapt to, and alleviate congestion) Regional Partners (RTD, CDOT, RAQC, Local Governments) - Transit service - Managed lanes (HOV, toll, etc.) - Incident management - Real-time information, technology DRCOG Regional Program - Way to Go Program/Regional Travel Demand Management - Traffic Signal Program - ITS, Management, & Operations Program 40 Chapter 4 Metro Vision Regional Transportation Plan System Components

49 The CMP includes the following activities to enable the effective management and operation of the region s transportation system: Maintenance and annual updates of a database containing traffic volumes, capacity information, and congestion measures for the regional roadway system Coordination of the acquisition of traffic count, VMT, and multimodal facility use data Identification of measures used in evaluating proposed roadway and multimodal projects for the TIP and FCRTP Reporting of regional performance measure results for congestion, travel delay, and travel time reliability (e.g. annual congestion reports and Table 7.1) Identification of congested locations including roadway corridors, intersections, and freeway bottlenecks (see Figure 2.7) Identification of future performance measure targets Monitoring and presentation of privately provided congestion, delay, and reliability measures (e.g. INRIX data) Use of the CMP as a basis for defining a congestion-related purpose and need for corridor and project studies (to be further evaluated through the NEPA process) Establishment of a toolkit of construction, demand management, real-time information, and operational strategies for addressing congestion, to be implemented by state, regional, and local agencies Monitoring of TIP funded projects to evaluate and summarize effectiveness in reducing congestion or providing travel options Congestion Mitigation Toolkit Summary (click here for the full toolkit) 1. Active Roadway Management A. Traffic signal timing/coordination/equipment B. Ramp meters C. Access management D. Incident management & response E. Traveler information (message signs, internet) F. Electronic toll collection (ETC) G. Roadway signage H. Communication connections and surveillance 2. TDM/Travel Choices A. Transit service and facility expansion B. Transit intersection queue-jump lanes and signal priority C. Telework and flexible work schedules D. Ridesharing travel services (Carpool, Vanpool, Schoolpool) E. Off-street multi-use trails (pedestrian and bicycle) F. On-street bicycle treatments G. Efficient land use and development practices 3. Physical Roadway Capacity A. Intersection turn lanes B. Acceleration/deceleration lanes C. Hill-climbing lanes D. Grade-separated railroad crossings/intersections E. Roundabout intersections F. New (or converted) managed/hov/hot lanes G. New travel lanes (widening), new roadways Chapter 4 Metro Vision Regional Transportation Plan System Components 41
50 The CMP toolkit contains three categories of congestion mitigation strategies to address recurring and non-recurring congestion: active roadway management strategies, Travel Demand Management (TDM) and travel options strategies, and physical roadway capacity strategies. Specific toolkit strategies are described in applicable sections of the MVRTP. DRCOG and its planning partners will closely monitor technological advances (and legislative actions) related to connected vehicles and infrastructure and autonomous vehicles. In particular, CDOT s RoadX initiative offers many opportunities to increase the efficiency, safety, and reliability for travelers using the roadway system. Planning, project programming, and project implementation efforts conducted throughout the MPO process must be nimble to respond to technological advancements. Regionally funded roadway capacity projects must be at locations identified in CMP process. It must be shown (and reflected in project scoring and evaluation) that such projects will reduce traffic congestion, vehicle delay, and person delay. B. Public Transportation The Denver region has an extensive and expanding transit system of bus, rail, and specialized transit service. The major components of the region s transit system are briefly described below. More detail is provided in the Coordinated Public Transit Human Service Transportation Plan, located in Appendix 6. Known as the Coordinated Transit Plan, it is a federal requirement in order to: 1) identify the transportation needs of individuals with disabilities, older adults, and people with low incomes; 2) provide strategies for meeting those needs; 3) and prioritize transportation services for funding and implementation. Federal requirements specify that projects funded under the Federal Transit Administration s (FTA s) 5310 program (mobility for the elderly and individuals with disabilities) be derived from a coordinated plan. DRCOG s Coordinated Transit Plan also integrates fixed route and rapid transit with the focus on human service transportation. The coordinated plan replaces DRCOG s former 2035 MVRTP Transit Element. 1. Rapid Transit System The region s rapid transit system includes a network of existing and future light rail, commuter rail, bus rapid transit, Denver Union Station, other transit stations and park-n-ride lots, and existing and future bus/high-occupancy vehicle (HOV) lanes, some of which also function as high-occupancy toll (HOT) lanes. Other regional and intercity transit elements include Amtrak service, Greyhound and other intercity bus service, and interregional express bus service (Bustang) operated by CDOT. 42 Chapter 4 Metro Vision Regional Transportation Plan System Components
51 As with other modes of the region s transportation system, the rapid transit system has components from both the 2040 FCRTP and unfunded vision (MVRTP) components. The 2040 FCRTP rapid transit system is shown in Figure 6.2 and includes the portion of RTD s FasTracks program that is fiscally constrained through 2040 as well as BRT projects on Colfax Avenue and SH-119. It is important to note that the entire FasTracks program is funded, though some components are currently programmed for construction by RTD beyond These components, along with CDOT s unfunded intercity rail and other conceptual transit corridors, comprise the vision (MVRTP) rapid transit system. The coordinated transit plan discusses the entire funded and envisioned rapid transit system in greater detail. 2. Fixed Route Bus and Other Transit Services RTD and other public and private operators provide important services to the region s growing population. A variety of services address the mobility needs of persons who cannot drive and those who desire an alternative to the private motor vehicle. Bus routes provide extensive service to customers along most major streets. Denser urban areas are served by high-frequency bus service; more moderate service is provided in other areas. RTD also provides call-n-ride curb-to-curb transit service with smaller buses in suburban areas and freestanding communities that do not have sufficient demand to warrant fixed-route service. RTD s call-n-ride is also used to support the rapid transit system. RTD provides Americans with Disabilities Act (ADA) service through its access-a-ride program. Additional service is provided by private non-profit agencies and local government-sponsored providers. Senior centers, places of worship, and others also provide many trips. Chapter 4 Metro Vision Regional Transportation Plan System Components 43


52 C. Active Transportation (Bicycle and Pedestrian Travel) The DRCOG region, known for its arid climate and abundance of sunshine, is an ideal place for walking and bicycling. Also referred to as active transportation, walking and bicycling are flexible, accessible, healthy, and clean modes of transportation and can be used exclusively or in conjunction with other modes. The cycling culture is especially strong not only in the DRCOG region, but statewide. The number of people who bike to work in the DRCOG region is more than twice the national average and is increasing at a greater rate than any other mode. Presently, there are about 1.4 million trips made each day by walking or bicycling in the region. Trends point to a continued uptick in the number of people who get around by walking and bicycling. While the region has a robust sidewalk and bicycling network, there are gaps to be filled and needs to be addressed in order to meet the demands for walking and bicycling; provide safe and comfortable options for people of all ages and abilities; and to fulfill the performance measures and targets currently being established as part of Metro Vision The Active Transportation component of the 2040 MVRTP (Appendix 7) addresses the following topics; existing conditions for walking and bicycling in the DRCOG region, future projections for these modes, regional goals for active transportation, and strategies for meeting the goals. There will be an opportunity to delve deeper into active transportation topics during the development of the Active Transportation Plan, scheduled to commence in early The Active Transportation Plan will eventually become an element of the MVRTP. 44 Chapter 4 Metro Vision Regional Transportation Plan System Components

53 D. Transportation Demand Management Transportation demand management is a set of strategies to help people use the transportation system more efficiently while reducing traffic congestion, vehicle emissions, and fuel consumption. Transportation Demand Management strategies promote and facilitate the use of travel choices as options to reduce the demand for motor vehicle travel, particularly single-occupant vehicle travel during peak periods. Such travel choices include ridesharing, vanpooling, transit, bicycling and walking, as well as varying travel times through teleworking and alternative work schedules. They also help to ensure personal mobility options for residents of the region. 1. Transportation Demand Management Background The original Transportation Demand Management concepts developed in the 1970s and 1980s provided alternatives to single-occupant vehicle travel to save fuel and money, improve air quality, and reduce peak period congestion. Today, managing travel demand has broadened to maximize transportation system performance not only for commute trips, but for non-commute trips and events. The need to manage transportation demand can occur throughout the day, evenings, or on weekends. Targeting work commuters, however, remains a priority focus since traffic congestion primarily occurs during weekday rush hours. Workplace trips tend to be more concentrated with routine schedules, enabling more efficient marketing efforts. As noted in Chapter 2, 75 percent of the region s workers drive alone to work. Heavy traffic to and from the Denver region is not just a rush-hour phenomenon. For example, traffic and delays can be incurred between the Denver region and the mountains, especially during ski season. GO I-70 facilitates carpooling to Colorado resorts to help alleviate the impacts of ski traffic congestion. Additionally, CDOT expanded its interregional bus service, Bustang, providing trips to Broncos games as well as other destinations on weekends. Transportation Demand Management strategies can be implemented by means of marketing, outreach, programs, policies, and infrastructure; and can be grouped into the following categories: Mobility options to single-occupant vehicle travel; Changes in work travel patterns; Incentives and policies to encourage the use of non- single-occupant vehicle mode options; Efficient land development designs and supporting infrastructure; and Information and Technology. Chapter 4 Metro Vision Regional Transportation Plan System Components 45


54 More information about these categories is provided in Section Transportation Demand Management Structure and Providers in the Denver Region The DRCOG region has a robust network of Transportation Demand Management service providers anchored by DRCOG s Way to Go program at the regional level; and transportation management associations, local governments, and other Transportation Demand Management providers in more focused areas. Strategies to promote and facilitate TDM will be implemented at four levels: Intraregional programs: Includes organizations and service providers that focus on mobility between the DRCOG region and other regions, such as CDOT s Bustang service, I-70 Coalition, VanGo Vanpool (Fort Collins, Loveland, Greeley), and Metro Rides (Colorado Springs). Regional programs. Transportation Demand Management service providers at the regional level include DRCOG s Way to Go program, Regional Air Quality Council and RTD. Sub-area programs. More localized Transportation Demand Management programs and efforts are coordinated and implemented by transportation management associations, local governments, and other Transportation Demand Management providers. Site-based programs. Implemented at individual workplaces with assistance from Way to Go or other Transportation Demand Management service providers. Site-based programs address the specific travel needs of employees at one work site. The DRCOG Way to Go program includes a formal partnership with the seven established transportation management associations in the region (referred to as the DRCOG Transportation Demand Management Partnership) to collaborate on a comprehensive and coordinated effort to address traffic congestion and air quality in the Denver region by promoting and implementing a suite of Transportation Demand Management services. The partnership couples the proven successes of the regional Way to Go program with the subarea knowledge demonstrated by the seven partner agencies. The partnership is designed to take advantage of regionally produced materials and strategies, and implement them through the geographically-located transportation management associations. DRCOG s primary responsibilities in the partnership include oversight and day-to-day management of the regional marketing and outreach efforts, including: Managing the advertising agency, directing and coordinating regional advertising and promotional campaigns; 46 Chapter 4 Metro Vision Regional Transportation Plan System Components


55 Coordinating and facilitating effective employer and community outreach throughout the region; Managing the regional Way to Go vanpool program; Managing the region s SchoolPool program, a nationwide model for promoting and facilitating families sharing rides to and from school; Managing large regional events and campaigns, such as Bike to Work Day and Way to Gotober; Developing and managing regional websites and trip planning platforms, such as MyWayToGo.org, and Administering the Guaranteed Ride Home Program, which removes a significant barrier to non-single-occupant vehicle travel Figure 4.3: TDM Service Providers by offering a free ride home in the case of emergencies. Currently, there are seven transportation management associations in the Denver region (Figure 4.3): Commuting Solutions Boulder Transportation Connections Denver South TMA (I-25 South/Denver Tech Center) Downtown Denver Partnership Northeast Transportation Connections Smart Commute Metro North (I- 25 North corridor and the area between U.S. 36 & U.S. 287 to U.S. 85) Transportation Solutions (Cherry Creek, Colorado Boulevard, Alameda Station, University of Denver areas) Chapter 4 Metro Vision Regional Transportation Plan System Components 47
56 The main services provided by transportation management associations as part of the DRCOG Way to Go Partnership include employer and community outreach, as well as localized promotion and marketing of Transportation Demand Management services in their respective areas. In addition to partnership services, transportation management associations may conduct many types of activities related to Transportation Demand Management. For example, 36 Commuting Solutions plays a pivotal role in the coordination and implementation of secure bike parking shelters at transit stations along the U.S. 36 corridor. Outside the specific areas covered by Way to Go partner agencies, DRCOG s Way to Go outreach specialists conduct employer and community outreach. As the population in the region continues to grow, more transportation management associations may be formed to address the need for Transportation Demand Management services. Various non-profit organizations also provide Transportation Demand Management products or services including, but not limited to: Bike Denver Community Cycles Boulder Valley School District Boulder B-Cycle Denver B-Cycle ego Carshare Groundwork Denver Transit Alliance WalkDenver Additionally, there are numerous other organizations, such as non-profit health, community and neighborhood organizations that collaborate with DRCOG and the transportation management associations on various Transportation Demand Management activities. DRCOG s Regional TDM Short Range Plan ( ) further discusses Transportation Demand Management participants, roles, responsibilities, and funding. DRCOG funds Transportation Demand Management programs, services, and activities through a competitive funding process in Transportation Improvement Programs every two years. 48 Chapter 4 Metro Vision Regional Transportation Plan System Components

57 The private sector also plays an important role in addressing travel choice options. Several carshare providers operate within the DRCOG region, with some having multiple programs for specific clientele, such as university students. Transportation network companies, more commonly known as ridesharing or ride-hailing services, such as Uber and Lyft, also operate within the region, and it is expected that additional such services will also enter the marketplace in coming years. All of these services and providers emphasize an on-demand, location-specific app-based approach where a user can use their smart phone to request a ride or reserve a carshare vehicle with real-time, location-based availability. Particularly promising for the potential to reduce congestion are enhancements to these platforms which will facilitate multi-passenger trips, dynamically or in a coordinated fashion from pick-up and drop-off points. Other apps specialize in delivery services, from groceries and food to more specialized products and services, potentially eliminating the need for certain trips (or more precisely, reducing consumer trips while increasing freight trips). The Sharing Economy The sharing economy, which includes several concepts, continues to rapidly evolve. For example, Uber and Lyft rides can be booked directly from the Google maps app. In 2016, Uber launched its Uber Eats food delivery service. Locally, RTD and Lyft started testing in 2016 a first/last mile pilot project to provide free Lyft rides within a defined service area to the Dry Creek light rail station in Centennial. These and many other examples illustrate the rapid changes in personal mobility options. The region s Transportation Demand Management program will continue to work with partners to incorporate these concepts as feasible. However, it is important to distinguish between travel choice options and single-occupant vehicle trip reduction strategies. The former, as important as they are, do not necessarily lead to the latter. In addition to the national companies offering app-based services, numerous stakeholders in the region are working towards solutions that make smart trip planning easier and more comprehensive. DRCOG s Way to Go program developed and launched a multi-modal trip planning and tracking tool, known as MyWayToGo.org in 2013, and in 2015, the City and County of Denver, in partnership with Xerox, launched GoDenver, a pilot program app which overlays multiple services, including transit and parking information, into one easy-to-use platform. Ongoing discussions center around an ambitious goal for the region to develop a one-stop shop application where residents can not only plan their trip, but reserve, hail or purchase every aspect of their chosen trip. Chapter 4 Metro Vision Regional Transportation Plan System Components 49
58 3. Transportation Demand Management Strategies a. Mobility Options to Single-Occupant Vehicle Travel The cornerstone of Transportation Demand Management is to provide and promote mobility options to reduce single-occupant vehicle usage through the following avenues: ridesharing programs and services (carpool, vanpool, schoolpool); transit service and amenities, and fare pass options; active transportation programs and infrastructure (walking, bicycling, Bike to Work Day, bikesharing, and bicycle and pedestrian facilities); carsharing and transportation network company options (Lyft and Uber) as first and final mile solutions. b. Changes in Work Travel Patterns Transportation Demand Management providers also promote and facilitate flexible employee work schedules, such as: Teleworking, or telecommuting, which involves working at home one or more days a week instead of commuting to and from work, and Alternative work schedules, including compressed work weeks and flex-time arrangements, such as starting work early or late to avoid peak hour travel. c. Incentives, Policies and Pricing Mechanisms to Encourage Travel Choice Options These strategies can encourage certain travel choice options and offer opportunities to save money and time: Transit fare subsidies or cash and merchandise incentive programs coordinated by Transportation Demand Management providers. Parking management strategies, such as preferential carpool parking spaces, shared parking serving multiple users or destinations, paid on-street parking, time limits for on-street parking, permit parking in residential neighborhoods, additional parking at transit station park and rides, and the reduction of parking minimums associated with development - especially for higherdensity development located near other transportation options. Location-efficient mortgages, qualify buyers for higher mortgage loan amounts when purchasing homes in close proximity to transit stations and high-service bus routes, since it s anticipated they will drive less and therefore have more to spend on housing. 50 Chapter 4 Metro Vision Regional Transportation Plan System Components
59 Guaranteed Ride Home programs, subsidized by an employer, which provides a free taxi ride home from the office for employees when personal emergencies arise. Road usage charges or vehicle miles traveled mileage fees (these fees would be paid by drivers in lieu of a gas tax, and are based on how much one drives). Mileage-based insurance or Pay-As-You-Drive Insurance, also a by-the-mile form of auto insurance, linking insurance premiums to vehicle miles of travel and rewarding low-mileage drivers with lower premiums. Trip Reduction Ordinances requiring developers, employers, or building managers to provide incentives for occupants or employees to use non-single-occupant vehicle modes of transportation ( d. Transportation Demand Management Strategies Related to Land Use One of the most influential elements in travel choice is development patterns, and the proximity of and connections to, an array of transportation options. There are many types of design strategies and principles that can encourage people to walk, bicycle, or take transit, including: Bicycle and pedestrian connections within, to, and from development; as well as to transit stops and stations; Comfortable transit stops and waiting areas; Pedestrian-friendly parking lots; Cut-through paths for bicyclists and pedestrians within subdivisions; Bicycle racks and secure bicycle parking; Urban centers throughout the region, including many in suburban and highway-oriented locations; Transit-oriented developments near rapid transit stations or other high-transit service locations; Mobility hubs, typically near transit and higher density development, offering an array of transportation options, especially to make first and final mile connections; The development of convertible parking garages. In the Denver region, forward-thinking developers anticipating a drastic reduction in future parking demand and are building parking garages in a way where they can be converted to other uses such as residences, offices, and retail. Chapter 4 Metro Vision Regional Transportation Plan System Components 51
60 E. Technology Technology offers great promise for reducing traffic congestion in the region as well as increasing personal mobility. Private, public and non-profit organizations are working to develop technologies to make choosing an efficient mode of travel more feasible. Technology that delivers real-time information to travelers is having a significant impact for commute and non-commute situations alike. Travelers and freight shippers can make better decisions with real-time information about how they travel (mode), when they travel (time), where and whether they travel (location), and which route they choose (path). Additionally, travel planning applications are incorporating multimodal options, and payment capabilities. Beyond these applications, emerging technologies such as connected and autonomous vehicles will undoubtedly change the way people and freight get around the region in the future. Numerous entrepreneurial companies are conceptualizing autonomous circulating vans or shuttles which could move people throughout the region quite efficiently, at least in theory. While it is difficult to predict which specific technologies or providers will prevail, there is a great deal of interest and momentum in the region to capitalize on these opportunities. DRCOG will continue to support and facilitate deployment of technology-related mobility solutions that benefit the region. 1. Connected Vehicles and Autonomous Vehicles Connected Vehicles is a set of technologies that allow a host of applications based on the sharing of data and information both between vehicles, known as vehicle to vehicle (V2V), and between vehicles and the roadway, known as vehicle to infrastructure (V2I). Federal research in these technologies have demonstrated safety, mobility, and environmental benefits. Results of this research, especially the prospect of crash reduction, has prompted the National Highway Traffic Safety Administration (NHTSA) to propose rules requiring vehicle-to-vehicle communications capabilities in new vehicles. This will provide the foundation for applications that assist drivers in avoiding crashes. Auto manufacturers are already including some of these applications in current vehicles. Autonomous Vehicles take the technology integration with the vehicle a step further and provide the vehicle with the capability to not only detect its surroundings, but directly operate the vehicle independent of a human operator. The auto and truck industry, along with federal regulations, will facilitate the deployment of connected and autonomous vehicles. It does represent a great opportunity for local governments, CDOT, and other 52 Chapter 4 Metro Vision Regional Transportation Plan System Components
61 transportation system operators. Vehicles equipped to communicate with each other can also communicate with the infrastructure. This means such vehicles will serve as another source of probe data and, in select cases, the network and vehicle operations can automatically react to roadway conditions. This will require the deployment of an extensive connected vehicle environment (including on-site field devices, communications infrastructure, and backend data collection, management, and monitoring services). Both CDOT and the City and County of Denver have made commitments to develop a connected vehicle environment and implement suitable applications that benefit the traveling public. Primarily, these will include applications related to safety and mobility. This will help current and future vehicles talk to each other (vehicle-to-vehicle), roadways (vehicle to infrastructure), and to transit. Some of these applications will be implemented through such programs as CDOT s RoadX, Denver s Advanced Transportation and Congestion Management Technologies Deployment (ATCMTD) grant from the U.S. Department of Transportation. Since technology is rapidly evolving, transportation systems operators and planners must be nimble to implement such technologies while also looking at longer term requirements, costs, and impacts. More detailed descriptions of system management and operations improvements are contained in the Denver Regional Transportation Operations Improvement Program. Chapter 4 Metro Vision Regional Transportation Plan System Components 53
62 F. Safety Between 2006 and 2013, the Denver region saw an annual average of 186 deaths and 1,759 serious injuries. The same time period saw an annual average of about 61,100 reported vehicle traffic crashes. Table 4.1 shows fatalities, serious injuries, and total crashes for the DRCOG region for the most recent years of available data for each category. As the table notes, fatalities come from the national Fatal Analysis Reporting System (FARS), available through The remaining data are collaboratively calculated by DRCOG and CDOT based on GIS analysis of crash locations and accompanying database of crash characteristics and attributes. Table 4.1: DRCOG Region Summary Safety Data Fatalities (1) Serious Injuries (2) 1,938 1,810 1,772 1,670 1,604 1,670 1,756 1,850 Total Crashes (3) 66,694 63,812 59,634 58,240 57,713 59,376 59,253 64,074 (1) Source: Fatal Analysis Reporting System (FARS), NHTSA (2) Source: CDOT-DRCOG crash database (3) Source: CDOT-DRCOG crash database; includes fatal, serious injury, and all other crash types Traffic crashes result in economic loss from damaged vehicles and goods, personal pain and suffering due to injury, and, occasionally and catastrophically, in loss of life. Crashes are also a major cause of congestion. DRCOG prepares two reports addressing safety at the regional level: The Report on Traffic Crashes in the Denver Region describes traffic safety issues within the region and provides information on crash mitigation strategies. DRCOG updates this report periodically as new crash data becomes available; the most current report was completed in late The Pedestrian and Bicycle Safety in the Denver Region report analyzes collisions in the Denver region between motor vehicles and pedestrians and bicyclists, and identifies mitigation strategies to prevent or reduce pedestrian and bicycle crashes. DRCOG typically updates this report in tandem with the regional crash report. The next version of this report will be completed as part of the DRCOG s Active Transportation Plan. 1. Safety Background Motor vehicle crashes are the most common safety concern regarding the transportation system. The region will continue implementing efforts to physically improve facilities to reduce the likelihood and severity of crashes. Even stronger efforts will be made to reduce the human errors that are the primary 54 Chapter 4 Metro Vision Regional Transportation Plan System Components
63 cause of about 80 percent of the crashes in the Denver region. Regional communities and lawmakers evaluate and consider law enforcement and legislative actions which address transportation safety, including: Drunk driving laws; Distracted driving laws; New driver licensing procedures; Photo enforcement of speeding and red-light running; Safety inspections; Work zone and aggressive driver laws; Commercial vehicle rules and regulations; Enforcement of bicycling and pedestrian laws, and Passenger restraint (seat belts and child safety seats). Past advancements in safety improvements within vehicles, such as air bags, have helped reduce vehicle occupant fatality rates. Future technologies, such as vehicle-to-vehicle communication warning systems, hold promise for further reductions to both in-vehicle and out-of-vehicle pedestrian and bicyclist fatalities. DRCOG staff works cooperatively with CDOT to annually geocode crash locations on off-system (nonstate) roadways (CDOT geocodes on-system crashes). DRCOG provides crash data for the entire region on its Regional Data Catalog and Denver Regional Visual Resources (DRVR) sites. 2. Federal Safety Emphasis Areas and Targets CDOT s 2014 Strategic Highway Safety Plan (SHSP) identifies nine emphasis areas to help direct the state s resources, and organize stakeholders into teams which concentrate on a strategic problem area and produce an achievable action plan. The SHSP also notes the Federal Highway Administration s (FHWA s) guidance that emphasis areas should reflect the greatest potential for reducing fatalities and injuries. The SHSP s nine emphasis areas are: Aging road users (65+); Bicyclists and pedestrians; Data; Impaired driving; Infrastructure rural and urban; Chapter 4 Metro Vision Regional Transportation Plan System Components 55
64 Motorcyclists; Occupant protection; Young drivers (ages 15-20), and Distracted driving task force. The SHSP does not include goals for each emphasis area, noting that teams for each emphasis area will meet after plan launch with subject matter experts to set fatality and serious injury targets. The 2014 SHSP does include a MAP-21 performance based safety target of reducing fatalities from 548 in 2008 to 416 by Unfortunately, in 2015 (the most current data available), there were 545 fatalities statewide, a ten percent increase from the 488 fatalities in Chapter 6 further discusses DRCOG and CDOT planning for MAP-21/FAST Act performance based safety targets. 3. Safety Improvements DRCOG, CDOT, and local governments routinely analyze crash data to identify roadways and intersections with a high number or rate of crashes. Stand-alone safety projects are then identified and implemented, with many physical safety improvements built as a component of a larger project. Safety elements of candidate projects and existing facility crash rates are also considered during project evaluations for Transportation Improvement Programs. Key types of physical safety improvements will include, but are not limited to the following examples: Upgrading barriers in freeway medians and between freeways and frontage roads; Installing and upgrading traffic control devices such as traffic signals; Improving facility geometrics (hills, curves, and sideslopes); Building auxiliary lanes for entering and/or departing traffic; Constructing hill-climbing lanes for slow-moving vehicles, especially in the mountainous area; Constructing pedestrian overpasses and underpasses; Constructing protected, off-street, or similar pedestrian and bicycle facilities; Installing fencing along busy railroad and light rail lines; Improving sight distances at intersections, and Removing fixed objects adjacent to travelways or providing proper protection. Transportation facilities must also be well-maintained to preserve good safety performance. Key maintenance activities include: 56 Chapter 4 Metro Vision Regional Transportation Plan System Components
65 Repainting pavement and crosswalk markings and replacing non-reflective signs; Removing debris along roadways, sidewalks, and multipurpose trails; Mitigating existing and potential future rock falls and mudslides; Trimming vegetation that impacts sight distances; Removing snow and ice; Replacing non-reflective signs and maintaining other traffic control devices; Repairing uneven manhole covers and replacing drainage grates; Repairing buckled sidewalks; and Removing permanent (e.g., utility poles) or temporary (e.g., construction materials) obstructions on sidewalks. G. Aviation Air transportation is an important element of the regional transportation system. It is critical to the regional and statewide economy. Tourists, business professionals, air cargo shippers, and many other people depend on airports for their livelihood and quality of life. CDOT s Division of Aeronautics is responsible for overall aviation planning in Colorado, with a primary tool being the Colorado Aviation System Plan (CASP) 2011 Technical Report update. The CASP covers the state s system of airports, including those in the Denver region, except for Denver International Airport (DIA). The Denver region s airport system is comprised of one air carrier airport (DIA), one military, four reliever, and two general aviation airports (Figure 4.4). The region s only military airport is Buckley Air Force Base (AFB). Buckley AFB hosts the 460 th Space Wing, which directly supports Combatant Commands around the world. Additionally, Buckley AFB also hosts the 140 th Wing of the Colorado Air National Guard, the Navy Operational Support Center, the Aerospace Data Facility-Colorado, the Army Aviation Support Facility, and the Air Reserve Personnel Center. The base currently (2016) includes 3,100 active duty members from every service, 4,000 National Guard personnel and reservists, four commonwealth international partners, 2,400 civilians, 2,500 contractors, 36,000 retirees, and approximately 40,000 veterans and dependents. The region s four reliever airports are Centennial, Erie Municipal, Front Range, and Rocky Mountain Metropolitan airports. Centennial, Front Range, and Rocky Mountain Metropolitan airports provide most of Chapter 4 Metro Vision Regional Transportation Plan System Components 57
66 the region s corporate air traffic capacity. Boulder Municipal and Vance Brand are the region s two general aviation airports. To accommodate peak period traffic, airports normally consider capacity expansion when they reach 60 percent of design operational capacity. According to the CASP, only one of the region s airports (excluding DIA) is forecast to reach this milestone by 2030; Centennial Airport will reach 70% capacity. According to the CASP: Previous studies indicated that Centennial Airport s ability to increase its operational capacity was largely limited to additional or high speed taxiway exits; since the completion of the 2005 system plan, these high speed taxiway exits have been developed. As noted in Chapter Three of this study, Centennial s annual operational levels have decreased. The demand/capacity ratio at this airport should continue to be monitored; but at this point, there are no additional recommendations related to increasing operational capacity at this airport. DIA will continue to be the most important transfer point in the state for air passenger traffic, providing connections to national and international destinations. In 2016, the airport served 58.2 million passengers and moved 546 million pounds of cargo (2015). DIA s latest aviation forecast is that the airport will handle over 95 million passengers in Denver is the fifth-busiest airport in the United States by passenger volume and 15 th busiest in the world. Additionally, about 35,000 people work at the airport. On an average day, DIA sees almost 160,000 passengers. In 2016, 65 percent of boardings were passenger trips beginning or ending at DIA, meaning that about 104,000 passengers travel to or from DIA to begin or end an airline trip; the remainder were people making connections. Passengers and workers travel to DIA by car, commuter rail, buses, hotel shuttles, rental car shuttles, taxis, transportation network companies, and other modes. Moving people efficiently to and from DIA is of critical regional importance. RTD s East Rail Line from Denver Union Station to DIA opened in 2016 with two rail stations along the Pena Boulevard corridor and one station at the airport terminal. DRCOG s 2040 Metro Vision Rapid Transit System (Figure 6.5) shows a potential unfunded Tier 2 intercity transit corridor along E-470, and along Pena Boulevard from E-470 to the DIA terminal. Both components reflect CDOT s current long-range vision for potential intercity passenger rail. The 2040 MVRTP (Chapter 5) also includes a roadway widening project along Pena Boulevard between I-70 and E-470. Access to the region s other airports is also an important issue. As shown in Figure 4.4, all of the region s airports are close to major highways, roadways, or transit rail lines. 58 Chapter 4 Metro Vision Regional Transportation Plan System Components
67 Figure 4.4: Airports Serving the Denver Region Chapter 4 Metro Vision Regional Transportation Plan System Components 59
.")

68 CDOT s CASP addresses future facility expansion and other recommended projects and actions for the region s and state s general aviation airports. For DIA, its master plan lists several long range projects for the period (as well as several shorter-range projects). Representative long-range projects include: Extending existing and construct new runways; Replacing airport traffic control tower; Expanding existing and construct new passenger terminal buildings; Extending Concourses A, B, or C; Relocating surface parking facilities and airport maintenance facilities; Constructing consolidated car rental facility; Constructing landside automated people mover; Constructing landside roadways, and Expanding cargo and support facilities. DIA s master plan notes that many of these projects are planned to be completed incrementally as demand warrants, and could be advanced, deferred, or otherwise revised over time. H. Freight and Goods Movement The efficient movement of freight, goods, and packages is extremely important to Colorado and the Denver region s economy. Items are moved by railcars, Freight customers and trucks, vans, airplanes, and pipelines. They move to, from, economics drive the market and within and through points in the region. Major multimodal locations where freight moves. terminals transfer large amounts of cargo between the Freight Forum at DRCOG various travel modes and trucks. Most freight facilities and terminals are concentrated near freeways and major regional arterials. Local deliveries and pickups to and from businesses in the area depend on the reliability of the regional and local roadway systems. Appendix 5 contains the freight and goods movement component of the MVRTP. It was prepared in close coordination with, and with extensive input from, industry and other stakeholders. The freight and goods movement component addresses the following topics in detail: Introduction and freight background; Federal freight requirements and guidance; Current freight planning efforts and stakeholder input; 60 Chapter 4 Metro Vision Regional Transportation Plan System Components
69 Freight network and facilities (trucks/roadways, commercial vehicles, safety, railroads, multimodal terminals, air cargo, pipelines, at-grade railroad crossings, warehousing, hazardous materials); Freight commodity flow data; MVRTP freight-related transportation improvements; Operations and technology; Air quality, and Other topics. I. Transportation System Management and Operations Improvements The general public is often unaware of the many critical day-to-day aspects of operating and managing the region s transportation system. Snowplowing, emergency response, driving a bus, monitoring traffic, and repairing traffic lights are just a few examples. The overall focus of transportation system management and operation (TSM&O) strategies is to safely provide more reliable trip travel times and reduce delays faced by drivers, passengers, and trucks on the roadway and transit system. The strategies also have a positive impact on safety and air quality. To make the best use of the 2040 regional transportation system, both roadway operational improvements and system management and operations strategies will be implemented. 1. Roadway Operational Improvement Projects Roadway operational improvement projects are generally low to moderate in cost and do not add significant new capacity to the system. These improvements have cost-effective delay reduction, traffic flow, and safety benefits. Unique strategies will be applied to freeways and arterials on the regional roadway system. Freeways Major projects planned to rehabilitate and upgrade freeways will correct many operational bottlenecks. Stand-alone roadway operational improvement projects will be implemented at other locations. The following features will be pursued at appropriate locations: Paved shoulders to allow vehicles that are stalled or involved in minor incidents to be moved quickly out of the way and provide maneuvering space around the incident site; Improved and strengthened shoulder pavement to support bus-on-shoulder or managed lane operations; Chapter 4 Metro Vision Regional Transportation Plan System Components 61
70 Paved areas to allow trucks and other vehicles to install or remove chains during snowstorms; Continuous acceleration/deceleration lanes between closely spaced interchanges to allow for smoother integration into and out of traffic, with decreased potential for crashes; Hill-climbing lanes in areas where steep grades and slow-moving vehicles cause congestion, and HOV bypass lanes at metered on-ramps to expedite flow of buses and carpools. Arterials On the arterial network, roadway operational improvement projects will address congestion due to intersection designs, at-grade railroad crossings, and poorly managed access to and from arterials. All users of the roadway system, including pedestrians and bicyclists, must be considered in the planning, design and implementation of operational improvements. The following strategies are appropriate: Intersection treatments such as increased curb radii to accommodate buses and trucks, multiple left-turn lanes, right-turn lanes, and additional side-street lanes. Improvements to reduce transit travel delay in corridors with high levels of bus service, including treatments such as transit queue jump/bypass lanes, adjustments to lane-channelization devices, bus bulbs, and relocation of and enhancements to bus stops; Access management projects, such as medians to control left turns, consolidation of roadway access points, side and rear access points between developments, reconstruction of driveways for proper width and gradient, and acceleration and deceleration lanes for turning traffic; Lane reconfigurations on urban roadways and signalized intersections to provide bike lanes; Shoulders on rural roadways to accommodate bicyclists, disabled vehicles, and vehicles that drift off the travel lanes; Improved shoulders on select roadways to accommodate bus-on-shoulder operations, and Grade-separated bridges and underpasses for railroad tracks (see Appendix 5) and coordinated highway-rail interface systems and other operational improvements for at-grade crossings. 2. System Management and Operations Improvements Personnel, technology and defined procedures are necessary to manage the regional transportation system to efficiently utilize the available capacity. System management and operations improvements and actions are largely supported and enabled by Intelligent Transportation Systems (ITS) technology tools and systems that facilitate and implement desired operations and processes. 62 Chapter 4 Metro Vision Regional Transportation Plan System Components
71 A key to applying these improvements is integrating them as elements of all physical roadway improvements. Appropriate planning and design will include consideration for system management and operations, making it an integral part of all major road construction, such as new road, widening, and reconstruction, and rapid transit projects. For example, CDOT recognizes this fact when it adopted its Managed Lanes Policy Directive that requires the development of capacity improvements to consider implementation of managed lanes. Across the region, system management and operations improvements to be pursued include: Region-wide Improvements Surveillance systems (e.g., roadway detection systems, video camera systems, and probe surveillance) deployed on or along freeways, arterials, and transit vehicles and facilities and supplemented with crowd-sourced data to monitor travel conditions; Incident management systems and processes implemented consistently, to minimize incident duration, reduce first responder risk, improve traveler safety, and reduce the resulting traffic congestion; Data sharing systems to improve awareness of regional transportation network conditions. This involves the interconnection of systems operated and maintained by both public and commercial entities. Systems should include an integrated transportation operations display to enable complete awareness of network conditions to operators in traffic, transit, emergency management, and traveler information centers. Transportation operators will be better able to coordinate management and response activities; Integrated systems that disseminate real-time multimodal traveler information data, including: speed/travel time, incidents, special events, construction/work zone details, weather conditions, alternative travel options and pricing, and parking availability and pricing. This will be done through a variety of media including: dynamic message signs, highway advisory radio, commercial media, in-vehicle equipment, kiosks, smart phones and websites; and partnerships with traveler information service providers; A regional transportation data warehouse that collects and stores transportation data from multiple sources in the region mainly for performance monitoring and transportation planning, and Variable pricing schemes which charge higher fees during periods of highest demand can help manage demand for using tolled highway or managed lane facilities; other transportation services, Chapter 4 Metro Vision Regional Transportation Plan System Components 63
72 and parking districts. Each may be implemented individually, but are most effective in influencing travel choice when coordinated regionally. Freeway Operation Improvements Ramp meters to manage the rate at which vehicles merge onto the freeway with less disruption and likelihood of triggering congested conditions. CDOT currently operates a ramp metering system in the DRCOG area and is exploring the implementation of a more advanced system Management Motorway System; Freeway towing and courtesy patrols services will operate along many of the region s freeways in support of incident management processes; Active Traffic Management (ATM) involves active monitoring and dynamically managing freeway traffic based on prevailing and predicated traffic conditions. The current example in the region is the implementation of dynamic lane use control, dynamic speed management and queue warning on US 36 along with the managed lanes and bus-on-shoulder implementation; and, Electronic toll collection using a common technology to provide users of toll facilities, managed lanes and parking facilities an easier form of payment. Arterial Operation Improvements Traffic signal systems that facilitate synchronization of traffic signals, operation of coordinated timing plans across jurisdictional boundaries, and monitoring of system devices; Traffic-responsive, traffic-adaptive, and other advanced traffic signal control strategies on select corridors with variable real-time conditions that cannot be adequately served by pre-set, time-ofday operations; Transit signal priority treatments operated in corridors with high levels of RTD s Limited class of bus service and long series of regularly-spaced signalized intersections to help keep buses on schedule; Bus-on-shoulder facility treatments and service; Coordination of signalized intersection operations with railroad grade crossings and freeway ramp meters, and, Coordination between traffic signal systems and emergency management centers and vehicles to effectively route responders around delays. 64 Chapter 4 Metro Vision Regional Transportation Plan System Components
73 Transit Operation Improvements Transit vehicle tracking equipment, automated passenger counting equipment, and schedule assessment software to allow transit managers to dictate schedule adjustments or allocate fleet resources in response to real-time traffic, passenger demand, and vehicle availability conditions; Electronic collection of transit fares and parking fees; Coordination with roadway operations systems to provide bus-on-shoulder operations and transit signal priority; and, Parking facility management to inform drivers and transit riders of park-n-ride lot parking space availability and alternatives. J. Transportation Security The security of the transportation system is an important expectation of its users. Although this is especially significant for air travel and transit facilities with respect to terrorist-based security risks, security of the general transportation system from both terrorism and natural hazards is also an important consideration for emergency management to ensure the transportation system s resiliency. Improved transportation security is an important Metro Vision objective. Under Executive Order, all-hazard emergency management regions were established across Colorado to improve inter-jurisdictional communication and coordination for emergency preparedness and response. The North Central All-Hazards Emergency Management Region, which largely encompasses the DRCOG region, is the body with responsibility for security planning, training, and exercising. Consequently, DRCOG conducts traditional MPO planning activities with respect to security planning and coordination. DRCOG staff actively participate in applicable committees to assist with information provision and coordination between emergency management planning and related transportation planning efforts. DRCOG also considers security issues when evaluating large-scale projects for inclusion in fiscally constrained regional transportation plans and TIPs. Geographic proximity to higher security risk facilities identified in the Regional Transportation Plan (for example: military facilities, large freight or passenger intermodal terminals, and airports) is an important consideration in the MPO planning and programming process. Other security-specific transportation system projects using federal funds are also carried through the MPO committee and planning process for inclusion in the TIP. For example, the Regional Transportation Operations Pool funds projects that directly and indirectly improve situational awareness of the transportation network, consequently improving transportation security. Chapter 4 Metro Vision Regional Transportation Plan System Components 65
74 There are four key phases to emergency management that operate in a continuous cycle: Planning and preparedness Mitigation and prevention Response Recovery The transportation system is recognized as a critical resource to support emergency response and recovery. The transportation community has an equally significant role to assist in preparedness and prevention as it pertains to protecting the transportation system. Several aspects of security incidents which must be planned for include prevention measures, response plans, coordination and communication protocols, monitoring, and information distribution. 1. Transportation Security Partners A connected multimodal region requires interdepartmental and interagency coordination and data sharing. This can also open the security of the infrastructure to a greater risk, which increases the complexity of transportation security requirements. Numerous agencies at different levels are involved and defined as follows: Federal Agencies U.S. Department of Homeland Security sets policy and regulations and provides grant funding administration o Federal Emergency Management Agency directly involved in planning (i.e., National Incident Management System, National Preparedness Goal, etc.), response, and recovery phases o Transportation Security Administration (airports) directly involved in prevention and response phases o National Protection & Programs Directorate (cybersecurity) directly involved in planning, prevention, and response phases U.S. Department of Transportation provides transportation security planning guidance State Agencies Colorado Department of Public Safety o Colorado State Patrol directly involved in planning, prevention, response and recovery phases, 66 Chapter 4 Metro Vision Regional Transportation Plan System Components
75 o Division of Homeland Security and Emergency Management Homeland policy set by Security & All-Hazards Senior Advisory Committee and Colorado Emergency Planning Commission Office of Preparedness directly involved in planning and prevention; direct coordination with All-Hazards Emergency Management Regions Office of Emergency Management directly involved in response and recovery phases; direct coordination and assistance to All-Hazards Emergency Management Regions Office of Prevention and Security focused on prevention phase Colorado Information Analysis Center data fusion center to establish and distribute collective security situational awareness Critical Infrastructure Protection Section identifies critical infrastructure, evaluates security status and makes protection recommendations o Division of Fire Prevention and Control directly involved in planning, response and recovery phases Colorado Department of Regulatory Agencies o Public Utility Commission oversight of transit security plans (Colorado state requirement) Colorado Department of Transportation directly involved in planning, prevention, response, and recovery phases Governor s Resiliency and Recovery Office focused on recovery phase, which is also reflected in planning Governor s Office of Information Technology (cybersecurity) directly involved in planning, prevention, response, recovery phases Regional Agencies North Central All-Hazards Emergency Management Region (NCR) The purpose of this entity is to improve regional preparedness and response through planning, training and exercising. The NCR also has responsibility for management of the State Homeland Security Grant Program within the region. In these roles, the NCR directly interfaces the state Offices of Preparedness and Emergency Management with local counties and jurisdictions emergency management staff and other critical emergency management partners. Another important function of the NCR is to disseminate security information in a timely manner to all agencies within the region. Chapter 4 Metro Vision Regional Transportation Plan System Components 67
76 A key partner to the NCR is the Denver Urban Area Security Initiative (UASI), funded through the DHS to enhance regional preparedness in major metropolitan areas throughout the United States. The two groups have integrated efforts, forming joint committees to conduct planning, programming and training activities jointly. Their committee structure is organized around the 32 Core Capabilities of the National Preparedness Goal. The North Central Region Homeland Security Strategy ( ), its joint strategic plan, highlights two critical activities related to transportation security: improved communications between emergency management and transportation/public works partners; and, completion of the mass evacuation plan for the region. County/Local Emergency Managers Members of the NCR, the Denver UASI, and DRCOG, these stakeholders have direct responsibility for planning, prevention, response, and recovery phases. Regional Transportation District (RTD) Major agency responsible for transit security planning, prevention, response, and recovery phases. DRCOG Fulfilling the traditional MPO role, DRCOG coordinates between emergency management and transportation planning, addressing transportation security elements as part of the existing regional transportation planning and transportation improvement planning processes. 2. Transportation Security Improvements The security of transportation users, facilities and property will be improved through specific projects and activities such as: Security cameras on transit vehicles, at park-and-ride lots, at transit stations, at major bus stops, on other transit properties, and in all public and secure areas at airports Screening and security measures at airports Security cameras and other sensors on critical roadway infrastructure Patrol and monitoring of roadways, transit facilities, and airports by law enforcement and private security personnel Training of transportation staff to expand monitoring of transportation infrastructure security Commercial vehicle, railroad vehicle railroad tracks, and freight inspections Implementation of cybersecurity network monitoring systems and processes Hazardous materials monitoring and tracking systems and processes 68 Chapter 4 Metro Vision Regional Transportation Plan System Components
77 In addition, the regional transportation operators have day-to-day responsibilities to assist and support emergency management through: Day-to-day cooperation with the Colorado Information Analysis Center Monitoring roadway and traffic conditions and implementeng traffic flow adjustments, as requested, to respond to and recover from security and hazard events Distributing emergency management event information, as directed, through the existing traveler information infrastructure Monitoring roadway critical infrastructure and cybersecurity network systems and coordinating with security partners in response and recovery Deploying transportation-focused incident commanders to directly support overall emergency event incident commanders The DRCOG region has been affected by and is susceptible to many types of natural disasters, such as: Snowstorms Flooding (river or creek floodplains, urban roadways) Drought Wildfires Rock falls and landslides Tornados Lightning and power outages Of particular note are the disastrous 2013 floods that affected Boulder, Adams, Jefferson, and Weld Counties within the DRCOG region. To promote resiliency in the regional transportation network, DRCOG expedited the flow of federal funds through its Transportation Improvement Program for flood relief projects and participated in briefings and other coordination task force efforts focused on flood recovery. Every county in Colorado has prepared a Multi-Hazard Mitigation Plan, coordinated through the Colorado Division of Homeland Security and Emergency Management. As an example, the Jefferson County plan notes: Since 2007, Emergency Management has worked with caregivers of those with special needs to create and exercise emergency plans. These trainings have been held for group homes, nursing homes, and assisted living facilities within the county. Additionally, the Colorado Department of Local Affairs completed the Colorado Disaster Housing Plan in 2011 and published the Planning for Chapter 4 Metro Vision Regional Transportation Plan System Components 69
78 Hazards: Land Use Solutions for Colorado guide and website to help local governments prepare for disasters and reduce risks. K. Asset Management and System Preservation In recognition of the region s considerable investment in the multimodal transportation system, managing and preserving facilities is increasingly important. The transportation system, including roadways, transit system, sidewalks, and other components, naturally deteriorates due to use, time, and especially climate (freeze-thaw cycle). Roadway and bridge deterioration is strongly related to use, especially by heavy trucks. The condition of transit buses declines quickly because of the hundreds of thousands of miles they travel in stop-and-go conditions. Sidewalks and multipurpose trails deteriorate through seasonal cycles, tree root growth, and other factors. 1. Roadway System and Bridge Preservation According to CDOT s annual bridge condition inventory data, in 2014, about one percent of bridges in the DRCOG region that carry vehicular traffic were rated as structurally deficient, and 36 structures in the region had a sufficiency rating below 50 on a scale of 100. By 2040, less than one percent of the region s bridges will be structurally deficient or functionally obsolete. Since 2009, the state Funding Advancements for Surface Transportation and Economic Recovery (FASTER) program has allowed CDOT to improve roadway safety, repair deteriorating bridges, and support and expand transit. Accordingly, bridge sufficiency ratings continue to improve. Additionally, of the more than 4,171 lane-miles of state highways in the DRCOG region, approximately 22 percent have a poor surface condition. Over the life of the MVRTP, major reconstruction projects will be needed in most corridors of the region, and costs are steadily rising. For example, many freeways and arterials are so heavily used during daylight hours that lane closures for repairs are acceptable only at night. However, night work increases construction costs. In many locations, the complete reconstruction of major facilities is most feasible if the roadway is being widened, as new and permanent pavement may serve as a construction detour while the old pavement is removed and replaced. The 2040 FCRTP assumes that many older roadways targeted for additional through lanes will be reconstructed coincident with adding that capacity. To optimize system preservation activities, the MVRTP embraces the performance-based asset management philosophy being implemented by the region s transportation partners (DRCOG, CDOT, and RTD) and other stakeholders of collecting asset condition information regularly over time, and analyzing that data to optimize and prioritize actions. CDOT, for example, has developed a pavement management 70 Chapter 4 Metro Vision Regional Transportation Plan System Components
79 system, while RTD is responsible for State of Good Repair asset management and system preservation activities for its system (see below). Local governments maintain their streets and accompanying sidewalks as well as off-street multi-use trails. Chapter 6 discusses asset management and system preservation from a performance-based planning perspective in more detail. 2. Transit System Preservation Maintenance of transit stations, on-street boarding stops and vehicles is critical to passenger comfort and transit service reliability. Stations or vehicles in poor condition (e.g., torn seats, broken wheelchair lifts, or poor temperature control) affect the comfort and accessibility of transit patrons. On-street boarding locations that fall into disrepair with uneven or missing pavements affect safety and accessibility. Vehicle breakdowns may cause severe hardships to transit patrons, affecting future ridership. Maintenance of transit operational facilities including park-n-ride lots, rail lines, bus-only travel ways, and ramps is critical to their long-term serviceability. Poorly maintained tracks, electrical and signal systems, or pavement may damage vehicles or cause slower operations. In the case of park-n-ride lots, where private vehicles use the site as well as transit vehicles, deteriorating conditions affect a facility s use, and therefore transit ridership. As discussed in Chapter 6, RTD is initiating State of Good Repair Dashboard reports to provide reliable, timely, and data-driven information concerning the performance, condition, and age of RTD s assets. RTD will use several measures to assess its rolling stock (vehicle) assets. 3. Pedestrian and Bicycle Facility Preservation Communities in the Denver region have invested heavily in sidewalks, roadway bicycle treatments, and an extensive multipurpose trail system. Maintenance of these facilities is needed for the comfort, safety, retention, and growth of users. Tree roots, utility construction, and normal weathering can greatly impact the condition and long-term life of sidewalks and bike paths. Roadway curb and gutter areas adjacent to where bicyclists tend to travel often deteriorate more quickly than the primary travel lanes. This can create dangerous situations that force bicyclists to quickly maneuver around hazards. The Americans with Disabilities Act (ADA) requires that streets and roadways be brought up to full ADA standards whenever they are widened or reconstructed to include proper sidewalks, curb ramps, and other elements. Local governments in the Denver region and other receipts of federal funds have created ADA transition plans to address ADA transportation needs and investments over time. Chapter 4 Metro Vision Regional Transportation Plan System Components 71
80 L. Conclusion The Denver region s transportation system consists of a multimodal network of integrated regional transportation facilities and services that work together to expand access and mobility for people, goods, and services. System facilities and services are provided by both public and private entities. The estimated total cost to implement, operate, and maintain the complete Metro Vision transportation system from 2016 to 2040 is $152.5 billion. This chapter provided a detailed profile of each component of the region s multimodal transportation system, describing facilities, services, usage, trends, and key issues. 72 Chapter 4 Metro Vision Regional Transportation Plan System Components
81 FISCALLY CONSTRAINED RTP FINANCIAL PLAN Introduction This chapter documents the process, assumptions, data, and results for the financial plan component of the 2040 Fiscally Constrained Regional Transportation Plan (2040 FCRTP). The three key steps in completing the 2040 FCRTP financial plan were to: 1. Estimate revenues expected to be available through 2040, 2. Define system category expenditure needs, costs, and revenue allocations; and 3. Evaluate and prioritize regionally significant projects DRCOG worked cooperatively with CDOT, RTD, planning partners and other stakeholders through the MPO planning process to develop the 2040 FCRTP financial plan described in this chapter. Approximately $106 billion is expected to be available from 2016 through 2040 to manage, operate, preserve, maintain, and expand the DRCOG region s multimodal transportation system (unless noted otherwise, all values presented in this chapter are shown in constant year [2015] dollars). The unconstrained future (Metro Vision) transportation system would cost over $150 billion through The financial plan indicates that the 2040 FCRTP, covering the period , is fiscally constrained. The 2040 FCRTP is fiscally realistic, incorporating regional coordination and decisionmaking to balance system operations, preservation, and maintenance with strategic investment in multimodal capacity projects to accommodate 1.2 million more residents and half a million more jobs by The 2040 FCRTP uses reasonably anticipated revenues to cover project and system costs as agreed to by DRCOG, CDOT, and RTD through the metropolitan transportation planning process. Table 5.1 summarizes fiscally constrained total transportation system costs and revenues. As shown, total costs and revenues are approximately $106 billion in constant dollars and about $141 billion in year of expenditure (YOE) dollars. The remainder of this documentation explains how these revenues and costs were developed. Chapter Fiscally Constrained RTP Financial Plan 73
82 Table 5.1: 2040 Fiscally Constrained RTP Costs and Revenues A. Background The 2040 FCRTP classifies transportation expenditures into two broad areas: system categories, and regionally significant projects for air quality conformity purposes. System category expenditures are allocations to categories that are not project specific in the 2040 FCRTP, but rather address broad areas of need. Examples include system preservation, base transit service, roadway operations, and bicycle/pedestrian facilities. Non-regionally significant projects are not identified in the 2040 FCRTP. Rather, estimated total expenditure amounts are listed by system category, and constrained by available revenues, through Actual projects in these categories are initiated by project sponsors through the short-range Transportation Improvement Program (TIP) process (if seeking federal funds) or local agency capital improvement programs or budgets for nonfederally funded projects. TIP decisions for federally funded projects within the Transportation Management Area (TMA) are made by the multi-agency regional planning process led by DRCOG. Outside the TMA, funding decisions are made by CDOT, with DRCOG input, through the Statewide Transportation Improvement Program (STIP). In contrast, regionally significant projects are major roadway, interchange, and rapid transit projects that considerably change the capacity of the transportation network. Examples of regionally significant projects include: Roadway capacity: Adding (or removing) at least one continuous through-lane-mile on the designated Regional Roadway System, such as widening a roadway from two lanes to four lanes. Interchange capacity: Building a new interchange, adding a missing movement to an existing interchange, or upgrading a diamond arterial-freeway interchange by adding flyover ramps. Examples of the latter include the flyover ramps added to the South Santa Fe Drive interchanges with I-25 and C Chapter Fiscally Constrained RTP Financial Plan
83 Rapid transit capacity: Constructing a rapid transit corridor/segment or transit station, such as FasTracks. Regionally significant projects must be listed individually in the RTP by air quality staging completion period ( , , or ). The transportation networks containing these projects must be modeled to demonstrate compliance with federal air quality conformity requirements. These projects are listed in Appendix 4 and discussed and illustrated in Chapter 6. B. Financial Plan Preparation Process This section describes the process to develop project costs, revenues, allocations, and expenditure assumptions underpinning the 2040 Fiscally Constrained RTP. The 2040 FCRTP was based on the 2035 MVRTP and the process used to prepare it. Several steps were taken to update the 2040 FCRTP financial plan as described below. 1. Revenues DRCOG, in coordination with CDOT, RTD, local governments, special districts and authorities, paratransit operators, and various special funding agencies, estimated total revenues available for transportation purposes. The financial analysis covers the 25-year period of 2016 through 2040 and includes federal, state, local, and private revenues. Table 4 later in this chapter also shows revenues in year of expenditure dollars. With inflation, revenues and costs presented in year of generation or expenditure are always larger than when presented in constant current dollars. A factor of 1.33 was used to inflate most constant year revenues to year of expenditure. This factor is based on CDOT s 2035 Resource Allocation Key Rates and Factors calculations, which incorporates Consumer Price Index (CPI) and Colorado Construction Index (CCI) rates and was used for the 2035 MVRTP. The 2035 version included annual escalation rates for the 2008 to 2035 period. DRCOG worked with CDOT to update the annual escalation rate calculations for the period 2015 to The updated annual escalation rates ranged from 1.00 (2015) to (2040). The cumulative average of the annual rates from 2015 to 2040 is This factor represents a mid-point average of the period recognizing the inherent uncertainty of when and which specific revenues will be expended on specific projects or system categories during the 25-year RTP period. This approach was used for consistency rather than attempting to customize inflation factor assumptions for individual revenue sources. While CDOT s program distribution process calculates revenues in both constant year and year of expenditure dollars, this information was not finalized until after the 2040 FCRTP financial plan was completed. DRCOG s inflated (year of expenditure) revenues Chapter Fiscally Constrained RTP Financial Plan 75
84 are consistent with CDOT s program distribution calculations and are generally more conservative by revenue source. RTD primarily uses the year of expenditure approach, but worked with DRCOG staff to generate constant dollar estimates for FasTracks and other transit revenues (and costs). Because all FasTracks components assumed to be fiscally constrained (through 2040) are under fixed-price contracts and will be completed by 2019, the difference between constant and inflated dollars is not significant. Local government revenue estimates were first generated in current 2015 dollars and for year of expenditure dollars were assumed to grow over time based on anticipated growth in population and tax revenues. Estimated revenues are illustrated in Figure 5.1 and detailed in Table 5.2. RTD will administer the largest individual-entity share of revenues, about $28 billion. The largest source of funding for transportation will be locally derived sources, providing about $95 billion. This amount includes almost $70 billion from local governments, private sources, and tolls, and about $25 billion in sales tax and fares from RTD. These revenue estimates assume that transit fares will be increased in line with inflation. The second-largest individual allocation of funds, $6.7 billion, will be administered by CDOT. Federal and state fuel taxes are the primary funding sources. CDOT combines all federal funds (for Colorado) with state funds and then redistributes them through several categories as shown in Table 5.2. All federal funds expended in the Denver TMA must be approved by DRCOG for inclusion in Transportation Improvement Programs. 76 Chapter Fiscally Constrained RTP Financial Plan
85 Figure 5.1: Revenues Available for Use in the Denver Region Chapter Fiscally Constrained RTP Financial Plan 77
86 Table 5.2: 2040 Fiscally Constrained RTP Revenues (2016 to 2040) Revenues ($ millions) Funding Source/Administrator Constant Inflated (FY 15$) (YOE$) DRCOG Administered Funds STP-Metro (Federal) $540 $720 Non-Federal Match for STP-Metro $360 $480 Transportation Alternatives Program (TAP) $50 $60 Local Match/Overmatch for TAP $20 $30 Congestion Mitigation/Air Quality (CMAQ) $540 $720 Local Match/Overmatch for CMAQ $140 $190 DRCOG Subtotal: $1,650 $2,200 CDOT Administered Funds Asset Management - Maintenance $1,830 $2,440 Asset Management - Surface Treatment Program $1,340 $1,780 Asset Management - Structures On-System $370 $490 Bridge Enterprise $280 $370 Bridge Enterprise Bonding $850 $1,130 Bridge - Off System $70 $90 Regional Priority Program (RPP) $350 $470 FASTER Safety $560 $750 Strategic Projects (SB 228) (through 2020) $280 $370 Strategic Projects - Transit (SB 228) (through 2020) $30 $40 FASTER Transit (Local) $40 $50 FASTER Transit (Statewide) $70 $90 FTA Formula Funds (5310, 5311) $120 $160 TSM&O: Congestion Relief $70 $90 Transportation Alternatives Program (TAP) $50 $70 Toll Revenue $400 $530 CDOT Subtotal: $6,710 $8,920 RTD Administered Funds RTD Sales and Use Tax (Base System & FasTracks) $21,750 $28,970 Farebox Revenues $3,430 $4,560 FTA New Starts (5309) $450 $600 FTA Formula Funds (5307, Other FTA Grants) $2,270 $3,020 Other FasTracks Financing $310 $410 RTD Subtotal: $28,210 $37,560 Other Revenues for Regional System Local/Private Funding for Improvements $2,370 $3,160 Local Funding for Regional Operations & Preservation $11,720 $15,610 Toll Authority Funding for Improvements $790 $1,050 Toll Authority Funding for Preservation, Operations, & Debt $2,990 $3,980 Local Funding for Transit Operations $520 $690 Local & GOCO Lottery Funding for Bike/Ped $310 $410 Other Regional System Subtotal: $18,700 $24,900 Revenues for Non-Regional Facilities * Local/Private Funds for Non-Regional Facilities $33,400 $44,500 Local Funds for Non-Regional System Preservation $17,090 $22,770 Non-Regional Subtotal: $50,490 $67,270 GRAND TOTAL: $105,800 $140,850 * CDOT funds for non-regional facilities included in CDOT totals 78 Chapter Fiscally Constrained RTP Financial Plan
87 DRCOG administers and selects projects for three Federal Highway Administration (FHWA) formula categories Surface Transportation Program-Metro (STP-Metro), Congestion Mitigation/Air Quality (CMAQ), and Transportation Alternatives Program (TAP). Including match, these formula categories represent approximately $1.7 billion. STP-Metro funds can be used on a variety of project types, most commonly roadway improvements and transit projects. With FHWA approval, the DRCOG Board adopted the overall long-range planning assumption of 40 percent average non-federal matching funds for STP-Metro revenues to account for historical trends of local overmatch on major projects. TAP funds are primarily used for bicycle and pedestrian projects. CMAQ funds will be used for several types of projects and activities related to improving air quality. CDOT also administers some TAP and CMAQ funds. Example CMAQ projects include: DRCOG Way to Go program and transportation demand management pool; Regional Traffic Signal System Improvement Program; Regional Intelligent Transportation System Pool; New bus services and transit stations; New rapid transit facilities; Street sweepers, vacuums, and liquid deicers; Intersection operational improvements, and Other air quality improvement projects (for example, diesel retrofits) and alternative fuel vehicles. Local governments, along with private developers and tollway authorities, are anticipated to have about $19 billion in available revenues to preserve, operate, and expand the regional transportation system. Some of these revenues are reported in Table 5.2 as local matching funds to DRCOG- or CDOTadministered funds. An additional $50 billion will be spent on non-regional Roadway System facilities. This estimate is based on applying historical trends of private and local government expenditures to the forecasted growth in population and local street mileage through Periodically, federal revenues are awarded through grant programs such as the TIGER (Transportation Investments Generating Economic Recovery) program or the Recreational Trails Program. Projects chosen to receive funding from these programs must be included in the Transportation Improvement Program. The 2040 FCRTP cannot include estimates for these types of revenues nor identify specific projects that might receive them because they are competitive discretionary grant programs, not formula-based allocations. Chapter Fiscally Constrained RTP Financial Plan 79
88 a. Federal and State Revenues DRCOG participated in CDOT s program distribution process (explained below), which identified specific revenue sources and anticipated amounts by year and range of years (bands) through 2040 for most federal and state funds. The revenue estimates were based on existing federal and state sources and include only what could be generated under current law and average economic conditions into the future. CDOT Program Distribution and Process Much of the foundation for the 2040 FCRTP s revenue and expenditure assumptions came from CDOT s program distribution process. As defined by CDOT, the program distribution process outlines the assignment of projected revenues to various program areas for the time period of [its Statewide Transportation] Plan (FY ), (page 2) which matches the timeframe of the 2040 FCRTP. CDOT also notes that program distribution provides a baseline for financial constraint of its Statewide Plan, MPO Regional Transportation Plans and Transportation Improvement Programs, and CDOT s Statewide Transportation Improvement Program. The program distribution process went through the statewide planning process (Statewide Transportation Advisory Council and Transportation Commission) for review and approval. Program distribution itself took several months and involved stakeholders from across the state. (This section provides embedded links to CDOT s program distribution document; the full link is: Forecasts were made of anticipated revenues for every major state and federal transportation funding source through 2040, including revenues that DRCOG controls: STP-Metro, CMAQ, and TAP. Working with DRCOG staff and other stakeholders, CDOT incorporated many future trend assumptions into a revenue forecasting model. Assumptions were made for factors specifically affecting fuel tax revenues such as high population growth, vehicle fleet mix, fuel economy (mpg), and miles traveled (VMT). The model estimated whether the amount of revenue associated with a particular funding source would grow or decline over time (and at what rate), or remain stable through CDOT published its final program distribution documentation and calculations (linked above) after the 2040 FCRTP financial plan was prepared. DRCOG staff worked with CDOT staff to compare both sets of revenue totals by category to confirm there were minimal differences by revenue category and in the total amount of all revenues. As CDOT s program distribution process was a statewide process, DRCOG staff worked with CDOT to determine the proportion and corresponding amount of estimated revenues for the DRCOG region through This effort encompassed approximately 16 distinct multimodal funding sources and 80 Chapter Fiscally Constrained RTP Financial Plan
89 programs the three controlled by DRCOG noted above, and 13 controlled by CDOT. The results of this process are shown in Table 5.3. In comparing Table 5.3 with Table 5.2, figures in Table 5.2 were rounded for display purposes from the amounts shown in Table 5.3, which fed the detailed financial analysis. Once DRCOG and CDOT determined revenue amounts through 2040 by funding source for the DRCOG region, the next step was to allocate those revenues to multimodal transportation system categories in the 2040 FCRTP, which is discussed in the Allocations section below. CDOT s program distribution process estimated revenues by year for and by five year increments for for each revenue source. DRCOG directly used these estimates in its financial plan calculations by using CDOT s total available revenues through 2040 that are based on (built up from) the interim year/period estimates by individual revenue source. Table 5.3: 2040 FCRTP Estimated CDOT Program Distribution Revenue Allocations and Amounts (All values are in FY 2016 constant rounded $s) Total Statewide (planning purpose revenues) Share for DRCOG Expenditure Categories General Transportation Activities (operations, maintenance, etc.) Capacity Projects (Includes Reconstruction) Funding Programs Amount % Amount % Amount % Amount CDOT: Maintenance $1,826,575, % $1,826,575,900 0% $0 Asset Management - Surface Treatment $4,104,577,800 33% $1,342,196,900 85% $1,140,867,400 15% $201,329,500 Asset Management - Structures On-System $866,517,400 43% $370,869,400 90% $333,782,500 10% $37,086,900 Bridge Enterprise $1,784,406,700 $278,089,400 20% $55,617,900 80% $222,471,500 43% Bridge Enterprise Bonding* $850,000,000 $850,000,000 0% $0 100% $850,000,000 Bridge - Off-System $169,479,500 40% $67,791,800 90% $61,012,600 10% $6,779,200 Regional Priority Program $896,777,100 39% $350,731,000 40% $140,292,400 60% $210,438,600 FASTER Safety $1,528,662,000 37% $558,773,300 85% $474,957,300 15% $83,816,000 Strategic Projects through SB-228 $661,517,800 42% $277,837,500 0% $0 100% $277,837,500 Strategic Projects - Transit $73,502,000 40% $29,400,800 75% $22,050,600 25% $7,350,200 FASTER Transit (local program) $89,677,700 40% $35,871, % $35,871,100 0% $0 FASTER Transit (statewide program) $179,355,400 40% $71,742,200 90% $64,568,000 10% $7,174,200 Toll Revenue $397,289, % $397,289,000 0% $0 100% $397,289,000 CDOT Subtotal: $6,457,168,300 $4,155,595,700 $2,301,572,600 DRCOG: STP Metro (federal only) $718,075,900 75% $538,556,900 40% $215,422,800 60% $323,134,100 STP Metro (40% Matching Funds) $481,110,853 NA $360,833,123 NA $144,333,276 NA $216,499,847 CMAQ (federal only) (eligible projects) $679,759,500 80% $543,807,600 80% $435,046,100 20% $108,761,500 CMAQ Required Local Match (20%) $169,939,900 NA $135,951,900 NA $108,761,500 NA $27,190,400 DRCOG Subtotal: $1,579,149,523 $903,563,676 $675,585,847 Grand Totals: $8,036,317,823 63% $5,059,159,376 37% $2,977,158,447 *Assumes $850m in bonding capacity in FY 2017, with corresponding reduction associated with Debt Service through Chapter Fiscally Constrained RTP Financial Plan 81
90 b. Transit-Related Revenues DRCOG worked with RTD and CDOT to estimate transit revenues through These primarily include RTD s sales and use tax and farebox revenues, FTA formula grants (5307, 5310, 5311, 5339), and FTA New/Small Starts (5309). CDOT s program distribution process addressed Colorado transit revenues SB 228 and FASTER Transit (statewide and local) revenues. For RTD revenues, DRCOG used planning-level revenue estimates provided by RTD based on its Strategic Budget Plan (SBP), FasTracks Annual Program Evaluation (APE), and the State Senate Bill (SB 208) FasTracks financial plan review assessment process. Through the SB 208 process, RTD s FasTracks finances have been reviewed extensively by DRCOG (and others) since FasTracks inception in Leading up to the construction of the fiscally constrained FasTracks corridors and components, RTD annually provided DRCOG with a SB 208 FasTracks Annual Report for DRCOG to review and determine the sufficiency of RTD s financial program, vehicle technology, operations, and other topics. For several FasTracks annual reviews, DRCOG hired a financial and engineering consultant team to provide an independent and objective evaluation of fiscal constraint and sufficiency of RTD s FasTracks financial program. These reviews analyzed and evaluated RTD s: Base financial assumptions Capital and operating costs Revenues and financing Overall financial plan fiscal constraint assessment Although the SB 208 review process focuses on FasTracks (rapid transit), RTD must also ensure it has the financial resources to operate and maintain its overall transit system while undertaking FasTracks capital construction and that bus service operations are not comprised. The SB 208 reviews also encompass sales and use tax forecasts for the entire system, not just FasTracks. Additionally, the reviews address numerous financial details such as material costs, labor unit costs and Davis-Bacon wage rates, labor productivity rates, inflation rates, contingencies, and other fine-grain details of RTD s financial program. The following graphics from DRCOG s SB 208 financial review of RTD s 2012 amendment to DRCOG s 2035 MVRTP illustrate the detail inherent in the SB 208 financial plan review process. This RTP amendment is particularly relevant because RTD removed several FasTracks components from the 2035 MVRTP to maintain fiscal constraint for the overall transit system, which the 2040 FCRTP continues. These financial calculations were confirmed for the 2040 FCRTP through RTD s 2014 Baseline Report and DRCOG s 2014 FasTracks Baseline Review and Determination Report. 82 Chapter Fiscally Constrained RTP Financial Plan

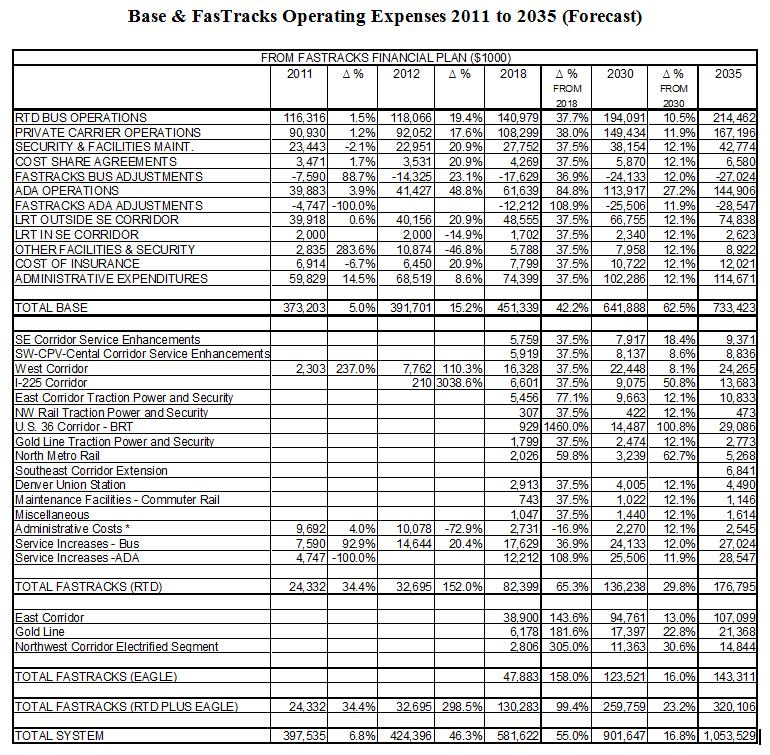
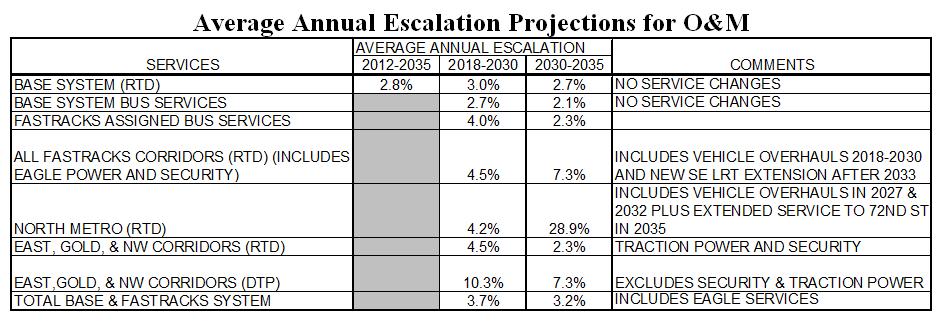
91 Chapter Fiscally Constrained RTP Financial Plan 83
, New/Small Starts, and other RTD revenues.")
 purchases and replacement, and those revenues are shown")
92 Based on the SB 208 process and RTD s APE and SBP, RTD provided DRCOG with transit revenues (and costs) for RTD s sales and use tax, fares, FTA formula funds (such as 5307), New/Small Starts, and other RTD revenues. For CDOT-controlled transit revenues, CDOT s program distribution process addressed SB 228 and FASTER Transit (statewide and local) revenues. FASTER Transit local revenues are generally spent on rolling stock (vehicle) purchases and replacement, and those revenues are shown accordingly in Table 84 Chapter Fiscally Constrained RTP Financial Plan
93 5.3 in the operations/maintenance column. FASTER Transit statewide/regional revenues are more complex, but RTD spends a portion on transit capital construction activities, such as transit station facilities and amenities, transitway major reconstruction and enhancements, and similar activities. In consultation with CDOT s Division of Transit and Rail, CDOT and DRCOG staff agreed that it was reasonable to assume 10 percent of FASTER Transit statewide revenues would be allocated for capacityrelated expenditures. For CDOT-controlled FTA 5310 and 5311 formula funds, DRCOG reviewed the FTA 5310 apportionment history for the Denver-Aurora urbanized area and CDOT s recent awards history to the DRCOG region for small urban and rural FTA 5310 and rural FTA 5311 formula funds. (Through 2014, DRCOG selected projects for FTA 5310 funding in the Denver-Aurora urbanized area on behalf of RTD, and has participated with CDOT in project funding decisions since CDOT became the designated recipient in 2015 for FTA 5310 funds for the Denver-Aurora urbanized area). Based on recent apportionment and awards history for FTA 5310/5311 funds, DRCOG estimated a two percent average annual growth rate to 2040 to derive total constant year revenues and then estimated year of expenditure revenues. DRCOG then verified these assumptions and total revenue estimates with CDOT staff. For New/Small Starts (5309), DRCOG, in consultation with RTD and FTA, conservatively included new funding only for the two projects FasTracks Southeast Rail Extension ($92 million) and Colfax Bus Rapid Transit ($50 million) that have either received or are actively pursuing Small Starts funding. The financial plan, which was prepared in 2014, also includes a portion ($300 million) of previously awarded (but not yet appropriated in 2014) New Starts funds for the FasTracks Eagle component through its 2016 opening. Otherwise, no additional New Starts funding was assumed. c. Local Revenues Local government roadway revenue forecasts were derived from receipts and expenditure reports provided to CDOT annually. The 1984 through 2012 revenues were converted into 2015 dollars per person by revenue group local government general funds, local government special assessments, Colorado Highway Users Tax Fund (HUTF), developer/private and other sources. The final results were adjusted to 2015 constant dollars and to year of expenditure dollars. Chapter Fiscally Constrained RTP Financial Plan 85
94 2. System Category Needs/Costs & Allocations a. Needs and Costs Total Metro Vision transportation needs and costs identified in the 2035 MVRTP for all expenditure categories were reconsidered, validated and updated. Costs for most system categories were updated directly from the 2035 MVRTP using the growth factor approach. Costs for some categories were updated using customized information, as available. For example, to estimate roadway maintenance, resurfacing and reconstruction costs, DRCOG surveyed every local government and CDOT to understand current pavement conditions, develop an average cost per lane mile, estimate an expenditure schedule to maintain current conditions through 2040, and estimate total roadway maintenance and reconstruction cost needs for the 2040 FCRTP. Updated transit system category costs incorporated several factors, including the region s anticipated growth in total population and older adults by 2040 (especially the 75-plus population) and increasing need and costs to provide fixed route, complementary ADA, and other specialized transit services (such as doorto-door and door-through-door). The Coordinated Transit Plan (Appendix 6) describes these and other factors affecting the full spectrum of transit services in greater detail. The updated transit system category costs and expenditures also correspond to the increase in transit vehicles and service hours shown in Table 6.1 reflecting RTD s asset management and vehicle inventory processes and RTD s estimates of rolling stock needs, revenue service miles, and state of good repair objectives. b. Allocations In broad terms, the allocation process estimated how to conceptually proportion revenue amounts from each funding source to transportation system category types at a long-range planning level of detail. As illustrative examples, the allocation process addressed such questions as What proportion of CDOT s RPP revenues will be spent on roadway operations versus additional general purpose and managed lane capacity? and Which funding sources will be spent through 2040 on maintaining other transit services? (primarily FTA 5310/5311, CDOT FASTER Transit and local revenues). By considering how each revenue source would be conceptually proportioned by category type as well as how the funding for each category type would be proportioned among revenue sources, DRCOG in collaboration with CDOT, RTD, and other stakeholders developed a 2040 FCRTP financial plan that is comprehensive but not overly prescriptive given its 25-year conceptual level of detail. 86 Chapter Fiscally Constrained RTP Financial Plan
95 DRCOG staff worked with CDOT staff and RTD staff, the DRCOG Board and committees to determine the allocation for operation/maintenance and capacity/reconstruction for each funding source, shown in Table 3 previously. This effort was complex, as many funding sources are restricted to specific uses, and others can be flexed between uses and modes. An additional consideration was most widening and capacity projects also include reconstruction (as well as transit, bicycle and pedestrian) elements. As shown in Table 5.3, this collaborative transportation planning process resulted in approximately 63 percent of DRCOG s share of CDOT program distribution revenues allocated to multimodal system operations, maintenance, and preservation through About 37 percent was allocated to major multimodal capacity projects, which include reconstruction elements. The final allocation was based on historical trends and striking a balance between maintaining the multimodal transportation system in good condition while still funding selected high-priority capacity projects. Additionally, CDOT made conceptual funding source assumptions for certain projects that had to be factored into the overall allocation analysis. Finally, the allocation process, and the results shown in Table 5.3, are multimodal in nature and reflect all program distribution revenue sources roadways, transit, bicycle and pedestrian, and other multimodal transportation system components. Transit allocations were based on updated RTD estimates and staff guidance based on the state SB 208 process and RTD s Strategic Budget Plan and FasTracks financial analysis efforts. Most transit-related revenue sources are prescribed for specific uses, such as the FasTracks sales and use tax. Finally, local funds were allocated to preservation and maintenance, Regional Roadway System (RRS) roadways, non- RRS roadways and other activities based on information obtained from local governments, special districts and authorities. Once the allocations between operations and maintenance, and capacity and reconstruction were determined for each funding source, each funding source was proportioned by system category. These allocations were consistent with the 2035 MVRTP, and considered new CDOT and RTD guidance, funding eligibility and restrictions, how other sources were funding specific categories, and other factors. This process was not an exercise in quantitative precision it is impossible to predict with absolute certainty how 16 funding programs will be allocated to 30 different transportation system funding categories for a 25-year long-range plan. Rather, the allocation process strived to reasonably balance multimodal transportation system funding needs and optimize the limited funding anticipated to be available through Chapter Fiscally Constrained RTP Financial Plan 87
96 3. Regionally Significant Projects Evaluation & Prioritization DRCOG evaluated regionally significant rapid transit and roadway capacity projects for inclusion in the 2040 FCRTP based on processes and methodologies consistent with prior DRCOG Regional Transportation Plans. To be eligible for future federal or state funding, regionally significant projects must be identified as accurately as possible in the 2040 FCRTP. Regionally significant projects can be conceptual in nature and may change after Environmental Impact Statement or other studies define specific details, such as exact alignment, cross-section, cost, construction schedule or operational details. Such studies are done in accordance with the National Environmental Policy Act (NEPA) and must be undertaken for all federally funded projects to evaluate the environmental impacts of projects and determine mitigation actions. Smaller-scale projects funded in the Transportation Improvement Program must be consistent with eligibility standards for the applicable project type category. a. Roadway and Interchange Capacity Projects This section summarizes the evaluation and selection of regionally significant roadway capacity projects whose sponsors desire competitive (flexible) federal and state funding (known as regional funding in the FCRTP). Appendix 1 contains a more detailed description of the roadway scoring and evaluation process. The first step was to update the definition of the Regional Roadway System (RRS). Working through the Transportation Advisory Committee (TAC) and Regional Transportation Committee (RTC), DRCOG staff solicited additions, deletions or changes to the RRS from DRCOG s local governments and CDOT, resulting in minor additions and deletions to the RRS. Once the RRS was updated, DRCOG staff solicited candidate roadway and interchange projects located on the RRS. All candidate projects were scored and priority-ranked, including regionally funded projects remaining from the 2035 MVRTP. Regional funds expected through 2040 (described in Section C below) were allocated to the higher ranking projects until funds were depleted. This process used evaluation criteria addressing congestion, safety, freight, transit, and other performance factors to score and rank each candidate project. See Appendix 1 for the full list of the project scoring and evaluation criteria and the specific methodology used. DRCOG conducted this process for candidate roadway and interchange projects seeking regional funding controlled by DRCOG (primarily STP-Metro, and some CMAQ). CDOT coordinated with DRCOG to identify a list of fiscally constrained regionally significant roadway and interchange capacity projects to fund with CDOT-controlled revenues. DRCOG and CDOT coordinated the two project lists to ensure a candidate 88 Chapter Fiscally Constrained RTP Financial Plan
97 project did not have to compete twice and was considered by either DRCOG or CDOT. CDOT s fiscally constrained projects are shown together with DRCOG-selected projects in Chapter 6 and Appendix 4. As part of this process, cost estimates for regionally significant roadway and interchange projects in the 2035 MVRTP were reviewed in detail. All costs were initially updated from a 2008 constant dollar basis to a 2015 constant dollar basis for the 2040 FCRTP using a growth factor of 27 percent. This was based on analysis of the Colorado Construction Cost Index provided by CDOT (now known as the Fisher Ideal Index). If a project submitter had its own updated cost estimate for a specific project, it was reviewed and then used directly. DRCOG staff reviewed all project cost estimates and also incorporated recent corridor, NEPA, Planning and Environmental Linkage and other studies to help update costs for specific projects. For the competitively evaluated candidate roadway and interchange projects (regionally significant projects seeking federal and/or state funding), project sponsors were required to include an updated cost estimate. CDOT also provided updated cost estimates for projects it selected to fund with revenues it controls. The other category of fiscally constrained regionally significant roadway capacity projects are those funded entirely with 100 percent locally-derived funding sources. These are typically, but not exclusively, projects funded by local governments through funding sources they control, such as general fund revenues, developer contributions or other revenue sources. DRCOG worked with all local governments and toll highway authorities to identify projects they currently commit to completing by Because many of these projects were eligible to compete for regional funding, those not selected for regional funding were either retained or deleted from the list as desired by project submitters. b. Rapid Transit Projects RTD provided the most recent version of the FasTracks financial plan project components expected to be completed by Although the entire FasTracks program will be funded through a dedicated sales and use tax, some components are currently anticipated to be constructed after RTD annually updates the FasTracks financial plan through its Annual Program Evaluation (APE) process. DRCOG reviewed the current APE as part of its state-required FasTracks review responsibilities and incorporated its cost assumptions in the 2040 FCRTP. This fiscally constrained portion of FasTracks is shown in Chapter 6. Chapter Fiscally Constrained RTP Financial Plan 89
98 As part of the roadway project scoring and evaluation process described previously, RTD (with Boulder County) and the City and County of Denver each submitted candidate bus rapid transit (BRT) projects for potential regional funding. These two BRT projects were evaluated with the candidate roadway capacity projects because they are regionally significant from an air quality perspective, as they add (SH-119 BRT) or remove (Colfax BRT) roadway capacity as part of each project. Both projects scored highly in the project evaluation process and were selected by the DRCOG Board as fiscally constrained projects for regional funding in the 2040 FCRTP. Project submitters for both BRT projects provided cost estimates as part of the regionally significant project evaluation process. C. Summary Fiscally Constrained Revenue and Expenditure Results This section describes the results of the financial plan preparation process in terms of available revenues by funding source and specific expenditures to transportation system categories. As shown in Table 5.2, the DRCOG region will have a total of about $106 billion in federal, state, local, and other revenues through 2040 to fund the 2040 FCRTP. 1. Needs & Expenditure Allocations Based on the financial analysis, Table 5.4 displays the estimated unconstrained (vision) costs for categories of transportation activities and the fiscally constrained expenditures through 2040 in fiscal year 2015 dollars. The unconstrained vision costs are shown for illustrative purposes only. It must be noted that the revenues expected to be available for operations, maintenance, and preservation will enable the continued provision of an adequate and operational transportation system. The additional needs identified in Table 5.4 would bring the system up to an even higher quality desired standard. A significant proportion of new capacity expenditures will also be used for reconstruction and rehabilitation. Finally, the unconstrained vision costs also include very long term concepts (such as intercity rail) that the region is exploring now given the long lead time to fund and implement. The unfunded vision projects are described in Chapter Chapter Fiscally Constrained RTP Financial Plan
99 Table 5.4: Metro Vision Transportation System Unconstrained Costs and 2040 Fiscally Constrained RTP Expenditures (2016 to 2040) 1. Preserve & Maintain Existing System A. Regional Roadway System Day-to-Day Maintenance, Snow & Ice, etc. $11,250 $8,580 Resurfacing & Reconstruction $4,700 $3,490 Bridge (Specific Projects + Pool) $3,400 $970 Toll Operations $700 $520 B. Off-Street Bicycle/Pedestrian Facility Maintenance $44 $40 C. Non-Regional Roadway System Non-Regional Roadways $17,300 $16,970 Non-Regional Bridges $1,000 $ Invest in Base Transit Services Preserve & Maintain System Subtotal: $38,400 $31,340 RTD System Facilities & Fleet $2,430 $2,430 Base RTD Bus & Rail Service $13,400 $13,400 Base RTD Complementary ADA Service $2,980 $2,980 Maintain Other Transit Services $1,950 $ Management, Operations & Air Quality Invest in Base Transit Services Subtotal: $20,800 $19,590 Roadway Operations, Multimodal, RR Grade Separations $1,180 $410 Transportation Management (Capital), ITS, Signal Systems $440 $220 Transp. Mgmt. (Operate & Maintain), ITS, Signal Systems $4,000 $2,080 Safety-Specific Improvements $460 $220 DRCOG Way to Go Program & Regional TDM $170 $110 Air Quality Conformity Programs & Purchases $120 $60 Management, Operations & Air Quality Subtotal: $6,400 $3, New Capacity on Regional System & Other Facilities A. Regional Roadway System New/Additional Capacity (GP Lanes & Interchanges) $15,790 $3,660 Bus, Toll & Managed Lanes $2,510 $2,340 B. Regional Transit System Construct FasTracks through 2040 (Rail & Bus) $7,190 $5,590 Other Rapid Transit (Tier 1 BRT) $140 $140 Other Rapid Transit (Tier 2) $800 $0 State Intercity Corridors (Tier 2) $14,900 $0 Other Conceptual Rapid Transit (Tier 3) $4,500 $0 C. Other Capacity System Category New Bicycle/Pedestrian Facilities $1,260 $530 Eastern Freight Railroad Bypass $300 $0 New Minor Arterials & Collectors $10,500 $10,500 New Local (developer) Streets $22,900 $22, Debt Service (Tollways & RTD) (FY 15$ millions) Total Metro 2040 Fiscally Vision Constrained Unconstrained Expenditures Costs Roadway & Rapid Transit Capacity Subtotal: $80,800 $45,660 RTD FasTracks Debt Service $3,820 $3,820 Toll Highway Debt Service $2,260 $2,260 Debt Service Subtotal: $6,100 $6,080 GRAND TOTAL: $152,500 $105,800 Chapter Fiscally Constrained RTP Financial Plan 91
100 Table 5.5 displays the fiscally constrained expenditure information in year of expenditure dollars. The following generalized categories are shown in both tables: preservation and maintenance of the regional roadway system, off-street bicycle and pedestrian system, and the local street system; provision of base transit services; future management, operational, and air quality projects and services; capital improvements and expansion of the regional roadway, transit, bicycle, local street, and freight railroad systems, and debt service payments. These five categories represent the surface transportation system. In most categories of expenditures, only a portion of total costs can be covered by fiscally constrained revenues. Figure 5.2 compares total envisioned system costs and fiscally constrained revenues from all sources by major expense category. Figure 5.2: 2040 Unconstrained Costs and Fiscally Constrained Revenues by Expense Category 92 Chapter Fiscally Constrained RTP Financial Plan
101 Table 5.5: 2040 Fiscally Constrained RTP Expenditures (2016 to 2040 in millions of year of expenditure dollars) 1. Preserve & Maintain Existing System A. Regional Roadway System Day-to-Day Maintenance, Snow & Ice, etc. $11,420 Resurfacing & Reconstruction $4,650 Bridge (Specific Projects + Pool) $1,300 Toll Operations $690 B. Off-Street Bicycle/Pedestrian Facility Maintenance $50 C. Non-Regional Roadway System Non-Regional Roadways $22,600 Non-Regional Bridges $1, Invest in Base Transit Services Preserve & Maintain System Subtotal: $41,730 RTD System Facilities & Fleet $3,240 Base RTD Bus & Rail Service $17,840 Base RTD Complementary ADA Service $3,970 Maintain Other Transit Services $1, Management, Operations & Air Quality Invest in Base Transit Services Subtotal: $26,090 Roadway Operations, Multimodal, RR Grade Separations $540 Transportation Management (Capital), ITS, Signal Systems $290 Transp. Mgmt. (Operate & Maintain), ITS, Signal Systems $2,780 Safety-Specific Improvements $300 DRCOG Way to Go Program & Regional TDM $140 Air Quality Conformity Programs & Purchases $80 Management, Operations & Air Quality Subtotal: $4, New Capacity on Regional System & Other Facilities A. Regional Roadway System New/Additional Capacity (GP Lanes & Interchanges) $4,880 Bus, Toll & Managed Lanes $3,110 B. Regional Transit System Complete FasTracks (Rail & Bus) $7,450 Other Rapid Transit (Tier 1 BRT) $190 Other Rapid Transit (Tier 2) $0 State Intercity Corridors (Tier 2) $0 Other Conceptual Rapid Transit (Tier 3) $0 C. Other Capacity System Category New Bicycle/Pedestrian Facilities $700 Eastern Freight Railroad Bypass & UPRR Improvements $0 New Minor Arterials & Collectors $13,970 New Local (developer) Streets $30, Debt Service (Tollways & RTD) Fiscally Constrained Expenditures Roadway & Rapid Transit Capacity Subtotal: $60,800 RTD FasTracks Debt Service $5,090 Toll Highway Debt Service $3,010 Debt Service Subtotal: $8,100 GRAND TOTAL: $140,850 Chapter Fiscally Constrained RTP Financial Plan 93
102 a. Preservation and Maintenance of the Roadway System and the Base Transit System Almost half (48 percent) of total transportation expenditures will be used for preservation, maintenance, and operation of the roadway system and base transit system. Table 5.5 details the expenditure of $51 billion for these activities. Of that amount, about $13.6 billion is estimated to be available to preserve and maintain the Regional Roadway System (RRS). About $17.7 billion will be available to preserve and maintain non-rrs roads and bridges. RTD and other transit operators have identified about $19.6 billion to provide base transit service. b. Management and Operation of the Roadway System About $3.1 billion will be used for operational, safety, and management activities to enable more efficient travel on the transportation system. In light of limited revenues that will be available for system expansion, management and operational strategies will be critical to meet travel mobility needs. Technological innovation will continue to play a critical role in helping the region manage and operate its multimodal transportation system using available resources. c. Transportation Demand Management About two-thirds of the desired costs for providing TDM services will be funded in the 2040 FCRTP. Extensive services will be provided with the $110 million allotted to future programs run by DRCOG, transportation management organizations, local governments and other entities. With limited funding available for expansion of the roadway system, TDM services will be critical to reducing motor vehicle travel demand and offering mobility options. d. Fiscally Constrained Projects The fiscally constrained regionally significant projects are shown in Chapter 6 and listed in Appendix 4, which has four components: Roadway capacity projects funded with DRCOG-controlled funds; Roadway capacity projects funded with CDOT-controlled funds; Roadway capacity projects funded with 100 percent locally derived funds, and Regional transit projects (FasTracks components and other regional transit projects). It is a federal requirement for DRCOG to demonstrate fiscal constraint for regionally significant projects not just in current year dollars but also in year of expenditure dollars. To do so for regionally significant roadway capacity projects, DRCOG conducted an analysis to inflate project costs and revenues and then compare them. 94 Chapter Fiscally Constrained RTP Financial Plan
103 First, project costs as shown in Appendix 4 were sorted and summed by air quality conformity staging period. Second, the total project costs by staging period were inflated on an annual compound basis by an inflation factor of 2.80 percent. This inflation factor was estimated by reviewing historical Colorado Construction Cost Index (CCI) and Consumer Price Index (CPI) rates. More specifically, 3-, 5-, 10-, and 15-year CPI growth rates were reviewed for the Denver metropolitan area for the period These rates ranged from 2.8 percent (3-year) and 1.94 (5-year) to 2.4 (15-year). CCI data were reviewed from (After 2011, the data were re-based to 2012 Q1, and from that point, were calculated using the Fisher Ideal Index.) The CCI rates varied significantly depending on time period. Based on the analysis of CPI and CCI, and to be conservative, a project cost inflation factor of 2.80 percent was chosen. Third, the compounded inflated project cost for the mid-year of each staging period was compared to the constant year (2015) cost to derive percentage increases by staging period. The mid-year was chosen to represent the middle of each staging period on the planning assumption that approximately half the projects would be built before the middle year, and half after, within a staging period. The exact years for construction of projects are not known for a 25-year RTP due to the number of variables affecting funding and project development. A cost year at the beginning of the staging period would under-inflate average project costs for the entire staging period; a cost year at the end would over-inflate average project costs. Comparing constant costs with inflated (year of expenditure) costs resulted in the following percentage increases by staging period: : 15 percent : 47 percent : 89 percent Finally, the total inflated cumulative cost was calculated and compared with inflated revenues for roadway capacity. Inflated revenues come from section 4A of Table 5.5 new and additional capacity on the Regional Roadway System. The total 2040 inflated revenue amount is $7.990 billion. The inflated project cost analysis described above resulted in a total 2040 inflated cost of $7.897 billion, demonstrating fiscal constraint on a year of expenditure basis. Inflated revenues and costs were also compared by staging period to ensure fiscal constraint. This analysis is complex, as the first staging period includes two significant CDOT projects, I-70 Central and C-470 managed lanes, that together cost $1.4 billion in fiscal year 2015 dollars, more than one-third the cumulative cost for regionally Chapter Fiscally Constrained RTP Financial Plan 95
104 significant projects in the first staging period. However, both projects, and several others, are in the DRCOG Transportation Improvement Program and CDOT Statewide Transportation Improvement Program to demonstrate fiscal constraint. This situation results in an up-fronting of both costs and revenues in the first staging period. Accounting for this circumstance, a comparison of inflated (year of expenditure) costs and revenues indicates fiscal constraint over the 2040 FCRTP period. For regionally significant rapid transit projects, there is not a significant difference between constant year and YOE costs for the fiscally constrained FasTracks components. Of the other two rapid transit projects, the Colfax BRT project is in an ongoing intensive environmental assessment process and project stakeholders are working with FTA to enter the New/Small Starts process. The SH-119 BRT project is anticipated to start the NEPA process in 2017 to, in part, develop a more refined and specific cost estimate for future potential amendment in the 2040 MVRTP. e. Other Funding Considerations In addition to the revenue, need, cost, allocation and expenditure components described in this document, other considerations informing the 2040 FCRTP s financial plan include: Fiscally constrained 2040 roadway system improvements in Figure 10 indicated to be funded with 100 percent locally derived revenues are not eligible for FHWA formula funds. Nearly all federal TAP funds expected to be available will be used for bicycle and pedestrian improvements. Some TAP funds will be used for other eligible improvements. Additional bicycle and pedestrian improvements are expected to be part of roadway capacity projects, and STP-Metro and CMAQ revenues will also be used to fund independent bicycle and pedestrian projects. Human service transit will be funded through RTD, FTA Section 5310, local government contributions, and money generated by private carriers. To demonstrate conformity, interim years of the 2040 FCRTP must be examined. DRCOG and air quality planners defined these interim modeling years as 2025 and DRCOG, local governments, CDOT and RTD identified, for modeling purposes, best estimates as to which projects in the Fiscally Constrained 2040 FCRTP would be completed by the end of each of these interim staging years. Consideration was given to funding source, project schedule, status of studies, project scores, reconstruction needs and interest and availability of local match. For regionally funded roadway projects, each of these staging periods was fiscally constrained to reasonably expected revenues. FasTracks implementation assumptions were 96 Chapter Fiscally Constrained RTP Financial Plan
105 based on RTD s current SB 208 report to DRCOG (known as the 2014 Baseline Report). Appendix 4 identifies the Fiscally Constrained 2040 FCRTP roadway projects and the staging period during which the improvements are estimated to be completed. This staging process is neither a guarantee nor a prohibition of funding in a certain staging period; rather, it reflects current best estimates. Actual project funding is determined through the Transportation Improvement Program (TIP) process (within the TMA) and the Statewide Transportation Improvement Program (STIP) process in the non-tma portion of the region. Staging adjustments necessitated by TIP/STIP awards will be reflected in the TIP air quality conformity and an associated revision to the air quality conformity of the MVRTP in future MVRTP amendments as needed. f. Innovations and an Eye Toward the Future The DRCOG region has been a national leader in using innovative funding approaches to accelerate investment in its multimodal transportation system. RTD s Eagle public-private partnership (P3) was the nation s first P3 to implement multiple rapid transit corridors. CDOT used a P3 approach to accelerate managed lanes (high occupancy toll and bus rapid transit) investment on the US-36 corridor. The state Transportation Commission adopted a high occupancy vehicle (HOV) policy in 2015 that assumes tollfree HOV for three or more vehicle occupants on all tolled HOV lanes on the state highway system. CDOT also has a policy directive to consider managed lanes for all new capacity projects on the state highway system. Across the state, examples abound of existing revenues being leveraged and optimized and new revenues being created to address transportation funding shortfalls and project backlogs. In future Regional Transportation Plan updates, DRCOG will further explore the potential benefits of these efforts on the fiscally constrained financial plan. Chapter Fiscally Constrained RTP Financial Plan 97
106 98 Chapter Fiscally Constrained RTP Financial Plan
107 FISCALLY CONSTRAINED REGIONAL TRANSPORTATION PLAN Based on the financial plan described in Chapter 5 and the project evaluation and selection process described in Chapter 5 and Appendix 1, this chapter presents the 2040 Fiscally Constrained Regional Transportation Plan (2040 FCRTP). As described previously, the 2040 FCRTP classifies transportation expenditures into two broad areas: system categories, and regionally significant projects for air quality conformity purposes. System category expenditures are allocations to categories that are not project specific in the 2040 FCRTP, but rather address broad areas of need. Non-regionally significant projects within the system categories are not identified in the 2040 FCRTP. Rather, estimated expenditure amounts are listed by project type system category, such as safety, maintenance, etc., through 2040 as shown in Chapter 5. In contrast, regionally significant projects are major roadway, interchange, and rapid transit projects that considerably change the capacity of the transportation network. Per federal requirements, regionally significant projects must be listed individually in the RTP by air quality staging completion period ( , , or ). The transportation networks containing these projects must be modeled to demonstrate compliance with federal air quality conformity requirements. Regionally significant projects are listed in Appendix 4 and illustrated in Appendix 3 by funding source and air quality staging period. The 2040 fiscally constrained roadway network is shown in Figure 6.1, while Figure 6.2 shows the 2040 fiscally constrained rapid transit network. The 2040 fiscally constrained roadway network includes an expanded network of roadway- and transit-focused managed lane facilities; these are illustrated in Figure 6.3. The key fiscally constrained regionally significant projects are discussed below by mode. Chapter Fiscally Constrained Regional Transportation Plan 99

108 Figure 6.1: 2040 Fiscally Constrained Roadway Network 100 Chapter Fiscally Constrained Regional Transportation Plan

109 Figure 6.2: Fiscally Constrained Rapid Transit, Park-n-Ride and Station Locations Chapter Fiscally Constrained Regional Transportation Plan 101

110 Figure 6.3: 2040 Managed Lanes System 102 Chapter Fiscally Constrained Regional Transportation Plan
111 A. Freeways, Interchanges, and Roadways Freeways/Tollways: I-25 widening from Alameda Avenue to Walnut Street I-25 widening from US-36 to SH-7 I-25 widening from SH-66 to Weld County Road 38 I-270 widening from I-25 to I-70 I-70 peak period shoulder lanes from Empire Junction to Twin Tunnels (east of Idaho Springs) I-70 reconstruction from Brighton Boulevard to Chambers Road Pena Boulevard widening from I-70 to E-470 C-470 managed toll lanes from Kipling Parkway to I-25 E-470 widening from I-25 south to I-25 north Jefferson Parkway from SH-93 to SH-128 New Freeway/Tollway Interchanges: I-25/Crystal Valley I-25/Castle Rock Parkway (completed in 2016) I-70/Harvest Mile Road E-470 at 48 th Avenue, 88 th Avenue, 112 th Avenue, and Potomac Street Jefferson Parkway at SH-72, Candelas Parkway, and Indiana Street New Movements at Freeway Interchanges: I-70/Picadilly Road/Colfax Avenue US-36/Wadsworth Boulevard/120 th Avenue Major Improvements of Freeway Interchanges: I-25 at Lincoln Avenue, Arapahoe Road, Alameda Avenue/Santa Fe Drive, and US-6 I-70 at 32 nd Avenue US-6 at Wadsworth Boulevard and Federal Boulevard/I-25 US-36 at Sheridan Boulevard I-225 at Yosemite Street Chapter Fiscally Constrained Regional Transportation Plan 103
112 Elimination of Freeway Interchanges: I-70 reconstruction (will eliminate some interchange movements between Brighton Boulevard and Colorado Boulevard) US-6/Bryant (completed 2016) Major Regional Arterial Roadways: 120 th Avenue from east of US-36 to US-287 new roadway Arapahoe Road (SH-88) widening operational improvements from I-25 to Potomac Street US-85 widening from Meadows Parkway to Louviers Avenue and from Titan Road to County Line Road Wadsworth Boulevard widening from 36 th Avenue to 46 th Avenue and from 92 nd Avenue to SH-128 Parker Road widening (SH-83) from Quincy Avenue to Hampden Avenue US-285 widening from Pine Junction to Richmond Hill Major Regional Arterial Grade-Separated Intersections: Longmont Diagonal (SH-119)/Mineral Road (SH-52) US-85/Castle Rock Parkway (completed 2016) US-285/Pine Valley Road and Kings Valley Drive US-6/ 19 th Street Principal Arterials About 810 lane-miles of new principal arterial roadways are planned for construction as part of the 2040 FCRTP. Improvements are concentrated within the DRCOG urban growth boundary/area (UGB/A) except for arterials that connect non-contiguous UGB/A sections, such as freestanding communities. Improvements to principal arterial roadways are detailed in Appendix 4. System Quality (Reconstruction) Practically all of the regionally funded roadway improvements shown in Figure 6.1 include reconstruction of the current facility and structures in the estimated cost. Exceptions are entirely new roadways and interchanges. Some of the projects with notable reconstruction aspects include: I-70 widening from I-25 to Chambers Road; I-270 widening from I-25 to I-70; C-470 widening from Kipling Parkway to I-25; US-285 widening from Pine Junction to Richmond Hill; 104 Chapter Fiscally Constrained Regional Transportation Plan
113 US-85 widening from Meadows Parkway to Louviers Avenue; and Major improvements of freeway interchanges such as I-25/Alameda Avenue/Santa Fe Drive/US-6, I-70/Vasquez Boulevard, US-6/Wadsworth Boulevard, US-6/Federal Boulevard, and US-36/Sheridan Boulevard. Other Roadway Improvements Many other improvements to the regional roadway system are anticipated in the 2040 FCRTP but are not individually listed as regionally significant projects for air quality conformity modeling, nor have exact locations for such improvements been defined. Expenditures for these improvements are shown in Chapter 5, and are eligible for future Transportation Improvement Program funding from the following categories: Safety Operational, management and Intelligent Transportation Systems Reconstruction Bridges B. Freight and Goods Movement Freight concerns largely relate to mobility and access issues. Mobility issues pertain to smooth and reliable traffic conditions on the region s freeways, major regional and principal arterials, and at-grade crossings with freight railroad tracks. Access issues deal with road geometrics, bridge clearances and weight restrictions, and severe bottlenecks between the regional system roadways and major freight facilities. The following fiscally constrained roadway improvements will especially benefit freight and goods movement: Reconstruction of I-70 east of I-25; Widening of I-270, I-25 north of US-36 and north of SH-66; Widening key arterials such as US-85 north of Castle Rock, 56 th Avenue, Sheridan Boulevard, and SH-7 east of I-25; Widening of US-36 and north I-25 (HOT/HOV lanes); Improvements to I-70 and US-285 in the mountains; Other improvements to the regional roadway network (widenings, new interchanges, interchange reconstruction); Operational and reconstruction pool projects to be selected in future TIPs; and Expansion of the ITS facilities and traffic management capabilities. Chapter Fiscally Constrained Regional Transportation Plan 105
114 More detail is provided in the freight and goods movement component (Appendix 5). C. Rapid Transit The 2040 rapid transit system includes four primary types of service and vehicle technologies: Light rail transit: Electric-powered, lighter-weight vehicles, high-frequency service (for example, 5- to 15-minute peak headways (frequency)), and numerous stations (as close as one-mile spacing) Commuter rail: Diesel- or electric-powered heavy vehicles, moderate-frequency service (20- to 30-minute peak headways), and limited stations (average four-mile spacing) Bus Rapid Transit and managed lanes: Exclusive travelway within or parallel to a highway rightof-way, bus rapid transit or frequent bus service, may serve park-and-ride lots or specialized bus rapid transit stations. Managed lanes include high-occupancy vehicle lanes, high-occupancy toll lanes, and toll lanes with congestion pricing Intercity rail: Diesel-powered heavy vehicles, low-frequency service, longer-distance trips, and very few stations (located in selected communities) The fiscally constrained rapid transit system contained in the 2040 FCRTP is depicted in Figure 6.2 and the improvements are listed in Appendix 4. Park-n-Rides and station locations are shown in Appendix 2. The 2040 FCRTP also includes funding for the fixed-route bus network and the other components described below. In April 2013, the West Rail Line (W Line) opened for service. In 2016, US-36 BRT (Flatiron Flyer), the East Rail Line (University of Colorado A Line), and the first segment of Northwest Rail (B Line) opened for service. Together, these FasTracks components represent a significant step towards the completion of the 2040 fiscally constrained rapid transit system. The 2040 fiscally constrained portion of FasTracks will build all or parts of six additional light rail, commuter rail, and bus rapid transit lines. FasTracks is funded in large part by a 0.4 percent sales and use tax. Although the entire FasTracks program is funded, some components are funded beyond the MVRTP s 2040 fiscal constraint horizon. Completing these remaining FasTracks components continues to be a priority for the Denver region. Two non-fastracks Bus Rapid Transit (BRT) projects are included in the fiscally constrained rapid transit system. One project would provide new BRT service between Boulder and Longmont on SH-119. BRT is also planned for the Colfax corridor between the light rail stations serving the Auraria campus in Denver and the Anschutz campus in Aurora. 106 Chapter Fiscally Constrained Regional Transportation Plan
115 D. Fixed-Route Bus and Other Transit Service RTD will expand its fixed-route public bus service within its boundary. Fixed-route service includes scheduled regional, express, and local routes. Overall bus service is anticipated to have a net increase of about 29 percent between 2015 and 2040, from 3.5 million to 5.2 million bus service hours. Key elements of the 2040 system include: Increasing the fixed route bus fleet (including spares) from 1,094 to 1,120; Adjusting many bus routes to serve as feeders to rapid transit stations; Significantly expanding suburb-to-suburb crosstown bus service; Adding new bus routes; Making physical and operational improvements to multimodal streets that will have high-frequency bus service; RTD facilitating expanded bus service through an integrated system of timed transfer points; RTD significantly expanding complementary ADA service to help meet the needs created by the region s rapidly aging population, and Significantly expanding non-rtd transit services for seniors and individuals with disabilities as funding permits. RTD provides federally-required complementary ADA paratransit service (Access-a-Ride) within a ¾-mile buffer of its fixed route transit system. RTD also provides Access-a-Cab to augment Access-a-Ride. In addition to RTD, there are several smaller transportation providers throughout the region that provide accessible transportation. Many of the services go beyond ADA requirements (curb-to-curb) and provide door-to-door and door-through-door services. Two key agencies providing these services are Seniors Resource Center, located in Jefferson County, and Via Mobility Services in Boulder. Funding sources include, but are not limited to, the Older Americans Act, grants such as FTA 5310 Enhanced Mobility of Seniors and Individuals with Disabilities, and assistance from local governments. The 2040 MVRTP s transit coordinated plan (Coordinated Public Transit Human Services Transportation Plan) addresses these issues in much greater depth. There are also some transportation services available for low-income individuals offered in areas where there are limited or no RTD services available. The focus is typically employment-related trips. Many of these services were previously funded through the Job Access and Reverse Commute program under FTA 5316 and are now funded through FTA 5307 (through RTD) and FTA 5311 (through the Colorado Department of Transportation (CDOT)). Chapter Fiscally Constrained Regional Transportation Plan 107
116 Another type of transit service available in the Denver region is intercity bus, such as Greyhound. These types of intercity bus services are funded in part by FTA 5311(f) through CDOT. CDOT also funds and operate a commuter bus service, Bustang, along I-25 (Fort Collins and Colorado Springs to Denver), and I-70 (mountain corridor to Denver). Park-n-Ride Lots, Stations, and Transfer Points RTD s park-n-ride lots provide thousands of patrons with access to transit service. They are an integral part of the rapid transit and bus systems. Several existing lots reach capacity early in the morning each weekday, prohibiting more commuters from using transit. Many new lots will be constructed by 2040 and several existing lots will be expanded (see Figure 6.2 and Appendix 2). RTD s current and planned park-and-ride lots serve a variety of transit options, including rail, bus and stand-alone lots for carpoolers. By 2040 the following facilities will be available: More than 100 RTD park-n-ride lots (stand-alone and rail stations with parking); Six carpool lots (CDOT-operated), and Approximately 50,000 total parking spaces. In addition to the park-n-ride transit stations, there are numerous existing and planned stations without parking (see Appendix 2). There are currently 21 rapid transit stations without parking. Five additional fiscally constrained stations without parking are included in the FasTracks program. More than 10,000 bus stops will be located throughout the region to serve transit patrons. Several bus stops will be enhanced to become key timed-transfer points in the system. Timed-transfer points enable convenient bus-to-bus, bus-to-rail, and rail-to-bus transfers. Others will receive enhanced station-like design elements for passengers to allow BRT buses to load more quickly. To improve efficiency, new systems will transmit information to variable message signs on roadways to inform drivers of space availability in key park-n-ride lots. Transit information kiosks will be provided at major park-n-ride lots, transfer points, and BRT stops to provide riders with information regarding transit arrivals and departures. E. Managed Lanes Managed lane facilities, shown in Figure 6.3, make up another component of the fiscally constrained rapid transit and roadway networks. There are multiple types of managed lane facilities throughout the region that can be classified into the following three general categories shown in Figure 6.3: 108 Chapter Fiscally Constrained Regional Transportation Plan
117 Freeway managed lanes adjacent to general purpose lanes: This category includes managed lanes on I-25 north of downtown Denver, US-36, I-70 (mountains and east of downtown Denver), and C-470. Arterial bus lanes: This category includes bus lanes in several design configurations that when operating are only for buses (and right-turning vehicles at intersections). These facilities are for future BRT service on Colfax Avenue and SH-119, and existing bus lanes on Broadway and Lincoln Street in Denver. RTD currently operates BRT service (Flatiron Flyer) on I-25 North and US-36. Additionally, buses are allowed on every managed lane facility in the region. Arterial HOV: This category includes only one facility along South Santa Fe Drive from I-25 to Bowles Avenue. Unlike the region s other auto-focused managed lane facilities, there is no toll component. As of Jan. 1, 2017, it is the only HOV facility with an eligibility threshold of two or more occupants instead of three or more occupants for the region s other managed lanes. Finally, it should be noted that the region s toll roads are not considered managed lane facilities as currently operated for two reasons. First, managed lane facilities offer travelers the choice to use free general purpose lanes or choose to carpool and/or pay a toll to use the managed lane facility. Toll roads do not offer this choice. Second, managed lanes have occupancy, time-of-day, congestion levels, and/or other criteria governing their use. Toll roads that charge a fixed toll to every traveler regardless of these criteria are not managed lanes. That said, toll roads are an important component of the region s transportation system. F. Other Modes, Services and Facilities As described in Chapter 5 and summarized in this chapter, the 2040 FCRTP funds a comprehensive range of projects, programs, and services through allocations to project type system categories that are not project specific, but rather address broad areas of need. These system categories include everything from local bus service, bicycle and pedestrian projects, TDM activities and bridges to system operations and preservation and maintenance, local streets, safety, debt service, and other categories. Specific projects in these various system categories are developed by project sponsors when they apply for funding from DRCOG s Transportation Improvement Program. G. Vision (Unfunded) Projects Vision projects are by definition not funded within the 2040 Fiscally Constrained RTP. Accordingly, they are not included within or considered part of the 2040 MVRTP. That said, they are useful as a means to help Chapter Fiscally Constrained Regional Transportation Plan 109
118 define how the 2040 fiscally constrained transportation system was developed from a project perspective (Chapter 5 and Appendix 1), and, given available revenues, from a funding perspective (Chapter 5). The vision projects combined with the fiscally constrained system are together known as the Metro Vision transportation system. This is the multimodal system that represents the region s desired state by The 2040 FCRTP represents the subset of the Metro Vision transportation system that can be funded and implemented by 2040 given anticipated available revenues. The remainder are unfunded projects that are needed and desired within the region. As a basis for updating the fiscally constrained system, the first step in developing the 2040 FCRTP was to update the inventory of vision projects. The vision projects inventory associated with the 2035 MVRTP was used as the starting point for DRCOG to solicit vision project additions, deletions, or modifications from local governments, RTD, and CDOT in DRCOG staff also worked with these and other stakeholders to update the vision projects inventory based on various project, corridor, and other transportation studies. Examples include the Interregional Connectivity Study (ICS) and Advanced Guideway Study (AGS) conducted by CDOT to study the feasibility and conceptual alignments of intercity rail through the Denver region. Vision projects are defined by project sponsors and are not evaluated or modeled by DRCOG (except as candidate projects for funding in the 2040 FCRTP). Project sponsors identify vision projects based on their own comprehensive, corridor, project, or other plans and studies. Such projects represent community or agency needs and priorities. However, some vision projects also include very long term concepts (such as AGS/ICS) that may not represent an immediate need so much as a future vision that the region is exploring and working towards over time. Other vision projects may not be needed today, but will be necessary by the time they can be funded and implemented (such as a project to accommodate forecasted growth). Once the vision projects inventory was updated, DRCOG staff worked with stakeholders to update or develop planning level project costs. Roadway project costs were updated or developed consistent with the methodologies described in Chapter 5. Transit project costs were updated or developed primarily from studies, such as the ICS and AGS, RTD s Northwest Area Mobility Study, and others. FasTracks costs for components beyond 2040 were obtained from RTD. Other transit vision project costs were updated or developed on a per mile unit cost basis at a conceptual planning level by considering recent light rail, BRT, and other transit technology unit costs in the Denver region and other comparable regions around the country. 110 Chapter Fiscally Constrained Regional Transportation Plan
119 Finally, based on the candidate project evaluation and selection process described in Chapter 5 and Appendix 1, some vision projects became part of the 2040 Fiscally Constrained RTP, either because such projects were selected for regional (federal or state) funding, or because project sponsors committed to fund them with 100 percent locally-derived funds. All other projects not selected for funding make up the updated vision projects inventory. They are depicted along with fiscally constrained projects in Figure 6.4 (roadways) and Figure 6.5 (rapid transit projects). Chapter Fiscally Constrained Regional Transportation Plan 111

120 Figure 6.4: 2040 FCRTP Fiscally Constrained and Unfunded Roadway Capacity Projects 112 Chapter Fiscally Constrained Regional Transportation Plan

121 Figure 6.5: 2040 Fiscally Constrained and Unfunded Rapid Transit Projects Chapter Fiscally Constrained Regional Transportation Plan 113
122 H Fiscally Constrained RTP System Characteristics Table 6.1 compares the characteristics of the fiscally constrained 2040 surface transportation system to the existing 2015 system. Table 6.1 also shows the characteristics for the full unconstrained Metro Vision transportation system. Table 6.1: 2040 Fiscally Constrained RTP System Characteristics Regional Roadway Lane-Miles System Characteristic Fiscally Constrained 2040 Metro Vision Freeways/Tollways 1,980 2,319 2,576 Major Regional Arterials 1,084 1,143 1,240 Principal Arterials 4,092 4,906 5,484 Interchanges Total Regional Roadway System Lane Miles: 7,156 8,368 9,300 On Freeways/Tollways On Major Regional Arterials, not Freeways Rapid Transit Centerline Miles Light Rail Commuter Rail Intercity Passenger Rail Bus Rapid Transit/Busway (exclusive right of way) Transit Service Characteristics Total Rapid Transit System Miles: Fixed Route Fleet (incl. spares) 1,094 1,120 n/a MallRide, MetroRide, and Call-n-Ride n/a ADA Paratransit n/a Light Rail Vehicles n/a Commuter Rail Vehicles 0 66 n/a Bus Hours (millions in annual revenue service) n/a Light Rail Hours (millions in annual revenue service) n/a Commuter Rail Hours (millions in annual revenue service) n/a Total Revenue Hours n/a Bus Miles (millions in annual revenue service) n/a Light Rail Miles (millions in annual revenue service) n/a Commuter Rail Miles (millions in annual revenue service) 0 6 n/a Stations:Transit Stations and Park-n-Ride Lots (number of parking spaces) Total Revenue Miles n/a Rapid Transit Stations (with Parking ) 25 (16,653) 48 (34,055) n/a Current Park-n-Rides that are Future Rapid Transit Stations with Parking 9 (5,970) 9 (8,110) n/a Rapid Transit Stations (without Parking ) n/a Transit/Transfer Centers 4 (75) 4 (75) n/a RTD Park-n-Ride Lots 42 (8,362) 43 (7,114) n/a CDOT Carpool Lots 6 (926) 6 (926) n/a Total Parking Spaces 31,986 50,280 n/a 114 Chapter Fiscally Constrained Regional Transportation Plan
123 I. Amendments to the 2040 FCRTP Since adoption of the 2040 Fiscally Constrained RTP in February 2015, DRCOG has processed two cycles of amendments to regionally significant projects requested by project sponsors. These amendments, shown in Table 6.2, have been incorporated in the 2040 MVRTP s text, maps, tables and appendices. Table 6.2: Amendments to the 2040 Fiscally Constrained RTP Sponsor Project Location Original 2040 FCRTP Project Description Type of Change to the 2040 FC-RTP Model Network Staging Period CDOT CDOT Commerce City Commerce City E-470 Authority Jefferson County Jefferson County Thornton Thornton Wheat Ridge C 470 (New Managed Toll Express Lanes): EB: Wadsworth Blvd. to I-25 I-70 (New Managed Lanes): I-25 to Chambers Rd. (1 new lane in each direction) Pena Blvd./Tower Rd. Tower Rd.: Pena Blvd. to 104 th Ave. E-470: Parker Rd. to Quincy Ave. McIntyre St.: 44 th Ave. to 52nd Ave. 52nd Ave. to 60th Ave. Quincy Ave.: C-470 to Simms St. Washington St.: 144 th Ave. to 152nd Ave. 152nd Ave. to 160th Ave. SH-7: 164 th Ave. to Dahlia St. Wadsworth Blvd.: 35 th Ave. to 48 th Ave. Advance eastbound segment (1 new lane from Wadsworth Blvd. to Platte Canyon Rd.) to stage Change scope from 2 managed lanes in each direction (Brighton Blvd. to I-270) to 1 managed lane in each direction (I-25 to Chambers Rd.) Not in 2040 FCRTP Widen 2 to 6 lanes ( stage) Widen 4 to 6 lanes ( stage) Not in 2040 FCRTP Widen 2 to 4 lanes ( stage) Widen 2 to 4 lanes Widen 2 to 4 lanes ( stage) Widen 4 to 6 lanes ( stage) Construct missing on-ramp to WB Pena Blvd. Change widening to 2 to 4 lanes ( stage); add widening to 4 to 6 lanes ( stage) Advance to stage Add project: widen 2 to 4 lanes Advance to stage Widen 2 to 6 lanes York St. to Big Dry Creek segment: Advance to stage Change to locally-derived funding Advance to stage Chapter Fiscally Constrained Regional Transportation Plan 115
124 116 Chapter Fiscally Constrained Regional Transportation Plan
125 7. PERFORMANCE AND OUTCOMES OF THE 2040 FISCALLY CONSTRAINED RTP The 2040 Metro Vision Regional Transportation Plan (2040 MVRTP) plays a major role in improving the economy, environmental quality, mobility and quality of life for the residents of the Denver region. Potential benefits of the MVRTP s balanced approach include: Residents and visitors have more travel choices and service options; Urban centers thrive; Senior citizens maintain their mobility or receive in-home services efficiently; Low- and moderate-income workers reach their job sites; Business owners attract customers or ship out products; Children travel to and from school more safely; Tourists and residents travel to, from, and within recreation sites; Greenhouse gas emissions are reduced; and People breathe clean air. Negative impacts of the transportation system are intended to be minimized and mitigated for new projects as determined through the environmental and project development process. Current funding constraints, however, will limit the benefits that could be realized. The MVRTP makes the best use of available funds to achieve meaningful benefits, but these benefits will fall short of those envisioned for the full Metro Vision transportation system (Chapter 6). The lack of sufficient revenues necessitates prioritizing transportation funding decisions as discussed in Chapter 5. A. Transportation System Performance Measures This section presents measures comparing the performance of the 2015 transportation system with that of the 2040 fiscally constrained system. DRCOG measures transportation performance using observed and modeled data in the MVRTP, Metro Vision and in reports on topics such as congestion, safety and bicycle and pedestrian travel. Taken together, DRCOG has a plethora of performance measures addressing the multimodal transportation system s use, performance, condition, and other traits. The following subsections discuss transportation performance by performance measure groupings: travel and mobility, facility and infrastructure condition, future FAST Act performance-based planning measures, energy consumption and Metro Vision s foundational measures and targets. Chapter 7 Performance and Outcomes of the 2040 Fiscally Constrained RTP 117
126 1. Travel and Mobility Performance Measures Table 7.1 shows changes in region-wide travel measures between 2015 and 2040 using forecasts from DRCOG s Focus transportation model. The Focus model uses the growth in population and employment from DRCOG s Urban Sim model, along with other input variables, to forecast transportation trends and performance. The region s population and employment growth, the distribution of that growth, and the provision of transportation facilities and services will affect future travel patterns. Key points from Table 7.1 include: Regional vehicle miles traveled (VMT) will increase at a rate slightly higher than population growth, meaning that VMT per capita will also increase slightly. Bicycle and walking trips together will increase almost 50 percent, much higher than population growth (37 percent) and slightly higher than VMT growth (44 percent). Vehicle hours of travel will increase about 60 percent, reflecting a substantial increase in traffic congestion and vehicle delay. Vehicle speeds in peak hours will average less than 24 miles per hour. The percentage of miles traveled in severe congestion will increase more than 50 percent. Severely congested lane miles will almost double. Total transit trips will increase by two-thirds. Rail boardings will more than double. The transit-job accessibility measure for all residents, especially those living in low-income and minority communities, will increase, due primarily to RTD FasTracks rapid transit, other bus rapid transit, and local bus service improvements transit data shown in Table 7.1 is modeled data, which will be different than RTD-reported boardings and other ridership characteristics. RTD measures the performance of its transit system both internally and externally (for example, National Transit Database reporting). RTD annually assesses the performance of each bus route and rail line by service class (see Page 2 of RTD s 2015 performance report for a list of service classes) using its current service standards, which emphasize subsidy per boarding and boardings per hour. RTD uses data gathered through the assessment to inform route and service adjustments. Through its Statewide Transportation Plan and Policy Directive 14, CDOT has developed a multimodal set of strategic policy initiatives with associated goals, performance measures, and strategies addressing safety, pavement condition, travel time reliability and maintenance. CDOT s annual performance plan describes the agency s strategic framework and performance tracking of its strategic policy initiatives. The Performance Plan is the most current example. 118 Chapter 7 Performance and Outcomes of the 2040 Fiscally Constrained RTP
127 Table 7.1: Transportation System Mobility Performance Measures System Measures - Weekday for DRCOG Region 2015 Baseline 2040 Forecast Change Population 3,139,900 4,304, % Households 1,269,300 1,814, % Employment 1,706,000 2,384, % Person Trips Within Region (Internal-Internal) SOV Drivers 5,338,600 7,225, % Internal-External SOV Drivers 12,800 21, % External-External SOV Drivers 256, , % Commercial Vehicle Trips 1,433,000 1,919, % Total SOV Driver Trips 7,040,400 9,596, % Drive Trips to and from Transit 94, , % Pedestrian/Bicycle Trips to and from Transit 473, , % Total Transit Trips (Bus and Rail) 284, , % Shared Ride Driver 1,990,500 2,678, % Shared Ride Passenger 2,770,400 3,690, % School Bus Trips 220, , % Bicycling Trips 148, , % Pedestrian Trips 787,700 1,109, % Total Person Trips: 13,810,400 18,986, % Vehicle & Congestion Performance Measures Vehicle Miles Traveled (VMT) 81,615, ,380, % Total Vehicle Trips 9,030,900 12,274, % VMT Per Capita % Vehicle Hours Traveled 2,466,500 3,951, % Vehicle Hours of Delay 515,200 1,093, % Person Miles Traveled (PMT) 110,997, ,637, % Person Hours Traveled 3,354,500 5,373, % Person Hours of Delay 700,600 1,487, % Average Vehicle Speed - All Day (mph) % Average Vehicle Speed - Peak Hours (mph) % Average Person Delay Per Trip (minutes) % VMT/PMT % Severely Congested Lane Miles (roadways with 3 or more hours of severe congestion) (volume to capacity ratio 0.95) 2,500 4, % Percent of VMT in Severe Congestion 18.3% 27.8% 51.9% Fixed Route Transit Performance Measures Rail Transit Boardings 132, , % Bus Transit Boardings 284, , % Total Transit Boardings: 416, , % Total Transit Trips 284, , % Person Miles Traveled on Transit 1,635,200 3,116, % Transit Share of Daily Work Trips 5.4% 6.9% 26.5% Transit Share of Total Daily Trips 2.4% 3.0% 23.4% Percent of Households Making a Transit Trip 11.6% 13.1% 12.9% Accessibility Performance Measures Share of total population with good transit-job accessibility (100,000+ jobs within a 45-minute transit trip) Share of population in low-income or minority areas with good transit-job accessibility (1) Source: DRCOG Travel Models RTP BaseYear, RTP2040 Year % 53% 63% 73% Chapter 7 Performance and Outcomes of the 2040 Fiscally Constrained RTP 119
 as well as current and forecasted system")
128 2. Facility and Infrastructure Condition Performance Measures a. CDOT Facilities CDOT has created a web-based performance portal as part of its home page ( The portal provides its latest performance plan as well as tables, charts, and maps showing how and where CDOT allocates its resources ( Your CDOT Dollar ) as well as current and forecasted system performance and quality. Figure 7.1: CDOT Highway Performance Report Card For example, for both highways and maintenance, CDOT provides a report card showing actual and long-range goal letter grades, yearly system performance trend data and budget trend data. Figure 7.1 shows a snapshot of the report card for highway conditions for CDOT facilities. CDOT uses a measurement known as Drivability Life to estimate the number of years a highway will have acceptable driving conditions. Drivability Life is a function of smoothness, pavement distress, and safety. Currently, 80 percent of CDOT s highway miles are rated high to moderate in Drivability Life. CDOT notes in its highway report card that declining revenues are making it difficult to sustain current conditions. Long-term funding is unable to keep pace with the pavement needs of Colorado s highway system. 120 Chapter 7 Performance and Outcomes of the 2040 Fiscally Constrained RTP

129 Figure 7.2: CDOT Pavement Conditions Figure 7.2 shows another example of CDOT s pavement condition performance, using a screenshot of CDOT s web-based map tool displaying current pavement condition in the DRCOG region for CDOT facilities. Most highways are shown as moderate with many designated low on CDOT s Drivability Life index. b. Local Facilities As shown in Chapter 5, maintaining the non-cdot Regional Roadway System at its current condition would cost an estimated $1.4 billion by As discussed in Chapter 5, DRCOG surveyed local governments within the region and CDOT to understand current pavement conditions, develop an average cost per lane mile, estimate an expenditure schedule to maintain current conditions through 2040 and estimate total roadway maintenance and reconstruction cost needs for the 2040 Fiscally Constrained RTP. DRCOG is further exploring methods to help local governments standardize the tracking and reporting of roadway and pavement conditions to improve data for existing and future condition, cost and expenditures. c. RTD RTD has an asset management program, including State of Good Repair (SGR) dashboard reports, to provide reliable, timely, and data-driven information concerning the performance, condition and age of RTD s assets. The program extends to the four FTA physical asset classifications, including rolling stock, facilities, infrastructure, and equipment. RTD uses several measures to assess its rolling stock (vehicle) assets. For example, the State of Good Repair Assets Condition Score is derived by scoring each asset for performance, condition, and age based on SGR standard scoring methodology. These scores are averaged into a non-weighted overall SGR score for each asset. In turn, asset scores are combined by category (bus Chapter 7 Performance and Outcomes of the 2040 Fiscally Constrained RTP 121
 using the FTA Transit Economic Requirements Model scoring scale.")
130 and light rail) and averaged to calculate an overall SGR score for each category. SGR scores range from zero to five (excellent condition) using the FTA Transit Economic Requirements Model scoring scale. For 2014, RTD bus and light rail vehicle assets stand at overall SGR scores of 3.7 and 4.1, respectively as shown in Figure 7.3: Figure 7.3: RTD State of Good Repair Scoring Example RTD will use the following additional performance measures for its rolling stock: Cost per Mile (used to select the most cost-effective product over its life cycle in future rolling stock acquisitions) Road Calls as In-Service Delay Minutes (relates to number and duration of road calls) Road Calls as Passenger Lost Minutes (relates to the effect of in-service delays on RTD passengers and ridership) Incidents (to help identify irregularities, where focused attention and preventive actions may improve performance and rider experience) RTD also publishes quarterly performance measure reports addressing several goals and associated objectives. As an example from the 2016 second-quarter report, Figure 7.4 shows the goals, objectives and partial performance measures addressing safety. As of January 2017, RTD established FAST Act performance-based transit physical asset management targets addressing state of good repair. RTD intends to update these targets as part of its Transit Asset Management Plan (TAMP). RTD s established targets, including periodic updates, are incorporated by reference for consideration in DRCOG s transportation planning process and planning documents, such as the MVRTP and the Transportation Improvement Program (TIP), where applicable, to address the FAST Act s performance-based planning requirements (discussed in Section A.3 below). In the future, 122 Chapter 7 Performance and Outcomes of the 2040 Fiscally Constrained RTP
131 DRCOG s FAST Act transit asset management targets will reflect RTD s periodically updated targets in its TAMP. d. Other Transit CDOT maintains a comprehensive rolling stock inventory for most transit operators in the state. The inventory includes human service transit providers in addition to fixed route transit agencies. Of the nine non-rtd transit providers in the Denver region (all human service transit providers), analysis of the inventory data shows that: they currently operate and maintain 129 vehicles, approximately 11 percent of the regions total (when RTD vehicles are included); of those 129 vehicles, almost 70 percent (89 vehicles) were operated by Seniors Resource Center and Via Mobility; and 77 percent of the 129 vehicles were rated in excellent, good or fair condition. Eighteen vehicles were rated marginal or poor, and the remaining 34 vehicles were not rated. Chapter 7 Performance and Outcomes of the 2040 Fiscally Constrained RTP 123

132 Figure 7.4: RTD Performance Measure Report Example 124 Chapter 7 Performance and Outcomes of the 2040 Fiscally Constrained RTP
133 3. FAST Act Performance Measures and Targets While federal rule-making and implementation of FAST Act performance-based planning requirements are not fully complete (as of early 2017), DRCOG, in coordination with CDOT and RTD, will be required to set targets for and report on multimodal transportation performance measures in the future. Based on several notices of proposed and final rulemaking issued by the Federal Highway Administration and Federal Transit Administration through January 2017, the performance-based planning measures are anticipated to include: Safety (all public roads) Number of fatalities Rate of fatalities Number of serious injuries Rate of serious injuries Number of combined non-motorized fatalities and serious injuries Infrastructure Percentage of pavement of the Interstate System in Good condition Percentage of pavement of the Interstate System in Poor condition Percentage of pavement of the non-interstate National Highway System in Good condition Percentage of pavement of the non-interstate National Highway System in Poor condition Percentage of National Highway System bridges classified in Good condition Percentage of National Highway System bridges in Poor condition System Performance Percentage of reliable person miles traveled on the Interstate System Percentage of reliable person miles traveled on the non-interstate National Highway System Percentage change in tailpipe CO2 emissions on the National Highway System compared to calendar year 2017 level Truck travel time reliability index (Interstate System) System Performance Congestion Mitigation Air Quality Program (CMAQ) Total tons of emissions reduced from CMAQ projects for applicable criteria pollutants and precursors Annual hours of peak hour excessive delay per capita (National Highway System) Percentage of non-single occupant vehicle travel, including travel avoided by telecommuting (National Highway System) Transit Asset Management State of good repair Chapter 7 Performance and Outcomes of the 2040 Fiscally Constrained RTP 125
134 DRCOG already reports performance on many topics. FAST Act-required performance-based planning targets will be set and published in future MVRTPs once federal requirements and timeframes have been finalized, and once CDOT has set targets. As a starting point example for the safety measures, Table 7.2 shows recent safety data for the Denver region in the performance-based planning format. Table 7.2: Safety Performance Measures Safety Performance Measure Number of Fatalities Rate of Fatalities (per 100 million VMT) Number of Serious Injuries Rate of Serious Injuries (per 100 million VMT) Number of Combined Non-Motorized Fatalities & Serious Injuries Source: Fatal Analysis Reporting System (FARS), NHTSA and CDOT-DRCOG crash database Data not yet available 4. Energy Consumption Performance Measures Energy consumption is closely related to greenhouse gas emissions associated with the burning of motor vehicle fuels. Direct energy consumption by motorists in 2040 will depend on changing behaviors relative to key factors discussed previously. Although somewhat hard to predict, a reduction in motor vehicle fuel consumption is anticipated. The estimated petroleum fuel burned by motor vehicles in the Denver region in 2015 was about 3.8 million gallons per day. This reflects an average overall fuel economy of 18.5 miles per gallon for the entire vehicle fleet of cars and trucks. It also equates to approximately 5 quarts (1.25 gallons) per capita per day. By 2040, the amount is estimated to drop to approximately 3.1 million gallons per day, even though VMT is forecasted to increase by about 32 percent. Average overall fuel economy is predicted to be 32.1 miles per gallon with 3 quarts (0.75 gallons) of fuel burned per capita per day. Most of the reduction in fuel burned will be due to more efficient engines and the increase in number of alternative fuel motor vehicles (for example, electricity and natural gas). The MVRTP also contains several other strategies and facilities that will help slow the growth in energy consumption. For example, operations management strategies will help keep cars, trucks and buses moving smoothly by reducing stop-and-go conditions and addressing key congestion points. Strategies to enhance the transit system and support travel demand management, bicycle and pedestrian improvements will provide travel choices to single-occupant vehicles. 126 Chapter 7 Performance and Outcomes of the 2040 Fiscally Constrained RTP
135 5. Metro Vision Performance Measures DRCOG s Metro Vision establishes a series of performance measures to help track progress toward the region s identified outcomes. The performance measures are based on: relevance to Metro Vision outcomes and objectives; availability of regularly updated and reliable data sources, and use of measurable quantitative information, rather than anecdotal insights. Each performance measure has an associated baseline (current status) and a 2040 target (desired future outcome), shown in Table 7.3. DRCOG will periodically report on Metro Vision implementation progress using these performance measures, with reporting frequency based on data availability. As new information becomes available or circumstances change, targets or the methodology for measuring success may be refined. The 2040 targets represent a balance between reasonably achievable and aspirational targets for the region. Accordingly, Metro Vision s targets in Table 7.3 and the 2040 forecasts in Table 7.1 from DRCOG s Focus transportation model are not directly comparable. Metro Vision and the targets in Table 7.3 are a starting point for implementation through collective initiatives and actions of the entire region DRCOG, local governments and other stakeholders. The 2040 forecasts in Table 7.1 are a snapshot of current conditions that will continue to change as the region works together to implement Metro Vision. As the region identifies specific projects, services, programs, actions and initiatives, the MVRTP will be updated accordingly. Chapter 7 Performance and Outcomes of the 2040 Fiscally Constrained RTP 127
136 Table 7.3: Metro Vision Foundational Measures Performance Measure Share of the region s housing and employment located in urban centers Where are we today? (Baseline) Housing: 10.0 percent (2014) Employment: 36.3 percent (2014) Where do we want to be? (2040 Target) Housing: 25.0 percent Employment: 50.0 percent Regional population-weighted density Non-single-occupant vehicle mode share to work Daily vehicle miles traveled per capita Average travel time variation (peak vs. off-peak) 850 people per square mile (2014) 25 percent increase from percent (2014) 35.0 percent 25.5 daily VMT per capita (2010) 10 percent decrease from (2014) Less than 1.30 Daily person delay per capita 6 minutes (2014) Less than 10 minutes Number of traffic fatalities 185 (2014) Fewer than 100 annually Surface transportation-related greenhouse gas emissions per capita 26.8 pounds per capita (2010) 60 percent decrease from 2010 Protected open space 1,841 square miles (2014) 2,100 square miles Share of the region s housing and employment in high-risk areas Housing: 1.2 percent (2014) Employment: 2.9 percent (2014) Less than 1.0 percent Less than 2.5 percent Share of the region s population living in areas with housing and transportation costs affordable for the typical household in the region 41 percent (2013) 50 percent Regional employment 1.8 million (2014) 2.6 million (1 to 1.5 percent annual growth) Share of the region s housing and employment near high-frequency transit Housing: 29.7 percent (2014) Employment: 48.4 percent (2014) 35.0 percent 60.0 percent 128 Chapter 7 Performance and Outcomes of the 2040 Fiscally Constrained RTP
137 B. Environmental Justice An important consideration for the MVRTP is its potential benefits to, and impacts on, the minority and low-income populations within the Denver region, as well as in comparison to benefits and impacts on the region s population as a whole. Guidance for evaluating these benefits and impacts is derived from Executive Order 12898, Federal Actions to Address Environmental Justice in Minority and Low Income Populations, signed by President Bill Clinton on Feb. 11, The executive order and accompanying memorandum reinforced the requirements of Title VI of the Civil Rights Act of 1964 that address federal attention on environmental and human health conditions in minority and low-income communities. The U.S. Department of Transportation order on environmental justice, issued to comply with Executive Order 12898, defines a member of a minority population as a person who is: Black (having origins in any of the black racial groups of Africa); Hispanic (of Mexican, Puerto Rican, Cuban, Central or South American, or other Spanish culture or origin, regardless of race); Asian American (having origins in any of the original peoples of the Far East, Southeast Asia, the Indian subcontinent, or the Pacific Islands), or American Indian and Alaskan Native (having origins in any of the original people of North America and who maintains cultural identification through tribal affiliation or community recognition). A low-income person means a person whose median household income is at or below the Department of Health and Human Services (HHS) poverty guidelines. For 2014, the poverty threshold guideline for a family of four was $23,850. Per federal requirements, transportation plans and programs (1) must provide a fully inclusive public outreach program, (2) should not disproportionately impact minority and low-income communities, and (3) must ensure the receipt of benefits by minority and low-income populations. The 2040 MVRTP addresses these three principles and they were considered throughout the decision-making process. Per federal requirements, these principles must also be considered in the project design and implementation phases for future specific projects. Geographic Concentrations of Environmental Justice Communities The first step in the environmental justice evaluation process for the 2040 MVRTP was to identify geographic concentrations of minority and low-income populations. The transportation analysis zones identified with Chapter 7 Performance and Outcomes of the 2040 Fiscally Constrained RTP 129
138 concentrations of either minority individuals or low-income households make up the environmental justice areas of the region. Figure 7.5 shows the transportation analysis zones where, based on Census Transportation Planning Package (CTPP) data, the percent of minority population is at or above the regional minority percentage of 33 percent. It also shows the traffic analysis zones for which the percentage of households, by size, with incomes at or below the 2014 HHS poverty guidelines as applied to the CTPP data, is at or above the regional percentage of 11 percent. Figure 7.6 shows the same information for the central urban area. Both figures also display the location of regionally funded roadway and rapid transit capacity projects in relation to the environmental justice areas. 130 Chapter 7 Performance and Outcomes of the 2040 Fiscally Constrained RTP
139 Figure 7.5: 2040 Fiscally Constrained Regionally Funded Projects and Environmental Justice Areas Chapter 7 Performance and Outcomes of the 2040 Fiscally Constrained RTP 131

140 Figure 7.6: Fiscally Constrained Regionally Funded Projects and Environmental Justice Areas - Central Urban Area 132 Chapter 7 Performance and Outcomes of the 2040 Fiscally Constrained RTP
141 Travel Characteristics of Minority and Low-Income Populations DRCOG staff conducted an evaluation of the work travel characteristics of the Denver region s minority and low-income populations based on Census data, as shown in Tables 7.4 and 7.5. Table 7.4: Minority Means of Transportation to Work Taxi, Motorcycle, Bicycle or Other Drove Alone Carpooled Transit Walked Means Worked at Home Regional Total Workers Total % Total % Total % Total % Total % Total % Total % White, Non-Hispanic or Latino 844, % 74, % 39, % 26, % 27, % 93, % 1,105, % Minority 382, % 72, % 33, % 13, % 8, % 19, % 531, % Total 1,227, % 146, % 73, % 40, % 36, % 112, % 1,637, % Source: U.S. Census Bureau, American Community Survey 5-Year Estimates (B08105 tables) Table 7.5: Means of Transportation to Work by Worker Earnings Taxi, Motorcycle, Bicycle, or Other Drove Alone Carpooled Transit Walked Means Worked at Home Regional Total Worker Earnings Total % Total % Total % Total % Total % Total % Total % $34,999 and under 488, % 75, % 39, % 24, % 16, % 44, % 688, % $35,000 to $49, , % 21, % 9, % 4, % 4, % 12, % 255, % $50,000 to $74, , % 20, % 9, % 4, % 5, % 17, % 278, % $75,000 or more 259, % 17, % 10, % 4, % 8, % 36, % 337, % Total 1,172, % 135, % 68, % 37, % 35, % 110, % 1,559, % Source: U.S. Census Bureau, American Community Survey 5-Year Estimates (B08119 table) This analysis revealed several key findings: Driving alone is the most prevalent travel mode to work for all races and income levels. More than 70 percent the population of every race and income level drive alone to work. A greater share of minority and low-income populations take transit to work about six percent. Minority populations are twice as likely to take transit or carpool to work, and are less likely to taxi, bicycle or work from home. Driving alone to work and teleworking rates both generally increase as income levels increase. According to the 2010 Census (Census Transportation Planning Package), about 70,000 households throughout the Denver region did not have an automobile available, whether by choice or circumstance. To ensure that residents of these households can travel to work, school or medical care, it is important that travel options such as public transit, sidewalks, and bicycle paths are provided. Chapter 7 Performance and Outcomes of the 2040 Fiscally Constrained RTP 133
142 Benefits of the MVRTP in Environmental Justice Communities The MVRTP includes many projects, services and policies that will improve transportation for people living in environmental justice communities and especially for those unable to use an automobile to travel. It will also provide a system that connects people with a greater number of job opportunities via convenient commutes. Figure 7.5 and Figure 7.6 also display the location of regionally funded roadway and rapid transit capacity projects in relation to environmental justice areas. Several beneficial projects will directly serve residents in these areas. Many other smaller-scale projects and services will be provided through future Transportation Improvement Programs. Many future roadway projects will include multimodal elements that will benefit non-drivers. As discussed in Chapter 5, more than half of the MVRTP s fiscally constrained regional system expenditures will be for public transit and other non-roadway projects and services. Several additional rapid transit rail lines and extensions will be completed by RTD as part of FasTracks. Additionally, BRT and/or managed lanes have been or will be added to US-36, SH-119, Colfax Avenue, I-25 North, I-70 and C-470. Bus service will also increase through The fiscally constrained Rapid Transit System, shown in Figure 6.2, is also displayed in Figures 7.5 and 7.6 in relation to environmental justice areas. Transit accessibility to jobs will improve as the FasTracks system continues to be built out. Table 7.1 shows the share of population within environmental justice areas that met the good transit-job accessibility criterion used by DRCOG in 2015 (63 percent) and would meet the criterion in 2040 (73 percent) with implementation of the fiscally constrained multimodal transportation projects, programs and services. The criterion requires having at least 100,000 jobs located within a 45-minute transit trip of home, and is based on calculations from DRCOG s Focus travel model. Other beneficial components of the 2040 MVRTP include extensive additions to the bicycle and pedestrian system, expansion of demand-responsive transit service, and increased outreach by DRCOG s Way to Go Program (carpool/vanpool matching service and other transportation demand management strategies). All of the components described above are very beneficial in helping individuals with mobility challenges find transportation. Additionally, roadway capacity projects that reduce congestion will benefit the majority of all populations that travel by car to work, including minority populations. 134 Chapter 7 Performance and Outcomes of the 2040 Fiscally Constrained RTP
143 In addition to the extensive transit system expansion that RTD is implementing, the 2040 MVRTP provides additional funding sources to serve the needs of low-income and minority populations. For example, the Federal Transit Administration has grant programs that provide potential benefits to environmental justice communities (although they do not specifically address minority populations). These grant programs allow, but do not require, expenditures toward developing new transportation options for welfare recipients and other low-income individuals to access employment and job training. They also provide funding to increase transportation options for older adults and individuals with disabilities. Potential Impacts of the Fiscally Constrained MVRTP in Environmental Justice communities The recommendations contained within the MVRTP should not have disproportionate adverse impacts on the region s low-income or minority communities. Negative impacts of the transportation system, such as air pollution, excessive noise and crashes would occur throughout the region. Similarly, negative impacts of transportation projects, such as construction effects and right-of-way acquisitions, would be associated with the improvements shown in Figures 7.5 and 7.6, and are not disproportionately located in lowincome or minority communities. The MVRTP does not reflect final alignments, design attributes, or approvals for projects that are identified. Regionally significant projects can be conceptual in nature and may change after environmental impact statements or other studies define specific details, such as exact alignment, cross-section, cost, construction schedule, or operational details. Per federal requirements, environmental studies must be conducted before any transportation project involving federal funds or actions can be constructed. These studies must define mitigation, minimization or abatement strategies that address the following example environmental topics: noise levels right-of-way and property takings water quality parks site-specific air quality fish and wildlife social, community and economic impacts wetlands hazardous materials Chapter 7 Performance and Outcomes of the 2040 Fiscally Constrained RTP 135
144 Other Environmental Justice Considerations DRCOG is in the process of preparing a Status and Impacts of DRCOG Transportation Planning and Programming with Environmental Justice report. This report describes how DRCOG incorporates environmental justice principles into its long- and short- range planning activities, with an emphasis on the MVRTP and the Transportation Improvement Program. The report also includes information on DRCOG s Limited English Proficiency Plan and Civil Rights and Title VI procedures. C. Environmental Mitigation The DRCOG region includes diverse environmental and ecological resources. These include extensive municipal, county, state, and federal parks and public lands that are used by many residents and visitors, a comprehensive bicycle and pedestrian trail network, numerous areas of wildlife habitat of both Colorado species of special concern and federally protected threatened and endangered species, and archaeological and historic resources. Protection of the environment is a key tenet in developing the region s multimodal transportation system. The FAST Act contains requirements for identifying environmental resources potentially affected by the transportation plan. Figures illustrate several features of the Denver region s environmental and ecological resources and features. Figure 7.7 shows regional open space, floodplains, lakes and rivers. Figure 7.8 shows habitat for federal- and state-designated threatened and endangered species, while Figure 7.9 shows large mammal habitat that are most common or pervasive in the Denver region (and thus may potentially have bearing in the transportation project development process). Finally, Figure 7.10 shows wildfire risk using data from the Colorado Wildfire Risk Assessment Portal. It should be emphasized that identifying environmental resources and features at a regional scale is most useful for conceptual perspective and context. Doing so is not intended to address National Environmental Policy Act (NEPA) requirements that apply to the project development process, not to the MVRTP. In addition to identifying environmental resources potentially affected by the transportation plan, the FAST Act also contains requirements to develop mitigation activities for natural and historic resources. Further, these mitigation strategies must be developed in consultation with federal, state and tribal wildlife, land management and regulatory agencies (resource agencies). Planning and environmental processes have historically been conducted separately from one another. However, as reinforced in the federal Metropolitan Planning Rule, it is Congressional intent to more closely link them together to streamline the 136 Chapter 7 Performance and Outcomes of the 2040 Fiscally Constrained RTP
145 transportation planning and NEPA processes, reduce the duplication of work and expedite the delivery of transportation projects. The following overall mitigation strategy applies generally to all resources in all corridors: 1. Avoidance: Alter the project so an impact does not occur. 2. Minimization: Modify the project to reduce the severity of the impact. 3. Mitigation: Undertake an action to alleviate or offset an impact or to replace an appropriated resource. Examples of regional mitigation strategies include: Lynx in-lieu fee mitigation: Developed by CDOT, the Federal Highway Administration, and the U.S. Fish and Wildlife Service, this effort allows individual transportation construction projects to contribute to a fund as their mitigation of impacts to Canada lynx. Doing so streamlined the mitigation process and facilitated a better conservation effort than if the funds were restricted to a specific project location or a lesser mitigation type. As CDOT notes, it is the only in-lieu mitigation program for the Canada lynx in the country, and is the first in lieu fee bank to be run by a state department of transportation. Shortgrass Prairie Initiative: Also developed by CDOT, the Federal Highway Administration, the U.S. Fish and Wildlife Service, along with the Colorado Division of Wildlife and the Nature Conservancy, this initiative is preserving thousands of acres of shortgrass prairie in eastern Colorado while also improving the efficiency and effectiveness of environmental measures associated with CDOT s routine maintenance activities. In developing the 2040 MVRTP, DRCOG participated in CDOT s Planning Insight Network (PIN), an interactive web-based mapping tool and process to solicit environmental consultation by resource agencies on major projects and travel corridors. DRCOG submitted to CDOT a representative list of major freeway and arterial roadway capacity projects to map in the PIN Tool for consultation and comment by resource agencies. DRCOG then reviewed the comments received from resource agencies. Specific mitigation strategies are developed as part of the NEPA environmental review process during project development activities. The project-level NEPA process is a separate and more detailed process than what is required for the MVRTP. Additionally, many regionally significant projects identified in the MVRTP are conceptual in nature, with exact alignment, design, and other project scope elements to be Chapter 7 Performance and Outcomes of the 2040 Fiscally Constrained RTP 137
146 determined in the project development process. For many projects, this process may not occur for years, or even decades. However, many corridors in the DRCOG region are the sites of proposed improvements that have either recently completed the NEPA process with a Finding of No Significant Impact or a Record of Decision, or are currently undergoing the NEPA process. These NEPA studies are led by implementing agencies such as CDOT and RTD, and must undergo extensive coordination and consultation with resource and regulatory agencies as they are developed. These documents contain, or will contain, detailed mitigation strategies. DRCOG staff often serve on technical committees and review draft project-level NEPA documents associated with the development process for specific projects and corridors. While it is the project sponsor s role to ensure compliance with all federal requirements, including NEPA, DRCOG staff review NEPA documents to ensure consistency or a lack of conflicts with the MVRTP and other DRCOG plans and programs. DRCOG also participates in CDOT s Transportation Environmental Resource Council (TERC), a consortium of federal, state and local agencies to plan for environmental stewardship in the transportation planning process. CDOT also developed its Environmental Stewardship Guide to assist internal and external users who want an overview of the transportation decision-making process and a better understanding of the environmental considerations contained in that process. 138 Chapter 7 Performance and Outcomes of the 2040 Fiscally Constrained RTP

147 Figure 7.7: Regional Open Space and Floodplains Chapter 7 Performance and Outcomes of the 2040 Fiscally Constrained RTP 139

148 Figure 7.8: Threatened and Endangered Species Habitat 140 Chapter 7 Performance and Outcomes of the 2040 Fiscally Constrained RTP

149 Figure 7.9: Large Mammal Habitat Chapter 7 Performance and Outcomes of the 2040 Fiscally Constrained RTP 141

150 Figure 7.10: Wildfire Risk 142 Chapter 7 Performance and Outcomes of the 2040 Fiscally Constrained RTP
2040 Fiscally Constrained Regional Transportation Plan
 Denver Regional Council of Governments 2040 Fiscally Constrained Regional Transportation Plan Public Hearing Draft December 18, 2014 1290 Broadway, Suite 700 Denver, CO 80203 www.drcog.org Preparation
2040 Fiscally Constrained Regional Transportation Plan
 Denver Regional Council of Governments 2040 Fiscally Constrained Regional Transportation Plan TAC Review Draft: December 1, 2014 DRCOG Board Adoption: 1290 Broadway, Suite 700 Denver, CO 80203 www.drcog.org
A Connected Multimodal Region
 A Connected Multimodal Region Attachment 1 Introduction The nine-county DRCOG region aspires to have a connected multimodal transportation system that increases mobility and provides viable travel choices
APPENDIX A - PLANS AND POLICY REVIEW FEBRUARY 2017
 APPENDIX A - PLANS AND POLICY REVIEW FEBRUARY 2017 DENVERMOVES Transit Denver Moves: Transit APPENDIX A PLANS AND POLICY REVIEW 2035 Metro Vision Regional Transportation Plan (MVRTP) (2011) 2040 Fiscally
Summary of transportation-related goals and objectives from existing regional plans
 SMTC 2050 Long Range Transportation Plan Appendix A: Summary of transportation-related goals and objectives from existing regional plans SMTC 2050 Long Range Transportation Plan Summary of transportation-related
Transportation and Utilities
 4 Section 4 Transportation and Utilities 4.0 Introduction Transportation and utility systems are essential to accommodate and support development proposed in the Future Land Use Map. The following pages
MOBILITY 2045: A FOCUS ON TRANSPORTATION CHOICE:
 Mobility 2045: The Metropolitan Transportation Plan for North Central Texas is the defining vision for the multimodal transportation system in the Dallas- Fort Worth Metropolitan Planning Area. The plan,
Chapter 3 - Goals, Objectives, & Strategies
 Chapter 3 - This chapter presents goals, objectives, and strategies that have been developed as part of the Richmond Area MPO 2026 Long-Range Transportation Plan (LRTP) update. Strategies have been developed
The Policies section will also provide guidance and short range policies in order to accomplish the goals and objectives.
 4 Goals & Objectives INTRODUCTION The 2015-2040 MTP preserves and promotes the quality of life and economic prosperity of the MAB by providing a transportation system consistent with the regional goals.
GOALS AND PERFORMANCE MEASURES
 PLANNING FRAMEWORK The planning framework guides the development of the Regional Transportation Plan, articulating what the region is trying to achieve. This chapter establishes a foundation to focus data-gathering
GUIDING PRINCIPLES MEMORANDUM
 M E T R O P O L I TAN TRA NS P O RTATI O N PLAN GUIDING PRINCIPLES MEMORANDUM El Paso Metropolitan Planning Organization INTRODUCTION The guiding principles for development of the El Paso MPO s Destino
EXAMPLES OF COMPREHENSIVE PLAN POLICIES HOW TO ESTIMATE THE BENEFITS OF THE CTR PROGRAM
 TABLE OF CONTENTS INTRODUCTION... I BACKGROUND OF THE COMMUTE TRIP REDUCTION EFFICIENCY ACT... II MAKING THE CONNECTION BETWEEN COMMUTE TRIP REDUCTION AND THE GROWTH MANAGEMENT ACT... IV CTR PLANNING AND
SUBURBAN EDGE COMMUNITY ROLE COUNCIL ROLE ALL COMMUNITIES SUBURBAN EDGE
 Orderly and Efficient Land Use Align land use, development patterns, and infrastructure to make the best use of public and private investment. Plan and stage development for forecasted growth through 2040
CHAPTER 2. VISION, GOALS AND MTP FRAMEWORK
 CHAPTER 2. VISION, GOALS AND MTP FRAMEWORK MTP VISION In order to create a framework for the 2040 Metropolitan Transportation Plan (MTP), a vision statement was drafted by the Vision/Goals Committee and
Denver Regional Council of Governments. FY 2016 and FY 2017 UNIFIED PLANNING WORK PROGRAM FOR THE DENVER REGION
 Denver Regional Council of Governments FY 2016 and FY 2017 UNIFIED PLANNING WORK PROGRAM FOR THE DENVER REGION Adopted July 15, 2015 Amended July 20, 2016 Administratively Amended February 8, 2017 ii ABSTRACT
TRANSPORTATION RELATIONSHIP TO OTHER ELEMENTS OF THE PLAN AND COUNTY REGULATIONS VISION FOR TRANSPORTATION PLANNING ROAD NETWORK SECTION 7
 TRANSPORTATION Like many growing western counties, Douglas County focuses on one of the most integral elements in land-use planning: transportation. The primary purpose of a transportation network is to
EXECUTIVE SUMMARY REGIONAL TRANSPORTATION PLAN 2050
 EXECUTIVE SUMMARY REGIONAL TRANSPORTATION PLAN 2050 Introduction Goals Policies, and Performance Measures Growth Forecast and Planned Land Use Development Key Recommendations i Executive Summary April
Denver Regional Council of Governments. FY 2018 and FY 2019 UNIFIED PLANNING WORK PROGRAM FOR THE DENVER REGION
 Denver Regional Council of Governments FY 2018 and FY 2019 UNIFIED PLANNING WORK PROGRAM FOR THE DENVER REGION Adopted July 19, 2017 ii ABSTRACT TITLE: AUTHOR: SUBJECT: FY 2018 and FY 2019 Unified Planning
Chapter 5 Transportation Draft
 Chapter 5 Transportation Draft Discussion Similar to the other elements in the Comprehensive Plan, the transportation element impacts the quality of life, economic development and public safety of the
RURAL CENTER COMMUNITY ROLE COUNCIL ROLE RURAL CENTER ALL COMMUNITIES
 Orderly and Efficient Land Use Align land use, development patterns, and infrastructure to make the best use of public and private investment. Plan for forecasted population and household growth at overall
2030 Transportation Policy Plan SUMMARY PRESENTATION. Land Use Advisory Committee November 15, 2012
 2030 Transportation Policy Plan SUMMARY PRESENTATION Land Use Advisory Committee November 15, 2012 Today s Topics Transportation Policy Plan (TPP) Requirements and Background Current TPP Policies, Issues
MONITORING IMPLEMENTATION AND PERFORMANCE
 12 MONITORING IMPLEMENTATION AND PERFORMANCE The FAST Act continues the legislation authorized under MAP-21, which created a data-driven, performance-based multimodal program to address the many challenges
I-70 East ROD 1: Phase 1 (Central 70 Project) Air Quality Conformity Technical Report
 Air Quality Conformity Technical Report") I-70 East ROD 1: Air Quality Conformity Technical Report January 2017 I-70 East ROD 1: Air Quality Conformity Technical Report TABLE OF CONTENTS Chapter Page 1 PURPOSE OF THIS REPORT... 1 2 PROJECT DESCRIPTION...
I-70 East ROD 1: Air Quality Conformity Technical Report January 2017 I-70 East ROD 1: Air Quality Conformity Technical Report TABLE OF CONTENTS Chapter Page 1 PURPOSE OF THIS REPORT... 1 2 PROJECT DESCRIPTION...
What is the Transportation Policy Plan (TPP)?
?") Summary What is the Transportation Policy Plan (TPP)? The region s long range transportation plan Includes all modes of transportation: highways, transit, airports, freight, biking, pedestrians Meets the
Summary What is the Transportation Policy Plan (TPP)? The region s long range transportation plan Includes all modes of transportation: highways, transit, airports, freight, biking, pedestrians Meets the
REGIONAL VISION REGIONAL GOALS
 REGIONAL VISION Greater Kansas City is a region of opportunity. Its robust economy, healthy environment and social capacity support the creativity, diversity and resilience of its people, places and communities.
Contents i Contents Page 1 A New Transportation Plan Community Involvement Goals and Objectives... 11
 Contents i Contents 1 A New Transportation Plan... 1 Why develop a new plan?... 1 What area does the LRTP focus on?... 2 Why is this LRTP important?... 3 Meeting Requirements for Transportation Planning...
The Role of Transportation Systems Management & Operations in Supporting Livability and Sustainability
 The Role of Transportation Systems Management & Operations in Supporting Livability and Sustainability Michael Grant, ICF International February 7, 2012 NTOC Webinar Highlights of FHWA/FTA Primer Background:
Tri-County Regional Planning Commission 2045 Regional Metropolitan Transportation Plan Goals and Objectives Adopted March 22, 2017
 Tri-County Regional Planning Commission 2045 Regional Metropolitan Transportation Plan Goals and Objectives Adopted March 22, 2017 One of the initial steps in the development of the TCRPC 2045 Metropolitan
Statewide Transit Plan
 Statewide Transit Plan connecting people across Colorado Prepared for: Colorado Department of Transportation Division of Transit and Rail March 05 Prepared by: In association with: Cambridge Systematics
2040 Addendum Performance-Based Planning November 2018
 2040 Long Range Transportation Plan 2040 Addendum Performance-Based Planning November 2018 Adopted June 13, 2018 250 S. Orange Ave, Suite 200, Orlando, FL 32801 407-481-5672 www.metroplanorlando.org MetroPlan
RESOLUTION NO
 RESOLUTION NO. 2018-12 RESOLUTION OF THE SOUTHEASTERN WISCONSIN REGIONAL PLANNING COMMISSION AMENDING THE TRANSPORTATION IMPROVEMENT PROGRAM FOR SOUTHEASTERN WISCONSIN: 2017-2020 WHEREAS, the Southeastern
RURAL RESIDENTIAL COMMUNITY ROLE COUNCIL ROLE RURAL RESIDENTIAL ALL COMMUNITIES
 Orderly and Efficient Land Use Align land use, development patterns, and infrastructure to make the best use of public and private investment. Discourage future development of rural residential patterns
Congestion Management Process (CMP)
") Congestion Management Process (CMP) Introduction The Congestion Management Process (CMP) is a systematic, data-driven, and regionally accepted approach that aims to improve the performance of the transportation
Congestion Management Process (CMP) Introduction The Congestion Management Process (CMP) is a systematic, data-driven, and regionally accepted approach that aims to improve the performance of the transportation
2040 Transportation Policy Plan Conversion to Performance Based Planning Basis. 25 th Annual CTS Transportation Research Conference May 21, 2014
 2040 Transportation Policy Plan Conversion to Performance Based Planning Basis 25 th Annual CTS Transportation Research Conference May 21, 2014 1 About the plan Long-range transportation plan for the Twin
Addendum 1: Performance Measures
 Addendum 1: 2 Addendum Livability 2040 Regional Transportation Plan Table of Contents 1.0 Introduction... 3 Federal Requirements... 3 MPO Measure Targets... 4 2.0 Safety Measure Targets... 9 3.0 Transit
Base Information. 1. Project Title SH52 Planning & Environmental Linkages (PEL) Study
 Study") Part 1 Base Information 1. Project Title SH52 Planning & Environmental Linkages (PEL) Study 2. Project Start/End points or Geographic Area Provide a map with submittal, as appropriate 3. Project Sponsor
Part 1 Base Information 1. Project Title SH52 Planning & Environmental Linkages (PEL) Study 2. Project Start/End points or Geographic Area Provide a map with submittal, as appropriate 3. Project Sponsor
Chapter 14 Work Program
 Chapter 14 Work Program The Metropolitan Council will carry out or participate in many studies and plans over the next three years. This is not an exhaustive list of all work to be completed by the Metropolitan
ONE NEVADA TRANSPORTATION PLAN The Nevada Department of Transportation s Long-Range Transportation Plan
 Executive Summary The s Long-Range Transportation Plan SAFETY, INFRASTRUCTURE, MOBILITY, ECONOMY, SUSTAINABILITY, COMMUNITY This Plan is Our Plan! A Transportation Plan by Nevadans, for Nevada How safely,
SCS Scenario Planning
 E SCS Scenario Planning Introduction As part of the 2035 MTP/SCS process, AMBAG developed a series of land use and transportation alternative scenarios for evaluation and testing to demonstrate how the
2. Guiding Principles, Objectives, and Policies
 2. Guiding Principles, Objectives, and Policies INTRODUCTION The guiding principles for the 2040 MTP Update establish the vision and key focus areas for this planning effort. They combine the guidance
PURPOSE OF THE TRANSPORTATION IMPROVEMENT PROGRAM (TIP)
") INTRODUCTION PURPOSE OF THE TRANSPORTATION IMPROVEMENT PROGRAM (TIP) The Transportation Improvement program (TIP) is a staged, four-year program of projects proposed for funding by federal, State, and
INTRODUCTION PURPOSE OF THE TRANSPORTATION IMPROVEMENT PROGRAM (TIP) The Transportation Improvement program (TIP) is a staged, four-year program of projects proposed for funding by federal, State, and
Performance Measures Workshop, May 18, 2017
 Measuring What Matters: Above and Beyond Requirements Performance Measures Workshop, May 18, 2017 Presentation Overview Background - origin and evolution of the Regional Outcomes Framework. Regional Outcomes
Addendum #3 to the Regional Transportation Plan
 Nashville Area Metropolitan Planning Organization Addendum #3 to the Regional Transportation Plan Effective November 21, 2018 Nashville Area Metropolitan Planning Organization 138 Second Avenue North Nashville,
URBAN CENTER COMMUNITY ROLE COUNCIL ROLE ALL COMMUNITIES URBAN CENTER
 Orderly and Efficient Land Use Align land use, development patterns, and infrastructure to make the best use of public and private investment. Plan for forecasted population and household growth at average
Chapter 2 Transportation Policy Plan Strategies
 Chapter 2 Transportation Policy Plan Strategies As discussed in Chapter 1, the current federal transportation law, Fixing America s Surface Transportation Act (FAST Act), mandates a streamlined and performance-based
Fort Collins and Greeley Carbon Monoxide Maintenance Areas Conformity Determination
 Updated March 3, 2017 Fort Collins and Greeley Carbon Monoxide Maintenance Areas Conformity Determination for the North Front Range Metropolitan Planning Area 2040 Fiscally Constrained Regional Transportation
DIVERSIFIED RURAL COMMUNITY ROLE COUNCIL ROLE DIVERSIFIED RURAL ALL COMMUNITIES
 Orderly and Efficient Land Use Align land use, development patterns, and infrastructure to make the best use of public and private investment. Plan for growth not to exceed forecasts and in patterns that
Chapter 5 - Transportation
 Chapter 5 - Transportation Discussion Similar to the other elements in the Comprehensive Plan, the transportation element impacts the quality of life, economic development and public safety of the residents
12 Evaluation of Alternatives
 12 Evaluation of Alternatives This chapter evaluates the effectiveness of the No-Build Alternative and the proposed METRO Blue Line Light Rail Transit (BLRT) Extension project based on the information
Northern Virginia Region Draft Needs Summary
 Needs Map: Need A A DEMAND The ability of communities around transit stations (particularly the areas within 1-2 miles of the stations and other travel hubs) to attract skilled workers and grow businesses
APPENDIX B - GLOSSARY FEBRUARY 2017
 APPENDIX B - GLOSSARY FEBRUARY 2017 DENVERMOVES Transit Denver Moves: Transit - ii - APPENDIX B TRANSIT AND MOBILITY GLOSSARY Amenities, stop or station: Objects or facilities (such as a shelter, bench,
WTP 2035 DRAFT STRATEGIES AND ACTIONS
 INTRODUCTION This Working Paper presents draft strategies and actions to be considered for inclusion in the draft Washington Transportation Plan 2035. It includes reference to the existing WTP 2030 strategies
9.0 Meeting the Challenges
 9.0 Meeting the Challenges 9.1 SLRTP Goals The SLRTP is built around the six TxDOT Strategic Plan goals. 1. Develop an organizational structure and strategies designed to address the future multimodal
Moving Forward 2040 Long Range Transportation Plan Bicycle Mobility Master Plan Transit Master Plan
 Moving Forward 2040 Long Range Transportation Plan Bicycle Mobility Master Plan Transit Master Plan Paul DiGiuseppe Assistant Chief, Division of Planning Department of Administration (DOA) Needed to keep
Technical Memorandum#1A
 Technical Memorandum#1A Goals, Objectives, and Performance Measures AMATS 2040 Metropolitan Transportation Plan Prepared for: AMATS Prepared by: HDR Approved by AMATS PC September 28, 2017 This page intentionally
4: Transportation and Land Use
 Chapter Figure 4-1: Recent development has brought more housing and mixed use Downtown Minneapolis - looking north from E 15th Street at the Grant Street / 11th Street exit 4: Transportation and Land Use
CHAPTER HIGHLIGHTS GOALS AND GUIDING POLICIES 60 SEEKING PUBLIC INPUT TO REFINE SCENARIOS FOR OUR FUTURE 61
 04 CHAPTER HIGHLIGHTS GOALS AND GUIDING POLICIES 60 SEEKING PUBLIC INPUT TO REFINE SCENARIOS FOR OUR FUTURE 61 SCENARIOS FOR THE FUTURE: IT S OUR CHOICE 63 CREATING A PLAN FOR OUR FUTURE The RTP/SCS is
Appendix O Congestion Management Program REGIONAL TRANSPORTATION PLAN/SUSTAINABLE COMMUNITIES STRATEGY
 Appendix O Congestion Management Program REGIONAL TRANSPORTATION PLAN/SUSTAINABLE COMMUNITIES STRATEGY 2014 REGIONAL CONGESTION MANAGEMENT PROGRAM 2014 RTP/SCS APPENDIX O SAN JOAQUIN COUNCIL OF GOVERNMENTS
AICP EXAM REVIEW. Transportation Planning. February 19, 2016
 AICP EXAM REVIEW Transportation Planning February 19, 2016 Agenda Defining transportation planning Transportation stakeholders Transportation plan development Transportation funding Project development
ACTIVE TRANSPORTATION ADVISORY COMMITTEE. Memphis MPO March 30, 2015
 ACTIVE TRANSPORTATION ADVISORY COMMITTEE Memphis MPO March 30, 2015 Agenda Welcome & Introductions Announcements and Briefings Livability 2040: Regional Transportation Plan Congestion Management Process
MEMORANDUM #4. DATE: November 4, Warrenton TSP Project Management Team. Ray Delahanty, AICP, DKS Associates Kate Petak, EIT, DKS Associates
 MEMORANDUM #4 DATE: November 4, 2015 TO: FROM: SUBJECT: Warrenton TSP Project Management Team Ray Delahanty, AICP, DKS Associates Kate Petak, EIT, DKS Associates Warrenton Transportation System Plan Update
Chapter 4: Transportation and Land Use
 Chapter 4: Transportation and Land Use Transportation and land use together make possible the wide range of destination opportunities in the region. Transportation provides the connections, and, in turn,
New York Metropolitan Transportation Council. Plan Regional Transportation Plan A Shared Vision for a Sustainable Region
 New York Metropolitan Transportation Council Plan 2040 Regional Transportation Plan A Shared Vision for a Sustainable Region ADOPTED ON SEPTEMBER 4, 2013 Disclaimer This document was funded in part through
AIR QUALITY AND CLIMATE CHANGE EVALUATION GUIDANCE
 AIR QUALITY AND CLIMATE CHANGE EVALUATION GUIDANCE The following guidance provides additional details regarding the process followed by PSRC to evaluate projects for potential air quality benefits. As
2011 Amendment Cycle 1 DRCOG CO and PM 10 Conformity Determination
 2011 Amendment Cycle 1 DRCOG CO and PM 10 Conformity Determination for the Amended Fiscally Constrained 2035 Regional Transportation Plan and the Amended 2012-2017 Transportation Improvement Program Denver
PERFORMANCE-BASED PLANNING AND PROGRAMMING
 September 2018 performance-based planning and programming Boston Region Metropolitan Planning Organization: PERFORMANCE-BASED PLANNING AND PROGRAMMING WHAT IS PERFORMANCE-BASED PLANNING AND PROGRAMMING?
Williamsport Area Transportation Study Metropolitan Planning Organization
 Williamsport Area Transportation Study Metropolitan Planning Organization LONG RANGE TRANSPORTATION PLAN 2018-2038 CHAPTER 1 INTRODUCTION Purpose of a Long Range Transportation Plan Transportation infrastructure
PERFORMANCE-BASED PLANNING AND PROGRAMMING
 February 2017 performance-based planning and programming Boston Region MPO PERFORMANCE-BASED PLANNING AND PROGRAMMING WHAT IS PERFORMANCE-BASED PLANNING AND PROGRAMMING? Performance-based planning and
TRANSPORTATION AND LAND USE
 TRANSPORTATION AND LAND USE INTRODUCTION The 2020 and 2030 GHG projections estimate that transportation emissions in the unincorporated area will increase considerably in the next two decades. Minimizing
VIA Long Range Plan Glossary
 VIA Long Range Plan Glossary Accessibility. Accessibility is the ability to reach opportunities (economic, social, etc.) within a certain geographical area. Americans with Disabilities Act (ADA). Passed
Proposed Comprehensive Update to the State of Rhode Island s Congestion Management Process
 Proposed Comprehensive Update to the State of Rhode Island s Statewide Planning Program January 2018 Summary Outline of of Action Steps 1. Develop Objectives for Congestion Management What is the desired
Purpose of the Countywide Transportation Plan SAN FRANCISCO COUNTY TRANSPORTATION AUTHORITY
 > 12 Purpose of the Countywide Transportation Plan SAN FRANCISCO COUNTY TRANSPORTATION AUTHORITY 13 SAN FRANCISCO S MULTIMODAL transportation network is crucial to San Francisco s status as a major regional
Regional Performance Measures Annual Progress Report TPO Board - 2/4/2016 Presentation by: Chris Wichman, Senior Planner
 2015 TPO Board - 2/4/2016 Presentation by: Chris Wichman, Senior Planner Overview History and definition of performance-based planning & programming Review of 2015 TPO Board Action Requested 2 History
Congestion Management Process 2013 Update
 OVERVIEW OF THE DALLAS-FORT WORTH CONGESTION MANAGEMENT PROCESS Traffic Congestion In The Dallas-Fort Worth Region With the Dallas-Fort Worth (DFW) urban area as its center, the North Central Texas region
IMPLEMENTING THE PLAN
 IMPLEMENTING THE PLAN SELECTED KEY MESSAGES 1. Protect the Core Functions. Assuming a stable revenue and cost scenario, the financial analysis indicates that there are likely enough resources to cover
CHAPTER 4 FUTURE TRENDS
 CHAPTER 4 FUTURE TRENDS 4.1 LAND USE SCENARIO PLANNING Scenario planning represents the next generation of analytical processes created to evaluate the influence of development intensities and land use
Base Information. 1. Project Title Hokestra Trail Realignment and Bridge Safety Improvements
 Part 1 Base Information 1. Project Title Hokestra Trail Realignment and Bridge Safety Improvements 2. Project Start/End points or Geographic Area Provide a map with submittal, as appropriate 3. Project
CHAPTER 1: INTRODUCTION/ GOALS AND OBJECTIVES
 CHAPTER 1: INTRODUCTION/ GOALS AND OBJECTIVES 1.1: INTRODUCTION ABOUT THE FREDERICKSBURG AREA METROPOLITAN PLANNING ORGANIZATION (FAMPO) Established in 1992, the Fredericksburg Area Metropolitan Planning
- FACT SHEET - THE GUIDING PRINCIPLES
 THE GUIDING PRINCIPLES The General Plan begins with seven ideas that together create a vision for the City s future. When the City approved the General Plan in 1994, these idea were dubbed the Seven Guiding
Appendix D: Functional Classification Criteria and Characteristics, and MnDOT Access Guidance
 APPENDICES Appendix D: Functional Classification Criteria and Characteristics, and MnDOT Access Guidance D.1 Functional classification identifies the role a highway or street plays in the transportation
CHAPTER 1. A New Transportation Plan
 Chapter 1. A New Transportation Plan 1 CHAPTER 1. A New Transportation Plan Why develop a new plan? The year 2005 marks 90 years since Anchorage emerged as a community serving as headquarters for railroad
Introduction. CHAPTER 2: Introduction 13
 02 Introduction CHAPTER 2: Introduction 13 14 2018 Draft Regional Transportation Plan/Sustainable Communities Strategy 2 INTRODUCTION The Stanislaus Council of Government s 2018 Regional Transportation
2. Goals and Objectives
 Pedestrians in Charlotte s busy Uptown. CRTPO Mission The mission of the Charlotte Regional Transportation Planning Organization (CRTPO) is to plan for transportation options that ensure mobility, respect
MEETING SUMMARY FOR APRIL 13, 2017
 SARASOTA/MANATEE METROPOLITAN PLANNING ORGANIZATION Performance Measures/Project Prioritization Process Ad Hoc Committee 7632 15 th Street East Sarasota, Florida 34243 3:00-5:00 PM MEETING SUMMARY FOR
PERFORMANCE-BASED PLANNING AND PROGRAMMING
 February 2017 performance-based planning and programming Boston Region MPO PERFORMANCE-BASED PLANNING AND PROGRAMMING WHAT IS PERFORMANCE-BASED PLANNING AND PROGRAMMING? Performance-based planning and
NEED ECONOMIC TRANSPORTATION LOCATIONS EXAMPLE
 A. Enhance multimodal networks and facilities around transit access points such as existing and emerging rail stations, high capacity bus stops, and intermodal transfer centers There is a need for improved
Highest Priority Performance Measures for the TPP
 Highest Priority Performance Measures for the TPP The following list of measures are the highest priority performance measures as identified by modal working groups. These groups consist of staff from
Transportation and Land Use Planning Connectivity
 Chapter 3 Transportation and Land Use Planning Connectivity CHAPTER 3 Transportation and Land Use Planning Connectivity INTRODUCTION Transportation systems and services are provided in the context of both
VISION STATEMENT, MISSION STATEMENT, AND GOALS AND OBJECTIVES
 VISION STATEMENT, MISSION STATEMENT, AND GOALS AND OBJECTIVES Vision Statement: Our vision is to provide a high quality, safe, efficient, and cost-effective multi-modal transportation system that supports
The Metropolitan Transportation Plan. Public Meetings January 2016
 The Metropolitan Transportation Plan for North Central Texas Public Meetings January 2016 Presentation Agenda Mobility 2040 Draft Recommendations 2016 Transportation Conformity RTC Policy Bundle Concept
Transportation Master Plan Introduction
 1. Introduction Building a Liveable Ottawa 2031 has set out a process to guide the completion of a fiveyear update of the City s Official Plan, Transportation Master Plan, Infrastructure Master Plan, Cycling
Freight and Rail Stakeholder Webinar. January 7, 2014
 Freight and Rail Stakeholder Webinar January 7, 2014 Agenda Modal Needs Baseline Revenue Modal Scenarios Website Statewide Freight Plan Statewide Rail Plan Jeff Carroll MULTIMODAL TRANSPORTATION NEEDS
SUSTAINABLE COMMUNITIES STRATEGY
 SUSTAINABLE COMMUNITIES STRATEGY Introduction With each RTP update cycle, BCAG prepares a Sustainable Communities Strategy (SCS) as required under Senate Bill 375 (SB 375). The SCS demonstrates the integration
Appendix D Functional Classification Criteria and Characteristics, and MnDOT Access Guidance
 Appendix D Functional Classification Criteria and Characteristics, and MnDOT Access Guidance Functional classification identifies the role a highway or street plays in the transportation system. Some highways
MTP VISIONS, GOALS, AND OBJECTIVES
 2 MTP VISIONS, GOALS, AND OBJECTIVES El Paso MPO 2045 Metropolitan Transportation Plan 2. GUIDING PRINCIPLES This chapter describes the process by which the vision and goals of the planning process were
Chapter #9 TRAVEL DEMAND MODEL
 Chapter #9 TRAVEL DEMAND MODEL TABLE OF CONTENTS 9.0 Travel Demand Model...9-1 9.1 Introduction...9-1 9.2 Overview...9-1 9.2.1 Study Area...9-1 9.2.2 Travel Demand Modeling Process...9-3 9.3 The Memphis
FY 2019 Unified Planning Work Program FINAL. Regional Intergovernmental Council. June 14, Kanawha Putnam Metropolitan Planning Organization
 FY 2019 Unified Planning Work Program FINAL Regional Intergovernmental Council Kanawha Putnam Metropolitan Planning Organization June 14, 2018 315 D Street. South Charleston, WV. 25303 The Unified Planning
1 I N T R O D U C T I O N
 THE 2040 OKI REGIONAL TRANSPORTATION PLAN This is the metropolitan transportation plan for the Ohio-Kentucky-Indiana Regional Council of Governments (OKI). OKI is the federally designated regional transportation
2016 RTP/SCS Performance Measures Update Technical Working Group
 2016 RTP/SCS Performance Measures Update Technical Working Group March 19, 2015 Ping Chang & Naresh Amatya SCAG Staff Presentation Outline Background Evolving/Enhanced Performance Measures (PM) Framework
Project Summary. Project Objectives
 M2D2 Multi Modal Development and Delivery A project to support Michigan s economic recovery by improving MDOT s institutional capacity to plan, design, construct, operate and maintain Michigan s transportation