Mtp. Metropolitan Transportation Plan CORPUS CHRISTI METROPOLITAN PLANNING ORGANIZATION. Congestion. Freight. Programs. Funding. Public.
|
|
|
- Bertha Ray
- 6 years ago
- Views:
Transcription


1 6 Co Congestion Mtp Metropolitan Transportation Plan 10 Fr Freight 11 Fn Funding 12 Pr Programs 16 Pb Public 17 Tr Transit 18 En Environment 20 Re Recreation 27 Hi Highways 29 Ro Roads 30 Cn Connectivity 34 Pl Planning CORPUS CHRISTI METROPOLITAN PLANNING ORGANIZATION Approved by the Transportation Policy Committee - November 17, 2014 Effective on December 3, 2014

2 CORPUS CHRISTI METROPOLITAN PLANNING ORGANIZATION METROPOLITAN TRANSPORTATION PLAN Approved by the Transportation Policy Committee November 17, 2014 Effective on December 3, 2014 The preparation of this report has been financed in part through grant[s] from the Federal Highway Administration and Federal Transit Administration, U.S. Department of Transportation, under the State Planning and Research Program, Section 505 [or Metropolitan Planning Program, Section 104(f)] of Title 23, U.S. Code. The contents of this report do not necessarily reflect the official views or policy of the U.S. Department of Transportation.
3 TABLE OF CONTENTS CHAPTER 1: OUR FOUNDATION Perface 1 Corpus Christi MPO 1 MPO Governance 3 MPO Planning Staff 4 Metropolitan Planning Area 4 CHAPTER 2: FINANCIAL REALITY Introduction 5 Federal Funding Programs 5 Projections of Future Funding 7 Local Funding for Highway 8 Federal Funding Programs for Transit 9 New Programs 9 Consolidated Programs 11 Repealed Programs 12 Modified Programs 13 CHAPTER 3: REGIONAL TRENDS & DEMOGRAPHICS Introduction 17 Study Area Profile 17 Population Projections 19 Employment 19 Income 21 Housing 21 Travel Demand Forecast 21 CHAPTER 4: REGIONAL TRANSPORTATION NETWORK Introduction 31 Roads and Highways 31 Introduction 31 Urban Action Plan 32 Regional Connectivity 37 Harbor Bridge Project 40 Highway Safety Improvement Grant Project 40 Public Transportation 42 Goals and Objectives 42 Public Transportation Providers 43 Regional Transportation Coordination 46 Active Transportation / Bicycle & Pedestrian 47 Freight Movement 51 Texas Priority Freight Network 51 Local Trucking Goals 52 Local Railroad Goals & Objectives 53 Port of Corpus Christi 53 Actions to Date 56 Major Initiatives 60 Recreation Travel and Tourism 65 Goals and Objectives 66 Attractions 66 Corpus Christi International Airport 68 Major Projects 68 Airport Commerical Development 69 Long-Range Master Plan 70 CHAPTER 5: CONGESTION MANAGEMENT Introduction 71 MPO Congestion Management Process 72 Development of Preformance Measure 76 CHAPTER 6: ENVIRONMENTAL CONSIDERATIONS Introduction 79 Stakeholders 80 Status of Air Quality 80 CHAPTER 7: PREFORMANCE MEASURES Introduction 83 Framework for Using Prefromance Mesaures 84 Next Steps 86 PROJECT LISTINGS Federally Funded Highway Projects Federally Funded Transit Projects APPENDICES Appendix I Documentaion of Public Participation Public Notice Metropolitan Transportation Plan Summary of Public Input Appendix II Transportation Needs Survey Glossary of Terms TABLE OF FIGURES Figure 4.1: Road and Highway Classifications 33 Figure 6.1: Corpus Christi Urban Airshed and Regulatory Ozone Monitors CAMS 4 & Figure 6.2: Corpus Christi Ozone Design Trends 81 Figure 6.3: Map of Research Air Monitors Operated by UNT/TAMUK 82 TABLE OF MAPS Map 1.1: Corpus Christi MPO Planning Area 4 Map 3.1: Significant Network Projects 24 Map 3.2: 2006 Population 26 Map 3.3: 2040 Projected Population 27 Map 3.4: 2006 Employment 28 Map 3.5: 2040 Projected Employment 29 Map 4.1: State Roads and Highway System 32
4 TABLE OF CONTENTS TABLE OF MAPS (continued) Map 4.2: Regional Parkway Mobility Corridor Segments 39 Map 4.3: Corpus Christi Bay Trail 48 Map 4.4: South/Central Texas Region Traffic and Truck Volumes Map 4.5: Port of Corpus Christi 55 Map 4.6: New and Planned Development at the Port of Corpus Corpus 60 Map 4.7: Railroad Master Plan 63 Map 4.8: Dock Improvements and Construction Projects 64 TABLE OF TABLES Table 2.1: Project Selection by Category 6 Table 2.2: UTP Transportation Funding Levels 8 Table 2.3: Map 21 Highlights of Program Changes _ 9 Table 3.1: Study Area Demographics Table 3.2: 2010 Census Population Statistics 18 Table 3.3: Population Projections and Percent Change since Table 3.4: Study Area Occupational Precentage _ 20 Table 2.2: 2024 UTP TFL 12 Table 2.3: Map 21 Highlights of Program 12 Table 4.1: Preliminary Corridor Segments From To Lengths (Miles) 38 Table 5.1: Communting to Work 75 Table 6.1: Ozone Design Values Observed at the Non-Compliance Research Grade Monitoring Stations 81
5 Corpus Christi Metropolitan Transportation Plan CHAPTER 1 OUR FOUNDATION PREFACE Metropolitan Transportation Plan (MTP) is the Corpus Christi Metropolitan Planning Organization s (MPO) 25 year long-range plan which explains the MPO s transportation policies and goals, estimated future needs and resources, and lays out a detailed program for preserving and expanding the transportation system. It forms the basis of project selection for the short-range (4 year) Transportation Improvement Program (TIP). Projects selected for the MTP and TIP are based on analysis of regional growth, public input and dialogue with the planning partners in the region. Transportation planning processes are required to be organized and directed for all urbanized areas by MPOs. The Census Bureau defines urbanized areas (UZAs) areas with a population of at least 50,000 and transportation regulation requires MPOs to be established in urbanized areas. MPOs are established for a metropolitan planning area that must contain, at a minimum, the Census Bureau defined urbanized area and the area expected to become urbanized in the next 20 years. Our planning process provides the information, tools, and public input needed for improving the transportation system s performance as well as the community's vision for its future. Valuable attributes include comprehensive consideration of possible strategies; an evaluation that encompasses diverse viewpoints; a collaborative and relevant transportation-related engagement of agencies and organizations; and an open, timely, and meaningful involvement of interested parties and the general public. A holistic look at the needs and the future of the region and its inhabitants is required. The Texas Transportation Commission and the Texas Department of Transportation (TxDOT) use the Unified Transportation Program (UTP) as TxDOT s 10-year guide for transportation project development. The UTP, a mid-range document listing projects and programs that are planned for construction and/or developed within the first ten years of the 24-year Statewide Long-Range Transportation Plan (SLRTP). The UTP authorizes projects for construction, development, and planning activities and includes projects involving highways, aviation, public transportation, and state and coastal waterways. The UTP is developed and adopted annually. TxDOT adopted the most current UTP in August 2014 which projected available funding for the period and it serves as the bases for these MTP projections. CORPUS CHRISTI MPO The Corpus Christi region is well known for its agricultural, oil, gas, and petrochemical products. The mild climate, miles of beaches, and low cost of living attract tourists and retirees and contributes to the economy of the region. The formal transportation planning activities in the Corpus Christi metropolitan area began in the early 1960s. The Texas Highway Department Planning Survey Division, and the U.S. Department of Commerce CHAPTER 1 OUR FOUNDATION 1
6 Corpus Christi Metropolitan Transportation Plan Bureau of Public Roads, in cooperation with the City of Corpus Christi initiated a transportation study. The cooperative efforts of the state and the city resulted in the formation of the Corpus Christi Transportation Plan The main objective of this study was to find an adequate, long-term solution for future traffic in relation to comprehensive urban development. The plan included a complete network of streets and highways, which, when completed, would provide for the efficient movement of traffic. The City reaffirmed this plan in 1974, 1976, 1979, , and revised it in In May 1972, the cities of Corpus Christi and Portland, Nueces and San Patricio counties, and the State of Texas agreed to participate in a comprehensive, cooperative, and continuing (3C) transportation planning process for the Corpus Christi Transportation Study Area as provided in the Federal-Aid Highway Act of In 1973, Congress required the creation of MPOs and provided planning funds for those organizations in urbanized areas over 50,000 population. The City of Corpus Christi, designated by the Governor as the MPO on November 4, 1988, facilitated transportation planning in the area. In April 2000, the Transportation Policy Committee (TPC) passed a resolution requesting the TPC be designated the governing body of the MPO, with the County of Nueces as the fiscal agent it became effective in June The MPO evaluates and plans for the transportation needs of Nueces and San Patricio Counties and projects in the MTP and TIP that are in the Metropolitan Area Boundary (MAB) that includes the cities of Corpus Christi, Portland, Gregory and unincorporated areas that are anticipated to develop in the next 20-years. There are clear signs in our area of a transition to a more diverse economy with the Port of Corpus Christi evolving from an import to an export facility in part due to the South Texas oil boom from Eagle Ford Shale which has drawn major attention to property along the ship channel and the rim of Corpus Christi Bay. The Port of Corpus Christi Authority (POCCA), the 5th largest seaport in tonnage in the United States of America, remains the most prominent and important economic engine in this region. The Port is one of the country s fastest growing, servicing about 6,900 vessels in 2013 (The Port of Corpus Christi). Interests include La Quinta Gateway Terminal project, a POCCA long-term development plan intended to provide a multi-purpose dock and container facility; Cheniere Energy s proposed liquefaction project; M&G Group, an Italian chemical engineering and manufacturing group that produces PET resin for packaging applications; billion dollar Chinese investments by Tianjin Pipe (Group) Corporation through TPCO America; The voestalpine Group, a steelmaking group from Austria and several other investors contribute to our port s growth and transportation needs. Our healthcare system, U.S. military installation, and oceanic and energy research continue to subsidize as backbone industries in the area. For example, the Corpus Christi Army Depot remains a national leader as a helicopter repair facility; and Texas A & M University Corpus Christi s Harte Research Institute for Gulf of Mexico Studies is a prime educational resource used locally and internationally. The impacts of federal authorizing legislation for expenditure of surface transportation funds has required metropolitan area transportation plans and programs to be developed through a 3-C planning process. Over our most recent and successive authorization cycles Safe Accountable Flexible Efficient Transportation Equity Act: A Legacy for Users (SAFETEA-LU) required all MPOs, regardless of size, to consider the following eight factors in the development of a Metropolitan Transportation Plan: 2 CHAPTER 1 OUR FOUNDATION
7 Corpus Christi Metropolitan Transportation Plan Support the economic vitality of the metropolitan area, especially by enabling global competitiveness, productivity, and efficiency. Increase the safety of the transportation system for motorized and non-motorized users. Increase the ability of the transportation system to support homeland security and to safeguard the personal security of all motorized and non-motorized users. Increase the accessibility and mobility of people and freight. Protect and enhance the environment, promote energy conservation, and improve quality of life and promote consistency between transportation improvements and State and local planned growth and economic development patterns. Enhance the integration and connectivity of the transportation system, across and between modes, for people and freight. Promote efficient system management and operation. Emphasize the preservation of the existing transportation system. The passage of Moving Ahead for Progress in the 21st Century (MAP-21), enacted July 6, 2012, carried forward SAFETY-LU priorities as well as highlighted and emphasized the creation of a streamlined and performance-based surface transportation program that builds on many of the highway, transit, bike, and pedestrian programs and policies already established. MPO GOVERNANCE The TPC provides policy direction for the MPO by reviewing the annual Unified Planning Work Program (UPWP), the four year TIP, the 25 year MTP, and the needs based TMMP by recommending adoption and implementation based on input from local governments and authorities. This committee consists of the following seven voting members: Mayor, City of Corpus Christi Mayor, City of Portland County Judge, County of San Patricio County Judge, County of Nueces Board Chair, Regional Transportation Authority Board Chair, Port of Corpus Christi Authority District Engineer, TxDOT Corpus Christi District The Technical Advisory Committee (TAC) provides technical expertise to the TPC by reviewing and recommending revisions to the planning process, data collection, forecasts, and the intergovernmental agreement, the UPWP, the TIP and the MTP. This committee consists of the following seven voting members (or their designated alternates): Director of Engineering Services, City of Corpus Christi City Manager, City of Portland County Commissioner, San Patricio County CHAPTER 1 OUR FOUNDATION 3

8 Corpus Christi Metropolitan Transportation Plan Director of Public Works, Nueces County Chief Executive Officer, Corpus Christi Regional Transportation Authority Director of Engineering Services, Port of Corpus Christi Authority Director of Transportation Planning and Development, TxDOT Corpus Christi District Both TPC and TAC have non-voting members and can appoint subcommittees on an ad hoc basis. MPO PLANNING STAFF Four full-time professionals, one para-professional, and one administrative person provide the staff support to the MPO. Additional clerical and professional support is provided by Nueces County which acts as fiscal agent to the MPO. METROPOLITAN PLANNING AREA The physical parameter of the Corpus Christi MPO planning area is shown on Map 1.1 below. The boundary encompasses the area which was urbanized by U.S. Census Bureau definition in 2010 and the area is expected to remain urbanized in the next twenty years. MAP 1.1: Corpus Christi MPO Planning Area 4 CHAPTER 1 OUR FOUNDATION

9 Corpus Christi Metropolitan Transportation Plan CHAPTER 2 FINANCIAL REALITY INTRODUCTION The current enabling legislation (MAP-21) provides for funding surface transportation programs for fiscal years 2013 and As of the development of this plan, it is anticipated Map-21 will continue to be extended by Continuing Resolution into FY 2015 and hence creates tenuous funding estimates limited to temporary funding being proposed until a subsequent highway bill is passed. The Highway Trust Fund (HTF) is a transportation fund which receives money from federal fuel tax to fund three accounts. Two of the three accounts impact MPOs: Highway funds road construction; and Mass Transit supports mass transit. A constant component of transportation planning and program development is fiscal constraint (the total cost of a transportation project cannot exceed what we can reasonably expect to receive in funding). Any attempt to evaluate historical funding levels for the purposes of estimating future federal and state funds remains tenuous at best. Realities that impact funding include the insolvency of the Highway Trust Fund, federal funding rescissions, and periods of high fuel prices that curb driving combined with more efficient vehicles. All these make estimating future funding level projections a challenge while it remains clear that solutions must be established to avoid congestion increases that could be compounded by reduced levels of maintenance. The Texas Transportation Commission and the Texas Department of Transportation (TxDOT) use the Unified Transportation Program (UTP) as TxDOT s 10-year guide for transportation project development. The UTP, a mid-range document listing projects and programs that are planned for construction and/or developed within the first ten years of the 24-year Statewide Long-Range Transportation Plan (SLRTP). The UTP authorizes projects for construction, development, and planning activities and includes projects involving highways, aviation, public transportation, and state and coastal waterways. The UTP is developed and adopted annually. TxDOT adopted the most current UTP in August 2014 which projected available funding for the period and it serves as the bases for these MTP projections. FEDERAL FUNDING PROGRAMS The intent of the project process is to ensure that TxDOT s goals are supported through project selection which in turn is guided by available funding. A summary of UTP funding categories and project selection criteria by category are listed in Table 2.1. CHAPTER 2 FINANCIAL REALITY 5
10 Corpus Christi Metropolitan Transportation Plan TABLE 2.1: PROJECT SELECTION BY CATEGORY FUNDING CATEGORY 1 Preventive Maintenance and Rehabilitation 2 Metropolitan and Urban Area Corridor Projects 3 Non-Traditionally Funded Transportation Projects 4 Statewide Connectivity Corridor Projects 5 Congestion Mitigation and Air Quality Improvement 6 Structures Replacement & Rehabilitation Bridge Program; Railroad Grade Separation Program 7 Metropolitan Mobility/ Rehabilitation 8 Safety Federal Highway Safety Improvement Program (HSIP), Federal Railway-Highway Crossing Program, Safety Bond Program 9 Transportation Enhancements Transportation Alternatives PROJECT SELECTION CRITERIA Project selected by districts. Commission allocates funds through a formula allocation program. Projects selected by MPOs in consultation with TxDOT. Commission allocates funds through a formula allocation program. Determined by legislation, Commission approved Minute Order, and local government commitments. Selections based on engineering analysis of projects on three corridor types: Mobility: based on congestion Connectivity: 2-lane roadways requiring upgrade to 4-lane divided Strategic Corridors: strategic corridor additions to the state highway network. An example would be the Ports-to-Plain Corridor. Projects selected by MPOs in consultation with TxDOT. Commission allocates funds distributed by population weighted by air quality severity to non-attainment areas. Non-attainment areas designated by the Environmental Protection Agency (EPA). Projects selected by the Bridge Division (BRG) based on a listing of eligible bridges prioritized first by Deficiency Categorization (Structurally Deficient followed by Functionally Obsolete) & then by Sufficiency Ratings. Commission allocates funds through Statewide Allocation Program. In 2015, program increased to address maintenance and preservation related work. Projects selected by MPOs operating in transportation management areas, in consultation with TxDOT. Commission allocates funds through Federal program distributed to MPO s with an urbanized area population of 200,000 or greater (TMA s). Projects selected statewide by federally mandated safety indices & prioritized listing. Commission allocates funds through Statewide Allocation Program. In 2015, category includes System Widening Program. Local entities nominate projects & TxDOT (with FHWA) evaluate for eligibility & make recommendations to Commission. TMAs select & rank projects within their areas in consultation with TxDOT. Projects in the Safety Rest Area Program are selected by the Maintenance Division (MNT). Statewide allocation: local entities nominate projects & TxDOT (with FHWA) reviews them. Eligible projects are selected & approved by Commission on a per-project basis. TMA allocation: respective TMA hosts program calls & selects eligible projects. In 2015, includes TAP allocation distributed by population to areas <200K to be used for bike/pedestrian related improvements. 6 CHAPTER 2 FINANCIAL REALITY
11 Corpus Christi Metropolitan Transportation Plan TABLE 2.1: PROJECT SELECTION BY CATEGORY - CONTINUE FUNDING CATEGORY 10 Coordinated Border Infrastructure Program (CBI) & Congressional High Priority Projects Supplemental Transportation Projects: State Park Roads, Railroad Grade Crossing Re-planking, Railroad Signal Maintenance, Landscape Incentive Awards, Green Ribbon Landscape Improvement, Curb Ramp Program PROJECT SELECTION CRITERIA CBI projects selected by districts with FHWA review & approval. Discretionary funds are project specific based on legislation. CBI projects selected by districts with FHWA review & approval. Discretionary funds are project specific based on legislation. 11 District Discretionary Projects selected by Districts. Commission allocates funds through a formula allocation program. Minimum $2.5 million allocation to each district per legislative mandate. 12 Strategic Priority Commission selects projects. PROJECTIONS OF FUTURE FUNDING MPO planning and daily operational capacities are a necessary complement to its ability to make project spending decisions that are accountable and serve regional mobility. Funding sources available to MPOs includes the following broad categories Federal, State and Local: FEDERAL STATE Federal Highway Administration (FHWA) Metropolitan Planning Funds (PL Funds) are formula suballocated monies that State DOT s are required to dedicate to MPOs for financing MPO planning activities and daily operations; Federal Transit Administration (FTA) Metropolitan Planning Program / Section 5303 are formula moneys maintained by FTA to fund metropolitan planning operations and services; FTA State Planning and Research Program / Section 5313 funds are to assist states in meeting federal planning regulations. While the State is not required to suballocate these funds may use them for metropolitan transportation planning. State match is a common way for MPOs to receive the available 80% from federal grants if the state provides the 20% match. In Texas, MPOs receive in-kind assistance from its district offices. In-kind match may include: insurance, purchasing, engineering services, office space/rent, site CHAPTER 2 FINANCIAL REALITY 7
12 Corpus Christi Metropolitan Transportation Plan LOCAL hosting, staff payroll/salaries, staff benefits, and utilities. County and city governments and local agencies may support MPO planning and operations through support from their general funds. Local support may also be made available in the form of membership dues collected by the MPO from jurisdictions within its planning boundaries. In addition to dues, some MPOs raise local revenues for their operations by providing services on a contractual basis to local entities. In arrangements that are perhaps a legacy of the 1980s, when funding cuts forced MPOs to be entrepreneurial, the MPO may contract with local government units lacking staff or technical capacity and perform fee-based data services and planning. The fees earned from local entities count as the required match. Given that the local MPO, in consultation with the local TxDOT District and interested parties, select projects for Category 2 and 7 funding, a projection of funding in this area is of community-wide concern. Category 2 provides for funding mobility and added capacity projects on major state highway system corridors which serve the mobility needs of a Transportation Management Area (TMA). Category 7 provides for funding mobility projects within the Transportation Management Areas (TMAs). The pending allocation of available funding for the planning period is estimated as shown in Table 2.2 (as adopted by the TxDOT Commission in August 2014): TABLE 2.2: UTP TRANSPORTATION FUNDING LEVELS (Corpus Christi District Office ADOPTED: August 2015) CATEGORY 10 YR TOTAL 15 YR PROJECTION 25 YR PROJECTION CAT 2 $77,330,000 $123,728,000 $193,325,000 CAT 7 STP MM $54,180,000 $86,688,000 $135,450,000 CAT 9 TAP* $448,710,000 * * *Due to frequent CAT 9 funding changes, this category of TAP funds are not anticipated for long-range planning LOCAL FUNDING FOR HIGHWAY Local governments and providers of transportation have programmed funds to provide the local match to federally funded projects. The MPO member agencies have also committed local bond funds to finance capital improvement programs that complement the transportation planning process such as the City of Corpus Christi 2012 Bond Program committed over $55 million in street improvement projects and an estimated 2014 Bond Program is pending voter approval for an additional $163K. 8 CHAPTER 2 FINANCIAL REALITY
13 Corpus Christi Metropolitan Transportation Plan FEDERAL FUNDING PROGRAMS FOR TRANSIT MAP-21 provides the authorization for the Federal Transit Administration (FTA) programs. The basic structure of the Federal transit programs remains essentially the same but several new programs and activities have been added and new features have been incorporated (refer to Table 2.3). The funding flexibility features and similar matching ratios to the highway programs have been retained. TABLE 2.3: MAP-21 HIGHLIGHTS OF PROGRAM CHANGES NEW CONSOLIDATED REPEALED MODIFIED Public Transportation Emergency Relief (5324) Asset Management (5326) Safety Authority (5329) State of Good Repair Grants (5337) Bus and Bus Facilities Formula Grants (5339) Transit Oriented Development (TOD) Planning Pilot Grants (20005(b) of MAP-21) Urbanized Area Formula Grants (5307) [JARC] Enhanced Mobility of Seniors & Individuals with Disabilities (5310) [New Freedom] Rural Area Formula Grants (5311) [JARC] Clean Fuels Grants (5308) Job Access & Reverse Commute (5316) New Freedom Program (5317) Paul S. Sarbanes Transit in the Parks (5320) Alternatives Analysis (5339) Over-the-Road Bus (Sec TEA-21) Metropolitan and Statewide Planning (5304 & 5304) Fixed Guideway Capital Investment Grants (5309) Research, Development, Demonstration, & Deployment (5312) Technical Assistance & Standards (5314) Human Resources & Training (5322) NEW PROGRAMS Emergency Relief (5324) this new program assists States and public transportation systems with emergency-related expenses. Emergencies are defined as natural disasters affecting a wide area or a catastrophic failure from an external cause for which the governor of a State has declared an emergency (and the Secretary of Transportation has concurred) or the President has declared a major disaster. The program funds capital projects to protect, repair, reconstruct, or replace equipment and facilities. It also funds transit agency operating costs related to evacuation, rescue operations, temporary public transportation service, or changing public transportation route service before, during, or after an emergency in an area directly affected. The grants only cover expenses not reimbursed by the Federal Emergency Management Agency (FEMA). The program will provide immediate funding, similar to the FHWA emergency program. Funding will be appropriated by Congress as needed. Asset Management Provisions (5326) MAP-21 requires FTA to define the term state of good repair and create objective standards for measuring the condition of capital assets, including equipment, rolling stock, infrastructure, and facilities. Based on that definition, FTA must then develop performance measures under which all FTA grantees will be required to set targets. All FTA grantees and their CHAPTER 2 FINANCIAL REALITY 9
14 Corpus Christi Metropolitan Transportation Plan subrecipients are required to develop transit asset management plans. These plans must include, at a minimum, capital asset inventories, condition assessments, and investment prioritization. Each designated recipient of FTA formula funding will be required to report on the condition of its system, any change in condition since the last report, targets set under the above performance measures, and progress towards meeting those targets. These measures and targets must be incorporated into metropolitan and statewide transportation plans and transportation improvement programs (TIPs). FTA will support this effort through technical assistance, including the development of an analytical process or decision support tool that allows recipients to estimate their capital investment needs over time and assists with asset investment prioritization. Safety Authority (5329) MAP-21 grants FTA the authority to establish and enforce a new comprehensive framework to oversee the safety of public transportation. The new law incorporates: Safety performance criteria and standards Grantee safety plans State Safety Oversight Additional Authorities: Authority to inspect and audit all public transportation systems; To make reports and issue directives with respect to the safety of public transportation systems; To issue subpoenas and take depositions; To require the production of documents; To prescribe record-keeping and reporting requirements; To investigate public transportation accidents and incidents; To enter and inspect equipment, rolling stock, operations and relevant records; and To issue regulations to carry out transit safety provisions. MAP-21 also grants FTA enforcement authority and permits FTA to issue directives, require more frequent oversight of transit systems, impose more frequent reporting requirements, and require that formula grant funds be spent to correct safety deficiencies before funds are spent on other projects. State of Good Repair Grants (5337) MAP-21 establishes a new grant program to maintain public transportation systems in a state of good repair. This program replaces the fixed guideway modernization program (Section 5309). Funding is limited to fixed guideway systems (including rail, bus rapid transit, and passenger ferries) and high intensity bus (high intensity bus refers to buses operating in high occupancy vehicle (HOV) lanes.) Projects are limited to replacement and rehabilitation, or capital projects required to maintain public transportation systems in a state of good repair. Projects must be included in a transit asset management plan (see next section) to receive funding. The new formula comprises: (1) the former fixed guideway modernization formula; (2) a new service-based formula; and (3) a new formula for buses on HOV lanes. Bus and Bus Facilities Program (5339) a new formula grant program replaces the previous Section 5309 discretionary Bus and Bus Facilities program. This capital program provides funding to replace, rehabilitate, and purchase buses and related equipment, and to construct bus-related facilities. Some of the funding will be distributed by formula based on population, vehicle revenue miles and passenger miles. This program requires a 20 percent local match. 10 CHAPTER 2 FINANCIAL REALITY
15 Corpus Christi Metropolitan Transportation Plan Transit-Oriented Development Planning Pilot a new discretionary pilot program with eligible activities including comprehensive planning in corridors with new rail, bus rapid transit, or core capacity projects. The comprehensive plans should seek to enhance economic development, ridership, and other goals; facilitate multimodal connectivity and accessibility; increase access to transit hubs for pedestrian and bicycle traffic; enable mixed-use development; identify infrastructure needs associated with the project; and include private sector participation. CONSOLIDATED PROGRAMS Urbanized Area Formula Grants (5307) the largest of FTA s grant programs, this program provides grants to urbanized areas to support public transportation. Funding is distributed by formula based on the level of transit service provision, population, and other factors. The program remains largely unchanged with a few exceptions: Job access and reverse commute (JARC) activities now eligible: Activities eligible under the former (JARC) program, which focused on providing services to low-income individuals to access jobs, are now eligible under the Urbanized Area Formula program. This includes operating assistance with a 50 percent local match for job access and reverse commute activities. In addition, the urbanized area formula for distributing funds now includes the number of low-income individuals as a factor. There is no floor or ceiling on the amount of funds that can be spent on job access and reverse commute activities. Expanded eligibility for operating expenses for systems with 100 or fewer buses: MAP-21 expands eligibility for using Urbanized Area Formula funds for operating expenses. Previously, only urbanized areas with populations below 200,000 were eligible to use Federal transit funding for operating expenses. Now, transit systems in urbanized area over 200,000 can use their formula funding for operating expenses if they operate no more than 100 buses. Systems operating between 76 and 100 buses in fixed route service during peak service hours may use up to 50 percent of their attributable share of funding for operating expenses. Systems operating 75 or fewer buses in fixed route service during peak service hours may use up to 75 percent of their attributable share of funding for operating expenses. This expanded eligibility for operating assistance under the urbanized formula program excludes rail systems. New discretionary passenger ferry grants: $30 million per year is set-aside from the urban formula program totals to support passenger ferries. Funding will be awarded on a competitive selection basis. New takedown for safety oversight: MAP-21 sets aside one half of one percent (approximately $22 million per year) of Urbanized Area Formula funds for State safety oversight grants (see above section on safety). Rural Area Formula Grants (5311) this program provides capital, planning, and operating assistance to support public transportation in rural areas, defined as areas with fewer than 50,000 residents. Funding is based on a formula that uses land area, population, and transit service. The program remains largely unchanged with a few exceptions: Job access and reverse commute activities eligible: Activities eligible under the former JARC program, which provided services to low-income individuals to access jobs, are now eligible under the Rural Area Formula program. In addition, the formula now includes the number of low-income individuals as a factor. There is no floor or ceiling on the amount of funds that can be spent on job access and reverse commute activities. CHAPTER 2 FINANCIAL REALITY 11
16 Corpus Christi Metropolitan Transportation Plan Tribal Program: The Tribal program now consists of a formula program and a discretionary grant program. Formula factors include vehicle revenue miles and the number of low-income individuals residing on tribal lands. Appalachian Development Public Transportation Assistance Program: MAP-21 authorizes $20 million each for FY 2013 and FY 2014 for grants to support public transportation in the Appalachian region. Other changes: The set-aside for States for administration, planning, and technical assistance is reduced from 15 to 10 percent. The cost of the unsubsidized portion of privately provided intercity bus service that connects feeder service is now eligible as in-kind local match. Enhanced Mobility of Seniors and Individuals with Disabilities (5310) this program provides formula funding to increase the mobility of seniors and persons with disabilities. Funds are apportioned based on each State s share of the targeted populations and are now apportioned to both States (for all areas under 200,000) and large urbanized areas (over 200,000). The former New Freedom program (5317) is folded into this program. The New Freedom program provided grants for services for individuals with disabilities that went above and beyond the requirements of the Americans with Disabilities Act (ADA). Activities eligible under New Freedom are now eligible under the Enhanced Mobility of Seniors and Individuals with Disabilities program. Projects selected for funding must be included in a locally developed, coordinated public transit-human services transportation plan; and the competitive selection process, which was required under the former New Freedom program, is now optional. At least 55 percent of program funds must be spent on the types of capital projects eligible under the former section public transportation projects planned, designed, and carried out to meet the special needs of seniors and individuals with disabilities when public transportation is insufficient, inappropriate, or unavailable. The remaining 45 percent may be used for: public transportation projects that exceed the requirements of the ADA; public transportation projects that improve access to fixed-route service and decrease reliance by individuals with disabilities on complementary paratransit; or, alternatives to public transportation that assist seniors and individuals with disabilities. Using these funds for operating expenses requires a 50 percent local match while using these funds for capital expenses (including acquisition of public transportation services) requires a 20 percent local match. REPEALED PROGRAMS MAP-21 focuses on improving the efficiency of grant program operations by consolidating certain programs and repealing other programs. The following programs expire on September 30, 2012 and no new funding is authorized beyond fiscal year 2012: Alternatives Analysis (5339), Clean Fuels (5308); Jobs Access and Reverse Commute (JARC) (5316); New Freedom (5317); Transit in the Parks (5320); and Over the Road Bus (3038 of TEA-21) FTA Office of Budget and Policy In lieu of the current Bus Discretionary Program (section 5309), a new formula-driven Bus and Bus Facilities Program (5339) is established in MAP-21. Eliminating these discretionary programs underscores 12 CHAPTER 2 FINANCIAL REALITY
17 Corpus Christi Metropolitan Transportation Plan the need for grantees to carefully prioritize the needs of their own systems and align their capital plans with the new streams of formula assistance provided under MAP-21. With regard to the Transit in the Parks (5320) program, public transportation investments serving National Parks and other Federal lands remain eligible under the Federal Lands Transportation Program administered by the Federal Highway Administration (FHWA). As noted above, job access and reverse commute activities are now eligible under the Urbanized Area Formula program (5307) as well as the Rural Area Formula program (5311). Activities eligible under the former New Freedom program are now eligible under the Enhanced Mobility of Seniors and Individuals with Disabilities program (5310). MODIFIED PROGRAMS Fixed Guideway Capital Investment Grants (5309) also known as New Starts / Small Starts, this program awards grants on a competitive basis for major investments in new and expanded rail, bus rapid transit (BRT), and ferry systems. Core capacity projects now eligible: MAP-21 adds new eligibility for core capacity improvement projects, that is, projects that expand capacity by at least 10 percent in existing fixed guideway transit corridors that are at or above capacity, or are expected to be at capacity within five years. Project development streamlined: MAP-21 streamlines the project development process for New Starts. It eliminates the alternatives analysis requirement and instead relies on the review of alternatives performed during the metropolitan planning and environmental review processes. It creates the Project Development phase, during which environmental reviews are completed. Project sponsors must complete this phase within two years, or seek an extension from FTA. MAP-21 reduces the number of FTA approval steps by consolidating the Preliminary Engineering and Final Design stages into a single Engineering step. It also requires FTA to develop an expedited review process for determining the technical capacity of project sponsors to undertake the proposed project if they have recently and successfully completed at least one other new fixed guideway or core capacity improvement project. Project evaluation and rating: Under certain conditions, MAP-21 allows for the use of warrants, in other words, ways in which projects may qualify for automatic ratings on the project justification criteria. It also eliminates the operating efficiencies criterion and adds a congestion relief criterion. It requires FTA to evaluate the benefits of a Small Starts project against the Federal share of the project, rather than the total project cost when developing the project justification rating. Reorganization: The fixed guideway modernization and bus and bus facilities programs, which were previously funded under Section 5309, have now been restructured and moved to a new Section 5337 State of Good Repair Program and a new Section 5339 Bus and Bus Facilities Program. Other Provisions: MAP-21 creates a competitive pilot program for expedited project delivery. In addition, it funds Small Starts projects through a single year grant or an expedited grant agreement. New Starts and core capacity projects are funded through a full funding grant agreement (FFGA). Congressional notification of grant award is 10 days for Small Starts projects and 30 days for New Starts and core capacity projects. MAP-21 requires FTA to issue policy guidance on the process and evaluation criteria within 180 days of enactment, and a rule within one year of enactment. Metropolitan, Statewide, and Nonmetropolitan Planning Programs (5303, 5304, and 5305). These programs provide funding and procedural requirements for multimodal transportation planning in CHAPTER 2 FINANCIAL REALITY 13
18 Corpus Christi Metropolitan Transportation Plan metropolitan areas and States that is cooperative, continuous, and comprehensive, resulting in long-range plans and short-range programs of transportation investment priorities. The planning programs are jointly administered by FTA and FHWA, which also provides additional funding. Establishes a performance-based planning process: MAP-21 requires MPOs and States to establish performance targets that address national performance measures issued by the U.S. DOT and are based on goals outlined in law safety, infrastructure condition, congestion reduction, system reliability, economic vitality, environmental sustainability, reduced project delivery delays, transit safety, and transit asset management. Transportation Improvement Programs (TIPs) must include a description of the anticipated progress toward achieving the targets brought about by implementing the TIP. Five years after enactment of MAP-21, the U.S. DOT will report to Congress on the effectiveness of performance-based planning and assess the technical capacity of MPOs in smaller areas to undertake performance-based planning. Requires transit representation on MPO policy boards in large areas: Within two years of the date of enactment, MPOs in urbanized areas designated as transportation management areas must include transit officials on their policy boards. Supports optional scenario development: MPOs may undertake scenario development exercises in preparing the long-range transportation plan that consider alternative demographic growth, revenue options, and other factors. Allows designation of regional transportation planning organizations: Regional transportation planning organizations comprised of volunteer local government and transportation officials may be designated to assist the State in addressing the needs of non-metropolitan areas. Accordingly, statewide planning has been renamed statewide and non-metropolitan planning to signify the important role local officials play in the development of statewide plans and programs in non-metropolitan areas of States. Research, Development, Demonstration, and Deployment (5312) previous Section 5312 (Research, development, demonstration, and deployment projects) and Section 5314 (National research programs) are now consolidated into one program under Section Funding supports public transportation research; innovation and development; and demonstration, deployment, and evaluation. Projects under this last category require a project evaluation within two years of award. MAP-21 creates a new low or no emissions vehicle deployment program. FTA is required to submit an annual report to Congress that includes a description of projects funded, an evaluation of each project described, and a proposed allocation of assistance for the next fiscal year. MAP-21 requires a local match of not less than 20 percent for Section 5312 projects. Technical Assistance and Standards (5314) MAP-21 authorizes discretionary funding subject to appropriations by Congress for a wide range of technical assistance activities and development of voluntary standards and best practices. (Previously, some of these activities were funded under research) A local match of not less than 20 percent is required for projects carried out using a grant. An annual report to Congress is required, similar to the one for the research section above. Human Resources and Training (5322) the act authorizes appropriations by Congress for human resource activities including: employment training and outreach programs; research on public transportation personnel and training needs; and training and assistance for minority business opportunities. MAP CHAPTER 2 FINANCIAL REALITY
19 Corpus Christi Metropolitan Transportation Plan authorizes a competitive grant program to support innovative public transportation workforce development. A 50 percent local match is required for this competitive grant program. FTA must submit a report to Congress on measurable outcomes and impacts of the programs funded. MAP-21 also authorizes appropriations by Congress for a national transit institute. Formerly authorized under Section 5315, this national transit institute is to develop training and education programs related to topics in public transportation and must be administered through a public, four-year degree-granting institution. CHAPTER 2 FINANCIAL REALITY 15
20 Corpus Christi Metropolitan Transportation Plan [page intentionally left blank] 16 CHAPTER 2 FINANCIAL REALITY
21 Corpus Christi Metropolitan Transportation Plan REGIONAL TRENDS & DEMOGRAPHICS CHAPTER 3 INTRODUCTION Demographics such as population, household income, household size, and employment play a key role in transportation planning process. Changes in these demographics have a direct impact on travel behavior and travel patterns. Travel patterns and behavior help in estimating demand for travel which in turn provides the information to project on what transportation improvements would be required for the next 20-year planning horizon. The Corpus Christi MPO (MPO) Planning Area is comprised of the City of Corpus Christi, the City of Portland, City of Gregory, and parts of rural Nueces and San Patricio counties as shown in Chapter 1 - Map 1.1. The MPO is required to perform transportation planning activities within this area. However, in 1995, the MPO decided to include the entire two-county area (Nueces and San Patricio) and a small portion of Aransas County (within the Aransas Pass city limits) to collect demographic, employment, land use and street classification data. The reason for doing it was to analyze the regional impact of population and employment and to be ready if the area is designated as a non-attainment area for the ambient air quality. Subsequently, the Texas Department of Transportation required the identification of total transportation needs in Nueces and San Patricio counties as part of the Texas Metropolitan Mobility Plan (TMMP). STUDY AREA PROFILE The study area consisting of Nueces and San Patricio counties had a population of 405,027 in The region consists of 1,532 square miles with a population density of 264 residents per square mile. According to the United States Census, Texas grew from 20,851,820 in 2000 to 25,145,561 in 2010 reflecting an increase of 21 percent growth. During this same time period, the study area had an increase from 380,783 persons to 405,027 persons which reflected a 6 percent change. The region's ethnic distribution in the 2010 Census is represented to be Table 3.1: TABLE 3.1: STUDY AREA DEMOGRAPHICS 2010 RACE POPULATION PRECENT Anglo 139, Black 13,080 3 Hispanic* 241, Other 11,206 3 *Hispanic count includes White, Black and other representation when reported CHAPTER 3 REGIONAL TRENDS & DEMOGRAPHICS 17
22 Corpus Christi Metropolitan Transportation Plan Population Age: The age distribution of an area can provide valuable insight into the region's economic composition and income potential. By national standards, Texas has a relatively young population. The 2010 Census show a population composition as follows Table 3.2: TABLE 3.2: 2010 CENSUS POPULATION STATISTICS AGE POPULATION AREA PRECENT STATEWIDE PERCENT Under 5 28, , , , , , Population Gender: The gender distribution of an area can provide additional insight into the region's overall distribution in the population by male and female. Of the area's population, 199,201 were male which represents 49 percent and 205,826 were female which represents 51 percent. This compares to the statewide percentage of 49.6 percent for male and 50.4 percent for female. Youth and Older Workers: Other age cohorts are of special interest for transportation needs for summer youth programs and older worker programs. The study area has 58,878 persons age representing 14.5 percent of the population. This compares with 14.7 percent statewide. For the potential older age cohort, 96,657 persons or 23.9 percent are 55 or over in the study area based on the 2010 Census. This compares to 20.8 percent statewide. Disability Status: Shortly after the 2000 Census, there was a growing consensus that the American Community Survey (ACS) questions on disability did not coincide with recent models of disability. In 2008, new questions were introduced and are what can be found in current ACS questionnaires. They cover six disability types: (a) Hearing deaf or having serious difficulty hearing; (b) Vision blind or having serious difficulty seeing, even when wearing glasses; (c) Cognitive Because of a physical, mental, or emotional problem, having difficulty remembering, concentrating, or making decisions; (d) Ambulatory Having serious difficulty walking or climbing stairs; (e) Self-care Having difficulty bathing or dressing; and (f) Independent living Because of a physical, mental, or emotional problem, having difficulty doing errands alone such as visiting a doctor s office or shopping. It was reported in the 2010 ACS that the area had an estimated 77,517 persons residing there between the ages of 5 to 17 years of age with approximately 7,491 or 9.6 percent with a disability. In Texas, the percent with disabilities in this same age bracket was 5.5 percent. In the working age population group - ages 18 to 64 years, the area had approximately 246,141 persons, of which 40,277 were categorized to be in a disability status. This represented 16.4 percent compared to 10.1 percent in the state overall. Approximately 12,402 persons, or 7.5 percent, were employed with a disability in this age group. For 18 CHAPTER 3 REGIONAL TRENDS & DEMOGRAPHICS
23 Corpus Christi Metropolitan Transportation Plan those who had no disability, an estimated 154,059 or 92.5 percent were employed. For the retirement age group of 65 years of age and older, 47,192 persons resided of which 22,514 were disabled. The percent of this age group with a disabled status was 47.7 percent and this compared to 40.6 percent in Texas overall. Ages 65 and Older: For the population who are considered to be at the age of retirement or older - 65 years and older, the total number of persons in Texas was 2,601,886 or 10.3 percent of the total population in This region had a total of 49,274 or 12.2 percent in this older age group. In the same age group of 65 years and over, males in Texas represented 1,135,664 or 4.5 percent of the total population and females totaled to 1,466,222 or 5.8 percent, while in this study area, males totaled to 21,246 or 5.2 percent of all persons in this area and females represented 28,028 or 6.9 percent of all persons. POPULATION PROJECTIONS The Office of the State Demographer for the State of Texas distributes the most widely used population projections for Texas. Projection estimates in these tables and the methodology for migration scenarios have been revised as of November 2012 by the Texas State Data Center and Office of the State Demographer now housed at University of Texas San Antonio. The following Table 3.3 represents population projections for study area: TABLE 3.3: POPULATION PROJECTIONS AND PERCENT CHANGE SINCE 2010 YR TOTAL PCT* ANGLO PCT* BLACK PCT* HISPANIC PCT* OTHER PCT* , , , , , , , , , , , , , , , , , , , , , , , , , , , , , , , , , , , , , , , , , , , , , *PCT Denotes Percent Change Vital Statistics: According to the Texas Department of State Health Services for vital statistics for the year 2012, the study area had a total of 5,736 live births. The area had a total of 3,411 deaths. EMPLOYMENT Civilian Labor Force (CLF): The most recent civilian labor force estimates from TWC for Texas statewide in May 2014 is 12,969,284 which is an increase in the labor force of 148,182 persons since May This represents a 1.2 percent change in Texas during this time period. These estimates are not seasonally CHAPTER 3 REGIONAL TRENDS & DEMOGRAPHICS 19
24 Corpus Christi Metropolitan Transportation Plan adjusted. The study area had a civilian labor force of 210,184 for May 2014 which was a change of 2,075 in CLF since May This change represented an increase of 0.9 percent for the study area. Occupations: The best source of occupational information at the county level is from the American Community Survey (ACS). The total number of persons 16 years of age or older who were employed in the study area during the 2010 ACS 1-Year Estimates was 176,200. The following Table 3.4 presents those employed by occupational categories for this region compared to statewide percentages: TABLE 3.4: STUDY AREA OCCUPATIONAL PERCENTAGE OCCUPATIONAL CATEGORIES COUNT AREA PERCENTAGE STATEWIDE PERCENT Management, Business, Sciences and Arts 55, Service 35, Sales and Office 44, Natural Resources, Construction and Maintenance 20, Production, Transportation and Material Moving 19, Class of Worker: Another way to view the types of workers in an area's labor force is by class of worker. According to the 2010 ACS 1-Year Estimates, the area had 131,469 employees who were private wage and salary workers representing 74.6 percent of all workers. The region had another 33,447 persons who were government workers or 19 percent, 11,151 who were self-employed workers or 6.3 percent and 133 who were unpaid family workers representing 0.1 percent. This compares to the Texas statewide distribution of 77.6 percent for private wage and salary workers, 15.3 percent for government workers, 7.1 percent for self-employed, and 0.1 percent for unpaid family workers. Unemployment: According to the TWC, the study area s unemployment rates decreased from 2013 to Nueces County went from 10,220 persons unemployed (5.7%) in May 2013 to 8,416 persons (4.7%) in May San Patricio County went from 2,157 persons unemployed (7.3%) to 1,856 persons (6.2%). The Texas statewide unemployment also decreased during this time frame going from 805,161 persons unemployed (6.3%) to 655,604 persons (5.1%). Business Universe: Average firm size makes a difference from a transportation impact perspective. The TWC reported 7,727 firms in the study area in the first quarter of The study area also had approximately 9,107 establishments which employed 10 or more employees. Nueces County had an average of 158,248 persons employed during this time frame. San Patricio had an average of 18,544 persons employed. Commuting to Work: Commuting to work numbers are used as direct input in a transportation study. In 2010, the study area had a total of 137,929 or 79.3 percent who drove their car to work alone, 17,598 or 10.1 percent who car pooled, 2,990 or 1.7 percent used public transportation, 3,464 or 2 percent who walked to work, 7,179 or 4.1 percent of regional workers who used other means to work, and 4,676 or 2.7 percent who worked at home. These methods of commuting to work compare to the Texas statewide 20 CHAPTER 3 REGIONAL TRENDS & DEMOGRAPHICS
25 Corpus Christi Metropolitan Transportation Plan results by: car alone (79.8%), car pool (11.1%), public transportation (1.5%), walked (1.7%), other means (1.8%), and worked at home (4.1%). INCOME Personal Income: Total personal income is a widely used measure of regional economic health while per capita income is generally used to compare the relative well-being of residents across areas (not accounting for differences in area cost of living). The per capita income in 2010 was $22,188 for Nueces County and $20,375 for San Patricio County while Texas statewide had a per capita income of $23,863. Poverty Population: In 2010, the study area had an estimated population 400,369 for whom poverty status is determined. Of that population, 80,673 persons are below the poverty level. That figure represents 20.1 percent of the people whom poverty status is determined compared to the 1.9 percent that represents Texas statewide. HOUSING Household Units and Size: The total number of occupied housing units in 2010 in the study area according the Census was 147,224 with an average household size of 2.7 persons. The average household size for Texas was 2.75 persons for the same period. Owner-occupied housing units for this area were 62 percent compared to Texas statewide which had a rate of 63.7 percent. The percent of households with persons 65 years of age or older was 18.4 percent in Texas statewide while 24.5 percent of study area had households with individuals 65 years of age and older. Owner and Renter Occupied: According to the 2010 American Community Survey 1-Year Estimates from the Census, the percent of owner-occupied units with a value of $100,000 or greater in the study area was 55.2 percent compared to 63.3 percent for the state. The percent of renter-occupied units with rent values of $500 per month or greater was 85 percent as compared to the Texas percentage of 87.8 percent. For this area, the total number of renter-occupied housing units was estimated to be 53,919 which represented 37.2 percent of all occupied housing units in This compares to a Texas statewide percentage of 34.3 percent for the same period. TRAVEL DEMAND FORECAST The travel forecasting process started in the Corpus Christi urbanized area under the 1962 Federal Aid Highway Act when the first comprehensive transportation plan was developed for guiding transportation improvements. The plan was reaffirmed by the City of Corpus Christi in 1974, 76, 79, 83, 84 and 87. The enhanced travel forecasting process started under the Intermodal Surface Transportation Efficiency Act of 1991 (ISTEA). With the development of the 2006 Base Year Travel Demand Model (TDM), a decision was made to create a regional model that can replicate and forecast travel for the entire two-county area of San Patricio and Nueces Counties. In March 2014, we received the necessary software from the Transportation Planning and Programming Division of the Texas Department of Transportation (TxDOT) so that we may be able to utilize the delivered validated 2006 base year and 2040 forecast year TDM. The 2006 base year TDM replicated existing traffic volumes and vehicle miles of travel (VMT) when benchmarked against the 2006 urban saturation counts in the two counties, and was calibrated to the 2010 urban travel surveys. The 2040 forecast TDM is intended to provide a reasonable estimate of future CHAPTER 3 REGIONAL TRENDS & DEMOGRAPHICS 21
26 Corpus Christi Metropolitan Transportation Plan travel demand on planned transportation system improvements given a forecast set of 2040 demographics. As a part of the development of the 2006 TDM, the Metropolitan Planning Organization (MPO), in cooperation with TXDOT, conducted a series of comprehensive travel surveys for San Patricio and Nueces Counties. The travel surveys were conducted in 2010 and included the following set of surveys: Household Activity and Travel Survey Special Generator Survey External Travel Survey Commercial Vehicle Survey Vehicle Operating Survey Stated Preference Survey (Partial) On-Board Transit Survey A combined regional set of comprehensive travel surveys is underway for the 2010 fiscal year. The combined regional travel surveys will include the Corpus Christi and Victoria urban areas and will coincide with the next urban saturation ground counts for the two study areas. A final report was delivered to the MPO in Travel Model Data Development Process The MPO worked in cooperation with TXDOT to prepare a schedule for the development and sequence of events that are a part of the TDM development process. The schedule outlines delivery dates, milestones and agency responsibilities. Typically, the impetus for initiating a model update is the collection of urban saturation counts; these are collected for a given urban area every five years. The TDM update process starts with the MPO, area agencies and TxDOT staff meeting to agree on the process and data development tasks. Once a consensus is reached on the process, the MPO staff starts by updating two critical data sets that are major inputs to the TDMs networks and demographics. The first task is a review of network maps for additions, deletions and general update. The edited network maps are forwarded to TxDOT-TPP, which are used as the foundation for editing the travel model networks in the TDM software platform used by TxDOT. The second task is a review and update of the base and forecast demographics. The MPO staff, along with the City of Corpus Christi staff, develops demographic inventories for the base and forecast year(s). The demographic databases are presented to the Technical and Policy Advisory Committees for adoption. Once adopted, the data is then supplied to TPP-TxDOT for use in the development and validation of the TDM. The model is validated through an iterative process, where travel data (e.g. trip rates, speeds, trip lengths, etc) are adjusted until modeled volumes replicate observed conditions. The 2006 TDM was calibrated to the 2006 urban saturation ground counts. Trip rates were developed from the comprehensive travel surveys discussed in the Background Summary. The Corpus Christi Travel Demand Model The MPO adopted the TDM as a basic planning tool to guide the long range planning process. 22 CHAPTER 3 REGIONAL TRENDS & DEMOGRAPHICS
27 Corpus Christi Metropolitan Transportation Plan The projected travel demand helped identify system deficiencies and evaluate and compare proposed options. In accordance with the Memorandum of Understanding (MOU) with TxDOT-TPP concerning model development, the MPO is currently in the process of developing the approved demographic and network input data for a new 2012 base and 2046 forecast year TDM. The last model revision was completed in 2013 in support of the 2040 Metropolitan Transportation Plan (MTP). A set of 2040 demographics was developed by trending the land use assumptions that existed in the previous forecast scenario by continuing those assumptions for an additional fifteen years. San Patricio and Nueces counties were forecast separately in recognition of the distinct land use characteristics that exist between the two counties (e.g. urban versus rural). Only one minor revision was made to the network to create a 2030 network. Despite another urban saturation count update being available, the MPO did not develop a 2001 base year travel demand model, since (1) the population and VMT were tracking close to the 1996 base year TDM, (2) the regional network really only had a few minor changes from 1996 to 2001, and (3) a comprehensive travel survey with saturation counts was scheduled for In contrast, the data development procedures for the TDM is much more rigorous. Data for both years is being developed basically from scratch to provide more accurate and up-to-date datasets for the new TDM. The MPO has prepared for the upcoming model by taking advantage of the recently-published Transportation Research Board Special Report 288, Metropolitan Travel Forecasting: Current Practice and Future Direction. This report provided descriptions of model procedures and attributes for a range of MPO s. The MPO, through a consultant contract, evaluated itself against peer cities reported in the research, essentially conducting a peer review process on its TDM. The review found that the Corpus Christi TDM was substantially in line with the state of the practice for its peer cities. Targeted areas for potential TDM enhancements were identified, and some of these recommendations are currently being implemented in conjunction with TxDOT-TPP. The study area covers the full extent of Nueces and San Patricio Counties, as well as a small portion of Aransas County. This coverage was seen as quite adequate and has not been changed. The forecast Regional Parkway Mobility Corridor s new crossing of the Laguna Madre to Padre Island connects to the network in Kleberg County, just south of an existing external station. The external station was extended south to accommodate this, but no new zone in Kleberg County was felt to be necessary. The Corpus Christi TDM is structured as a three-step model, which includes trip generation, trip distribution, and traffic assignment modules. This model structure was evaluated and found to be consistent with the state of the practice. The MPO has considered investigating advanced practice models in order to add new analysis capabilities. However, the review suggested that it is not clear yet that advanced models can be implemented that provide significant improvements for a reasonable cost. Further, the current TDM structure was seen to be able to answer the most critical policy questions which are currently before the MPO. The current TDM structure is therefore seen as suitable for the MPO s intended analysis applications, and no changes have been recommended. CHAPTER 3 REGIONAL TRENDS & DEMOGRAPHICS 23

28 Corpus Christi Metropolitan Transportation Plan The planning networks contain all links that are functionally classified as collector and above and are considered regional significant facilities. Network link-specific information that is inventoried includes number of lanes, facility type category (e.g. principal arterial) and whether the facility is divided or undivided or has a continuous center turn lane. In addition, operational characteristics such as daily speed, daily capacity, average weekday traffic count and direction (one-way/two-way) are coded in the network database. Network development for the TDM included primary data collection, in which the entire network was driven for a field verification of attributes. This effort found several FM roads which were not in the network and therefore had to be added, and several low-volume county roads (some of which were not paved) which were not of regional significance and could reasonably be deleted. Additionally, evolving TxDOT-TPP network standards led to the institution of detail coding of I- 37, U.S. 77, SH 358 (South Padre Island Drive), SH 286 (Crosstown Expressway), SH 44, and portions of U.S Network links were also re-defined to the new TxDOT-TPP facility type and functional class standard definitions. Financially constrained projects were incorporated into the approved 2006 network to define the 2040 forecast network. Projects included improvements to existing links, the staged improvement of existing roadways to full freeway standards, and the construction of new roadways on new rights-of-way, refer to Map 3.1, below. Significant 2040 network projects coded into the model include: Completion of the Joe Fulton corridor with an enhanced connection at IH-37. Replacement of the Harbor Bridge on a new alignment, with an interchange at SH 286. Upgrade of US 77 to full freeway standards as for north as IH-37. Extension of SH 286 as far south as FM 2444 with full freeway standards. Upgrade of SH 44 to full freeway standards to just east of US 77. Reliever routes around Driscoll and Sinton. Ramp reversals along SH 358. Urban development in the study area since the 2006 model was developed changed the character of several of the defined traffic analysis zones (TAZ). In order to retain a fairly homogenous character in each TAZ, several were split to define new zones. Additionally, some new zones were defined in order to match the TAZ structure with the newly-developed detail coded network. As a result, the 416 internal TAZ s in the 1996 model have been redefined into a 602 TAZ structure for the 2006 model. The number of external stations has remained unchanged at 22. MAP Significant Network Demographic data developed for each TAZ includes the following information: population, number of households, median household income, employment data by four general categories (Basic, Retail, Service, and Educational employment), and the locations and similar attributes for designated special traffic generators. 24 CHAPTER 3 REGIONAL TRENDS & DEMOGRAPHICS
29 Corpus Christi Metropolitan Transportation Plan The demographic data was developed based on population and employment estimates for 2006 and 2040 projections obtained from the Texas State Data Center. These data were used as control totals for disaggregation to the TAZ level. Data were cross-checked using ratios and comparisons to previous data. An independent review of the data conducted by TxDOT-TPP with the assistance of the Texas Transportation Institute (TTI) found that the control totals were reasonable. (Refer to Maps ). The disaggregation of the control totals to the TAZ level followed several steps. The Texas State Data Center data for census places were allocated to TAZ s based on a review of the character of each TAZ and on its available developable land area. Allocation within each census place was further guided by population and employment trend areas identified through a consensus of regional stakeholders in a workshop hosted by the MPO. Allocated data was then reviewed and smoothed as necessary for reasonableness of growth, growth rates, and compatibility with historic data, and cross-checked against reasonable ratios. The resulting tool provides a base set of 2040 demographics and a consistent, model-based tool for defining a set of 2040 demographics which include employment and population at any given level of estimated employment. The second set of demographics can then be used as the official input to the TDM. The development of the network zone structure, and TAZ-level demographics for the TDM is being completed through use of a consultant contract. The detailed procedures, recommendations, and results of these efforts are being documented in separate technical memoranda. The model is validated through an iterative process, where travel data (e.g. trip rates, speeds, trip lengths, etc.) are adjusted until modeled volumes replicate observed conditions. The 2006 TDM was calibrated to the comprehensive travel surveys discussed in the Background Summary, and validated to the 2006 urban saturation ground counts. Trip rates were developed from the comprehensive travel surveys discussed in the Background Summary. Current Activities for the Development of 2040 Travel Model The Transportation Policy Committee approved the MTP Validation Study which was developed to provide a peer review and analysis of the 2040 MTP process. A critical element is the evaluation of data provided as input into the Travel Forecasting Model. The MTP Validation Study is a five-year process which will involve the MPO, TxDOT, TTI, and area entities and their resource staff. The objective is to review and document the MTP development process and the individual tasks and elements required in the process. The initial focus is the evaluation of developing reliable input data to be used in the modeling process since it is the model output that forms the foundation for MTP project recommendations. As a first step, staff from TTI, TxDOT, and MPO have met to identify the elements of the process, individual task deliverables and individual responsibilities and to provide basic training for the MPO staff. The identification of a resource group was identified as an initial task, so that they can provide input into the review process and be developed as community advocates for the MPO planning process. It is intended that the Validation Study will provide milestone best practices documents and result in a 2040 revised MTP that is based on forecast data that is of the highest confidence and documentation of the process that will benefit small and mid-size MPO s. CHAPTER 3 REGIONAL TRENDS & DEMOGRAPHICS 25

30 Corpus Christi Metropolitan Transportation Plan MAP Population 26 CHAPTER 3 REGIONAL TRENDS & DEMOGRAPHICS

31 Corpus Christi Metropolitan Transportation Plan MAP Projected Population CHAPTER 3 REGIONAL TRENDS & DEMOGRAPHICS 27
32 Corpus Christi Metropolitan Transportation Plan MAP Employment 28 CHAPTER 3 REGIONAL TRENDS & DEMOGRAPHICS

33 Corpus Christi Metropolitan Transportation Plan MAP Projected Employment CHAPTER 3 REGIONAL TRENDS & DEMOGRAPHICS 29
34 Corpus Christi Metropolitan Transportation Plan [page intentionally left blank] 30 CHAPTER 3 REGIONAL TRENDS & DEMOGRAPHICS
35 Corpus Christi Metropolitan Transportation Plan REGIONAL TRANSPORTATION NETWORK CHAPTER 4 INTRODUCTION A variety of transportation options are available to meet the diverse travel demands of the Coastal Bend. These essential components of the regional transportation network are comprised of interrelated projects, programs, and policies that work together to support efficient access, through various modes of transportation choices. The movement of goods and people, that accommodate the mobility needs of this growing region over the 25 year horizon, are discussed in the following sections. ROADS AND HIGHWAYS The framework for our regional transportation network includes roads and highways, public transportation, active transportation (bicycle and pedestrian), freight, the port, recreational travel and air travel. Each component encompasses interrelated, multi-modal policies, programs, and projects. These components work together to address the following: 1. Support economic vitality 2. Increase safety 3. Increase security 4. Increase accessibility and mobility of people and freight 5. Protect and enhance the environment 6. Enhance the integration and connectivity 7. Promote efficient system management and operation 8. Emphasize the preservation of the existing transportation network Addressing these factors is essential to a healthy and sustainable regional transportation network that that will not only shape our movement of people and goods but will address environmental, social and economic goals. Providing consistency between road and highway improvements and State and local planned growth and economic development patterns is crucial to secure this connectivity. Roads and highways convey a variety of agency responsibilities. The State system (represented in Map 4.1) includes 907 center-line-miles of roadway in Nueces and San Patricio Counties. In addition to State maintained roadways, 1,300 miles of County road system and 1,900 miles of city streets comprise a network of corridors to connect and carry a variety of vehicles, bicycles and pedestrians. There are over 360,000 registered vehicles in Nueces and San Patricio County that have operated an estimated 10 million average daily vehicle miles in the two-county area. Roads and highways help define the structure of a community, providing critical connectivity within our transportation network. An increasing population is producing a growing number of vehicle trips including single-purpose, single-person trips. One of the results of this increase in vehicle trips is an increase in congestion. Congestion can hinder critical connectivity within our transportation network. Congestion can CHAPTER 4 REGIONAL TRANSPORTATION NETWORK 31

36 Corpus Christi Metropolitan Transportation Plan MAP 4.1: State Roads and Highways System be addressed by increased capacity. However, with constrained financial resources, the construction of new capacity to accommodate congestion is challenging. In light of this financial constraint, alternative methods to address congestion include preservation of the existing transportation system, maintenance, access management, use of alternative modes, and integrated transportation and land use planning. These are the focus of streets and highways development for the future. URBAN ACTION PLAN Transportation helps shape an area s economic health and quality of life and influences patterns of growth and economic activity through use. Planning enables civic leaders, business interests and citizens to play a meaningful role in creating communities that enrich people s lives. Transportation planning is a cooperative process. Transportation planning includes monitoring existing conditions, forecasting future population and employment growth, identifying current and projected future transportation problems, developing long and short range plans, estimating the impact of recommended future improvements and developing a financial plan for securing sufficient revenue. The planning process, our Urban Action Plan, leads to projects and improvements funded by local, state and federal sources that advance the area s long-term goals. 1. Reduce Congestion by maximizing the capacity and efficiency of the existing major highways 32 CHAPTER 4 REGIONAL TRANSPORTATION NETWORK

37 Corpus Christi Metropolitan Transportation Plan and streets. 2. Improve the Safety of our transportation network through improved efficiency and effectiveness of major road and highway facilities. 3. Provide new facilities, improved facilities and transportation services that Expand the Economic Opportunities in the area. 4. Provide new facilities, improved facilities and transportation services that will support the maintenance of our Attainment status and Improve Air Quality, 5. Provide new facilities, improved facilities and transportation services that will Increase the value of Transportation Assets. To meet the above goals the MPO has established the following objectives or actions: Action 1: Develop and maintain the street classifications geodatabase as roadway improvement decisions are made. Roads and highways are typically classified according to their intended function in providing traffic movement. These functional classifications carry a hierarchy as well as a set of design standards consistent with the type of service each facility is intended to provide. Criteria for designation of road and highway facilities include travel desires of the public, access requirements for adjacent land use, and continuity of the system. Classifications used in the Corpus Christi Metropolitan Area are identified below in Figure 4.1: FIGURE 4.1: Road and Highway Classifications CHAPTER 4 REGIONAL TRANSPORTATION NETWORK 33
38 Corpus Christi Metropolitan Transportation Plan FIGURE 4.1: Road and Highway Classifications - Continue The road and highway geodatabase is intended to provide an overall framework for making decisions on road improvements and extensions. The geodatabase identifies the general location of future major transportation corridors and should serve as a general guide for securing street right of way and for determining appropriate zoning intensities. Precise locations of future facilities will be determined prior to right of way acquisition. Action 2a: Establish and support a system of priorities for the existing roadway reconstruction and preventative maintenance. Existing roads that are below the acceptable standard for Pavement Index Condition (PCI) require roadway reconstruction. Existing roads that have an acceptable PCI require preventative maintenance. Because roadway reconstruction includes additional opportunity to right-size the roadway and build complete streets, prioritization of these projects is an important process. It is recommended that improvements to existing facilities be assigned priorities on the basis of the following factors: 1. Surface Condition (Pavement Index Condition, PCI) 2. Roadway Classification, ADT and growth 3. Health & Safety, vehicular or pedestrian 4. Community and public image 5. Multi-Modal Use and Opportunity 6. Access/Place-based Connections Action 2b: Establish and support a system of priorities for the replacement of deficient bridges. Existing bridges that are below acceptable standard will pose continuous operational, safety, and maintenance problems until improvements are made. It is recommended that improvements to existing bridges be assigned priorities on the basis of the following factors: 34 CHAPTER 4 REGIONAL TRANSPORTATION NETWORK
39 Corpus Christi Metropolitan Transportation Plan Existing and projected traffic volumes 2. Volume-to-capacity ratios 3. Traffic accident history 4. Peak-hour and off-peak hour travel speeds 5. Structural condition 6. Surface width 7. Use as a Hurricane Evacuation Route Based on these considerations, improvement priorities have been identified in the Project Listing section of the plan. These priorities were defined with the assistance of the Texas Department of Transportation computerized travel demand model. This model estimates future traffic levels for streets on the network on the basis of population and employment projections Action 3: Preserve major street alignments by preventing development within corridors designated as right-of-way for future roads. The City of Corpus Christi s transportation plan, MobilityCC, has identified right of way requirements to prevent encroachment of subdivision development for present and future road improvements. Some flexibility to determine precise alignment is possible when a plat is filed and upon right of way acquisition, but the approximate routes of all major streets as shown on the plan should be adopted and respected by city and county governments as development proceeds. Priority corridors should be identified with the previously mentioned travel demand model. Action 4: Ensure that land use (type, intensity, and traffic generation characteristics of developments) bears a reasonable relationship to the street system. Land use and transportation are interdependent. Streets should have adequate capacity so that new and contiguous development does not cause or compound traffic congestion. A traffic impact analysis (TIA) requirement is an acceptable method for assuring development compatible with the transportation system. A simplified traffic analysis, identifying the number of vehicle trips generated by the proposed development and the impact of these trips on the street network, should be conducted whenever an agency approval for a plat or rezoning is required. If this analysis indicates that traffic problems may occur, a detailed study should be conducted to determine the proper course of action. Off-site traffic improvements should be made by the developer if the development is solely responsible for creating a situation which necessitates the improvements. Action 5: Minimize potential traffic conflicts by controlling the frequency and location of driveway access to principal arterial, arterial, and collector streets. Each type of street is intended to perform a different function, and access should be regulated accordingly. Local streets are intended primarily to provide access to abutting property and should do so with minimal restrictions. Arterials are intended primarily to move traffic and cannot do so efficiently if there are too many access points which disrupt traffic. Flashing beacons along arterials for schools and hospitals slow down the traffic. Access to schools should be provided from streets that have the needed capacity. Pedestrian signals may be installed on arterials and collectors to replace flashing beacons. Collector streets serve as a dual function of access and traffic movement and should have moderate restrictions on access. Action 6: Provide off-street parking and loading facilities in sufficient quantity to accommodate CHAPTER 4 REGIONAL TRANSPORTATION NETWORK 35
40 Corpus Christi Metropolitan Transportation Plan vehicle volumes generated by the type and intensity of development. Provide enough off-street parking bearing a reasonable relationship to the number of vehicle trips attracted by a particular development. The shared use of parking facilities should also be encouraged where two or more establishments are not normally open at the same time. Platting and subdivision ordinances of municipalities may be amended to allow movement of traffic from one business to another without using the public street system. Action 7: Discourage on-street parking along major streets. On-street parking should be discouraged or prohibited along principal arterials, arterials and collectors. Consideration should also be given to removing existing on-street parking along major streets where congestion occurs and adequate off-street parking is available. Action 8: Maximize the efficiency of the existing street system by implementing effective transportation control measures (TCM). The construction of new streets is an expensive and lengthy process. Where the need for a major transportation investment is identified and federal funds are potentially involved, major investment (corridor or sub-area) studies shall be undertaken to develop or refine the plan. Major investment studies shall evaluate the effectiveness and cost-effectiveness of alternative investments or strategies in attaining local, state, and national goals and objectives. The alternative strategies can be a combination of various TCM techniques: trip reduction, highoccupancy vehicle (HOV) lanes, traffic flow improvement, and flexible work schedules. These and many other TCM techniques can maximize the efficiency of existing streets. Action 9: Employ ITS and other Transportation System Management (TSM) techniques for improving the capacity of the existing street system. Signal regulations, ramp metering, one-way pairing and reversing lanes can increase the capacity of existing facilities. Action 10: Emphasize the preservation of existing assets. Given the current fiscal limitations, project priority has been placed on operational improvements and the preservation of existing assets as the initial efforts in maintaining a level of service acceptable to the local community. Action 11: Promote community or urban design that facilitates alternative travel modes. Development density and location can influence regional travel patterns. Encouraging the coordination of land use and transportation planning can promote development patterns that can accommodate increased growth while facilitating multi-modal travel modes. The MPO remains cognizant of the effects the existing and future transportation systems may have on land use development demands, choices and patterns. Implementation of this decision-making process requires communication and interaction with those involved with developing and implementing plans for growth, economic development and similar issues and concerns impacting land use. Promotion of such decision-making processes, assists in protecting and enhancing the environment, one of the eight planning factors. 36 CHAPTER 4 REGIONAL TRANSPORTATION NETWORK
; provide an alternate route in portions of")
41 Corpus Christi Metropolitan Transportation Plan REGIONAL CONNECTIVITY Regional Parkway Mobility Corridor The MPO, City of Corpus Christi, Nueces County and San Patricio County have sponsored efforts to conduct a study to determine whether a new roadway is needed to alleviate increasing congestion on SH 358 (South Padre Island Drive); provide an alternate route in portions of Nueces and San Patricio Counties, and to plan for forecasted growth in the region. The study focused on the feasibility of what has become known as the Regional Parkway Mobility Corridor (RPMC). The study has been guided by a Project Coordinating Committee (PCC) consisting of members from each of the sponsoring entities, as well as, members from the Texas Department of Transportation (TxDOT). Members of the PCC were briefed at each study milestone during the alternatives analyses and provided direction to the study team. Additionally, study milestones and developments were shared with the Corpus Christi Regional Transportation Authority (CCRTA) and Federal Highway Administration (FHWA). The study area for the RPMC is comprised of approximately 275,000 acres. Need and Purpose Within Nueces County future traffic volumes along existing roadways including segments of US 77, SH 44 and SH 286, are anticipated to increase substantially by In addition, the Texas State Data Center anticipates a 51 percent increase in population within the study area by 2040 which would result in increased traffic congestion and safety issues. On North Padre Island, the projected growth of flood-prone and vulnerable residential communities and vacation sites on the island underscores the need for a more efficient evacuation route which would be Conceptual Suburban Rendering of the Regional Parkway provided by an additional crossing of the Laguna Madre. Within the northern portion of Nueces County, current bridge structures over the Nueces River are subject to flooding, and a new structure would improve crossing capabilities during hazardous situations or a flooding event. For many years, there has been discussion about the need for an alternate major transportation route within Nueces County to address the expanding development in the northwest to southern part of the County and the resulting traffic issues. This route would also potentially provide connections to other roadway facilities that serve or are proposed to serve international trade, port facilities, and rail initiatives in addition to improving the safety of drivers and pedestrians within the area. To meet these and other transportation needs such as reduction of traffic congestion, the RPMC is proposed to be developed as a complement and CHAPTER 4 REGIONAL TRANSPORTATION NETWORK 37
42 Corpus Christi Metropolitan Transportation Plan enhancement for mobility in the Corpus Christi, Nueces County and San Patricio County areas. The proposed RPMC is included as a priority corridor within the region s Metropolitan Transportation Plan (MTP) which extends through the year Improvements may include proposed modifications to connecting facilities such as SH 286 (Crosstown Expressway), SH 358 (South Padre Island Drive), I-37, I-69, Park Road 22, SH 361, SH 357 (Rodd Field Road), and FM 624 (Northwest Boulevard). The PCC and area stakeholders, TxDOT and the MPO have identified the following purposes as those to be addressed by the proposed RPMC: Reduce Congestion and Facilitate Regional Mobility Connectivity and System Linkages Facilitate Potential Economic and Population Growth Address Safety Issues Provide Alternate Hurricane Evacuation Route Enhanced mobility and connectivity to the northern portion of the study area may also reduce congestion caused by increased truck traffic resulting from developing oil field activity. In addition, a proposed route would improve system linkages to the future planned I-69 facility providing relief for the anticipated congestion and increased traffic resulting from this development. Identification of Preliminary Segments Seven segments were identified in coordination with the PCC. These segments are summarized in Table 4.1 and illustrated in Map 4.2 using an alphabetic identifier and were then evaluated to determine prioritization. It should be noted that Segments A and B are assumed to include the extensions of Rodd Field Road and Cimarron Road. TABLE 4.1: PRELIMINARY CORRIDOR SEGMENTS FROM TO LENGTHS (MILES) SEGMENTS FROM TO MILES A Park Road 22 Rodd Field Road 9.5 B Rodd Field Road SH C SH 286 CR D CR 57 US E US 77 SH F SH 44 FM G FM 624 I Evaluation Summary Based on the projected traffic volumes that each preliminary segment of the RPMC would attract from the regional roadway network, Segment A is projected to generate the highest daily traffic volumes both short term in 2020 and long term in Segments B and F are projected to have low traffic volumes if constructed by 2020, however by 2040 it is anticipated that they would generate higher traffic volumes. The other segments are projected to have low traffic volumes both in 2020 and CHAPTER 4 REGIONAL TRANSPORTATION NETWORK

43 Corpus Christi Metropolitan Transportation Plan MAP 4.2: Regional Parkway Mobility Corridor Segments In terms of travel time savings, Segment A is expected to reduce VHT by almost 10 percent in 2020 and by 15 percent in The impact of the other segments is less than one percent in both 2020 and Although Segment A is projected to perform well from a traffic volume and regional travel time savings perspective, the cost of a bridge over the Laguna Madre, as well as the potential issues with environmental clearance, could pose problems. The relative impact of the added cost of the Laguna Madre compared to other segments is accounted for in the determination of the benefit/cost ratio. Based on that criterion, Segment A is still economically feasible. With the exception of segments C, D and G, all other segments are also projected to have benefit/cost ratios higher than one. CHAPTER 4 REGIONAL TRANSPORTATION NETWORK 39
44 Corpus Christi Metropolitan Transportation Plan Overall, therefore, there are some segments such as C, D, and G which may not have independent utility. Consideration should therefore be given to combining some of these preliminary segments into larger segments which have independent utility. HARBOR BRIDGE PROJECT The Texas Department of Transportation (TxDOT - CRP) - Corpus Christi District, is determining whether the Harbor Bridge, which spans the Corpus Christi Ship Channel at U.S. 181, should be replaced. A Feasibility Study completed by TxDOT in 2003 concluded that U.S. 181 and the Harbor Bridge must be improved to maintain a safe and efficient transportation corridor. With substantial public input, TxDOT has prepared an Environmental Impact Statement (EIS) that evaluates several potential alignments for a new bridge, as well as a no-build scenario (leaving the current bridge in place). The proposed project includes the replacement of the Harbor Bridge and the reconstruction of portions of U.S. 181, I-37, and SH 286 (Crosstown Expressway) in Corpus Christi, TX. The project is needed to maintain the long-term operation of a U.S. 181 crossing of the Corpus Christi Ship Channel and to address safety risks caused by design deficiencies. The project limits extend both north-south along US 181 from Beach Avenue to Morgan Avenue at Crosstown Expressway. Four alternatives plus a No-Build alternative have been considered, and a preferred alternative (Red) has been identified for the proposed project. The proposed project would potentially involve the relocation of residences and businesses, and about 30 acres of right-of-way for the Green Alternative, 69 acres for the West Alternative and about 50 acres each of right-of-way for the Red and Orange Alternatives. In addition, the project would potentially require the use or taking of public land designated for use as parks and recreation areas, including Lovenskiold Park, TC Ayers Park, and the Rincon Channel Wetlands. All four alternatives involve impacts to wetlands and existing floodplain. The existing Harbor Bridge is considered to be a historic resource and would be removed as a result of the proposed project. The preferred alternative would consist of a controlled-access facility on a new location and would include six lanes within a right-of-way width that varies between feet, three 12-foot lanes in each direction with a median barrier and 12-foot inside and 10-foot outside shoulders. The alternative includes a 10-foot bicycle and pedestrian shared-use path on the main span of the bridge and on the bridge approaches. The preferred alternative would require the acquisition of approximately 50 acres of new right-of-way, including 0.32 acres of Lovenskiold Park, 5.14 acres of T.C. Ayers Park, 39 residences, and three businesses, and would cause the displacement of four warehouses. Other environmental impacts would include community impacts, access changes, and impacts to land use, floodplains, water quality, vegetation, hazardous materials, and traffic noise. The Draft EIS ( also includes an analysis of the impacts of the project on historic sites and on publicly owned parkland (the Section 4(f) analysis). Record of Decision is anticipated in Fall 2014 with subsequent construction anticipated in Summer HIGHWAY SAFETY IMPROVEMENT GRANT PROJECT The Texas Department of Transportation has awarded the City of Corpus Christi $7 million in grants aimed at highway safety improvements. The funds will provide construction and operational improvements on and off the state highway system. City of Corpus Christi Traffic Engineering staff identified highway safety 40 CHAPTER 4 REGIONAL TRANSPORTATION NETWORK
45 Corpus Christi Metropolitan Transportation Plan projects to interconnect and improve traffic signals on arterial streets. The project will include Agnes Street, Ayers Street, Greenwood Drive, Kostoryz Road and Port Avenue. Street selection is based on accidents reported over the past three years and will include improvements to more than 60 traffic signals. The focus is to eliminate or reduce the number of severe traffic crashes as identified in the Texas Strategic Highway Safety Plan and will require 10% of City funding needed at the time of construction. Road Maintenance Strategies The City of Corpus Christi has implemented a Street Improvement Program to address the current and future condition of city streets. This program comprised of four strategies: Maintenance, Arterial / Collector Reconstruction, Residential / Local Reconstruction, and Policies. Maintenance: The Maintenance Strategy is comprised of the Street Maintenance Fee (SMF) and the Street Preventative Maintenance Program (SPMP). The focus of this Strategy is to implement a new, systematic preventative maintenance program to extend the service life of streets in good or fair condition. This maintenance strategy is being funded through a street maintenance fee that is collected on residential and commercial utility bills. Arterial & Collector Reconstruction: This Strategy addresses the complete reconstruction of the most heavily used streets in the City. Arterial & Collector reconstruction is typically financed through bonds. Propositions slated for the November 2014 election would continue with additional arterial and collector reconstruction. Residential & Local Reconstruction: This Strategy addresses the complete reconstruction of less heavily traveled streets such as neighborhood streets. Policy: The Policy Strategy addresses certain policies concerning construction standards and street cuts. Improved construction standards leads to streets that are designed and constructed to last longer. Revised street cut policies address the damage caused to streets by cutting into the pavement for various purposes. Critical Incident Planning The regional transportation network is a critical part of the area infrastructure for the safe efficient movement of people and freight. Nevertheless, local public safety agencies must and have prepared for the natural and manmade incidents that could disrupt the effective use of the transportation network. Hazardous cargo spills, major accidents, extreme weather events including hurricanes are just some of the incidents the local agencies have prepared for in a comprehensive manner To expand upon these efforts the MPO and local partners have established a dialog concerning those events that may have an extended impact on the transportation network. The scenarios that have been discussed include: 1. A long-term closure of the Harbor Bridge (U.S. 181) 2. A long-term closure of the Intracoastal Waterway Bridge (Park Road 22) 3. A long-term closure of the ferry landing (SH 361) 4. A long-term closure of the bridge over the Nueces River (I-37) Discussions to facilitate the pre-planning of responses to events that have the potential to disrupt the transportation network for an extended period of time has remained active among Member agencies and community leaders. CHAPTER 4 REGIONAL TRANSPORTATION NETWORK 41
46 Corpus Christi Metropolitan Transportation Plan PUBLIC TRANSPORTATION The development of responsive public transportation services in the study area is essential to the development of the social and economic health of the community. Public transportation services in the region include: Frequent transit service on high ridership corridors within the Priority Transit Network (PTN) per the Long Range System Plan adopted by the CCRTA in October Supplemental paratransit services for elderly populations and individuals with disabilities. Services that provide access to work over long distances - Park N Ride and vanpool programs. Seasonal and recreational services Harbor Ferry and college/university services. Mass transportation alternatives such as the City of Corpus Christi Downtown trolley services which also service the Harbor Bridge and North Beach community areas. Support of the Pollution Prevention Partnership program. Improved quality of life through Livable Communities Initiative (LCI) that includes landscaping, lighting, pedestrians and bike trails, and accessibility ramps. Financial support for Transportation Asset Management through the funding of repairs and improvement of streets. GOALS AND OBJECTIVES To meet the public transportation service needs of the citizens of the metropolitan area, the MPO has identified the following objectives: 1. Provide frequent, direct, efficient, reliable and safe transportation services to residents and visitors. 2. Ensure financial resources are available to provide services and facilities to support mobility needs. 3. Minimize vehicle impact on the metropolitan area s environment so that minimum acceptable air quality levels established by the National Ambient Quality Standards are maintained. 4. Coordinate with agencies to provide accessibility to jobs for economically disadvantaged residents. 5. Encourage private nonprofit agencies to meet mobility needs of the elderly and disabled citizens. Action 1: Make Public Transportation Accessible. The MPO, CCRTA, rural providers, and human service agencies, are committed to safe, reliable, economic and accessible service to the citizens in the area with a coordinated service delivery system. Action 2: Maintain, develop, and expand existing service. The MPO and the transit providers will encourage ridership increases by providing coordinated, low cost, safe, accessible, and reliable service. Action 3: Maximize financial resources by securing federal, state, and local funding. Providers will continue to efficiently utilize federal, state and local funds for capital and operational improvements of the system while seeking to leverage discretionary funds for transit facilities. Action 4: Maintain, develop and expand the Authority s ridesharing services. Providers will continue to promote transportation alternatives through programs that encourage employees and employers to participate in ridesharing and vanpooling programs. 42 CHAPTER 4 REGIONAL TRANSPORTATION NETWORK
47 Corpus Christi Metropolitan Transportation Plan Action 5: Recognize the impact of transit bus stop facilities on land use. The MPO will advocate for accessible consideration and land use impacts when decisions of location and design for bus stop shelters and transfer stations are discussed as facilities influence land development and impact neighborhoods through increased ridership and vehicular traffic. Action 6: Provide a safe and comfortable environment for transit users and public in general. Providers will work cooperatively with local communities to ensure facilities are safe, accessible, and comfortable environments for passengers through effective design, and location. Action 7: When reasonable, continue to purchase certified low-emission vehicles. Providers will continue to purchase certified low-emission vehicles, as they deem appropriate. PUBLIC TRANSPORTATION PROVIDERS Rural and urban providers collaborate to provide public transportation services to the broader region. The two rural providers and one urban provider offering public transportation into and out of the Corpus Christi urbanized area include: Paisano Express: Administered by Kleberg County Human Services in Kingsville, offers service to Kenedy, Kleberg, and Nueces Counties. REAL Transit: Administered by Rural Economic Assistance League, Inc. in Alice, offers service to Brooks, Duval, Jim Wells, and San Patricio Counties as well as counties previously service by the now dissolved Bee Transit. These additional counties include service to Aransas, Bee, Live Oak, McMullen and Refugio. The B: The CCRTA The B, provides a variety of public transportation services throughout most of the Corpus Christi Urbanized area including the communities of Agua Dulce, Banquete, Bishop, Driscoll, Port Aransas and Robstown. Within San Patricio County, the CCRTA service area includes the City of Gregory and Old San Patricio. The CCRTA, established by voters of Nueces and San Patricio Counties in August 1985, began operations in January The CCRTA's transit operation is supported by a 1/2 cent sales tax collected by member communities. Current Service Characteristics: The CCRTA operates 33 weekday fixed routes, 26 Saturday fixed routes, and 12 Sunday fixed routes. Hours of service for weekdays and Saturdays run from approximately 4:40 am to 11:15 pm. Sunday service hours span from 7:45 am to 7:45 pm. Passengers also have the opportunity to utilize the CCRTA s designated Park N Ride lots in the service area by parking their vehicles and riding the Authority s buses. Park N Ride lots available include: Annaville/Tuloso-Midway: Located at Leopard Street and McKenzie Road Calallen: Located off I-37 at Leopard Street and Rehfield Road Gregory: Located under the SH 35 overpass, just north of U.S. 181 Robstown: Located at Avenue A and 4 th street Greenwood Walmart: Located near the intersection of SH 358 (South Padre Island Drive) and Greenwood Drive In the outlying communities, CCRTA partners with purchased transportation providers to operate a "route deviation" service to the residents of Bishop and Driscoll where they request curbside pickups at their locations, or they can catch the bus at designated stops. In the City of Port Aransas, two contracts exist to provide residents with a local trolley service and an intercity B-Line link. In the Port Aransas scenario, CHAPTER 4 REGIONAL TRANSPORTATION NETWORK 43
48 Corpus Christi Metropolitan Transportation Plan CCRTA owns the vehicles and they reimburse the city for the cost of providing the service. Other CCRTA service options that exist include B-Line, a supplemental curb-to-curb service that is offered on a demand response basis for riders who are prevented from accessing the CCRTA s fixed route service. Passengers of this service must apply for eligibility in advance of using the service. Once eligibility is granted, riders may call and schedule trips twenty-four hours in advance. Vanpool programs are also offered for residents of the service area. CCRTA provides a vehicle for a group of individuals who share the ride. The members of the group designate one person to be the regular driver and they pay a monthly fee. The CCRTA pays for all fuel, insurance and maintenance. During seasonal months (Memorial Day to Labor Day), riders have service from the Southside Station to Padre Island and Port Aransas; trolley circulator service in Port Aransas; and the Harbor Ferry, a pedestrian only ferry operating in Corpus Christi Bay between the People s Street T-Head and the Texas State Aquarium. The Authority provides consumers of the fixed route network with transit centers and transit stops to facilitate transfers to/from routes and bus layover/schedule recovery time. Ridership activity (boardings and alightings) was counted at a total of 1,350 unique stops across the CCRTA system. The four transit stations generated the most activity, accounting for about 33% of all activity on weekdays, Saturdays, or Sundays. These transfer stations include: Staples Street Station: opened in 1994 and located at Staples and Mestina Streets across from the Corpus Christi City Hall, generates the most activity serving approximately 20 routes. Port Ayers Station: opened in 1995 and located at the intersection of Port Avenue and Ayers Street, generates the second highest level of activity serving 12 routes. Southside Station: opened in 2003 and located on McArdle Road across from La Palmera Mall, generates the third highest level of activity serving 16 routes. Six Points Station: a long standing transfer station, reopened after renovations in It is located at the intersection of Staples/Alameda/Ayers Streets and generates the fourth highest level of activity serving 7 routes. RTA s ridership in 2013 was recorded at 5.7 million annual riders on fixed route services. This total does not include ridership on Flexi-B (Port Aransas service), Harbor Ferry, or B-Line service. Average daily ridership on CCRTA s fixed route system (not including school-related routes) in 2013 was: Weekday: 18,732 Saturday: 12,756 Sunday: 4,187 CCRTA s cooperative partnership with local colleges and universities (annual contract agreements) offers free rides on all regular fixed routes and B-Line service for students (and in some cases faculty/staff) presenting a valid Del Mar College or Texas A&M University-Corpus Christi (TAMU-CC) ID. Other CCRTA Transportation Projects The B provides financial assistance to local communities for transportation projects through its Street Improvement Program which returns a portion of their dedicated annual sales tax receipts to the member cities for use in general transportation projects identified by each city and the CCRTA. Eligible expenditures include projects tied to public transportation services, such as streets traveled by CCRTA buses. The 44 CHAPTER 4 REGIONAL TRANSPORTATION NETWORK
49 Corpus Christi Metropolitan Transportation Plan amount, based on sales tax funding and the allocations between participating governmental entities, is determined annually by the Authority. Access to Jobs and Reverse Commute (JARC) and New Freedoms The Transportation Policy Committee of the MPO adopted a Resolution of Endorsement naming the CCRTA as the Designated Recipient for Job Access and Reverse Commute (JARC) and New Freedom (Federal Transit Administration Section 5316 & 5317) funding. JARC program funds provide reverse commute transportation services to access employment for low income individuals and welfare recipients. New Freedom program funds support transportation services above and beyond ADA requirements for seniors and people with disabilities. The MPO developed the Regional Transportation Coordination Plan in cooperation with area health and human service agencies, transportation providers, and other interested agencies. The Regional Transportation Coordination Plan discusses JARC needs and identifies the following: a. Geographic distribution of welfare recipients and low-income people in the region. b. Geographic distribution of employment centers and employment-related activities in the region. c. Existing public, private, non-profit and human services transportation providers in the region. d. Transportation gaps between the geographic distributions of people identified in Item a ; employment, not currently served and identified in Item b ; and the transportation services identified in Item c. e. In order of funding priority, projects to address the gaps identified in Item d. Livable Communities Initiatives The Federal Transit Administration (FTA) encourages recipients of federal transit funds to improve pedestrian access to and from transit facilities and routes by recognizing certain types of capital improvements as eligible for grant funding through the FTA Livable Communities Initiative (LCI). FTA supports favorable access conditions that provide a positive atmosphere for the bus rider, which in turn, helps build ridership and confidence in transit. Historically, transfer stations are consistently renovated and updated for more efficient, accessible, safe and pleasant use of the service. CCRTA actively pursues partnerships with local agencies and citizens for creative input on unique designs and art work to provide the façade of these special projects. Evidence of these successful partnerships is the awarding of the Presidential Award from the National Endowment of the Arts for the Staples Street Station project. In May 2014, the CCRTA completed a climate controlled Coastal Bend Regional Intermodal Facility in Robstown, Texas near the intersection of U.S. 77 and State Highway 44. The facility creates a unique and affordable transportation connection between the CCRTA, rural providers (Paisano Express / REAL), and the intercity carrier, Valley Transit Company (VTC). The facility provides a location and amenities to facilitate current and future needs for transit coordination in the 11-county Coastal Bend Region. Future Operational and Service Delivery Plans The CCRTA s recent completion of their phased Long Range System Plan contains outreach activities for CHAPTER 4 REGIONAL TRANSPORTATION NETWORK 45
50 Corpus Christi Metropolitan Transportation Plan possible consideration in future service planning efforts: Improving frequency on PTN service corridors. Implementing Bus Rapid Transit (BRT) services within select PTN corridors including Staples, Leopard, and Ayers Street. Operating more direct services to reduce transfer connections and decease travel time. Placing more bus stop amenities. Completing improvements that enable riders to access real-time passenger information. Continuing to coordinate with other large employers for subsidized employee programs. The CCRTA Board conducted a Strategic Planning workshop to project what the transit system would look like by 2029 and the following was identified: 1) an increase in transit oriented development; 2) population increase and demographic changes; 3) air quality in attainment; 4) increase in population density; 5) a need for greater convenience and speed; 6) light rail consideration; 7) an increased need for park n rides with express service; 8) job growth; 9) feasibility study for a multimodal station in Robstown; and 10) increased service to meet the aging population needs. Community based efforts to encourage Smart Growth and the Community Sustainability Visioning Workshop have included discussion of expanded and improved access to public transit. The possible development of new services including bus rapid transit or preservation of light rail corridors and is at the early stages of consideration. With a current population density of 1,976 persons/ square mile in the City of Corpus Christi and a limited daytime population in the central city, the development of high occupancy corridors must be viewed in the long-term planning horizon. REGIONAL TRANSPORTATION COORDINATION The goal of coordinating transit operations and health and human services is to move toward more coordinated, efficient, environmentally friendly, and accessible transportation services that eliminate waste and promote use by the general public. To this end, the Coastal Bend Region has established the Transportation Coordination Network (TCN) to represent the 11-county service area. As the region s shared decision making body, TCN provides an open platform for discussion among those with the highest stake in serving the public transportation needs. The collaborative efforts demonstrated through TCN s guidance have enabled many innovative and essential projects to emerge. The projects identified respond to the needs outlined in the 2011 Regional Public Transportation Coordination Plan (RPTCP) ( as well as responding to State and Federal regulations. Rural to Urban Coordinated Service TCN, in conjunction with the Coastal Bend rural transit providers, has worked jointly with the CCRTA to increase the use of public transportation by residents in the rural Nueces County communities of Agua Dulce, Banquete, Bishop, and Driscoll. This new partnership was developed to respond to the increased demand for service efficiency, reduce service overlaps and improve overall transit mobility for residents in the CCRTA service area. The need for effective coordination of services is of paramount importance as it results in using existing resources in the most cost effective way while maintaining services affordable and available to the riding public. The existing coordinated transportation services and those yet to be developed will greatly improve mobility options to the residents in these communities. 46 CHAPTER 4 REGIONAL TRANSPORTATION NETWORK
51 Corpus Christi Metropolitan Transportation Plan Like many thriving communities, we are in constant transformation, attracting new businesses, and embracing new technology. Public transportation will need to remain actively engaged in the planning process to make the necessary improvements to the existing system of services while attempting to satisfy the anticipated level of demand/ridership that comes with growth. Transit needs will emerge, as existing businesses expand and new ones come to the area along with the aging of our community, the cost of fuel, changes in legislation and policies. The benefits of public transportation to the region are an alternative that adds capacity while reducing the number of vehicles on roadways. It is a challenge and an obligation for transportation providers and public officials to coordinate the development of the community to make it a more livable community especially for those who have to rely on public transportation. A reliable transportation system will improve the quality of life and have an impact on the economic health of the area in general. ACTIVE TRANSPORTATION / BICYCLE & PEDESTRIAN As in other parts of the state, the Coastal Bend Region continues to experience steady growth while resources remain limited. For many years, our automobiles have dominated transportation investments across the state but in recent years there has been an increased awareness of the consequences related to these decisions... congestion, deteriorating air quality created by increased vehicle miles traveled, obesity due to limited facilities that promote activity such as bicycling and walking. The movement is now shifting toward maintenance and enhancement of the existing roadway system while active transportation, or bicycle and pedestrian options are explored. Active transportation offers a range of opportunities to improve our existing bicycling and walking system while simultaneously providing benefits to other users of our roads. It is important to remember that bicycling and walking ARE forms of transportation that can have positive impacts on our community s well-being and health. Since 1999, Federal Statutes have required that MPOs include bicycle and pedestrian facilities in the overall MTP process. In 2005, Safe, Accountable, Flexible, Efficient Transportation Equity Act: A Legacy for Users (SAFETEA-LU) mandated that the metropolitan planning process for a Metropolitan Planning Area shall provide for consideration of projects and strategies that will increase the safety and security of the transportation system for non-motorized users and enhance the integration and connectivity of the transportation system, across and between modes. Moving Ahead for Progress in the 21st Century Act (Map-21), the current highway authorization (signed in 2012 and expires in 2014) has been extended into Map-21 created the Transportation Alternatives Program (TAP) which consolidates what was formerly the Safe Routes to School Program, and the Transportation Enhancement Program (a federally funded program that allocates funds to non-traditional transportation activities), the largest funding initiative for bicycle and pedestrian facilities administered by TxDOT. Active Transportation Planning Efforts to Date Historically, active transportation planning has been a local issue. As such, the MPO is committed to serving as an information repository for bicycle and pedestrian data and maps. As an actively engaged member of the City of Corpus Christi s Bicycle and Pedestrian Subcommittee (BPS), the MPO has provided technical expertise, public outreach support, review of regional bicycle and pedestrian planning matters, and assisted in the selection of bicycle and pedestrian projects funded in our area. BPS meetings have provided a valuable forum for local entities and advocates of bicycling and walking activities to share best CHAPTER 4 REGIONAL TRANSPORTATION NETWORK 47

52 Corpus Christi Metropolitan Transportation Plan practices and discuss common interests in an effort to improve local initiatives. Current barriers that remain in the region include a lack of connectivity between bike facilities, consistent design strategies, funding, and the placement of bicycle and pedestrian facilities as a secondary priority on roadways. The issue of land use and the built environment adversely impacts and compounds the success for active transportation. As a community, we need to actively explore the opportunities available by TxDOT who has long supported the integration of bicycle and pedestrian facilities into the overall transportation system. Since 2001, TxDOT appointed district bicycle coordinators to ensure that bicycles are recognized as a viable mode of transportation on roadway facilities where use is feasible. Texas Statute now requires both a state coordinator and coordinators in each regional office. A majority of streets in Corpus Christi and Portland have sidewalks, and the climate and topography of the area are conducive to accommodate both bicycling and walking. In an effort to overcome underutilization of this transportation mode, both cities have actively begun retrofitting street corners with compliant accessibility ramps. The City of Map 4.3: Corpus Christi Bay Trail Corpus Christi, MPO, CCRTA, TxDOT, and other community entities have partnered to pool resources and cooperatively prioritize projects identified to improve pedestrian access over a multi-year period. Bicycle facilities, such as bicycle lanes, and off-street hike and bike trails remain limited in the metropolitan area. The Bay Trail, a hike and bike trail that extends approximately 8 miles from the Barge Dock near the American Bank Center out to Texas A&M University Corpus Christi, was funded under the Transportation Enhancement Program. With the project almost completed, Phase 3 is the next planned extension along Ennis Joslin to South Padre Island Drive and then through the City s south side. The MPO s Regional Pedestrian and Bicycle Plan is slated for review and update in The Plan will revisit planning and implementation of the Share the Road educational effort related to the BPS s traffic ordinance Chapter 53 Traffic, Section 53-15; update identification of on-street bicycle lanes; explore the impacts of a philosophical commitment from the city to consider complete streets as a design option that includes dedicated lanes as part of their planning process for future city street and drainage channel improvement projects. Already, the MPO and the City have prioritized funding to establish the hike and 48 CHAPTER 4 REGIONAL TRANSPORTATION NETWORK
53 Corpus Christi Metropolitan Transportation Plan bike trail along the Schanen Drainage Ditch from the Flynn Parkway area to the Oso Creek Park. The development of an Oso Creek Parkway Plan with the assistance of the U.S. Fish and Wildlife Service envisions over 13.5 miles of pedestrian and bikeway trails. Across the bay, Sunset Lake Park is a 333 acre park that showcases an ecologically rich wetland and saltwater lake habitat with a unique two (2) mile hike and bike trail constructed on an old roadway. The recent reconstruction along Memorial Parkway includes street improvements and bike lanes. Future anticipated projects enlist the City of Portland s vision to create connectivity of their bike paths. The construction of the Railroad Right-of-Way Hike & Bike Trail promises to contribute to this commitment while protecting habitat and increasing public use in a cooperatively planned effort to improve the outdoor experience. Pedestrian and Bicycle Rider Goals In general every trip includes a walking element. The needs of the pedestrian and bicycle rider, like the needs of vehicles, should be considered in the design of the urban environment and transportation facilities. Promotion and encouragement of active transportation should be directed toward: 1. Exploring innovative ways to encourage bicycling as a cost-effective and efficient transportation alternative by providing infrastructure in areas of employment/schools; enforcement of traffic laws to reduce the potential of bicycle accidents; and promotional campaigns offering information and maps of current routes. 2. Ensuring safe, accessible, and convenient mobility for pedestrians and bike riders. 3. Encouraging residents and visitors to walk or bicycle for trips of reasonable length. 4. Providing adequate financial resources for the expansion and maintenance of pedestrian and bicycle facilities. The above goals lead to actions that guide both short and long-term urban development conducive to active transportation. Action 1: Create an urban environment that encourages walking within comfortable walking distances as a form of active transportation. Add or improve sidewalks, create safe crossings, add ADA compliant ramps, and modify signalization and intersections where needed. Provide a network of low volume interconnected streets and public parks for through pedestrian travel. Collaborate with local governments to require major developments to include safe pedestrian access and circulation of their property, including access to transit connections. Encourage pedestrian friendly land use planning with commercial and institutional developments adjacent to the street/sidewalk rather than centered in or at the rear of a large parking lot. Encourage compact and mixed land uses. Action 2: Optimize the use of financial resources available for active transportation facilities. Prioritizing pedestrian projects based on their potential impacts has been incorporated into the TIP selection process. Priority funding to bikeway projects that complete missing sections of the regional bikeway system are included. Action 3: Support the development of a local active transportation network. CHAPTER 4 REGIONAL TRANSPORTATION NETWORK 49
54 Corpus Christi Metropolitan Transportation Plan Develop commitments to improve cycling opportunities through facility plans that increase mobility with a comprehensive bikeway system that is direct, convenient, and safe. Actions may include: Using existing right-of-way areas: streets, parkways, parks, and drainage. Compatible road networks with shoulders for bicycle travel. Ensure connectivity through construction of missing links of structures, paths, lanes, and routes. Modify street maintenance practices to utilize bicycle friendly surface treatments; and replace dangerous elements, such as unsafe grates and unresponsive signals. Improve and install standardized and correct signage and markings on all bike routes to minimize potential conflicts. Establish safety standards and guidelines for bicycle facilities, programs, and projects to protect the bicyclist and the motorist sharing the road. Action 4: Encourage development patterns to be more compatible with non-motorized travel. Create an urban environment that provides employment, goods, services, and recreational opportunities within comfortable bicycling distance. Specific actions may be: Coordinate with major developments and office complexes to include safe non-motorized access and circulation. Establish strategic and secure bicycle parking in business districts and other public sites. Encourage neighborhood-oriented commercial uses, parks, and schools within safe and easy bicycling distance from residential areas. Amend current driveway design standards to minimize to the greatest extent possible frequent driveway spacing as impediments to safe bicycle travel along "business districts. Action 5: Provide for the interface between bicycles and transit. The interface between bicycles and transit will support and strengthen both modes. Actions include: Encourage transit provisions for bicycle parking and improved bicycle access. Encourage transit system improvements to include bicycle racks on all buses. Action 6: Optimize the use of financial resources available for bicycle facilities. Action 7: Evaluation of active transportation programs. An essential component of determining the success of a program is a comparison of baseline data to project results. While many actions remain to be accomplished, several action items have already been initiated: Mobility CC CCRTA buses are retrofitted with bicycle racks for riders who combine multiple modes of travel. A subcommittee of the City s Transportation Advisory Committee, the Bicycle and Pedestrian Subcommittee serves to raise awareness and provide input on bicycle and pedestrian matters related to city streets. The MPO is actively engaged with both committees. The Bicycle and Pedestrian Subcommittee hosts an annual Leadership Ride where elected city officials, City Senior Staff and subcommittee members tour existing bicycle facilities for review and improvement considerations. The Pollution Prevention Partnership at Texas A&M Corpus Christi has partnered with the Texas Commission on Environmental Quality (TCEQ), City of Corpus Christi, Corpus Christi 50 CHAPTER 4 REGIONAL TRANSPORTATION NETWORK

55 Corpus Christi Metropolitan Transportation Plan Downtown Management District, CCRTA, and the MPO to raise awareness of bike racks in the downtown and bay front area. FREIGHT MOVEMENT The national, state and local transportation network depends on railroads and trucking as the most efficient modes of transportation for the movement of freight and bulk cargo. The Moving Ahead for Progress in the 21st Century Act (MAP-21), enacted in 2012, made a number of changes to improve the condition and performance of the national freight network and support investment in freight-related surface transportation projects. Specifically, it required the Secretary of Transportation to encourage each state to develop a comprehensive State Freight Plan and establish a State Freight Advisory Committee surface transportation projects. Specifically, it required the Secretary of Transportation to encourage each state to develop a comprehensive State Freight Plan and establish a State Freight Advisory Committee. TEXAS PRIORITY FREIGHT NETWORK The Texas Priority Freight Network (TPFN) identifies key freight movement corridors and gateways. Establishing this integrated and multimodal freight transportation system is a critical to facilitating efficient freight mobility in Texas. MAP 4.4: South/Central Region Traffic and Truck Volumes CHAPTER 4 REGIONAL TRANSPORTATION NETWORK 51
56 Corpus Christi Metropolitan Transportation Plan The TPFN will be a statewide network of high priority highway, rail, and waterway transportation corridors connecting ports like the Port of Corpus Christi to inland ports such as Laredo and San Antonio The TPFN objectives will include: Economic Competitiveness Efficiency Intermodal Connectivity, and Interregional Connectivity The TPFN will provide a vehicle for the National Freight Policy, Plan and Network to incorporate the needs of the Texas based TPFN. LOCAL TRUCKING GOALS Our local needs have been identified and should become part of the TPFN. They include the goals of: 1. Providing for the safe and efficient movement of trucks within the region. 2. Assuring that freight and trucking companies and other stakeholders are part of the regional coordination and planning efforts. 3. Identifying and enhancing routes and corridors that would provide connectivity for trucks particularly as it relates to critical freight facilities such as the La Quinta Trade Gateway, the Robstown Inland Port of the Americas and the Joe Fulton International Trade Corridor. The goals lead to specific policies: 1. Locate compatible land uses along major streets to encourage trucks to confine their travel to arterials, expressways and freeways. Control of truck traffic can be exercised through zoning and subdivision regulations. Given proper land use and subdivision design, most trucks will tend to use the major arterial system. Bridge clearance and roadways that are not designed for trucks contribute to congestion and safety concerns. Designation of a corridor as a freight route or important for freight can help focus the identification of mobility projects that would eliminate the barriers to safe, reliable and efficient movement of goods such as wider lanes, lane widths needed for increased turning radius and design standards that would accommodate heavy loads. 2. Discourage truck travel through residential neighborhoods. Prohibit truck through traffic on all local and collector streets with residential zoning to eliminate noise, danger, and street maintenance costs. Provide signage that alerts trucks to low clearances, overhanging trees, children at play to discourage regular use. 3. Provide adequate off-street loading spaces for businesses which receive or distribute goods by truck. Delivery trucks should be prevented from blocking the flow of vehicular traffic. Businesses should provide off-street loading spaces. Development of local commercial use policies that provide design standards for proper loading zones, adequate off-street parking and easy access for delivery vehicles as well as emergency service vehicles. 52 CHAPTER 4 REGIONAL TRANSPORTATION NETWORK
57 Corpus Christi Metropolitan Transportation Plan LOCAL RAILROAD GOALS AND OBJECTIVES Working with freight interests and the Nueces and San Patricio Rural Rail Districts the current goals and objectives identified include: 1. Coordinating railway facilities with other transportation modes and adjoining land uses to encourage desirable development patterns. 2. Promote safe and efficient movement of hazardous cargo and general freight within the study area. 3. Coordinate the freight planning process with the Port of Corpus Christi particularly as it relates to the strategic deployment of military cargo and the La Quinta Trade Gateway. The goals lead to specific action items. 1. Identify issues with current rail alignments and identify opportunities to minimize congestion or to provide grade-separated crossings or other improvements between heavily used rail lines and high-volume streets. Improvements including grade-separated crossings are essential to avoid interference of rail activity with the flow of vehicular traffic. The opportunity to reduce delays on critical arterials due to train movements has been identified on US 77 in Odem, SH in Sinton and SH 181 at the La Quinta Trade Gateway. Other opportunities for improvement will be identified in cooperation with the freight community. 2. Provide adequate safety protection at crossing of streets and rail lines where grade separation is not feasible. Where grade separation is not feasible, special efforts should be made to alert motorists of approaching trains. Depending upon rail and motor traffic, the crossing should be protected by crossing gates, flashing lights, or internationally recognized signs. 3. Encourage the development of compatible land uses in areas adjoining rail lines. Industries and heavy commercial activities are generally the land uses which are most compatible with railroad facilities. The Joe Fulton International Trade Corridor is an example of compatible industrial land use being developed to be served by road, rail and ship 4. Facilitate joint development between rail districts. Facilitate the development projects related to the Port of Corpus Christi master rail plan in cooperation with the Nueces and San Patricio County Rail Districts - particularly as it relates to the strategic deployment of military cargo, the Robstown Inland Port of the Americas and the La Quinta Trade Gateway. 5. Work with the Port of Corpus Christi on new industrial corridor development. Support the effort of the Port of Corpus Christi to identify and develop new inland industrial corridors in Nueces and San Patricio to optimize connectivity to road and rail freight critical links. PORT OF CORPUS CHRISTI The Port of Corpus Christi (Port) is located along the southeastern coast of Texas on the Gulf of Mexico approximately 150 miles north of the Mexican border. The Port of Corpus Christi Authority (Authority) CHAPTER 4 REGIONAL TRANSPORTATION NETWORK 53


58 Corpus Christi Metropolitan Transportation Plan operates and maintains the deep-water port along the Gulf of Mexico coast with a channel depth of 45 feet. The channel is approximately 30 miles long and links the City of Corpus Christi with the Gulf of Mexico. The Authority's intermodal port facilities are part of the Port of Corpus Christi complex. The Authority is a navigation district and political subdivision of the State of Texas, having boundaries coterminous with those of Nueces County and San Patricio County, Texas. The Authority being a navigation district and political subdivision of the State of Texas is a separate and distinct entity and operates independently under the direction of a Port Commission as the governing body. The Port Commission is composed of seven commissioners who serve without pay. The Corpus Christi City Council appoints three commissioners, the Nueces County Commissioners Court also appoints three commissioners, and one commissioner is appointed by the San Patricio County Commissioners Court. The executive staff, under the leadership of an Executive Director and a Managing Director, manages the operations of the Authority and assists the Commission in planning for the future. Port Commission efforts are directed toward encouraging industrial expansion, attracting new cargo, building and maintaining public terminals, setting operational policy, and cooperating with the Federal Government as a local sponsor in maintaining and further improving vital navigation channels. The Authority owns seven general cargo docks, twelve liquid bulk (petroleum) cargo docks, two bulk material docks, layberthing areas, two bagging facilities, a shipside grain elevator, cotton warehouses, 43 miles of railroad, and a multi-use conference center. Authority owned facilities are operated for hire on a first-come, first-serve basis, with the exception of the shipside grain elevator, layberthing areas and cotton warehouses, which are leased to individual users. There are also 27 privately owned docks at the Port of Corpus Christi, with several new docks under development. Private Docks are owned and operated by the various refineries, chemical plants and other industries located along the channel system. Private dock operators generally pay a rental fee under a franchise agreement with the Authority to move cargo across the bulkhead line and access the Authority s Cargo vessel being guided into the Port ship channels. The Port is serviced by three 54 CHAPTER 4 REGIONAL TRANSPORTATION NETWORK

59 Corpus Christi Metropolitan Transportation Plan Class I railroads, the Union Pacific, Kansas City Southern, and BNSF, which provides intermodal transportation links for cargo throughout the United States and Mexico. The Authority continues to remain a primary driver of the local economy and the Port currently ranks as the fifth largest in the United States in terms of tonnage; with nearly 89.5 million tons of cargo moved in Cargo tonnage is expected to continue to rise over the next several years. Map 4.5: Port of Corpus Christi The Authority has served the local economy for over eighty years, and is continually upgrading and expanding Port facilities to better serve industry and shippers in Texas, the United States and worldwide. The Authority also fosters a Safety First approach to operations and maintains an award winning Environmental Management System that has been certified by the International Standards Organization (ISO) since Local port industries, as well, have made investments to upgrade and expand their facilities, to improve air and water quality, and improve process efficiencies. Local refineries have made investments that permit them to provide clean burning gasoline during the ozone alert months, a volunteer program that has contributed to the local area maintaining attainment classification with environmental agencies. Economic development means attracting industrial and commercial activity, private capital and waterborne cargo shipments that will create employment opportunities, sustain and upgrade existing jobs, introduce new basic dollars to the area and broaden the tax base that supports public services. An economic impact study completed in 1994 showed that the Port of Corpus Christi created 30,927 jobs, generated $66.6 million in state and local taxes and provided $1 billion in business revenue. Updated economic reports in 2003 and 2008 show a steady increase in economic impact for the region. In 2003 the Authority created 39,905 jobs and 40,560 jobs were created by In 2012 Martin Associates of CHAPTER 4 REGIONAL TRANSPORTATION NETWORK 55
60 Corpus Christi Metropolitan Transportation Plan Lancaster, Pennsylvania completed an updated study of the economic impact of the Authority operations, and findings continue to reinforce the Port s mission statement as being an economic catalyst for the region. In 2013 the Authority created approximately 66,502 jobs with 13,746 direct jobs generated from marine cargo and vessel activity. The Authority generates an additional 16,767 induced jobs that are the result of purchases by the direct job holders. The remainder of total jobs is comprised of 15,607 indirect jobs supported by the purchases made by businesses supplying services to, or are otherwise dependent upon, the Authority. The 66,502 jobs provide $4.0 billion in income (direct, induced, and indirect salaries) for families throughout the Coastal Bend area. Authority operations generate $13.1 billion in revenue for businesses providing services to the Authority and port industries. More than $314.9 million was paid in state and local taxes in 2011, due to activity created by the Authority. The Authority remains an economic force via its ability to provide the commercial shippers with first class channels, docks and facilities for handling cargo, and by providing public facilities designed to attract more tourist dollars to the area while maintaining financial stability. Ultimately, the goal of the Authority is to raise the standard of living and enhance the quality of life in the communities of the Coastal Bend region. ACTIONS TO DATE To meet the Authority s expanding role of providing increased levels of service to national and international commerce, the Authority, in cooperation with the Metropolitan Planning Organization (MPO), has identified the following goals: 1. Promote and encourage the expansion and diversification of services and cargo throughput by development of infrastructure to meet current and anticipated customer needs including: the deepening, widening, and extension of selected reaches of the Corpus Christi Ship Channel and the La Quinta Channel; improvements to road and rail access to increase intermodal transfer of cargo; and ongoing development of docks, waterside infrastructure, and support infrastructure to expanding and improve water-born commerce. 2. Actively pursue the establishment of intermodal terminal facilities and development in and around at the La Quinta Trade Gateway Terminal property and the La Quinta Channel. 3. Encourage establishment of new industries in and around the Port of Corpus Christi to increase cargo throughput and related economic activity in the region. These goals have led to action items that have been established and implemented for both short and long term improvements that will increase and enhance cargo handling capabilities and transfer operations at the port. Action 1: Provide better road access for expeditious handling of cargo. The Joe Fulton International Trade Corridor is located on the north side of the ship channel and runs parallel to the inner harbor. The corridor encompasses an 11.5-mile road and rail project that has significantly improved access to more than 2,000 acres of land along the north side of the channel for existing and future development; approximately 1,000 acres of this land has use as marine terminals or industrial sites with channel access. The corridor generates economic development opportunities for South Texas and connects two major highway components, US Highway 181 and Interstate Highway 37, establishing efficient intermodal links between highway, marine, and rail transportation systems. Phase I of the 56 CHAPTER 4 REGIONAL TRANSPORTATION NETWORK
61 Corpus Christi Metropolitan Transportation Plan road was completed in 2007 and phase was completed in In 2014 the Authority completed the La Quinta Terminal road; approximately two miles of two-lane road providing access along the west side of the 1,100 acres of land at the La Quinta Gateway terminal property from State Highway 181. Future projects will expand the La Quinta Terminal Road to four lanes and improve access to the east side of the property. In 2014, Texas Department of Transportation (TxDOT) started work on a ramp-reversal project that will improve access from State Highway 35 to the planned road on the east side of the La Quinta Gateway Terminal Property. The Authority maintains and inspection and maintenance program to maintain repair and upgrade roads serving various areas of the Port. Where necessary, road work is coordinated with The City of Corpus Christi and other communities, Nueces and San Patricio Counties, and the TxDOT. Action 2: Improve intermodal cargo storage facilities at the port. The Authority has completed several expansion, renovation and modernization projects at both the existing Southside and the Northside Intermodal Terminals. These projects have increased the available storage area by 21 acres. In 2011, the authority acquired ten additional acres of land on the North Side of the ship channel and in 2014 improved 4.4 acres of this land to provide additional cargo storage. Improvement of the remaining 5.5 acres is pending final design and construction of the Harbor Bridge replacement. The Authority acquired approximately 1,100 acres of land at the end of the La Quinta Channel and has completed preliminary designs and has initiated the final design for a multipurpose dock and general cargo storage and transit facility at this location. Action 3: Improve and upgrade the Port Railroad system to support intermodal cargo handling. In 1999, the Authority completed the construction of a loop rail track at the bulk terminal for loading and unloading of unit trains. This system allows a continuous flow of rail cars past the discharge or loading point without the need to reverse the direction of travel. The Authority in partnership with the State of Texas has enhanced the Southside with improved rail infrastructure. The project doubled the Authority s capacity to handle military unit-trains of equipment from Fort Hood, Fort Bliss, and other bases in Texas and the Midwest. The upgraded rail also serves in an equally valuable economic role in supporting the trans-loading of commercial, industrial, or agriculture products moving through South Texas. In 2009, the Authority purchased acres of land on the north side of the Corpus Christi Ship Channel for the planning, design and construction of the Nueces River Rail Interchange Yard. Construction on the first phase of the rail yard was started in 2014 with funding from the Authority, the three Class I Railroads that serve the Port, and a federal Transportation Investment Generating Economic Recovery (TIGER) grant. Phase I will provide a 7,800 ft. long unit train siding and a rail interchange yard with 4 parallel ladder tracks for a total of 15,400 CHAPTER 4 REGIONAL TRANSPORTATION NETWORK 57

62 Corpus Christi Metropolitan Transportation Plan feet of track with storage capacity for up to 223 rail cars. Design is complete and funding through the Authority and a TxDOT grant has been identified for a second phase to provide 8 unit train sidings and additional rail car handling and storage capacity. In 2012 the Authority completed a Rail Master Plan in response to increasing demand for rail access and railroad transportation for freight both into, and out of, the Port. The Rail Master plan identifies 15 railroad projects that will respond to increasing, and changing rail needs, improve efficiency of in-coming and out-going cargo, and improve public safety by reducing rail traffic within local communities. Action 4: Improve ship access. The existing Harbor Bridge provides a 138-foot clearance. Most new generation ships and many existing ships need a minimum clearance of 175 to 185 feet. The Authority is coordinating with TxDOT on the construction of a new Harbor Bridge that will have a vertical clearance of 205 feet, which matches the vertical clearance at the Panama Canal. The Authority will provide right-of-way through Port property and contribute funds to the construction of the new bridge. Construction of the new Harbor Bridge is expected to start in 2015 and will take 4 to 5 years to complete. In 2009, the U.S. Army Corps of Engineers (COE) awarded the first construction contract associated with the extension of the La Quinta Ship Channel. This contract was for $1.1 million and constructed a 126-acre dredge material placement area for containment of sands and clay excavated to create the La Quinta Channel extension. In 2011 the COE awarded two additional construction contracts, one for $33.5 million to dredge the extension of the La Quinta Ship Channel and another for $7.6 million to construct an ecosystem restoration project consisting of a rock breakwater and revetment adjacent to the La Quinta Channel near Ingleside-on-the-Bay, Texas. The ecosystem restoration project was completed in 2012 and the channel extension was completed in late In 2014 additional work to deepen the La Quinta channel from 39 to 45 feet was funded, and completed, by the Authority. In 2014, design work was also started on additional mitigation measures related to water front construction at La Quinta. The remediation work will enhance the existing La Quinta ecosystem restoration project by planting native sea and tidal grasses. Action 5: Encourage and support industry location at and near the Port With completion of the Joe Fulton International Trade Corridor, extension and deepening of the La Quinta Ship Channel, and improved road and rail access, the Authority is actively pursuing industrial operations to locate near the port and intermodal transfer facilities. In mid-2013, the Authority secured an anchor tenant on a major portion of the La Quinta voestalpine HBI Plant Gateway Terminal property with the signing of a lease agreement with Austrian steelmaker, voestalpine Texas Holdings, LLC, for approximately 475 acres. Construction started in 2014 on first phase of a HBI (hot briquetted 58 CHAPTER 4 REGIONAL TRANSPORTATION NETWORK

, a subsidiary of Cheniere Energy, is developing a liquefied natural gas (LNG) export terminal on private land adjacent to the Authority s La Quinta Property and")

63 Corpus Christi Metropolitan Transportation Plan iron) and DRI (direct reduced iron) plant with a designed annual capacity of around two million tons. The initial phase of development includes the construction of a 1000 foot bulk dock along the La Quinta Ship Channel. Voestalpine s initial investment is approximately $700 million, and once operational the plant will staff around 150 employees. Initial operation is planned for Corpus Christi Liquefaction, LLC (CCL), a subsidiary of Cheniere Energy, is developing a liquefied natural gas (LNG) export terminal on private land adjacent to the Authority s La Quinta Property and Ship Channel. The proposed liquefaction project is being designed for three trains capable of producing in aggregate up to 13.5 million tonnes per annum (mtpa) and local dock facilities for export. CCL LNG Plant TPCO America Corporation is developing a highquality seamless steel pipe manufacturing facility near Gregory, Texas, which represents the largest single investment by a Chinese company in a US manufacturing facility. This $1 billion development is planned to produce 500,000 metric tons of pipe annually. Operational logistics for the plant will be TPCO Pipe Plant enhanced by proximity to planned cargo handling facilities and docks at the Authority s La Quinta Gateway Terminal. M&G Chemicals, a family owned chemical engineering and manufacturing company headquartered in Tortona, Italy, is developing a petro-chemical plant on private property north of the Corpus Christi Ship Channel and has entered into an agreement with the Authority to jointly build a petroleum dock to support the plant operations. With an initial investment of $1 billion, M&G Plastics Resin Plant the new facility will be the largest manufacturing facility of PET and PTA plastic resins in the world; producing on million metric tons per year. Castleton Commodities International, LLC has leased land from the Authority on the north side of the inner harbor and plans to construct a condensate splitter complex and associated docking facilities. OXY Chem and Oxy Ingleside Energy Center, subsidiaries of Occidental Petroleum Corporation are expanding operations at their respective Ingleside operations on lands acquired from the Authority and adjacent to the La Quinta Ship Channel and the Corpus Christi Ship Channel. The Texas Fuels and Asphalt Company, LLC and Plains All American Pipeline, L.P. have both acquired private properties on the south side of the Authority s inner harbor for petroleum related development and both companies have requested Franchise agreements to move CHAPTER 4 REGIONAL TRANSPORTATION NETWORK 59

64 Corpus Christi Metropolitan Transportation Plan water-born cargo through the Port. Flint Hills Resources, Lyondell chemicals, Martin Midstream Partners L.P., Magellan Pipeline, L.P., Nustar Energy L.P., and Trafigura Terminals, LLC have, or are planning to, expand current operations located on or near the Authority s inner harbor. Superior Weighting Products LLC is developing a new barite processing facility at the Authority s Rincon Industrial Park. Excalibar Minerals and Eagle Materials have expanded existing dry-bulk mineral operations along the inner harbor. Action 6: Plan for future expansion and growth of the Port In 2013, the Authority completed a Strategic Plan to guide development and expansion through the year In 2014, the Authority initiated an Organizational Study to ensure that staffing and the administrative organization is in place to support current and long term growth. MAP 4.6: New and Planned Development at the Port of Corpus Christi MAJOR INITIATIVES In addition to the specific actions described previously, the Authority develops and maintains key initiatives to create sustainable growth and maintain operations at the Port. Key initiatives are presented in the following sections. Cargo Diversification The growth of the Authority s cargo tonnage is focused on cargo diversification efforts. The Authority continues an aggressive marketing effort identifying new business opportunities and seeking new markets. The Business Development team continues efforts to meet with freight forwarders, shipping 60 CHAPTER 4 REGIONAL TRANSPORTATION NETWORK
65 Corpus Christi Metropolitan Transportation Plan agents and shipping lines in pursuit of this directive. As a result, raw and finished steel products are arriving at the Port. In addition, presentations on the Liner Service project to exporters/importers domiciled in a 400 mile radius of the authority were received with positive response. Bulk cargoes such as sand and ceramic proppants have also increased. The South Texas Alliance for Regional Trade (START) continues to be an important marketing resource for the Authority. START is a cooperative effort among three Texas Ports formed to strengthen the region s response to logistics and transportation needs, the driving forces of our diverse economy. The Alliance is anchored by Port San Antonio to the north, Port Corpus Christi on the waters of the Gulf of Mexico, and Port Laredo located on the U.S. Mexico border. Our Ports have long-standing business relationships, bolstering the efforts and resources of our region. The Authority also seeks strategic alliances with other ports and organizations to foster international trade and utilization of the Port. The Port of Corpus Christi was the first U.S. port to sign a trade agreement with ALIMPORT, the government-purchasing agency for Cuba. The Authority also signed Memorandums of Understanding (MOUs) with Meridian 100⁰ FTZ Columbia, Nuevo León, Mexico, and Columbia s Palermo Port Society. These MOUs will promote the flow of goods and facilitate better use of existing multimodal transportation systems between Latin America and the United States. Military Cargo and Layberths The Port of Corpus Christi is designated as a U.S. strategic military seaport and has handled several military exercises, deployment, and redeployment projects. Overall, the Authority through a coordinated effort with MARAD, the 1192nd and the 1395 th Transportation Terminal Brigades, and the U.S. Coast Guard, have handled just over 100 ships with an economic impact of approximately $1.2 million per vessel to the local region. During recent military activities overseas, the Authority was the top port for military load outs amongst U.S. ports. Also, the Authority was designated as the lay-berth site for the USNS Benavidez and a second layberth facility was completed near the former Tule Lake Lift Bridge. La Quinta Trade Gateway Project In early 2011, in conjunction with the planned extension of the La Quinta Ship Channel, the Authority completed preliminary engineering studies for the phased construction of a multi-purpose cargo dock and associated general cargo yard at the La Quinta property, an access road has been constructed, and water and power utilities extended to service the area. The envisioned multi-purpose dock and terminal facility will be able to handle a wide variety of general cargo such as containers, military equipment, wind turbines and steel pipe. Preliminary engineering has been completed for the initial phase of work, which includes a 1000 foot multi-purpose general cargo dock and a 15 acre cargo yard, with final design scheduled for completion in The authority has submitted this project for a Federal TIGER Grant and has committed the matching funds necessary to complete construction. Future phases will expand the general Cargo Yard and add Containerized Cargo capability to both the dock and cargo yard. Wind Power Wind power currently generates 62,000 megawatts (MW) nationwide with over 45,000 turbines installed across 39 states with the ability to power 15 million US homes. The Port of Corpus Christi has become an essential transportation link for this renewable industry since The support role for this industry has further expanded by loading vessels in Corpus Christi with components destined for manufacturing CHAPTER 4 REGIONAL TRANSPORTATION NETWORK 61
66 Corpus Christi Metropolitan Transportation Plan facilities in Europe. As the Port forms part of the logistics chain for this renewable industry, a major task is to provide optimum facilities and staging areas to major wind manufacturers worldwide. The Authority s access to docks, highway systems and rail offer the necessary transportation modes with assurances of on-time deliveries to job sites. The US has over 116,000 MW of wind capacity in development, with wind-rich Texas leading the nation with nearly 13,000 MW of installed capacity and over 7,000 MW of wind capacity in advanced development or under construction at the end of Channel Improvement Project The U.S. Congress authorized the U.S. Army Corps of Engineers (Corps) to begin investigating the possibility of deepening the Corpus Christi Ship Channel from 45 feet to 52 feet in order to accommodate larger vessels, increase shipping efficiency, and enhance navigation safety. In 2003, the Authority completed the feasibility phase of the Channel Improvement Project and in November 2007, the project was authorized by Congress in the Water Resources Development Act (WRDA) of 2007, and reauthorized in WRDA The authorized project includes the following navigation and ecosystem restoration features: (1) deepening the Corpus Christi Ship Channel from 45 to 52 feet, (2) adding 200-foot barge shelves across Corpus Christi Bay, (3) widening the ship channel to 530 feet from Port Aransas to the Harbor Bridge, (4) constructing ecosystem restoration features to protect endangered species, wetlands and sea grass. Channel improvements will cost approximately $200 million. The improvement project, in addition to creating a safer, more efficient channel for navigation, will produce positive socioeconomic impacts to the region. The project has a high benefit-to-cost ratio with a projected average of about $25 million per year in transportation cost savings over the next 50 years. Benefits may also include increased employment and revenue for the Authority and industry throughout the region. The Authority also owns and manages Dredge Material Placement Areas to support future channel maintenance and improvements. Environmental Management System Through the Authority s Environmental Management System (EMS), the Authority has remained proactive in its efforts to not only promote economic growth but at the same time be good stewards of the environment in its daily operations. As of 2014, the Authority s program is in its seventh year of ISO certification and its ninth year of implementation. Each year, the program undergoes a detailed external audit to maintain its ISO certification. The EMS program is driven by a team of Authority employees from the various operational areas with the full support of management. During the past nine years, the program has identified numerous significant aspects impacting the environment such as spills, electrical consumption, storm water runoff, water consumption and air emissions. In 2013, the Authority had reduced reportable spills by 75 percent over 2008, purchased 10% of electrical power from green energy sources, and reduced total water consumption by 3 million gallons. Rail Improvements Rail movement of cargo by rail at the Port has doubled from levels prior to 2007; guided by the 2012 Railroad Master Plan, the Authority continues to upgrade, expand and improve rail services to, from, and within the Port. Phase II of the Nueces River Rail yard project is designed, funded and scheduled for construction in Phase II will extend four of the tracks constructed under Phase I to full unit train 62 CHAPTER 4 REGIONAL TRANSPORTATION NETWORK

67 Corpus Christi Metropolitan Transportation Plan sidings and construct four additional unit train sidings. Total cost of Phase II is approximately $28 million, with $22 million in funding from a TxDOT grant. In addition designs are being developed for extending rail service to the La Quinta Terminal area and routing rail traffic around the community of Gregory, Texas. Work to upgrade and maintain rail within the Port is ongoing with the goal of increasing the efficiency and safety of moving cargo by rail. MAP 4.7: Railroad Master Plan Eagle Ford Shale The Eagle Ford Shale (EFS) Play in South Texas continues to be a major economic stimulator for the Region, State and the Nation. By the end of 2013, EFS supported over 116,000 jobs in the region with over $61 billion in economic impact. Eagle Ford Shale is estimated to create over 127,000 jobs with $89 billion in economic impact by The Port Authority has played a vital role as the logistical and distribution center for cargoes used in drilling, hydraulic fracturing, and pipeline placement. Proximity of the Port to the Gulf Coast with a deep draft provides an ideal location for oil and gas companies looking to create transloading hubs to export refined products or transfer crude oil and condensate to other refineries throughout the U.S. The Port also provides a point of import for dry bulk commodities like barite and sand for drilling and fracturing. The Authority continues to invest in new rail and dock infrastructure to support the current needs and continued growth potential related to development of the Eagle Ford Shale. Dock Infrastructure With the increased import of barites and sand at the Bulk terminal, the Authority is moving forward with plans upgrades that will facilitate more reliable and environmental sound methods to move bulk materials. The gantry crane on Bulk Dock 1 is being outfitted with new DC drives, a PLC (programmable logic controller), and travel motors. At Bulk Dock 2, conveyor covers are being upgraded to full covers over the conveyor belts. Within the bulk terminal area, the Authority is working with costumers and tenants to improve bulk pad storage areas, roads, and storm water drainage to improve cargo operations and limit fugitive dust and storm water emissions. CHAPTER 4 REGIONAL TRANSPORTATION NETWORK 63

68 Corpus Christi Metropolitan Transportation Plan To meet the increasing demand for liquid bulk, bulk, and general cargo dock space, the Authority is repairing, upgrading, and expanding existing dock structures as well as planning, designing, and permitting new docks for construction within the inner harbor. The Authority also supports the upgrade of existing, and construction of new, private dock facilities. Currently planned public and private dock projects will increase the overall cargo capacity of the Port and reduce wait times for ships calling at the port to load or unload cargo. The Figure, presented below, show both public and private dock projects that have been recently completed, are under construction, or are in planning and design stages. Support Infrastructure In addition to docks, railroads, and storage yards the Authority is evaluating, planning, and implementing projects to maintain, repair, upgrade, and/or replace support infrastructure such as offices, maintenance facilities, security and communications systems, and utilities in order to support the ongoing growth and development of the port as the major intermodal transportation hub for the region. Funding The Authority is actively pursuing alternative funding to meet the major capital requirements necessary to meet the increasing demands for maintenance, upgrade and replacement of existing facilities and infrastructure and development, design, permitting, construction and operation of new facilities and MAP Dock Improvement and Construction Projects infrastructure. In addition to using Port Revenue streams, the Authority actively pursues federal grants, such as TIGER grants through the department of Transportation and Security Grants through the Department of Home Land Security; and state grants through the Texas Ports Capital Program. The Authority also seeks opportunities to negotiate cost sharing agreements with port tenants and users that 64 CHAPTER 4 REGIONAL TRANSPORTATION NETWORK
69 Corpus Christi Metropolitan Transportation Plan will directly benefit from specific projects and developments. In addition, the Authority is evaluating the potential benefit of bond issues to provide ready capital that can be utilized to meet the most urgent infrastructure needs in a shorter time frame. RECREATION TRAVEL AND TOURISM Tourism continues to be a mainstay of the Corpus Christi economy. According to the Texas Office of the Governor, the Padre Island National Seashore, Texas State Aquarium and USS Lexington are among top attractions in Texas. The most popular activities among visitors to Corpus Christi remained to be related to nature, including the area s beaches and waterfront (46%), and national and state parks (7%). These nature-related activities together accounted for 53 percent of local tourist activities in 2013, as compared to 13 percent for Texas as a whole. Despite the sheer size of this sector, official statistics about its economic significance are absence. The board scope and integrative nature of tourism make it less straightforward to provide quantitative assessments, particularly at a regional level. The updated report by Professor Lee, of Texas A&M Corpus Christi, titled The Economic Significance of Tourism and Nature Tourism in Corpus Christi was published in It provides an update to previous studies on tourism in the Corpus Christi metropolitan area. This study quantitatively estimates the extent to which Corpus Christi visitors contribute to the region s economic activity, household income and employment. Corpus Christi remains the sixth most popular tourist destination in Texas. Corpus Christi continues to have a high concentration of family vacationers. An estimated total of 8.1 million visitors spent over 19 million days in the area in , injecting over $1.2 billion into the Corpus Christi economy. Nearly 5 percent of the area s economic activity comes from the core tourism industries. In addition to the area s hotels, motels and other lodging establishments, substantial portions of restaurants, food stores, retail businesses, public and recreational facilities, and transportation services are closely tied to visitors activities in Corpus Christi. More than 17,000 local jobs are directly related to tourism, making this sector the second largest private employer in Corpus Christi. Direct visitor spending contributes the greatest number of jobs to eating and drinking establishments (7,520 jobs), followed by hotels and other accommodations (3,071 jobs). Employment in the tourism sector has increased by 4,052 jobs since 2008, and it is projected to grow steadily based on past growth rate. The estimated total annual economic impact of tourism on Corpus Christi is $1.2 billion. Visitors total spending of $675 million in the area generates secondary or ripple effects, which total $899 million. The total volume of business activity directly or indirectly related to tourism supports nearly 29,000 jobs, $350 million in household earnings, and $102.8 million in state and local taxes. A significant share of tourist activities in Corpus Christi is related to nature and wildlife with nature tourism accounting for nearly 47 percent of all visitor-trips. CHAPTER 4 REGIONAL TRANSPORTATION NETWORK 65
70 Corpus Christi Metropolitan Transportation Plan GOALS AND OBJECTIVES The goals and objectives adopted by the MPO to support the transportation needs of the recreational travel and tourism industry include: Improving access to MPO area attractions. Increase collaboration with public and private sector decision-makers to improve and establish intermodal connections for recreational travel needs. Promote cooperation among regional, state, and local interest groups to integrate land use and transportation for providing attractive tourism environment. Adopt and promote environmental friendly design standards for roadways, bikeways, and walkways. Specific actions and plans that support the above goals include: 1. The MPO area s geographical location near the Gulf of Mexico water provides a natural habitat for local and migrating birds which attracts bird watchers from everywhere. Several improvements have been made to capture the opportunities in support of these eco-tourism activities such as the US 181 parallel access road and parking at the bird viewing areas at Sunset Lake Park, the water level access road on Park Road 22 on the Laguna Madre, and the planned improvement to Park Road 22 to allow fresh water exchange for the developed boat channel community. 2. In cooperation with the City of Corpus Christi the MPO developed a pedestrian and bicycle plan that facilitated the improvement and connectivity of hike and bike trails for visitors to use bikes and walk safely between various tourist attractions. Working with the Downtown Management District and Pollution Prevention Partnership a bicycle rack plan was implemented in the downtown area. The MPO and the CCRTA have supported purchase of all buses to include bicycle racks. Connecting Intermodal facilities and links across and between modes of transportation, such as bikeways and hiking trails will improve accessibility and efficient movement of both motorized and non-motorized traffic. 3. The MPO has supported and participated with facilitation by the US Fish and Wildlife Dept., in the creation of a public education effort on developing the Oso Creek as a series of interconnected parks. 4. The MPO will be supporting the efforts of the City of Corpus Christi to utilize potential program funding from the Transportation Enhancements program, Bicycle Transportation and Pedestrian Walkways (NHS), Recreational Trails Program, National Scenic Byways Program, Parkways and Park Roads Program, and Transportation and Community and System Preservation Program funds. ATTRACTIONS The following are some areas of interest for recreation and tourism in the MPO area: Texas State Aquarium: The Texas State Aquarium offers education and entertaining programming, with interactive exhibits. The Texas State Aquarium promotes and practices environmental conservation and 66 CHAPTER 4 REGIONAL TRANSPORTATION NETWORK
71 Corpus Christi Metropolitan Transportation Plan wildlife rehabilitation. Located on Corpus Christi Beach, and CCRTA water taxi stop, the Texas State Aquarium has welcomed over 6.5 million visitors since USS Lexington Museum on the Bay: The USS Lexington or "The Blue Ghost" is the most famous World War II aircraft carrier in U.S. Naval history. The ship is open to the public and provides tours, flight simulator, overnight camping, mess deck café and a 3D MEGA Theater. Sports Entertainment Arts (SEA) District: The SEA District is a multi-destination complex of public and private venues. It includes Concrete Street Amphitheatre, Whataburger Field home of the Hooks AA baseball team, Hurricane Alley a growing water park, the Museum of Science and History, the Oriental Museum, the Art Museum of South Texas, Heritage Park, Ortiz International Center, Selena Auditorium, American Bank Center Arena and Convention Center. Corpus Christi Botanical Garden: The South Texas Botanical Gardens & Nature Center is one of the region s five major visitor attractions. The 180-acre site is an integral part of the city s growing Oso Creek Greenbelt system, is a Texas Watchable Wildlife Program site, and is on the Great Texas Coastal Birding Trail. It also is recognized as one of the key birding sites in Corpus Christi, which has been named the Birdiest City in the United States. Padre Island National Seashore: Padre Island, a 110-mile long, sand barrier island that stretches from Corpus Christi to Port Isabel, is developed at both ends with resorts, restaurants, and other businesses. But in between, Padre Island National Seashore preserves an unblemished 70-mile portion of the island, from Corpus Christi south to Mansfield Channel. The remote, natural beaches and lands of this national park offer opportunities for fishing, swimming, boating, windsurfing, kayaking, and camping under starry skies. Padre Island National Seashore protects the longest stretch of undeveloped barrier island left in the world and provides a place to escape from the frantic pace and flood of lights of the modern world. Mustang Island State Park: Mustang Island is just east of the city of Corpus Christi with five miles of open beach. One of the most popular family beaches in Texas, facilities near the park include campsites with water and electricity, primitive beach sites, shaded picnic areas, restrooms and showers. Highlights of Corpus Christi Tourism: saw 8.1 million visitors (person trips to the metro area) Over 19 million visitor-days (average 2.04 days per trip) Average party size of % visitors go to beaches/waterfront, 27% dining, 13% sightseeing, and 13% fishing Spending: Over $1.2 billion in total visitor destination spending $116.6 per visitor per day -- spending by category: restaurants & bars (25%), lodging (23%), local transportation, (17%), shopping (14%), recreation & entertainment (10%) Visitors account for 81% of sales in local hotels, 60% airport activity, 55% car rentals, 26% local transportation, 25% recreation, and 22% restaurants & bars CHAPTER 4 REGIONAL TRANSPORTATION NETWORK 67
72 Corpus Christi Metropolitan Transportation Plan Economic Impacts: $675 million in value added (output) - $350 million in wages & salaries 17, 051 jobs $31.8 million in local taxes, $71 million in state taxes Nature Tourism: Largest component of visitor activities - 47% of local visitor trips are nature based Opportunities for fishing and hunting abound throughout the state. CORPUS CHRISTI INTERNATIONAL AIRPORT Corpus Christi International Airport (CCIA) serves not only the Corpus Christi Metropolitan area, but also the Coastal Bend region. The community is currently served by three airlines: American Airlines, United Airlines and Southwest Airlines. These three airlines operate an average of 40 flights a day and carry about 660,000 people to and from CCIA each year. The terminal currently has 6 gates and recently underwent a renovation and expansion of the Federal Inspection Services (FIS) area. CCIA is currently undergoing a massive runway safety and taxi reconfiguration project that is being funded mostly by the Federal Aviation Administration (FAA). The United States Coast Guard will soon call CCIA home when the Sector Headquarters project is completed in spring of CCIA also plays a supportive role in the United States Navy s Training mission in South Texas. The Navy represents 60% of the 100,000 air operations recorded at CCIA each year. CCIA has its own Public Safety Department staffed with officers who are cross trained in police, fire and EMS. CCIA plays host to an annual Aircraft Rescue Fire Fighting Academy on airport property that includes two weeks of both classroom and hands on training. Firefighters and Public Safety Officers from around the area take part in live burns using a Mobile Aircraft Fire Training Unit courtesy of Naval Air Station Corpus Christi. CCIA has completed a number of projects in the past couple of years that are designed to maximize efficiencies in maintenance, operations and public safety, as well as to generate non-aeronautical revenue to help sustain the airport in to the future. MAJOR PROJECTS Runway Safety and Taxiway Reconfiguration In July 2014, the city of Corpus Christi issued a notice to proceed on the last phase of the runway project. This last phase will extend runway 13/31 by 1,000 feet, changing the total declared distance from 7,500 feet to 8,500 feet. The work on runway 18/36 (previously 17/35) was completed in early summer 2014 and included an extension of 600 feet, which gives the crosswind runway a new declared distance of 6,680 feet. Both phases of the construction also included a redesign of the taxi-way system. The 50 million dollar project should be completed by late summer United States Coast Guard Sector Headquarters With an anticipated completion time of spring 2015, the new US Coast Guard facility will include office and support space, mission critical command facilities, data center, berthing areas for ready crews, and other amenities such as food service and a fitness center. The US Coast Guard hangar will house a new fleet of search and rescue aircraft and the facility will be home base for several hundred employees. The building is going up on 9.5 acres of land and will give the USCG quick access to CCIA runways. 68 CHAPTER 4 REGIONAL TRANSPORTATION NETWORK
73 Corpus Christi Metropolitan Transportation Plan Federal Inspection Services (FIS) The FAA agreed to fund 95% of a renovation and expansion project for CCIA s FIS. This area of the terminal is designed especially for use by US Customs and Border Protection when an International flights arrives. The project expands CCIA s capacity to receive large planes full of passengers who need to clear Customers quickly and get on their way. Quick Turn Around Facility (QTA) The new QTA facility is a consolidated office and maintenance headquarters for the rental car companies that do business at CCIA. The QTA is complete with fueling stations, car washes and maintenance areas that are necessary to keep these fleets of vehicles on the road. The QTA is being funded by a customer facility charge (CFC) that is assessed to rental customers. This project was completed in Airfield Equipment and Maintenance Facility Funded 95% by the FAA, a new 10,000 square foot maintenance facility was completed in late This facility has 3 vehicle bays, a deep mechanic pit for easy access to needed repairs, 6.5 ton engine hoist, and two 2,000 gallon above ground fuel tanks. This facility helped work crews create much needed efficiencies in the maintenance, repair and storage of airfield, landscaping, public safety and firefighting vehicles. AIRPORT COMMERICAL DEVELOPMENT FedEx Ground Development In 2011, a private developer completed construction on a 45,000 square foot facility for FedEx Ground. The facility was built on 80 acres of city owned, airport property, making FedEx Ground the first business to locate in the airport s International Business Center. The Corpus Christi Regional Economic Development Corporation works actively to promote available sites at CCIA for commercial development. The CCIA staff is working to generate interest in both aeronautical and non-aeronautical development on airport property. Airport property that is available for development is divided into four zones: Development Zone 1 - Approximately eleven acres with frontage along State Highway 44. Close proximity to utilities. Corner lot at intersection of SH 44 and International Drive suitable for development of hotel or other commercial business. A portion of this property is located close to the runway and taxiway system making it ideal for aeronautical use. Development Zones 2 & 3 - Approximately fifty acres with frontage along State Highway 44. Close proximity to utilities and quick access to main entrance road (International Drive) and SH 44. Zone 2 is appropriate for the development of business parks and light industrial manufacturing facilities. The western acreage has rapid access to the taxiway system and Runway 13/31. Development Zone 4 - Over 125 acres at midfield. A Parallel Runway (10,000' x 150') is included in the airport's Master Plan which will accommodate large cargo aircraft. This property is suitable for the development of air and highway intermodal transportation facilities. CHAPTER 4 REGIONAL TRANSPORTATION NETWORK 69

74 Corpus Christi Metropolitan Transportation Plan LONG-RANGE MASTER PLAN The 2007 Airport Master Plan Update proposed capital improvement projects estimated at $76.9 million over a 20-year period. The projects were based on projected long-term and continue growth in aviation activity. CCIA will be updating the Airport Master Plan in 2015 with details about anticipated projects in to the future. Many airport projects will be eligible for FAA funding at 90%. The balance of the costs will be supported by airport operating revenue. American Airlines, United Airlines and Southwest Airlines operate an average of 40 flights a day. 70 CHAPTER 4 REGIONAL TRANSPORTATION NETWORK
75 Corpus Christi Metropolitan Transportation Plan CONGESTION MANAGEMENT CHAPTER 5 INTRODUCTION The Congestion Management Process (CMP) is a way of systematically considering congestion-related issues using a set of technical tools, and basing evaluations on a discrete set of locally determined performance measures. A review of performance of multimodal transportation systems and the identification of strategies that address congestion focus on both the use and operation of facilities and services. What are the requirements of the CMP? A CMP is required in metropolitan areas with a population greater than 200,000 Transportation Management Areas (TMAs). The congestion management process helps the MPO and partner agencies achieve regional operations performance objectives, and a number of collateral benefits. By addressing congestion through a comprehensive process, the CMP provides a framework for responding to congestion and other operational issues in a consistent, coordinated fashion. The required components of a CMP: Transportation planning in a TMA shall address congestion management through a process that provides for safe and effective integrated management and operation of the multimodal transportation system, based on a cooperatively developed and implemented metropolitan-wide strategy, of new and existing transportation facilities eligible for funding under title 23 U.S.C. and title 49 U.S.C. Chapter 53 through the use of travel demand reduction and operational management strategies. Development of a CMP should result in multimodal system performance measures and strategies that can be reflected in the MTP and the TIP. The level of system performance deemed acceptable by State and local transportation officials may vary by type of transportation facility, geographic location and/or time of day. Consideration should be given to strategies that manage demand, reduce single occupant vehicle (SOV) travel, and improve transportation system management and operations. Where the addition of general purpose lanes is determined to be an appropriate congestion management strategy, explicit consideration is to be given to the incorporation of appropriate features into the SOV project to facilitate future demand management strategies and operational improvements that will maintain the functional integrity and safety of those lanes. The congestion management process shall be developed, established, and implemented as part of the metropolitan transportation planning process that includes coordination with transportation system management and operations activities including: CHAPTER 5 CONGESTION MANAGEMENT 71
76 Corpus Christi Metropolitan Transportation Plan A. Methods to monitor and evaluate the performance of the multimodal transportation system, identify the causes of recurring and non-recurring congestion, identify and evaluate alternative strategies, provide information supporting the implementation of actions, and evaluate the effectiveness of implemented actions; B. Definition of congestion management objectives and appropriate performance measures to assess the extent of congestion and support the evaluation of the effectiveness of congestion reduction and mobility enhancement strategies for the movement of people and freight. C. Establishment of a coordinated program for data collection and system performance monitoring to define the extent and duration of congestion, to contribute in determining the causes of congestion, and evaluate the efficiency and effectiveness of implemented actions. D. Identification and evaluation of the anticipated performance and expected benefits of appropriate congestion management strategies that will contribute to the more effective use and improved safety of existing and future transportation systems based on the established performance measures. The following are examples of what should be considered: Demand management measures, growth management, and congestion pricing Traffic operational improvements Public transportation improvements ITS technologies as related to the regional ITS architecture Where necessary, additional system capacity E. Identification of an implementation schedule, implementation responsibilities, and possible funding sources for each strategy proposed for implementation. F. Implementation of a process for periodic assessment of the area s established performance measures. The results of this evaluation shall be provided to decision makers and the public to provide guidance on selection of effective strategies for future implementation. MPO CONGESTION MANAGEMENT PROCESS While the CMP represents the state-of-the-practice in addressing congestion, we are challenged to establish a suitable and valuable method that will respond to our existing planning conditions. The CMP, currently an eight step process (see below), will be outlined and critical elements of its implementation highlighted for our region. 1. Develop Congestion Management Objectives 2. Identify Area of Application 3. Define System or Network of Interest 4. Develop Performance Measures 5. Institute System Performance Monitoring Plan 6. Identify and Evaluate Strategies 7. Implement Selected Strategies and Manage Transportation System 72 CHAPTER 5 CONGESTION MANAGEMENT
77 Corpus Christi Metropolitan Transportation Plan Monitor Strategy Effectiveness Traffic congestion in Corpus Christi is not as much a function of population growth as the function of the increase in single occupant trips. Using census data, the population grew from an estimated 349,164 persons in 2000 to an estimated 387,203 persons in 2010, a growth of approximately one percent each year. During the same time period, the area showed an increase in drive-alone trips. Other changes that factor into our traffic congestion are an increase in the number of vehicles per housing unit, increases in tourism and sprawl development. The MPO s Congestion Management System Work Program (CMSWP) includes all limited access roadways, principal arterials, some minor arterials, and a few collectors within the City of Corpus Christi. As part of the CMSWP, the MPO identified congested segments based on the criteria developed by TxDOT and the citizens perception of congestion. The work program includes approximately 226 locations for traffic volume counts. The MPO s CMP serves as an organized and transparent way for our planning area to identify and manage congestion, connect performance measures to support funding for projects, and evaluate recommended strategies to ensure we are effectively addressing congestion. Development of Congestion Management Objectives The following objectives were derived from the vision and goals in the MTP which covers streets/highways, public transportation, bicycle/pedestrian plan, railroads/trucking, port, and recreational, travel & tourism: SOV Travel: SOV is the predominant mode of travel within the MPO area, which is a major cause of congestion and deteriorating air quality. Action: Ridesharing, carpooling, vanpooling, bicycle, transit service, flexible work hour program, compressed work week, parking management, congestion pricing, traffic signal improvement, intersection improvement, growth management, access management, ITS, advanced transportation management system, commercial operation, freeway incident management system. Traffic Signal Synchronization: Unsynchronized signals contribute to traffic congestion. Drivers experience stops, stop-delays, and longer travel time contributing to increased fuel consumption, congestion, and air pollution. Action: Traffic signal timing improvements. Access Management: Closely spaced driveways and their nearness to intersections on arterial streets hamper traffic movement causing congestion and air pollution. Action: Geometric design, traffic signal improvement, intersection improvement, parking management, growth management (subdivision regulations). Intersections without Right Turn Channelization: Intersections with heavy right turn traffic movements without right turn channelization contribute to congestion during peak hours. Action: Geometric design (lane marking), traffic signal improvement, intersection improvement. One Way Pairs: Absence of one way pairs causes intersection delays, complicates signal timing, and decreases road and pedestrian safety. Action: Traffic signal improvement, intersection improvement. CHAPTER 5 CONGESTION MANAGEMENT 73
78 Corpus Christi Metropolitan Transportation Plan Continuous Left Turn Lanes: Consideration should be given to use raised center medians in lieu of continuous turn lanes in areas of heavy traffic concentration, higher travel speeds, and frequent driveway spacing. Action: Geometric design (raised medians), traffic signal improvement, intersection improvements, parking management, and access management. Land use: Residential areas are developing farther and farther from commercial, educational, recreational, and health facilities. Commercial activities are concentrating along South Padre Island Drive (SPID) between Weber and Airline in Corpus Christi. This type of development is increasing trip distances and discourages transit and bicycle trips. Action: Growth management (mixed-use development, planned unit development). School Zones on Major Arterials: Arterial street system serves major centers of activity of a metropolitan area. These facilities emphasize mobility rather than land accessibility. Low driving speed limits in school zones on major arterials cause traffic delays and congestion. Action: Geometric design, traffic signal improvements, intersection improvements, parking management, access management (designated cross walks). Speed Limit: Higher functional streets not posted with appropriate speed limits result in speeding violations and inefficient traffic flow. Action: Speed limit revision. Traffic Signs: Improper placement or lack of traffic signs at intersections hamper traffic flow. Action: Intersection improvement. Bus Bays: Bus bays play an important part in reducing congestion, whereas absence of bus bays on busy streets adds to congestion. Action: Geometric design. The Regional Transportation Authority (RTA) conducts ongoing studies to add more bus bays where justified. Transit Service: Enhanced travel and headway times in the MPO area will mitigate congestion and improve air quality. Action: Direct transit between activity centers and residential areas; growth management. Walkways: Some walkways originating in the residential area do not provide a continuous link to schools, businesses, and recreational facilities. Walkways that are not properly maintained and lack Americans with Disabilities Act (ADA) accessibility ramps discourage potential users. Action: Walkways, traffic signal improvements, intersection improvements, growth management, and access management. Bikeways: Street and off street bicycle facilities are necessary as an alternative mode of transportation to alleviate congestion and enhance air quality. The City of Corpus Christi has formed a Bicycle Advisory Subcommittee to work on a Master Bicycle Plan for bicycle routes. Action: Bicycle routes; traffic signal improvements, intersection improvements, growth management, and access management. Intermodal Transfer Locations: The MPO area does not have a designated passenger or freight intermodal facility where all the intercity or intracity traffic could make transfers. Action: Intermodal facilities for passengers and freight, transit service improvements, and parking management; intermodal connectors. 74 CHAPTER 5 CONGESTION MANAGEMENT
79 Corpus Christi Metropolitan Transportation Plan Define System of Network of Interest The network characteristics of surface transportation indicate that in spite of our water front presence on the city s eastern border, land is readily available. As a regional hub, development in our region continues to grow. Commuting to work data show how our numbers compare to the Texas statewide results: TABLE 5.1: COMMUTING TO WORK MODE TO WORK AREA PERCENT STATEWIDE PRECENT Drove Alone Car Pooled Public Transit 1 2 Walked 1 2 Other Means 2 2 Worked at Home 2 3 The economic character of the community and region continue to have the existing infrastructure. The Port of Corpus Christi Authority (POCCA), which has served our community for over eighty years, remains a primary catalyst in our economy. Continuous upgrades and expansion efforts to port property are expected to support anticipated increases in cargo tonnage thus creating jobs and income (direct, induced, and indirect) for residents in the Coastal Bend area. Local governmental entities continue to develop and build Highway 77 up to Interstate standards. Other POCCA interests include La Quinta Gateway Terminal project, a long-term plan related to a multipurpose dock and container facility; Cheniere Energy s proposed liquefaction project; M&G Group, an Italian chemical engineering and manufacturing group that produces PET resin; Chinese investments by Tianjin Pipe (Group) Corporation through TPCO America; The voestalpine Group, a steelmaking group from Austria and several other investors contribute to the port s growth and transportation needs. The City of Corpus Christi s land use plan shows ongoing growth in the Southside as well as transportation challenges along SH 358 (South Padre Island Drive). As the only major highway corridor connecting the mainland to the island, SH 358 is operating at a lower level of service causing traffic congestion and delays. The arterial system adjacent to SPID has been identified as congested requiring traffic studies to determine if access management improvements can provide relief. The Regional Parkway Mobility Corridor study is a critical element in the long-range development of the transportation system. This project promises to alleviate existing elevation limitations evident on the only bridge from the island to the mainland. The Corridor will enhance safety issues by providing island residents with an alternative evacuation route from the island to the mainland especially during hurricane evacuation. The cities of Portland, Gregory, Ingleside and Robstown are neighboring communities for the Corpus Christi area. The Corpus Christi Naval Air Station and the Corpus Christi Army Depot are the largest CHAPTER 5 CONGESTION MANAGEMENT 75
80 Corpus Christi Metropolitan Transportation Plan employers in the area. Many people commute from neighboring communities to Corpus Christi. Tourist attractions which bring many tourists to this area for short durations include: the USS Lexington Museum, the Texas State Aquarium, Padre Island National Seashore, Whataburger Field Home of the Corpus Christi Hooks Double-A Baseball, Port Aransas Beaches, and the Botanical Gardens and Nature Center. The cumulative effect of these activities is an additional demand on housing and commerce that in turn generate more travel trips. Funding for the area is driven by methods established by TxDOT which entails grouping Federal programs under various classifications. Given that the MPO, in collaboration with TxDOT and interested parties, select projects for Category 2 and 7 funds a projection of funding in this area is of community wide concern. Category 2 provides for funding mobility and added capacity projects on major state highway system corridors which serve the mobility needs of a TMA. Category 7 provides for funding mobility projects within the TMAs. DEVELOPMENT OF PREFORMANCE MEASURES The intent of developing performance measures is to provide the public, appointed, and elected official with tools that will effectively communication the performance of the transportation network and operations. It is important for our study area to remain observant and aware of our attainment designation for ozone or carbon monoxide as an adverse change in these areas will certainly impact local assessment. Institute System Performance Monitoring Plan The MTP directs coordinated data collection and system performance monitoring to assess the extent of congestion, to contribute in determining the causes of congestion, and evaluate the efficiency and effectiveness of implemented actions. Our data collection efforts based on relevant, reliable, and consistent performance measures and analytical methods have provided a number of improvement projects that are in the process of being implemented. An active awareness of the need to coordinate with existing data sources, and operations managers in the metropolitan area is exercised. Partnerships with our local university, community college, and businesses have also proven effective methods for collecting survey and study information. Identify and Evaluate Strategies Projects that enhance connectivity and create integration in the area are identified as critical. Traffic volume data collected by TxDOT and the City of Corpus Christi assist the MPO with data from over 200 locations in the study area. These locations are on those segments that are considered congested either by TxDOT standards or by the perception of the citizens of the metropolitan area. With more than 80 miles of fiber optic cables installed along urban area streets, Intelligent Transportation Systems (ITS) is a major tool available to mitigate congestion. Dynamic sign message systems and condition monitoring cameras at selected locations can make real-time appropriate decisions to manage congestion. When deliberating strategies used and designed to maximize the people-moving capability of the transportation system by increasing the number of persons in a vehicle, or by influencing the time of, or 76 CHAPTER 5 CONGESTION MANAGEMENT
81 Corpus Christi Metropolitan Transportation Plan need to, travel the following innovative options are considered: Transportation Demand Management (TDM) and Transportation System Management (TSM). To accomplish these types of changes, TDM programs must rely on incentives or disincentives to make these shifts in behavior attractive. The primary purpose of TDM is to reduce the number of vehicles using the road system while providing other mobility options to those who want to travel. TDM alternatives to a SOV: Carpools and Vanpools: Useful option for transit service in sparsely populated areas or where not enough resources exist to increase service. Public and Private Transit: Transit, bus pools, and shuttles can be utilized. Non-motorized travel: Bicycling and walking are modes that reduce congestion and air pollution. High Occupancy Vehicle Lanes (HOV): Moves more people per vehicle and thus decreasing vehicle miles of travel. New Highways: Constructed to relieve congestion by routing traffic from an existing congested system. Alternative Work Hours Programs: Compressed Work Weeks and Flexible Work Schedules help relieve congestion. Financial Incentives: Preferential parking for carpools and vanpools, subsidies for transit riders, transportation allowances, and guaranteed ride home programs help reduce traffic and congestion. TSM alternatives: Intelligent Transportation System (ITS): Includes computers, communications, and displays. Goods Movement Management: Regulating pickups and delivery times for freight delivery. Freeway Incident Management System: Prompt removal of a disabled vehicle from travel lanes. Geometric Design: Replacing continuous left turn lanes with a raised median increases capacity. Traffic Signal Improvements: Equipment updates, timing plan improvements, interconnected signals, traffic signal removal, or traffic signal maintenance. Intersection Improvements: Devices for the safe passage of both pedestrians and vehicles ie., stop signs, yield signs, traffic signs, turning lanes, traffic islands, channelization, and improved design. Planning Management are strategies related to zoning, land-use, and urban design techniques to avoid congestion by integrating land-use planning, site planning, and landscaping with a transportation system. Growth Management: Defined as the use of public policy to regulate the location, geographic pattern, quality and rate of growth of development. Travel demand modeling provides information on traffic generation that could be used to control land development and its impact on the surrounding transportation infrastructure. A tool used for growth management is site plan review and requirements in conjunction with required traffic impact analysis for high density multi-family, commercial, or industrial development. Access Management: Related to controlling space and design of driveways, medians and median openings, intersections, traffic signals, and freeway interchanges. Suitable access control can CHAPTER 5 CONGESTION MANAGEMENT 77
82 Corpus Christi Metropolitan Transportation Plan decrease the number of accidents and congestion. To have a successful access management plan, transportation planners and land use planners must work cooperatively. Access management benefits are fewer accidents, increased capacity, and shorter travel times. An example of a project resulting from our Access Management study is an on ramp reversal project on SPID that focuses on frontage roads. As part of the ramp-reversal project that changes the location of on and off ramps for the highway the intent is to eliminate the backups on the highway itself. Backups frequently occur from people jamming into exit lanes - at Weber, Everhart, Staples, and Airline. Other near term projects postured to address growing areas include a median project on Saratoga (SH357) and a proposal to extend improvements along Saratoga. Implement Selected Strategies and Management Transportation System Careful attention is given to the information and methods discussed in our CMP as they are later applied to establish priorities in the TIP and MTP. Working closely with operating agencies that have participated in the CMP is facilitated through a Congestion Management Subcommittee that meets Ad Hoc to review and analyze traffic data, and make recommendations for transportation improvements. The subcommittee consists of area partners including: TxDOT, representatives of Nueces and San Patricio Counties, City of Corpus Christi, City of Portland, CCRTA, and MPO staff. Monitor Strategy Effectiveness Periodic evaluation of our CMP strategies is a continuous process that validates our course of action in determining the most effective methods to use in supporting our local transportation decision making. Staff together with our subcommittee partners review how well and to what extend strategies being implemented contribute to the success/failure of projects. This summary of various TDM and TSM alternatives are planned and ongoing activities demonstrating that the MPO and its member agencies cooperatively and actively participate in congestion management. The MPO monitors and maintains ongoing communication with the Technical Advisory Committee, the Transportation Policy Committee and member entities to keep them abreast of federal regulations regarding congestion management. All entities have the opportunity to offer data and information to the MPO in an effort to contribute to the discussion and design of efficient action plans to relieve congestion 78 CHAPTER 5 CONGESTION MANAGEMENT

83 Corpus Christi Metropolitan Transportation Plan ENVIRONMENTAL CONSIDERATIONS CHAPTER 6 INTRODUCTION (Courtesy of the Corpus Christi Air Quality Group) The Corpus Christi Urban Airshed is made up of two adjoining counties in South Texas: Nueces County and San Patricio County. The region is a large urbanized area with a number of industrial point sources of air emissions and a concentration of mobile sources. The two counties are home to the nation's fifth busiest deep-water port with access to the Gulf of Mexico and the Gulf Intracoastal Waterway, and are home to a large industrial and petrochemical complex, a major military base, renewed oil and gas exploration activity, and a network of highways, including the Interstate Highway System, railroads, and air routes, that facilitates commerce and a thriving tourism industry. Nueces County and San Patricio County (Figure 6.1) are defined by the U.S. Environmental Protection Agency (USEPA) and the Texas Commission on Environmental Quality (TCEQ) as an urban airshed in which air emissions from sources in both counties interact to influence the level of ambient air pollution in the Corpus Christi community. Control of ambient air quality requires a strategy that considers sources of air emissions in both counties. FIGURE 6.1: Corpus Christi Urban Airshed and Regulatory Ozone Monitors CAMS 4 & 21 CHAPTER 6 ENVIRONMENTAL CONSIDERATIONS 79
84 Corpus Christi Metropolitan Transportation Plan STAKEHOLDERS The Corpus Christi Urban Airshed (Airshed) is an area in which local entities are working together via The Corpus Christi Air Quality Group to plan and implement voluntary actions appropriate for community needs in order to improve air quality. The Corpus Christi Air Quality Group was established in 1995 to address National Ambient Air Quality Standards (NAAQS) ozone attainment issues for the Airshed. The group works collaboratively to identify air emission sources and to design and implement emission reduction programs that are suitable for the Corpus Christi area. Members of the Corpus Christi Air Quality Group include individuals from the local government, business and industry, local universities, public agencies, a regional planning organization, the military, and the news media. The broad stakeholder representation within the Corpus Christi Air Quality Group allows the group to design common sense strategies that reflect the weather, driving habits, and economy of the region. On December 15, 2012, the Corpus Christi Air Quality Group submitted a letter of intent to the USEPA to participate in an Ozone Advance Program. The goal for the Airshed participation in the Ozone Advance Program is to maintain the area s successful record of maintaining healthy air quality and to encourage voluntary air emission reductions that help keep Nueces County and San Patricio County in attainment with the current 8-hour ozone standard of 75 ppb (parts per billion) as well as attainment of future ozone standards should the USEPA elect to lower the allowable standard for ozone. The Corpus Christi Air Quality Group has developed and delivered similar plans, that have been formalized by the USEPA; the 1996 Flexible Attainment Region Memorandum of Agreement and both the 2002 and the O3FLEX Memorandum of Agreement (Agreements). The policies and guidelines developed and implemented by the Corpus Christi Air Quality Group in these Agreements encouraged voluntary air emission reductions that helped keep the area in attainment of both the original 85 ppb ozone standard set in 2002 and the 75 ppb standard set in 2008, while contributing to the achievement of the positive health benefits envisioned under the 8- hour average. The Airshed is still experiencing the effects of the successful voluntary emission reductions efforts committed to in these Agreements. STATUS OF AIR QUALITY The current National Ambient Air Quality Standard (NAAQS) for ozone: the fourth highest daily maximum 8-hour average, averaged over the past three calendar years, may not exceed 75 ppb. TCEQ operates two Continuous Air Monitoring Stations (CAMS) in Corpus Christi: TCEQ CAMS 4, located at the Corpus Christi State Supported Living Center at 902 Airport Road; and TCEQ CAMS 21, located in West Guth Park at 9866 La Branch Street (Figure 6.1). Ozone levels recorded at these two monitors are used to determine the attainment status of the area. Currently, the Airshed is in attainment of the NAAQS for ozone at a current design value of 59 ppb at both CAMS. The Airshed has experienced an overall decreasing trend from 2002 through 2014 (Figure 6.2). 80 CHAPTER 6 ENVIRONMENTAL CONSIDERATIONS
.")
85 Corpus Christi Metropolitan Transportation Plan FIGURE 6.2: Corpus Christi Ozone Design Trends Corpus Christi Air Quality Group participant and stakeholder UNT/TAMUK operates several research grade air monitoring stations (Figure 6.3). Two of those stations are upwind of the regulatory monitors, while one is located downwind. The two upwind air monitors, Aransas Pass (CAMS 659) and Odem (CAMS 686), have consistently recorded design values approaching or equal to the current NAAQS for ozone, suggesting an influence of long range transported emissions from outside of the Airshed at the local monitors (Table 6.1). TABLE 6.1: OZONE DESIGN VALUES OBSERVED AT THE NON-COMPLIANCE RESEARCH GRADE MONITORING STATIONS YEAR CAMS 660 (HOLLY RD) CAMS 664 (VIOLET) CAMS 659 (ARANSAS PASS) CAMS 686 (ODEM) CHAPTER 6 ENVIRONMENTAL CONSIDERATIONS 81
86 Corpus Christi Metropolitan Transportation Plan FIGURE 6.3: Map of Research Air Monitors Operated by UNT/TAMUK 82 CHAPTER 6 ENVIRONMENTAL CONSIDERATIONS
87 Corpus Christi Metropolitan Transportation Plan PREFORMANCE MEASURES CHAPTER 7 INTRODUCTION Performance measures provide guidance for setting goals and standards, detecting and correcting problems, managing, describing, and improving processes and provide an opportunity to document accomplishments. Performance measures aim to answer questions about whether the performance of the transportation system is getting better or worse over time; and whether transportation investments are correlated or linked to stated goals and conditions. A typical definition of a measure includes a specific goal or objective, data requirements and the calculation methodology. Examples of performance categories can include: Accessibility Mobility Economic Development Quality of Life Safety Climate Change / Energy Use Environment Public Health Why use performance measures? The Moving Ahead for Progress in the 21st Century Act (MAP-21) placed increased emphasis on performance management within the Federal-aid highway program and transit programs. MAP-21 creates a streamlined and performance-based surface transportation program and builds on many of the highway, transit, bike, and pedestrian programs and policies established. This legislation integrates performance into many federal transportation programs and contains several performance elements. Under MAP-21, U.S. Department of Transportation (U.S. DOT) will establish final rules for the seven national transportation goals, and state DOTs will develop performance targets in consultation with metropolitan planning organizations (MPOs) within a year after the final rule is established. MPOs are required to develop regionally relevant performance objectives and its measurements within 180 days after the state DOT established its own performance targets for relevancy and consistency and to incorporate the established performance targets and its measures into the transportation planning process. The federally mandated performance measures are targeted at the effective management of limited funding resources, the logical prioritization of key elements in the transportation planning process, and the greater accountability to the public. The MPO will be required to develop the practical performance targets in coordination with TxDOT that are compatible with the 3C planning process (a continuing, CHAPTER 7 PREFORMANCE MEASURES 83
88 Corpus Christi Metropolitan Transportation Plan cooperative, and comprehensive) and the strategic performance management approaches to improve the transportation decision making process for the region. The required performance plan should include: Discussion towards achieving the performance targets Links investment priorities to performance targets And the target achievement is part of the MPO certification by FHWA and FTA conducted every four years based on the following performance evaluation criteria: Achievement of targets Appropriateness of performance targets Cost-effectiveness and efficiency of transportation investments Extent to which process relies on public input Ability of the public to access information to assess the performance of the MPO The MPOs will be required to submit the Metropolitan System Performance Report every four or five years that includes: Evaluate the condition performance of the transportation system Progress achieved in meeting performance targets in comparison with the performance in previous reports Evaluation of how preferred scenario has improved conditions and performance, where applicable Evaluation of how local policies and investments have impacted costs necessary to achieve performance targets, where applicable. FRAMEWORK FOR USING PREFORMANCE MEASURES The following describes a transition into a performance-based planning process to allow the advancement of these approaches in planning and programming activities. Performance based planning fits within a traditional planning and programming process. This framework includes: Planning: Strategic Direction Goals and Objectives Performance Measures Planning Analysis Identify Trends and Targets Identify Strategies and Analyze Alternatives Develop Investment Priorities Programming: Investment Plans Resource Allocation Program of Projects 84 CHAPTER 7 PREFORMANCE MEASURES
89 Corpus Christi Metropolitan Transportation Plan Implementation and Evaluation: Monitoring Evaluation Reporting Selection of Performance Measures Selection of performance measures is closely tied to development of goals and objectives. Since performance measures are used to assess progress toward meeting objectives and in turn goals, they are central to implementing a performance-based planning process. Performance results inform as to whether types of projects and strategies that are implemented are in fact helping achieve goals and objectives. Performance measures serve five critical purposes: 1. Clarify the definition of goals Performance measures are a tool that is used in converting broad goals into measurable objectives. 2. Monitor performance Metrics are used to track performance on a regular basis. 3. Set targets Metrics are used as the basis for selecting a target that is intended to be achieved. 4. Compare alternative options Metrics are used as a basis for comparing alternative investments or policies. 5. Assess effectiveness Metrics are what enable measurement to assess whether projects and strategies have worked to further goals. Two well-known challenges associated with defining performance measures are difficulties with data availability and difficulties in developing quantitative measures for factors such as economic vitality and livability. Data Collection Data and analytical tools play a critical role in the development, implementation and evaluation of performance measures. A suite of approaches, tools, and methodologies will be required. Data provide the foundation for: Selecting feasible performance measures Understanding current system performance (developing a base line) Developing and tracking performance changes over time (monitoring conditions) Setting targets Evaluating the effectiveness of implemented strategies While collecting, compiling and analyzing data is often a challenge compounded by costs and the difficulty of obtaining data, there is a wide array of national, state, and local data sources and systems available. A clear data collection strategy will be developed to provide a smooth data collection process. The MPO will work collaboratively with TxDOT measures while aligning planning factors, goals, objectives performance measures and targets. The data collection strategy will be developed to identify how much data needs to be collected, identify which graphics to report, establish reporting frequency, identify characteristics of the data and identify data sources with city and county data. CHAPTER 7 PREFORMANCE MEASURES 85

90 Corpus Christi Metropolitan Transportation Plan NEXT STEPS Texas Department of Transportation (TxDOT) and the Texas Metropolitan Planning Organizations will agree on a set of recommended national performance measures for Texas, once the Notice of Proposed Rulemaking and Final Rules are published. TxDOT and MPOs will use the same data the current approach includes TxDOT being responsible for the conditions and safety performance target settings while working with MPOs collaboratively on target setting for system performance areas. A collaborative approach will be taken on MPO region targets in advance of statewide target setting. The MPO's planning process, inclusive of area collaboration for system performance, will also utilize public input for improving the transportation network's performance. Community feedback, collected in a 2014 MPO survey, is captured in the Understanding Your Transportation Needs Survey Report (Appendix II). Based on community responses from over 400 participants (a tolerance for accuracy of +/- 5%), we were able to solicit input to questions related to future funding considerations, travel choice, connectivity, freight, safety, economic development, air quality, congestion, and facilities satisfaction. The MPO collected public feedback during the 2014 Nueces County Medical Society Health Fair. Our findings revealed that our community typically drives their car/truck/motorcycle from the south side of town to the central business district for work. In general terms the community is fairly satisfied with connectivity, how the system links for purposes of goods/products and people, safety, and air quality. The highest level of agreement for all questions was respondents acknowledging that congestion is increasing. The matter of funding is a difficult one as the mention of taxes are not an acceptable option. However, taxing of commercial vehicles is supported but perhaps without consideration for the consequences... the potential of an increase in goods and services which is likely to occur to offset the tax. Finally, a major area of consensus is the dissatisfaction surrounding Active Transportation (bicycle and pedestrian). With the emphasis of MAP-21, to build an accountable system that is performance based, positive outcomes to alleviate dissatisfaction could be realized as our community considers moving from a Complete Streets "philosophy" to adopting Complete Street "policies". By making a commitment in this direction, our city neighborhoods could significantly realize the positive impacts through project selections that support this concept while actively capturing data/information that supports performance 86 CHAPTER 7 PREFORMANCE MEASURES
91 Corpus Christi Metropolitan Transportation Plan measures. Empowering our transportation planners and engineers to routinely design and operate the entire right of way to enable safe access for all users, regardless of age, ability, or mode of transportation promises secondary benefits from promoting Active Transportation... a boost to well-being and community health. This ultimately translates into prioritizing transportation projects that will make our street network better and safer for drivers, transit users, pedestrians, and bicyclists - making our community a better place to live. CHAPTER 7 PREFORMANCE MEASURES 87
92 Corpus Christi Metropolitan Transportation Plan [page intentionally left blank] 88 CHAPTER 7 PREFORMANCE MEASURES
93 PROJECT LIST
94 Federally Funded Highway Projects MTP
95 Federally Funded Transit Project Fund: Category 5307 (Funds in thousands) Serial # TxDOT CSJ # MPO Project # Estimated Funds for 20 years Project Year PROJECT From To Total Cost Balance Funds PROJECT DESCRIPTION Remarks 1 N/A 2015 Opera ng $850,905 Preventa ve Maintenance N/A 2015 Opera ng $354,297 ADA Paratransit Service N/A 2015 Capital $3,675,831 Replace Buses N/A 2015 Capital $1,000,000 Transit Enhancements: Bus Shelters N/A 2016 Opera ng $850,905 Preventa ve Maintenance N/A 2016 Opera ng $354,297 ADA Paratransit Service N/A 2016 Capital $3,675,831 Replace Buses N/A 2016 Capital $1,000,000 Transit Enhancements: Bus Shelters N/A 2017 Opera ng $850,905 Preventa ve Maintenance N/A 2017 Opera ng $354,297 ADA Paratransit Service N/A 2017 Capital $3,675,831 Replace Buses N/A 2017 Capital $1,000,000 Transit Enhancements: Bus Shelters N/A 2018 Opera ng $850,905 Preventa ve Maintenance N/A 2018 Opera ng $354,297 ADA Paratransit Service N/A 2018 Capital $3,675,831 Replace Buses N/A 2018 Capital $1,000,000 Transit Enhancements: Bus Shelters 5307
96 Federally Funded Transit Project Fund: Category 5310 (Funds in thousands) Serial # TxDOT CSJ # MPO Project # Estimated Funds for 20 years Project Year PROJECT From To Total Cost Balance Funds PROJECT DESCRIPTION Remarks 6 N/A 2015 Capital $388,836 Seniors and People with Disabili es N/A 2016 Capital $388,836 Seniors and People with Disabili es N/A 2017 Capital $388,836 Seniors and People with Disabili es N/A 2018 Capital $388,836 Seniors and People with Disabili es 5310 Federally Funded Transit Project Fund: Category 5339 (Funds in thousands) Serial # TxDOT CSJ # MPO Project # Estimated Funds for 20 years Project Year PROJECT From To Total Cost Balance Funds PROJECT DESCRIPTION Remarks 5 N/A 2015 Capital $665,198 Bus and Bus Facili es N/A 2016 Capital $666,940 Bus and Bus Facili es N/A 2017 Capital $666,940 Bus and Bus Facili es N/A 2018 Capital $666,940 Bus and Bus Facili es 5339
97 APPENDICES
98 APPENDIX I Documentation of Public Participation
99 Corpus Christi Metropolitan Transportation Plan SUMMARY OF PUBLIC INPUT Written Comments: None. Tribal: Communication was established with tribal leaders that include: Apache Tribe of Oklahoma Comanche Nation of Oklahoma Kiowa Indian Tribe of Oklahoma Mescalero Apache Tribe Tonkawa Tribe of Indians BIA Anadarko Given that this was an initial outreach initiative - guidance was sought from each of the agencies on identifying a specific contact initially by electronic communication and then in written form. None of the agencies responded with an individual to utilize as a contact or with expressions of interest. Local Governments: Ongoing dialogue about the planning process has been occurring as part of the public participation effort with the following agencies and their respective committees or individual participation on the Transportation Advisory Committee and the Transportation Policy Committee: Nueces County San Patricio County City of Corpus Christi City Planning Commission Air Quality Committee Shared Access Working Group Mayor's Committee for Person with Disabilities Transportation Advisory Committee Bicycle and Pedestrian Sub-Committee City of Portland City of Gregory Port of Corpus Christi Regional Transportation Authority Committee on Accessible Transportation (RCAT) APPENDIX I DOCUMENTATION OF PUBLIC PARTICIPATION
100 Corpus Christi Metropolitan Transportation Plan Fiscal Year Community Outreach: In addition to presentation opportunities to the following civic and community organizations, to familiarize them with the planning process and seek their input on project needs and priorities, MPO staff s outreach efforts included 25 mobile meetings, which staff attended and distributed survey questionnaires (ATTACHMENT 1). Port Industries of Corpus Christi Friday Morning Group Corpus Christi Chamber of Commerce Infrastructure Committee Corpus Christi Chamber of Commerce Transportation Committee Corpus Christi Regional Economic Development Corporation Corpus Christi Transportation Advisory Committee Publicly Posted Meetings and Public Input: Of particular concern to the MPO was the input of those under-served by the transportation network particularly the economically disadvantaged, minorities, elderly and low-income individuals. The MPO made the draft Metropolitan Transportation Plan publicly available for public review. The MPO advertised scheduled informal Public Input Opportunities at various Senior Centers, Health Fairs and public meetings to improve the quality and quantity of public interaction. This process increased the number of contacts and provided an opportunity for one on one discussion about transportation needs. General Summary of Questionnaire Responses: The outreach effort has included the distribution of questionnaires and the creation of a web based questionnaire to increase input. The over 61% of our survey responses were from paper questionnaires completed by individual respondents and approximately 39% of survey questionnaires were web based responses. The general findings include: Respondents are primarily housing in the southeast and southside sectors of our city and then traveling to the central business, southeast and westside sectors of our city for work. The community is highly auto-centric with respondents indicating they use a car/truck/motorcycle for their daily trips. Bus service and walking were a distant second and third choice. Connectivity, how the transportation system gets us from one place to another was of significant importance to our respondents. Increasing the safety of the transportation system was clearly supported by community responses. Respondent s highest level of consensus was related to congestion where responses indicated traffic has increase over the last 5 years. For more complete information on the process and findings please see Understanding Your Transportation Needs Survey Report (APPENDIX II). Findings were presented to the Transportation Advisory Committee and the Transportation Policy Committee and in part, general comments influenced project consideration by reinforcing recognized changes in the transportation system. APPENDIX I DOCUMENTATION OF PUBLIC PARTICIPATION
101 Corpus Christi Metropolitan Transportation Plan PUBLIC NOTICE Corpus Christi Metropolitan Planning Organization Metropolitan Transportation Plan The Corpus Christi Metropolitan Planning Organization (CCMPO) will seek public input and comments on the CCMPO s 25-year long range plan, the Metropolitan Transportation Plan (MTP). Public input and comments will be solicited at the Thursday, October 16, 2014, 9:00 a.m. meeting of the Technical Advisory Committee (TAC) at the administrative offices of the Regional Transportation Authority s Administration (CCRTA) located at 5658 Bear Lane in Corpus Christi, TX Public input and comments will also be welcomed at the Thursday, November 6, 2014, 1:30 p.m. meeting of the Transportation Policy Committee (TPC) at Corpus Christi City Hall Council Chambers located at 1201 Leopard Street in Corpus Christi, TX Public comments during both meetings regarding the Metropolitan Transportation Plan (MTP) will be accepted and the TPC may possibly take action to adopt the MTP update on Thursday, November 6, 2014 at 1:30 p.m. meeting at the Corpus Christi City Hall Council Chambers located at 1201 Leopard Street in Corpus Christi, TX The MTP is available for review and comment at or copies can be made available in electronic or printed form by contacting the CCMPO at (361) or visiting the CCMPO office at 5151 Flynn Parkway, Suite 404, Corpus Christi, TX during regular business hours. Please be advised that this notice of public involvement and opportunity for public comment will satisfy the CCMPO Public Participation and the program-of-projects requirements of the Urbanized Area Formula Program (Section 5307) of the Federal Transportation Administration. Información en Español: Si usted desea esta información en Español o si desea explicación sobre el contenido, por favor llamenos al teléfono (361) o comuníquese con nosotros mediante correo electrónico a ccmpo@cctxmpo.us. Nuestras oficinas estan ubicadas en el 5151 Flynn Pkwy. #404, Corpus Christi, TX Copias se proveeran a petición. APPENDIX I DOCUMENTATION OF PUBLIC PARTICIPATION
102 APPENDIX II Transportation Needs Survey Glossary of Terms


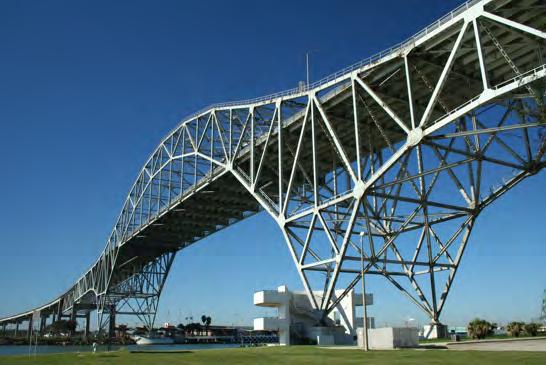


103 Understanding Your Transportation Planning for Mobility, Safety and Needs Survey Accessability for Everyone
104 TABLE OF CONTENTS UNDERSTANDING YOUR TRANSPORTATION NEEDS SURVEY I. Introduction 1 II. Why Create a Survey? 1 III. What Were Our Golas and Objectives? 1 IV. What Was Our Survey Methodology? 2 V. What Did We Find Out? 3 VI. Our Understanding of Results 8 ATTACHMENTS 1. Meetings List MPO Brochure Questionnaire Tool Quick Response Code (QRC) Card Website Blast Banner Your Input Counts! Poster Survey Comments 19 TABLE & MAPS 1. Table 1: Survey Tools 2 2. Table 2: Characteristics of Respondents 5 3. Map 1 - Home Zip Codes (Origins) 4 4. Map 2 - Work Zip Codes (Destination) 4 The preparation of this report has been financed in part through grant[s] from the Federal Highway Administration and Federal Transit Administration, U.S. Department of Transportation, under the State Planning and Research Program, Section 505 [or Metropolitan Planning Program, Section 104(f)] of Title 23, U.S. Code. The contents of this report do not necessarily reflect the official views or policy of the U.S. Department of Transportation.
, a federal requirement that is updated every five years, is a long-range plan that spans a 25 year horizon.")
105 Understanding Your Transportation Need Survey UNDERSTANDING YOUR TRANSPORTATION NEEDS SURVEY I. INTRODUCTION The Corpus Christi Metropolitan Transportation Plan (MTP), a federal requirement that is updated every five years, is a long-range plan that spans a 25 year horizon. It is designed to assess the needs of the Corpus Christi Metropolitan Planning Organization (MPO) study area and guide the development of a comprehensive multimodal transportation system. The plan s update complies with the law while simultaneously offering communities in the study area an opportunity to assist us and ensure that our transportation planning investments are responding to our local evolving needs and expectations. Sustaining an informed agency membership, identifying emerging trends that impact our system, guiding agency initiatives and programs, providing parameters for the selection process of Transportation Improvement Program (TIP) projects and providing a status report of the work completed are all elements of the MTP. II. WHY CREATE A SURVEY? As part of the planning process, we provide transportation information on the condition of our system and then seek public input for improving the transportation network s performance. This practice, supplemented by the use of a survey, was included as part of our MPT revision. The community s feedback and diverse viewpoints enrich the evaluation and collaboration of our programs in an open and meaningful involvement of interested parties. III. WHAT WERE OUR GOALS AND OBJECTIVES? The MPO s survey goals and objectives were positioned to align with our legislative authorizations, Safe Accountable Flexible Efficient Transportation Equity Act: A Legacy for Users (SAFETEA-LU) and Moving Ahead for Progress in the 21 st Century (MAP-21). These legislative mandates require MPOs to consider numerous factors in the development of a MTP as well as emphasize the creation of a streamlined and performance-based surface transportation program that builds on many of the highway, transit, bike, and pedestrian programs and policies already established. Our survey touched on the following factors: MPO collecting public feedback during the 2014 Nueces County Medical Society Health Fair. Enhance integration and connectivity of the transportation system Increase the accessibility and mobility of people and freight Increase safety for motorized and non-motorized users Support the economic vitality 1
106 Understanding Your Transportation Need Survey IV. Protect and enhance the environment, and promote energy conservation Promote efficient system management and operation Effectiveness in ease of travel Funding alternatives for consideration WHAT WAS OUR SERVEY METHODOLOGY? The MPO used Survey Monkey, an online survey software to develop/collect/analyze a simple survey questionnaire of 13 questions that was then distributed through a variety of networks in an effort to collect feedback and input from a diverse group of stakeholders in our community. The survey was launched in June 2014 and terminated approximately 12 weeks later in September Based on recommendations from Survey Monkey, the closer our sample is to the size of our population, the more representative our results. Using a tolerance for accuracy of + or 5% and our population size of approximately 320,000, we were required a survey respondent pool of at least 400. Staff outlined a fluid but aggressive timeline to assist and guide with implementation of the survey gathering process. Our outreach plan consisted of mobile meetings, where staff solicited presentation time on meeting agendas of diverse area group meetings (Attachment 1). Aware that residents in the community might not be aware of who the MPO was or what the MPO does, we were mindful of providing context in the materials we prepared for our presentations and the message we delivered. An introduction of our entity and our task was presented and supported with information on the MPO (Attachment 2). Plan information was presented, questions addressed, and surveys distributed. At the conclusion of our survey gathering, we were able to assess 439 surveys of which 65% were female. Based on our outreach efforts, we calculate we reached over 2,600 individuals which gave us a response rate of approximately 16%. The following table outlines the tools we utilized and the details related to each. TABLE 1: SURVEY TOOLS TOOL 1 Questionnaire (Attachment 3) DETAILS The questionnaire was designed for the respondent's ease of use - whether checking off a box on the paper survey or minimal clicking when taking the survey online we wanted maximum results/information with minimal requirements/imposition from the respondent. Thirteen questions were raised: 3 related to demographics (identification of origin and destination zip codes and gender), 2 related to future funding considerations, and 1 each for the following topics - travel choice, connectivity, freight, safety, economic development, air quality, congestion, and facilities satisfaction. Approximately 500 paper surveys were distributed; 268 were compiled; and then, electronically input by staff. Over 61% of all surveys collected were paper surveys. 2
107 Understanding Your Transportation Need Survey TABLE 1: SURVEY TOOLS - CONTINUE TOOLS 2 QRC Business Card (Attachment 4) 3 Meetings List (Attachment 1) DETAILS These business cards were developed for those who declined the invitation to take a paper questionnaire and preferred to "take the survey later". The card contained key survey information as well as a "quick response code" (QRC) cube that could be scanned (using a free app) on their Smartphone. This proved successful as most folks taking cards gave positive comments on the shortcut option for accessing the online survey and efficiently expediting the process. Over 350 cards were distributed. Staff approached over 30 standing/scheduled area and community meetings in an effort to reach a diverse audience. Approximately 25 invitations were accepted and presentations delivered to an estimated 563 people. 4 Interviews Staff estimates that at least 30% (80) of the 268 paper surveys collected were one-to-one interviews where staff assisted with reading questions more notably during the Nueces County Medical Society s Annual Health Fair. Health fair representatives estimated an audience of 3500 participants at their event. 5 Website A prominent banner and icon was added to our website s homepage directing site visitors to participate in our survey. The Corpus Christi Regional Transportation Authority (CCRTA) assisted us by promoting our survey with a link on their website. 6 Blast (Attachment 5) 7 Posters (Attachments 6 &7) Numerous key entities were approached to assist with the distribution of Blast information. Those that agreed to assist, helped issue over 1,200 notices utilizing their contact lists in addition to the MPO s own contact list. A reminder blast was issued to some of those previously notified to ensure our goal of 400 responses would be satisfied. Posters were developed for placement in three main elevators at Corpus Christi City Hall. Banners were placed in MPO windows advertising the availability of our survey. V. WHAT DID WE FIND OUT? The MPO s effort to pursue meaningful and inclusive input and public participation were driven by our interest to update and either reinforce or adjust our planning assumptions. The following section outlines our data collection efforts. Our findings, related to our respondents daily travel patterns, were based on the three zip codes with the highest HOME (origin) and WORK (destination) zip code. The following maps highlight that our respondents are primarily housing in the southeast and southside sectors of our city and then traveling to the central business, southeast and westside sectors of our city for work. 3
, 78411 (43")
, 78412 (31 respondents), and 78405")
108 Understanding Your Transportation Need Survey MAP 1 Home Zip Codes: The majority of our respondent s daily trips originate in the following zip code areas: (54 respondents), (43 respondents), and Map 2 Work Zip Codes: The majority of our respondent s daily destination trips are in the following zip code areas: (65 respondents), (31 respondents), and (29 respondents). 4
109 Understanding Your Transportation Need Survey Other demographic characteristics of prominent zip codes identified by our respondents, based on American Community Survey data, are shown in the following table. TABLE 2: CHARACTERISTICS OF RESPONDENTS ORIGIN ZIP CODE DESTINATION ZIP CODE Survey DEMOGRAPHIC AND HOUSING ESTIMATES* Median Age (ages 5 +) SELECTED SOCIAL CHARACTERISTICS IN THE UNITED STATES** With a Disability High School Graduate or Higher (%) MEANS OF TRANSPORTATION TO WORK BY SELECTED CHARACTERISTICS *** Median Age (ages 16+) VEHICLE AVAILABLE (%) No vehicle available vehicle available vehicle available or more vehicle available Mean Travel Time to Work (minutes) Median Earnings (dollars) 36,851 27,024 29,209 16,286 28,209 16,990 POVERTY STATUS IN THE PAST 12 MONTHS (%) Below 100% of the Poverty Level to 149% of the Poverty Level At or above 150% of the Poverty Level LANGUAGE SPOKEN AT HOME AND ABILITY TO SPEAK ENGLISH Speak Language other than English (%) Speak English Very Well Speak English less than Very Well Sources: American Community Survey 5-Year Estimates *Table DP05 **Table DP02 ***Table S0802 5
110 Understanding Your Transportation Need Survey Other questions raised in the survey were positioned to give respondents an opportunity to indicate to what degree they thought the question was important, they were provided with a five-point scale where weights were assigned to each answer choice shown in parenthesis below: Questionnaire topic addressed were: Travel choice: The community is highly auto-centric with 92% (399 respondents) indicating they use a car/truck/motorcycle for their daily trips. Bus service at 6% (25 respondents) and walking at 1% (5 respondents) were a distant second and third choice. Connectivity: How our transportation system gets us from one place to another is significant to our community with the top two rates selected being Very Important (63%, 276 respondents), and Important (24%, 105 respondents) totaling approximately 87% of our responses. Freight: Transportation methods that link with each other to transport goods and products and people of all ages and abilities rated Very Important (60%, 262 respondents), and Important (31%, 133 respondents). Based on these two responses, nearly 90% of our respondents indicated its importance. Safety: Increasing the safety of the transportation system was clearly supported by our community with ratings of Very Important (68%, 294 respondents), and Important (24%, 104 respondents) totaling approximately 91%. Economic Development: Nearly 90% of the community advocates improving our standard of living and how we build our community with ratings of Very Important (67%, 290 respondents), and Important (24%, 105 respondents). Air Quality: Decreasing air pollution, greenhouse gas emissions and energy use by the transportation system were promoted by a majority of respondents with a cumulative rating of 87% - based on responses of Very Important (69%, 300 respondents), and Important (18%, 80 respondents). Congestion: When respondents were asked to compare how traffic has changed over the last 5 years, there was consensus 85% (359 respondents) indicated traffic has increase, followed by a distant second 10% (41 respondents) that believed traffic has stayed the same. Facilities Satisfaction: Respondents were asked based on their mode of travel - how satisfied they were with ease of travel. Responses were: 68% were satisfied (30% dissatisfied / 2% no opinion) when using car/truck/motorcycle; 37% were satisfied (39% dissatisfied / 24% no opinion) when walking; 18% were satisfied (46% dissatisfied / 36% no opinion) when bicycling; and 24% were satisfied (26% dissatisfied / 49% no opinion) when using bus. and Future Funding Considerations: Respondents were asked to designate how much money should be provided to support road and highway improvements; 71% (295 respondents) indicated more money; 5% (22 respondents) indicated less money; 21% (85 respondents) indicated about the same money; and 3% (13 respondents) had no opinion. 6
111 Understanding Your Transportation Need Survey When respondents were asked how likely they were to support different funding methods for road and highway improvements, responses were (shown are Very likely / Likely / Not likely): Tax Commercial Vehicles: 46% Very likely (25% Likely / 11% Not likely); New Development: 40% Very likely (31% Likely / 10% Not likely); Sales Tax: 14% Very likely (20% Likely / 36% Not likely); Tolls: 15% Very likely (15% Likely / 43% Not likely); Gas Taxes: 20% Very likely (17% Likely / 43% Not likely); Property Tax: 6% Very Likely (10% Likely / 57% Not likely) The final and Optional open-ended question of the survey asked respondents if they would like to offer any additional comments. A consideration regarding responses to open-ended questions is that sometimes these answers can be more meaningful as well as revealing of the respondent s knowledge and feelings on the subject. For our purposes, a total of 116 respondents (26%) offered approximately 156 comments (ATTACHMENT 8) related to: Transit: 47 (30%) Funding: 32 (21%) Roads / Highways: 27 (17%) Bike / Pedestrian: 22 (14%) Traffic Safety: 12 (8%) Miscellaneous topics: 11 (7%) Equity Issues: 2 (1%) Congestion: 2 (1%) Air Quality: 1 (1%) Using comments provided and comparing them to our first question related to travel choice, we find that while only 6% of respondents indicate that they use bus service for daily trips the majority of comments in our final question were directed toward transit. Further review of these transit comments show that 60% (28 of 47 comments) were service related and comments addressing route improvements were at 13% (6 of 47 comments). A short sample of transit (service related) comments are: Increase rural bus service Increase service for persons with disabilities Bus is not just for poor and carless; should be viable alternative Build reliable public transit for working people Need bus service in my zip code Buses are nice but don t go often enough or to the right place Great distances between where people live and work and no bus service Correlating survey responses to comments on funding, the next largest area for comments, we found that respondents support taxing commercial vehicles. Responses were 46% (179) Very Likely to support Tax on Commercial Vehicles in the questionnaire and 32% (11 of 34) of comments were in favor of this funding option. Evaluation of responses for roads and highways, where we used the rating system introduced previously, shows that the average rating for connectivity is at 1.55 and safety at 1.44 which is well between Very 7
112 Understanding Your Transportation Need Survey Important and Important. There were 12 comments (8%) offered in the category of Safety. An example of these comments included: Sync traffic lights Better signage at intersections Need North/South freeway on Rodd Field People can t merge safely on SPID... roundabout movement is wishful thinking When asked to rate satisfaction with ease of travel bicycle and pedestrian and bus ratings were the two modes of transportation that were identified as dissatisfied. There were 22 (14%) comments, the fourth largest category, addressing bicycle and pedestrian issues. The following illustrates satisfaction rates where 1 is satisfied; 2 is dissatisfied; and three is no opinion: Car/truck/motorcycle = 1.34 (closer to being Satisfied) Walking = 1.87 (closer to being Dissatisfied) Bicycle = 2.18 (Dissatisfied) Bus = 2.25 (Dissatisfied) Comments offered for bicycle and pedestrian all appeal for better facilities. A list of suggestions are: Improve alternative transportation modes: walk, bike, running; make safer Dangerous for walking and bikes Make walking and biking safe to get people out of their cars Create safe bike routes separated from traffic Need sidewalks and bike lanes VI. OUR UNDERSTANDING OF RESULTS Our community typically drives their car/truck/motorcycle from the south side of town to the central business district for work. In general terms the community is fairly satisfied with connectivity, how the system links for purposes of goods / products and people, safety, and air quality. The highest level of agreement for all questions was respondents acknowledging that congestion is increasing. The matter of funding is a difficult one as the mention of taxes are not an acceptable option. However, taxing of commercial vehicles is supported but perhaps without consideration for the consequences... the potential of an increase in goods and services which is likely to occur to offset the tax. A major area of consensus is the dissatisfaction surrounding Active Transportation (bicycle and pedestrian). With the emphasis of MAP-21, to build an accountable system that is performance based, positive outcomes could be realized as our community considers moving from a Complete Streets philosophy to adopting a Complete Streets policy. By making a commitment in this direction, our city neighborhoods could significantly realize the positive impacts through project selections that support this concept while actively capturing data/information that supports performance measures. While general comments are consistent with general attitudes in the population, our survey process reinforces recognized changes in the transportation system. We will continue to engage public participation and support our Title VI outreach efforts so that our information remains representative of our community. The types of investments and projects selections we make are justified as we work toward addressing the feedback provided. 8
113 Understanding Your Transportation Need Survey Empowering our transportation planners and engineers to routinely design and operate the entire right of way to enable safe access for all users, regardless of age, ability, or mode of transportation promises secondary benefits from promoting Active Transportation... a boost to well-being and community health. This ultimately translates into prioritizing transportation projects that will make our street network better and safer for drivers, transit users, pedestrians, and bicyclists making our community a better place to live. 9
114 Understanding Your Transportation Need Survey [page intentionally left blank] 10
115 Understanding Your Transportation Need Survey COMMUNITY STAKEHOLDERS DATES GROUP NAME 1 Monday, July 7, 2014 YWCA Racial Justice Committee 2 Monday, July 7, 2014 North Beach Residential Association 3 Wednesday, July 9, 2014 Corpus Christi International Airport Board 4 Thursday, July 10, 2014 Westside Business Association 5 Thursday, July 10, 2014 League of Women Voters of Corpus Christi 6 Thursday, July 10, 2014 Corpus Christi MPO Transportation Policy Committee 7 Friday, July 11, 2014 Infrastructure Committee 8 Wednesday, July 16, 2014 CCRTA Operations Committee 9 Wednesday, July 16, 2014 Transportation Coordination Network of the Coastal Bend 10 Wednesday, July 16, 2014 YWCA Women's Advocacy Committee 11 Friday, July 18, 2014 Corpus Christi Air Quality Group 12 Friday, July 18, 2014 Bay Area Smart Growth Initiative 13 Monday, July 21, 2014 City of Corpus Christi Bicycle & Pedestrian Subcommittee 14 Thursday, July 24, 2014 SEA District 15 Thursday, July 24, 2014 Safe Communities - TAMU-CC 16 Friday, July 25, 2014 Coastal Bend COG - Board of Directors 17 Monday, July 28, 2014 Corpus Christi MPO Transportation Advisory Committee 18 Saturday, August 2, 2014 Nueces County Medical Society Health Fair 19 Wednesday, August 6, 2014 Committee for Persons w/disabilities 20 Tuesday, August 12, 2014 Senior Center - Greenwood 21 Thursday, August 14, 2014 Homeless Issues Partnership 22 Friday, August 15, 2014 CCRTA Committee on Accessible Transportation 23 Monday, August 18, 2014 Senior Center - Lindale 24 Tuesday, August 19, 2014 Senior Center - Oveal Williams 25 Wednesday, August 20, 2014 Senior Center Portland OUTREACH BY BLAST Sarah Garza, Environ. Compliance Mgr., POCCA S. TX Environmental Professional Meeting Dr. Amanda Drum Texas A&M University - Corpus Christi Beverly Cage Del Mar College Terry Sweeney Downtown Management District Executive Committee Janna Shoe 211 Texas Blast Kim Womack City of Corpus Christi - Elevators/public posting Danielle Hale Coastal Bend Public Information Officers Network Tyner Little Nueces County ATTACHMENT 1 - MEETINGS LIST 11
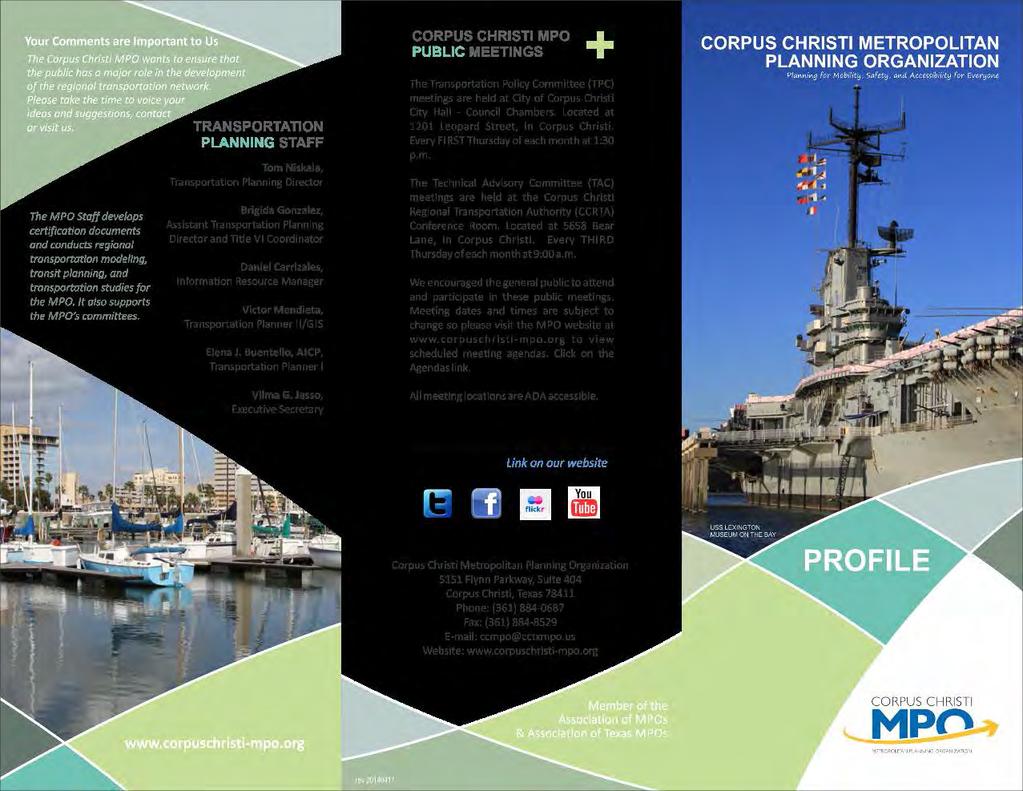
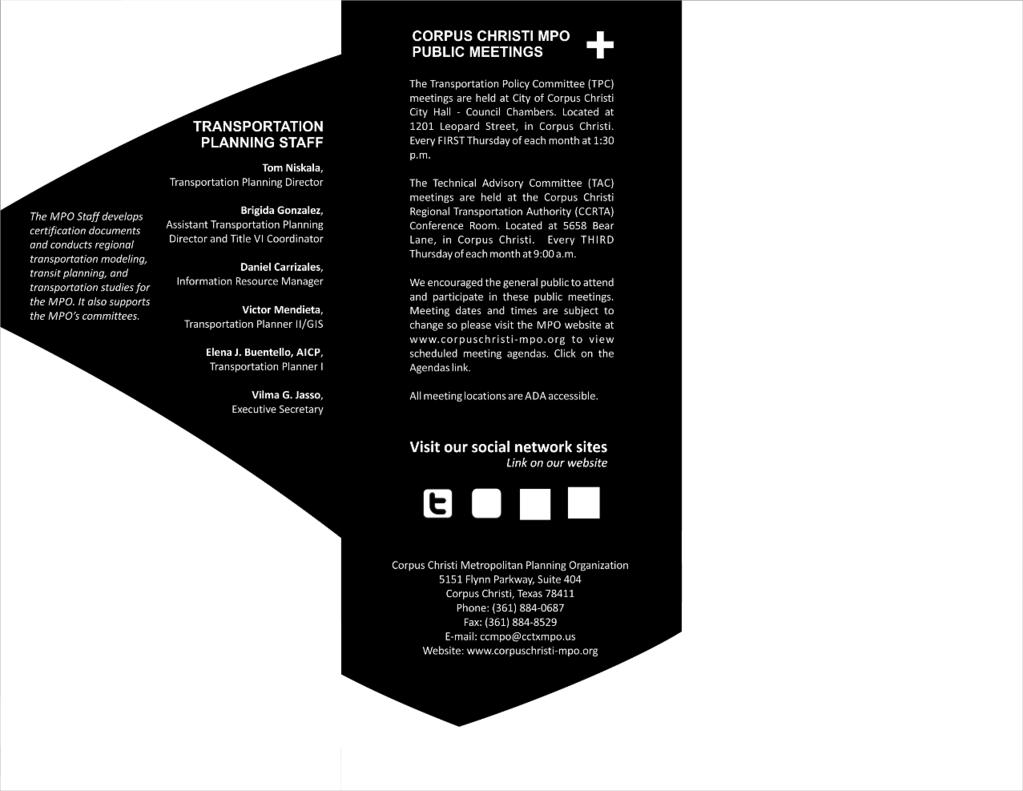
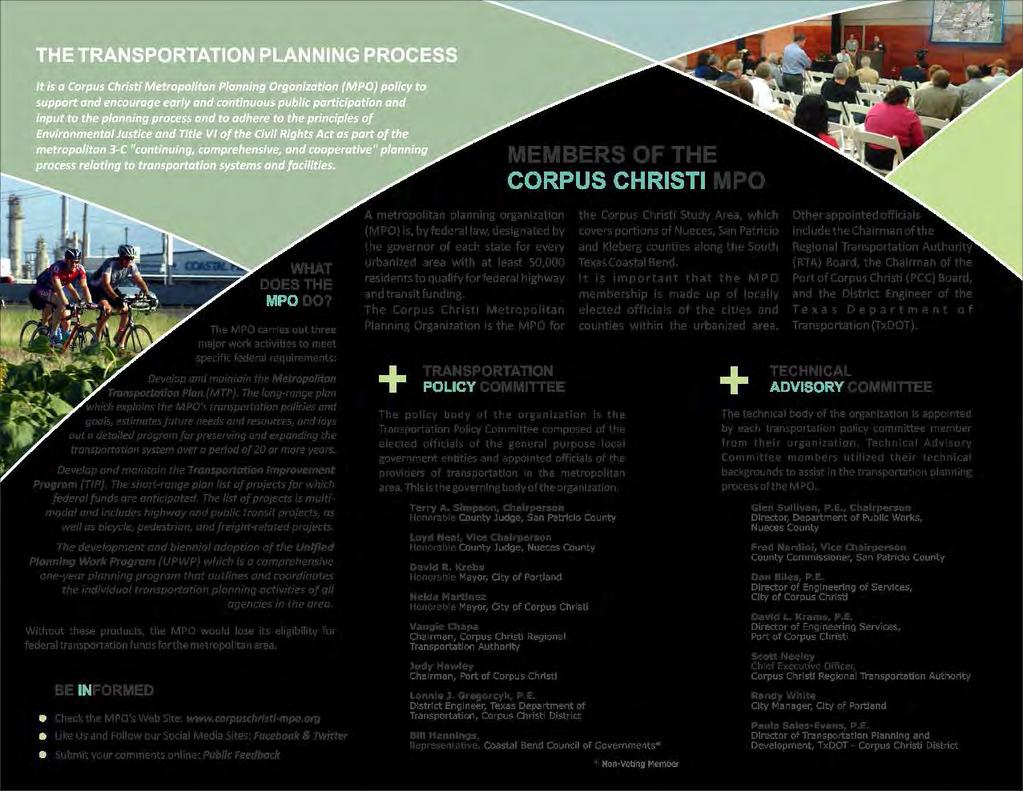
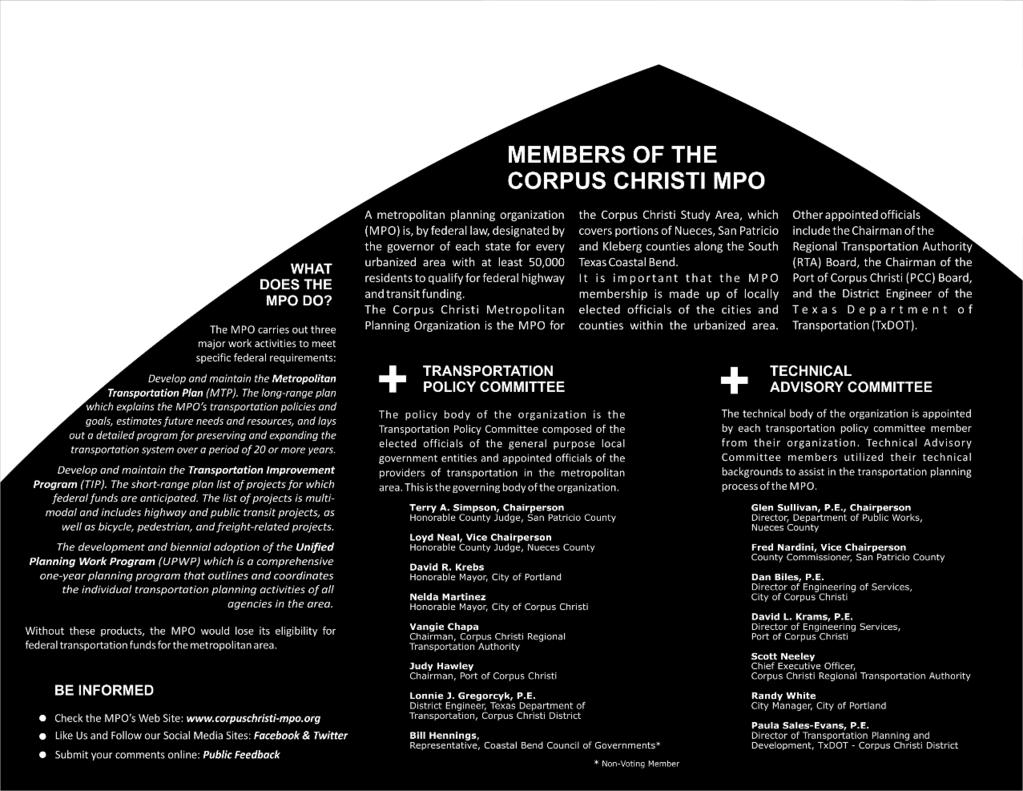
116 Understanding Your Transportation Need Survey 12 ATTACHMENT 2 - MPO BROCHURE
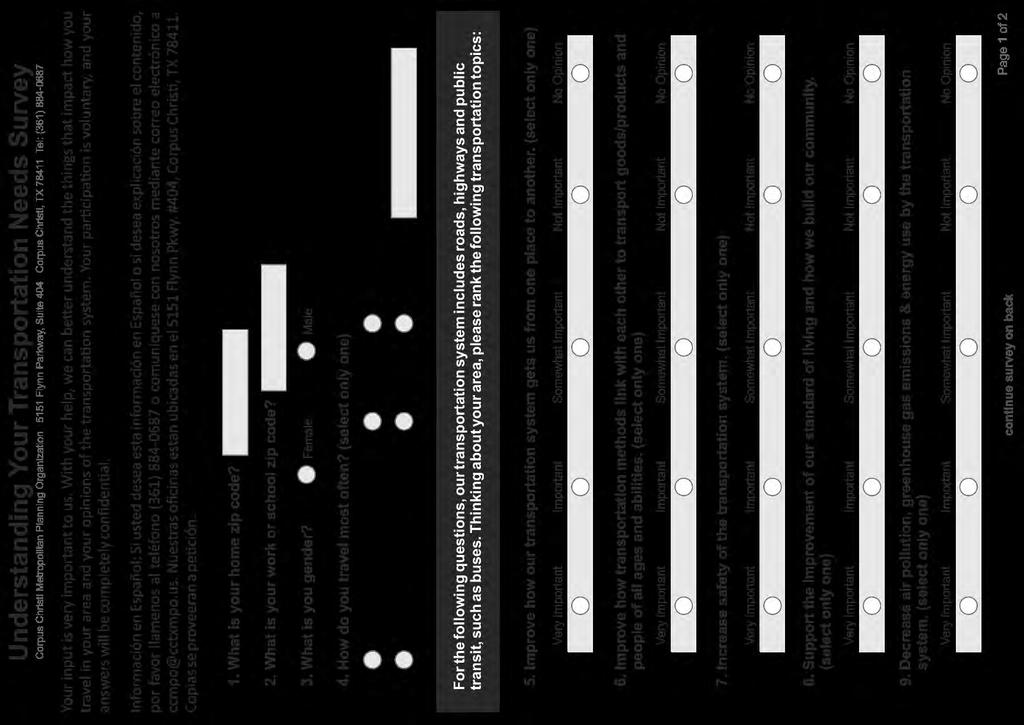
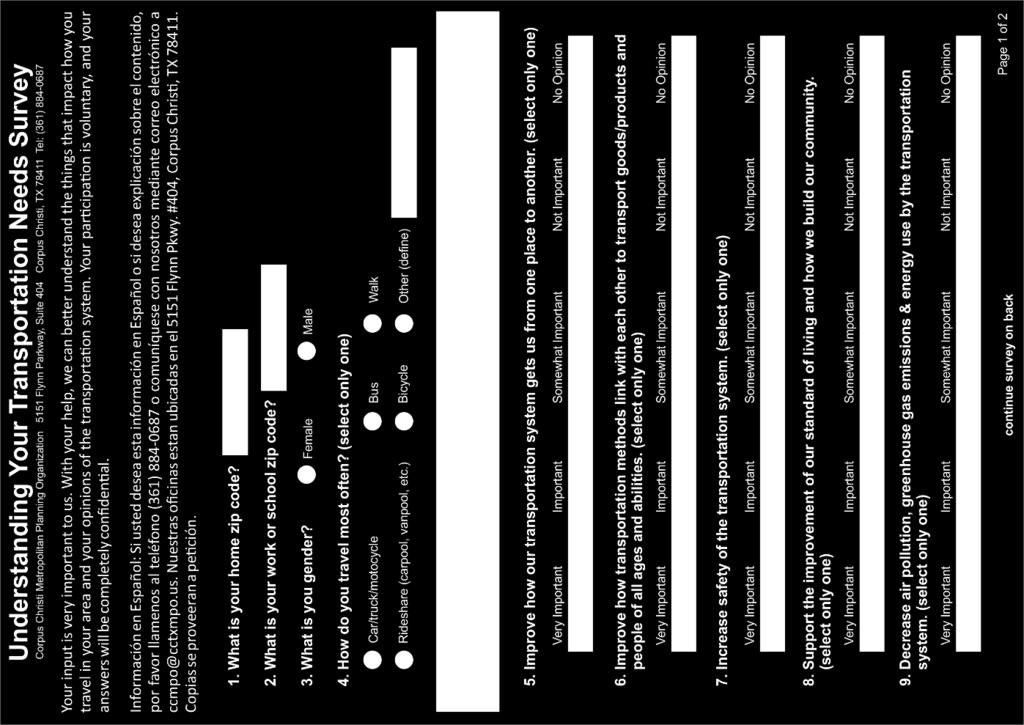
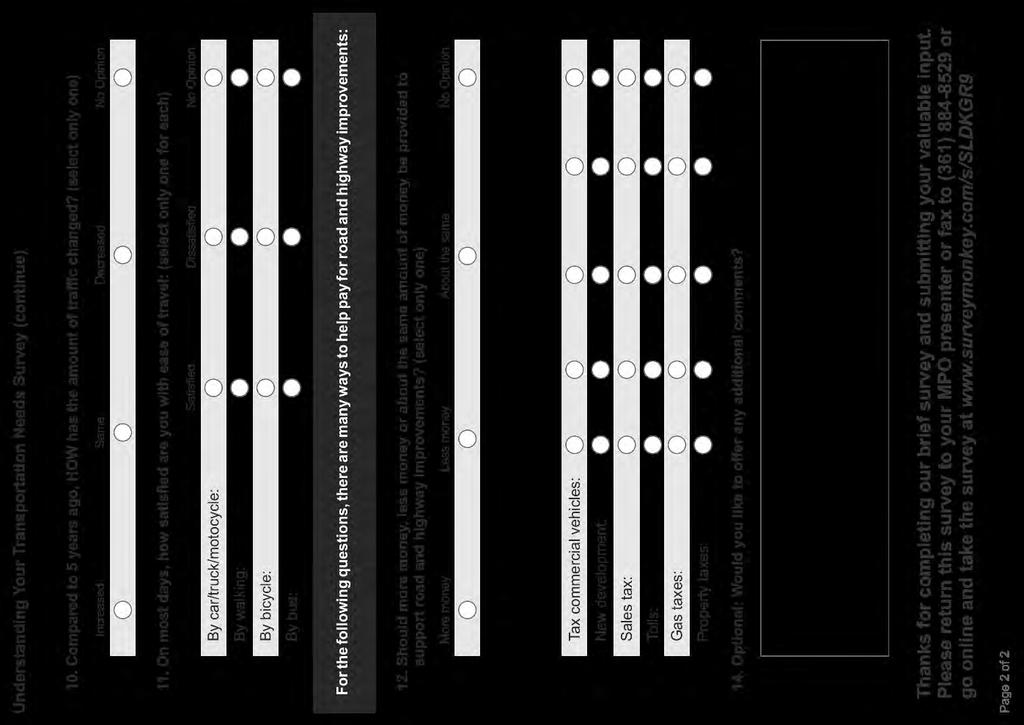

117 Understanding Your Transportation Need Survey ATTACHMENT 3 - QUESTIONNAIRE TOOL 13


118 Understanding Your Transportation Need Survey 14 ATTACHMENT 4 - QUICK RESPONSE CODE (QRC) CARD


119 Understanding Your Transportation Need Survey Dynamic banner on MPO homepage Survey icon on MPO homepage ATTACHMENT 5 - WEBSITE 15

120 Understanding Your Transportation Need Survey 16 ATTACHMENT 6 BLAST

121 Understanding Your Transportation Need Survey ATTACHMENT 7 - BANNER YOUR INPUT COUNTS! 17

122 Understanding Your Transportation Need Survey 18 ATTACHMENT 8 - POSTER
MOBILITY 2045: A FOCUS ON TRANSPORTATION CHOICE:
 Mobility 2045: The Metropolitan Transportation Plan for North Central Texas is the defining vision for the multimodal transportation system in the Dallas- Fort Worth Metropolitan Planning Area. The plan,
1.0 Introduction to Transportation Planning
 1.0 Introduction to Transportation Planning A good plan is like a road map: it shows the final destination and usually the best way to get there. H. Stanley Judd 1.1 Purpose Why is Transportation Planning
Rapid City Area Metropolitan Planning Organization OPERATIONS PLAN
 Rapid City Area Metropolitan Planning Organization OPERATIONS PLAN Prepared for the Rapid City Area Metropolitan Planning Organization Endorsed by the Executive Policy Committee of the Rapid City Area
Moving Ahead for Progress in the 21 st Century MAP-21
 Moving Ahead for Progress in the 21 st Century MAP-21 Mark Newland Transportation Finance Manager FHWA Indiana Division Purdue Road School March 6, 2013 Agenda Review changes between SAFETEA-LU and MAP-21.
Rapid City Area Metropolitan Planning Organization OPERATIONS PLAN
 Rapid City Area Metropolitan Planning Organization OPERATIONS PLAN Prepared for the Rapid City Area Metropolitan Planning Organization Endorsed by the Executive Policy Committee of the Rapid City Area
Corpus Christi Metropolitan Transportation Plan Fiscal Year Introduction:
 Introduction: Traffic congestion in the Corpus Christi Metropolitan area is not as much a function of population growth as the function of the increase in single occupant trips. Using census data, the
APPENDIX MPO 101: HISTORY, CONTEXT AND EVOLUTION OF METROPOLITAN TRANSPORTATION PLANNING
 A GUIDEBOOK FOR METROPOLITAN TRANSPORTATION PLANNING APPENDIX MPO 101: HISTORY, CONTEXT AND EVOLUTION OF METROPOLITAN TRANSPORTATION PLANNING In order to understand the ways that metropolitan planning
PURPOSE OF THE TRANSPORTATION IMPROVEMENT PROGRAM (TIP)
") INTRODUCTION PURPOSE OF THE TRANSPORTATION IMPROVEMENT PROGRAM (TIP) The Transportation Improvement program (TIP) is a staged, four-year program of projects proposed for funding by federal, State, and
INTRODUCTION PURPOSE OF THE TRANSPORTATION IMPROVEMENT PROGRAM (TIP) The Transportation Improvement program (TIP) is a staged, four-year program of projects proposed for funding by federal, State, and
2. Guiding Principles, Objectives, and Policies
 2. Guiding Principles, Objectives, and Policies INTRODUCTION The guiding principles for the 2040 MTP Update establish the vision and key focus areas for this planning effort. They combine the guidance
PERFORMANCE-BASED PLANNING AND PROGRAMMING
 February 2017 performance-based planning and programming Boston Region MPO PERFORMANCE-BASED PLANNING AND PROGRAMMING WHAT IS PERFORMANCE-BASED PLANNING AND PROGRAMMING? Performance-based planning and
Williamsport Area Transportation Study Metropolitan Planning Organization
 Williamsport Area Transportation Study Metropolitan Planning Organization LONG RANGE TRANSPORTATION PLAN 2018-2038 CHAPTER 1 INTRODUCTION Purpose of a Long Range Transportation Plan Transportation infrastructure
Introduction. Performance Measurement. Pg. 01
 Pg. 01 Introduction The Alamo Area recognizes the importance of transportation performance tracking, goal setting and measurement to provide greater accountability and transparency and to achieve a more
PERFORMANCE-BASED PLANNING AND PROGRAMMING
 February 2017 performance-based planning and programming Boston Region MPO PERFORMANCE-BASED PLANNING AND PROGRAMMING WHAT IS PERFORMANCE-BASED PLANNING AND PROGRAMMING? Performance-based planning and
MAP 21 Freight Provisions and Seaports
 MAP 21 Freight Provisions and Seaports September 20, 2012 American Association of Port Authorities 703.684.5700 www.aapa-ports.org 3 New Freight Eligibility in Core Highway Formula Programs Surface Transportation
Coalition for America s Gateways and Trade Corridors
 Coalition for America s Gateways and Trade Corridors ACS Solutions AECOM Alameda Corridor-East Construction Authority American Standard Companies Cascadia Center CenterPoint Properties Trust Chicago Metropolitan
2017 TRANSPORTATION POLICY STATEMENT
 0 TRANSPORTATION POLICY STATEMENT 1 1 1 1 1 1 0 1 0 1 0 1 Critical investments are needed to maintain and improve Virginia s transportation network. The structural imbalance between critical needs and
CHAPTER 1 INTRODUCTION
 CHAPTER 1 INTRODUCTION 1.1 ABOUT THE FREDERICKSBURG AREA METROPOLITAN PLANNING ORGANIZATION Established in 1992, the Fredericksburg Area Metropolitan Planning Organization (FAMPO) is the federally designated
NORTH CENTRAL TEXAS COUNCIL OF GOVERNMENTS THE FIXING AMERICA S SURFACE TRANSPORTATION (FAST) ACT SUMMARY HR th CONGRESS
 ACT SUMMARY HR th CONGRESS") NORTH CENTRAL TEXAS COUNCIL OF GOVERNMENTS THE FIXING AMERICA S SURFACE TRANSPORTATION (FAST) ACT SUMMARY HR 22 114 th CONGRESS Table of Contents DIVISION A SURFACE TRANSPORTATION... 2 TITLE I FEDERAL-AID
NORTH CENTRAL TEXAS COUNCIL OF GOVERNMENTS THE FIXING AMERICA S SURFACE TRANSPORTATION (FAST) ACT SUMMARY HR 22 114 th CONGRESS Table of Contents DIVISION A SURFACE TRANSPORTATION... 2 TITLE I FEDERAL-AID
Chapter 3 - Goals, Objectives, & Strategies
 Chapter 3 - This chapter presents goals, objectives, and strategies that have been developed as part of the Richmond Area MPO 2026 Long-Range Transportation Plan (LRTP) update. Strategies have been developed
Appendix E-1. FDOT MPO Program Management Handbook. (Excerpts)
") Appendix E-1 FDOT MPO Program Management Handbook (Excerpts) TABLE OF CONTENTS Chapter 4 Long-Range Transportation Plan Section Page 4.1 PURPOSE... 4-2 4.2 AUTHORITY... 4-2 4.3 SCOPE... 4-2 4.4 REFERENCES...
Appendix E-1 FDOT MPO Program Management Handbook (Excerpts) TABLE OF CONTENTS Chapter 4 Long-Range Transportation Plan Section Page 4.1 PURPOSE... 4-2 4.2 AUTHORITY... 4-2 4.3 SCOPE... 4-2 4.4 REFERENCES...
FY 2019 Unified Planning Work Program FINAL. Regional Intergovernmental Council. June 14, Kanawha Putnam Metropolitan Planning Organization
 FY 2019 Unified Planning Work Program FINAL Regional Intergovernmental Council Kanawha Putnam Metropolitan Planning Organization June 14, 2018 315 D Street. South Charleston, WV. 25303 The Unified Planning
Going Forward The Plan to Maintain & Improve Mobility Frequently Asked Questions (FAQs)
") Going Forward The Plan to Maintain & Improve Mobility Frequently Asked Questions (FAQs) What is Going Forward The Plan to Maintain & Improve Mobility (Plan) and why does the region need a Long Range Transportation
Going Forward The Plan to Maintain & Improve Mobility Frequently Asked Questions (FAQs) What is Going Forward The Plan to Maintain & Improve Mobility (Plan) and why does the region need a Long Range Transportation
AICP EXAM REVIEW. Transportation Planning. February 19, 2016
 AICP EXAM REVIEW Transportation Planning February 19, 2016 Agenda Defining transportation planning Transportation stakeholders Transportation plan development Transportation funding Project development
Introduction to the Proposed Statewide Transportation Improvement Program (STIP) Transportation Planning and Programming
 Transportation Planning and Programming") Introduction to the Proposed 2015-2018 Statewide Transportation Improvement Program (STIP) Transportation Planning and Programming Public Hearing August 19 th, 2014 TABLE OF CONTENTS Introduction... 1
Introduction to the Proposed 2015-2018 Statewide Transportation Improvement Program (STIP) Transportation Planning and Programming Public Hearing August 19 th, 2014 TABLE OF CONTENTS Introduction... 1
congestion management process
 congestion management process c o r p u s c h r i s t i m e t r o p o l i t a n p l a n n i n g o r g a n i z a t i o n Corpus Christi Metropolitan Planning Organization 602 N. Staples Street, Suite 300
MAP-21 themes. Strengthens America s highway and public transportation systems. Creates jobs and supports economic growth
 MAP-21 themes Strengthens America s highway and public transportation systems Creates jobs and supports economic growth Supports the Department s aggressive safety agenda Simplifies and focuses the Federal
PERFORMANCE-BASED PLANNING AND PROGRAMMING
 September 2018 performance-based planning and programming Boston Region Metropolitan Planning Organization: PERFORMANCE-BASED PLANNING AND PROGRAMMING WHAT IS PERFORMANCE-BASED PLANNING AND PROGRAMMING?
The Policies section will also provide guidance and short range policies in order to accomplish the goals and objectives.
 4 Goals & Objectives INTRODUCTION The 2015-2040 MTP preserves and promotes the quality of life and economic prosperity of the MAB by providing a transportation system consistent with the regional goals.
Chapter 5 Transportation Draft
 Chapter 5 Transportation Draft Discussion Similar to the other elements in the Comprehensive Plan, the transportation element impacts the quality of life, economic development and public safety of the
connections 2040 the waco metropolitan transportation plan
 connections 2040 the waco metropolitan transportation plan developed by the waco metropolitan planning organization in cooperation with the following agencies: adopted by the waco MPO policy board: january
TRANSPORTATION 101 Today and Tomorrow. Moving People and Goods
 TRANSPORTATION 101 Today and Tomorrow Moving People and Goods What is the Transportation Commission? An independent, seven-member body of citizens appointed by the Governor for six-year terms and representing
Tri-County Regional Planning Commission 2045 Regional Metropolitan Transportation Plan Goals and Objectives Adopted March 22, 2017
 Tri-County Regional Planning Commission 2045 Regional Metropolitan Transportation Plan Goals and Objectives Adopted March 22, 2017 One of the initial steps in the development of the TCRPC 2045 Metropolitan
Rapid City Area Metropolitan Planning Organization 2018 UNIFIED PLANNING WORK PROGRAM
 Rapid City Area Metropolitan Planning Organization 2018 UNIFIED PLANNING WORK PROGRAM Prepared by the City of Rapid City, City of Box Elder, City of Summerset, City of Piedmont, Pennington County, Meade
9.0 Meeting the Challenges
 9.0 Meeting the Challenges 9.1 SLRTP Goals The SLRTP is built around the six TxDOT Strategic Plan goals. 1. Develop an organizational structure and strategies designed to address the future multimodal
Appendix O Congestion Management Program REGIONAL TRANSPORTATION PLAN/SUSTAINABLE COMMUNITIES STRATEGY
 Appendix O Congestion Management Program REGIONAL TRANSPORTATION PLAN/SUSTAINABLE COMMUNITIES STRATEGY 2014 REGIONAL CONGESTION MANAGEMENT PROGRAM 2014 RTP/SCS APPENDIX O SAN JOAQUIN COUNCIL OF GOVERNMENTS
Rural Transportation Planning Work Program. Fiscal Years &
 Catawba Regional Council of Governments Rural Transportation Planning Work Program Fiscal Years 2015-16 & 2016-17 July 1, 2015 June 30, 2017 www.catawbacog.org Catawba Regional Council of Governments P.O.
RESOLUTION NO
 RESOLUTION NO. 2018-12 RESOLUTION OF THE SOUTHEASTERN WISCONSIN REGIONAL PLANNING COMMISSION AMENDING THE TRANSPORTATION IMPROVEMENT PROGRAM FOR SOUTHEASTERN WISCONSIN: 2017-2020 WHEREAS, the Southeastern
MONITORING IMPLEMENTATION AND PERFORMANCE
 12 MONITORING IMPLEMENTATION AND PERFORMANCE The FAST Act continues the legislation authorized under MAP-21, which created a data-driven, performance-based multimodal program to address the many challenges
TEXAS TRANSPORTATION PLAN DEVELOPMENT
 CHAPTER 2 The Texas Transportation Plan (TTP) advances performance-based planning concepts and integrates existing and ongoing state transportation plans and initiatives. While TxDOT s role as owner-operator,
CHAPTER 1. A New Transportation Plan
 Chapter 1. A New Transportation Plan 1 CHAPTER 1. A New Transportation Plan Why develop a new plan? The year 2005 marks 90 years since Anchorage emerged as a community serving as headquarters for railroad
2040 Long Range Transportation Plan
 2040 Long Range Transportation Plan Presented by Iowa Northland Regional Council of Governments October 22, 23, and 24, 2013 Liaison for federal transportation funding that goes to local cities and counties
Addendum 1: Performance Measures
 Addendum 1: 2 Addendum Livability 2040 Regional Transportation Plan Table of Contents 1.0 Introduction... 3 Federal Requirements... 3 MPO Measure Targets... 4 2.0 Safety Measure Targets... 9 3.0 Transit
INVESTMENT SCENARIOS CHAPTER Illustrative Investment Approaches Public Outreach 6-1
 CHAPTER 6 As detailed in Chapters 4 and 5, Texas multimodal transportation needs estimated at $21 billion annually (2014 constant dollars) illustrated in Exhibit 4-12 far outstrip the approximately $9.1
Under recently updated FHWA guidelines, the LRTP must be updated every four (4) years. The most recent LRTP is the 2035 Plan, adopted in early 2009.
 years. The most recent LRTP is the 2035 Plan, adopted in early 2009.") PLANS, POLICIES AND PROCESSES OF THE MPO The Winston-Salem Urban Area MPO is responsible for creating and maintaining many documents essential to the on-going transportation planning effort. These documents
PLANS, POLICIES AND PROCESSES OF THE MPO The Winston-Salem Urban Area MPO is responsible for creating and maintaining many documents essential to the on-going transportation planning effort. These documents
GUIDING PRINCIPLES MEMORANDUM
 M E T R O P O L I TAN TRA NS P O RTATI O N PLAN GUIDING PRINCIPLES MEMORANDUM El Paso Metropolitan Planning Organization INTRODUCTION The guiding principles for development of the El Paso MPO s Destino
Creating Safe, Sustainable, Multi-Modal Urban Transportation
 Policy 2015 Creating Safe, Sustainable, Multi-Modal Urban Transportation The National Association of City Transportation Officials (NACTO) is a coalition of America s largest cities hubs of economic activity,
CHAPTER 1: INTRODUCTION/ GOALS AND OBJECTIVES
 CHAPTER 1: INTRODUCTION/ GOALS AND OBJECTIVES 1.1: INTRODUCTION ABOUT THE FREDERICKSBURG AREA METROPOLITAN PLANNING ORGANIZATION (FAMPO) Established in 1992, the Fredericksburg Area Metropolitan Planning
2040 Addendum Performance-Based Planning November 2018
 2040 Long Range Transportation Plan 2040 Addendum Performance-Based Planning November 2018 Adopted June 13, 2018 250 S. Orange Ave, Suite 200, Orlando, FL 32801 407-481-5672 www.metroplanorlando.org MetroPlan
Addendum #3 to the Regional Transportation Plan
 Nashville Area Metropolitan Planning Organization Addendum #3 to the Regional Transportation Plan Effective November 21, 2018 Nashville Area Metropolitan Planning Organization 138 Second Avenue North Nashville,
Updated Summer
 1 Access Board An independent federal agency devoted to accessibility for people with disabilities. The Access Board developed the accessibility guidelines for the ADA and provides technical assistance
TEXAS FREIGHT MOBILITY PLAN: DRAFT KEY POLICY RECOMMENDATIONS
 TEXAS FREIGHT MOBILITY PLAN: DRAFT KEY POLICY RECOMMENDATIONS Texas Freight Advisory Committee Midland August 14, 2014 Draft Key Policy Recommendations August 14, 2014 2014 Freight Mobility Plan Recommendations
Transportation Funding in the San Diego Region
 Role FEDERAL Federal Highway Administration (FHWA) F.1 ATCMTD - Advanced Transportation and Congestion Management Technologies Deployment FHWA Develop model deployments of large scale implementation and
Congestion Management Process (CMP)
") Congestion Management Process (CMP) Introduction The Congestion Management Process (CMP) is a systematic, data-driven, and regionally accepted approach that aims to improve the performance of the transportation
Congestion Management Process (CMP) Introduction The Congestion Management Process (CMP) is a systematic, data-driven, and regionally accepted approach that aims to improve the performance of the transportation
TEXAS FREIGHT MOBILITY PLAN 2017
 TEXAS FREIGHT MOBILITY PLAN 2017 Texas Transportation Commission September 28, 2017 Overview of the Texas Freight Mobility Plan 2016 Plan First multimodal freight mobility plan Identified freight network,
TCATS October 12-Michigan Works 5:30-7pm. NATS October 19-Niles District Library 6-7:30pm
 Goal Development Workshop TCATS October 12- Works 5:30-7pm NATS October 19-Niles District Library 6-7:30pm SAFETEA-LU Goals 2035 TwinCATS Goals 2030 TwinCATS Goals 1. Support the economic vitality of the
Winston-Salem Urban Area Metropolitan Planning Organization Transportation Advisory Committee Action Request
 Winston-Salem Urban Area Metropolitan Planning Organization Transportation Advisory Committee Action Request Meeting Date: May 17, 2018 Agenda Item Number: 6 Action Requested: Consideration of an Appendix
2004 FEASIBILITY STUDY UPDATE
 Austin-San Antonio Intermunicipal Commuter Rail District 2004 FEASIBILITY STUDY UPDATE December 2004 EXECUTIVE SUMMARY INTRODUCTION Almost 3 million people in Central Texas, living and working between
Appendix A: Project Planning and Development A-1 White Paper on Transit and the Tappan Zee Hudson River Crossing Project
 Appendix A: Project Planning and Development A-1 White Paper on Transit and the Tappan Zee Hudson River Crossing Project Purpose of White Paper White Paper on Transit and the Tappan Zee Hudson River Crossing
2016 Cape Cod Regional Transportation Plan Development
 2016 Cape Cod Regional Transportation Plan Development APRIL 2015 PUBLIC MEETING PRESENTATION REGIONAL TRANSPORTATION P LAN ( RTP) + Long-range plan (2016-2040) + Includes all modes + Establishes the regional
Chapter 5 - Transportation
 Chapter 5 - Transportation Discussion Similar to the other elements in the Comprehensive Plan, the transportation element impacts the quality of life, economic development and public safety of the residents
TBARTA 2015 Regional Transportation Master Plan 2040 Regional Long Range Transportation Plan AUGUST 2015
 TBARTA 2015 Regional Transportation Master Plan AUGUST 2015 Table of Contents 1.0 Introduction... 2 1.1 Updating the Master Plan... 2 1.2 About this Document... 2 2.0 Regional Long Range Transportation
2030 Transportation Policy Plan SUMMARY PRESENTATION. Land Use Advisory Committee November 15, 2012
 2030 Transportation Policy Plan SUMMARY PRESENTATION Land Use Advisory Committee November 15, 2012 Today s Topics Transportation Policy Plan (TPP) Requirements and Background Current TPP Policies, Issues
Transportation Improvement Program (TIP) Relationship to 2040 Metropolitan Transportation Plan (MTP) - Goals and Performance Measures
 Relationship to 2040 Metropolitan Transportation Plan (MTP) - Goals and Performance Measures") Mid-Region Metropolitan Planning Organization Mid-Region Council of Governments 809 Copper Avenue NW Albuquerque, New Mexico 87102 (505) 247-1750-tel. (505) 247-1753-fax www.mrcog-nm.gov Transportation
Mid-Region Metropolitan Planning Organization Mid-Region Council of Governments 809 Copper Avenue NW Albuquerque, New Mexico 87102 (505) 247-1750-tel. (505) 247-1753-fax www.mrcog-nm.gov Transportation
Moving Ahead for Progress in the 21 st Century Act (MAP-21) And Beyond
 And Beyond") Moving Ahead for Progress in the 21 st Century Act (MAP-21) And Beyond Janet Oakley Director of Director of American Association of State Highway and Transportation Officials MAP-21Key highlights Funding
Moving Ahead for Progress in the 21 st Century Act (MAP-21) And Beyond Janet Oakley Director of Director of American Association of State Highway and Transportation Officials MAP-21Key highlights Funding
CHAPTER 2. VISION, GOALS AND MTP FRAMEWORK
 CHAPTER 2. VISION, GOALS AND MTP FRAMEWORK MTP VISION In order to create a framework for the 2040 Metropolitan Transportation Plan (MTP), a vision statement was drafted by the Vision/Goals Committee and
Freight and Rail Stakeholder Webinar. January 7, 2014
 Freight and Rail Stakeholder Webinar January 7, 2014 Agenda Modal Needs Baseline Revenue Modal Scenarios Website Statewide Freight Plan Statewide Rail Plan Jeff Carroll MULTIMODAL TRANSPORTATION NEEDS
WTP Phase 2 Implementation & Freight System Plan
 WTP Phase 2 Implementation & Freight System Plan Tribal Transportation Planning Organization Kathy Murray Planning Studies Group; Multimodal Planning Division Jason Beloso, Strategic Planning Manager;
Transit, Intercity Bus, Taxi 8-1
 8-1 Introduction Public transit is a critical element of any transportation system. It both provides an alternative form of transportation to the traditional use of the automobile and provides mobility
Summary of transportation-related goals and objectives from existing regional plans
 SMTC 2050 Long Range Transportation Plan Appendix A: Summary of transportation-related goals and objectives from existing regional plans SMTC 2050 Long Range Transportation Plan Summary of transportation-related
TRANSPORTATION PLAN Donald Vary
 LOUISIANA STATEWIDE TRANSPORTATION PLAN Donald Vary March 2, 2016 AGENDA Plan Development Decision-Making Process Outreach Activities Vision and Goals Transportation Needs Financial Analysis (revenue scenarios
MPO/RPO Briefings. MPO/RPO Briefing. Briefing Topics Plan framework o NCDOT Policy to Projects process o Relationship to local/regional plans
 7/7/2011 MPO/RPO Briefings July 2011 MPO/RPO Briefing Briefing Topics 1. 2040 Plan framework o NCDOT Policy to Projects process o Relationship to local/regional plans 2. Study process o Schedule o Public
AASHTO Summary and Analysis of the Developing a Reliable and Innovative Vision for the Economy (DRIVE) Act August 28, 2015
 Act August 28, 2015") AASHTO Summary and Analysis of the Developing a Reliable and Innovative Vision for the Economy (DRIVE) Act August 28, 2015 OVERVIEW On July 30, 2015, led by Majority Leader Mitch McConnell (R-KY) and Environment
AASHTO Summary and Analysis of the Developing a Reliable and Innovative Vision for the Economy (DRIVE) Act August 28, 2015 OVERVIEW On July 30, 2015, led by Majority Leader Mitch McConnell (R-KY) and Environment
ONE NEVADA TRANSPORTATION PLAN The Nevada Department of Transportation s Long-Range Transportation Plan
 Executive Summary The s Long-Range Transportation Plan SAFETY, INFRASTRUCTURE, MOBILITY, ECONOMY, SUSTAINABILITY, COMMUNITY This Plan is Our Plan! A Transportation Plan by Nevadans, for Nevada How safely,
ACTIVE TRANSPORTATION ADVISORY COMMITTEE. Memphis MPO March 30, 2015
 ACTIVE TRANSPORTATION ADVISORY COMMITTEE Memphis MPO March 30, 2015 Agenda Welcome & Introductions Announcements and Briefings Livability 2040: Regional Transportation Plan Congestion Management Process
Performance Measures Workshop, May 18, 2017
 Measuring What Matters: Above and Beyond Requirements Performance Measures Workshop, May 18, 2017 Presentation Overview Background - origin and evolution of the Regional Outcomes Framework. Regional Outcomes
Alternatives Analysis, New Starts
 Alternatives Analysis, New Starts E. Beimborn, University of Wisconsin-Milwaukee 1 Outline Overview The process at the local level FTA new starts process Project justification Financial rating Forecasting
WTP 2035 DRAFT STRATEGIES AND ACTIONS
 INTRODUCTION This Working Paper presents draft strategies and actions to be considered for inclusion in the draft Washington Transportation Plan 2035. It includes reference to the existing WTP 2030 strategies
AASHTO Policy Papers Topic IX: Freight
 1 AASHTO Policy Papers Topic IX: Freight Approved 4/22/02 IX-1. The U.S. DOT and AASHTO should jointly sponsor development of a freight planning capacity building process. Up to $10 million annually should
The Metropolitan Transportation Plan. Public Meetings February 2016
 The Metropolitan Transportation Plan for North Central Texas Public Meetings February 2016 Presentation Agenda Mobility 2040 Draft Recommendations RTC Policy Bundle Concept Transportation Improvement Program
GOALS AND PERFORMANCE MEASURES
 PLANNING FRAMEWORK The planning framework guides the development of the Regional Transportation Plan, articulating what the region is trying to achieve. This chapter establishes a foundation to focus data-gathering
Appendix S. Monitoring Performance. Monitoring Performance. Appendix Contents
 Appendix S Monitoring Performance Appendix Contents Monitoring Performance Monitoring Performance San Diego Forward: The Regional Plan builds upon and combines elements from the SANDAG 2050 Regional Transportation
Regional Performance Measures Annual Progress Report TPO Board - 2/4/2016 Presentation by: Chris Wichman, Senior Planner
 2015 TPO Board - 2/4/2016 Presentation by: Chris Wichman, Senior Planner Overview History and definition of performance-based planning & programming Review of 2015 TPO Board Action Requested 2 History
UNIFIED PLANNING WORK PROGRAM FISCAL YEAR 2014
 UNIFIED PLANNING WORK PROGRAM CORPUS CHRISTI URBAN TRANSPORTATION STUDY FISCAL YEAR 2014 APPROVED BY THE TRANSPORTATION POLICY COMMITTEE ON AUGUST 1, 2013 This report was funded in part through grant[s]
1 I N T R O D U C T I O N
 THE 2040 OKI REGIONAL TRANSPORTATION PLAN This is the metropolitan transportation plan for the Ohio-Kentucky-Indiana Regional Council of Governments (OKI). OKI is the federally designated regional transportation
CHAPTER 3 THE BUILDING BLOCKS POLICIES AND SUPPORTIVE STRATEGIES REGIONAL TRANSPORTATION PLAN/SUSTAINABLE COMMUNITIES STRATEGY
 CHAPTER 3 THE BUILDING BLOCKS POLICIES AND SUPPORTIVE STRATEGIES REGIONAL TRANSPORTATION PLAN/SUSTAINABLE COMMUNITIES STRATEGY CHAPTER 3 THE BUILDING BLOCKS POLICIES AND SUPPORTIVE STRATEGIES INTRODUCTION
Federal-aid 101 A Financial Overview. Mark Newland FHWA, Financial Manager Purdue Road School, 2014
 Federal-aid 101 A Financial Overview. Mark Newland FHWA, Financial Manager Purdue Road School, 2014 Objectives for Federal-aid 101 Provide an Overview of: What federal-aid funding is and where it comes
Freight Provisions in the FAST ACT
 Freight Provisions in the FAST ACT F I X I N G A M E R I C A S S U R FA C E T R A N S P O R TAT I O N A C T H. R. 2 2. E N R O L L E D D E C E M B E R 4, 2 0 1 5 I N I T I A L R E V I E W FAST Act 5 year
Notice Cover photos:
 Notice This document is disseminated under the sponsorship of the United States Department of Transportation in the interest of information exchange. The United States Government assumes no liability for
Notice Cover photos:
 Notice This document is disseminated under the sponsorship of the United States Department of Transportation in the interest of information exchange. The United States Government assumes no liability for
1: INTRODUCTION AND PROCESS OVERVIEW
 GPATS Long-Range Transportation Plan 1: INTRODUCTION AND PROCESS OVERVIEW INTRODUCTION affects everyone in many ways and plays a critical role in shaping a region s physical and social infrastructure.
TEXAS FREIGHT MOBILITY PLAN. Greater Houston Freight Committee Kick-Off Meeting
 TEXAS FREIGHT MOBILITY PLAN Greater Houston Freight Committee Kick-Off Meeting July 11, 2016 Overview of Texas Freight Mobility Plan The Freight Plan is TxDOT's first multimodal transportation plan that
Navajo Nation. Thursday September 22, :30 pm 3:15 pm. Arizona Department of Transportation Planning and Funding Processes
 Navajo Nation 2 nd Annual Agency Roads Committee Summit Arizona Department of Transportation Planning and Funding Processes Thursday September 22, 2011 1:30 pm 3:15 pm Sky City Conference Center Acoma
EXHIBIT A SCOPE OF SERVICES FOR MODAL DEVELOPMENT (MD) SUPPORT - CONTINUING. Financial Project Nos
 SUPPORT - CONTINUING. Financial Project Nos") EXHIBIT A SCOPE OF SERVICES FOR MODAL DEVELOPMENT (MD) SUPPORT - CONTINUING Financial Project Nos. 411461-1-12-10 422799-2-12-12 FLORIDA DEPARTMENT OF TRANSPORTATION DISTRICT SEVEN Revised: 07/16/18 07/10/18
EXHIBIT A SCOPE OF SERVICES FOR MODAL DEVELOPMENT (MD) SUPPORT - CONTINUING Financial Project Nos. 411461-1-12-10 422799-2-12-12 FLORIDA DEPARTMENT OF TRANSPORTATION DISTRICT SEVEN Revised: 07/16/18 07/10/18
Regional Mobility Authorities in Texas
 Regional Mobility Authorities in Texas Testimony of Ginger Goodin, P.E., Senior Research Engineer and Director, TTI Transportation Policy Research Center John Overman, Research Scientist for Transit Mobility
U.S. Chamber of Commerce Recommendations to Congress Regarding SAFETEA-LU Reauthorization
 U.S. Chamber of Commerce Recommendations to Congress Regarding SAFETEA-LU Reauthorization Page 1 Defining the National Interest and the Federal Role The U.S. Chamber of Commerce believes that federal transportation
RTC Mobility Plan Workshop. North Central Texas Council of Governments July 9, 2015
 RTC Mobility Plan Workshop North Central Texas Council of Governments July 9, 2015 Agenda 1. Introduction to the Metropolitan Transportation Plan (MTP) 2. New Planning Parameters 3. Emerging Planning and
TRANSPORTATION TRANSPORTATION 9-1
 TRANSPORTATION Community Vision 2028 Because we place such high value on our natural surroundings, we responsibly plan for, manage, and mitigate the impacts of growth on those surroundings. Kezziah Watkins
Development and content of the transportation improvement program (TIP).
.") Code of Federal Regulations e-cfr data is current as of August 5, 2016 Title 23 Chapter I Subchapter E Part 450 Subpart C 450.326 Title 23: Highways PART 450 PLANNING ASSISTANCE AND STANDARDS Subpart C
Code of Federal Regulations e-cfr data is current as of August 5, 2016 Title 23 Chapter I Subchapter E Part 450 Subpart C 450.326 Title 23: Highways PART 450 PLANNING ASSISTANCE AND STANDARDS Subpart C
Final Congestion Management Process
 Final Congestion Management Process 2015 Prepared by Tulare County Association of Governments 210 N. Church St., Suite B Visalia, California 93291 1. Introduction: What Is Congestion? Congestion can generally
Chapter #9 TRAVEL DEMAND MODEL
 Chapter #9 TRAVEL DEMAND MODEL TABLE OF CONTENTS 9.0 Travel Demand Model...9-1 9.1 Introduction...9-1 9.2 Overview...9-1 9.2.1 Study Area...9-1 9.2.2 Travel Demand Modeling Process...9-3 9.3 The Memphis