New Bedford Business Development Study and Commodity Analysis
|
|
|
- Joella Marsh
- 6 years ago
- Views:
Transcription


1 New Bedford Business Development Study and Commodity Analysis Submitted by July 20, 2011
2 Table of Contents Selected New England Port Export Profile 5 Goods 8 Shippers 9 Ports of Arrival 10 Waste Paper Destination Analysis 10 Pulp and Paper Destination Analysis 10 New Bedford Export and Import Breakdown 12 New Bedford Cargo Volumes in New Bedford Ship and Freight Summary 19 Critical Recent Years, Historic Freight and Vessel Call Data 26 Port Cost Comparison 27 Freight Rail Connections 28 Role of Rail in Development of Small to Medium Size Ports 30 Rail Components Required for Efficient Marine/Rail Interface 30 New Bedford Connections to the National Rail Network 31 Rail Right of Way Clearances 35 Economic Impacts of Freight Railyard Operations in New Bedford 36 Development Potential 36 Demand for Rail Freight Infrastructure in New Bedford 38 Commodity Handling Potential 40 Port Opportunity Analysis 41 Glossary 47
3 Port of New Bedford Business Development Plan and Commodity Analysis HDR Engineering, Inc. (HDR) examined the general status of the New England international cargo market as a potential indicator of commodity-handling opportunities for the Port of New Bedford. The research focused on what goods are most prevalent, where the goods are being shipped to, who the largest shippers are, and how the goods are being shipped. All record keeping of freight exports is based on bills of lading and the records produced in accordance with the public reporting requirements of the U.S. government, specifically the Census Bureau and U.S. Customs and Border Protection. General port data is also collected and maintained by the U.S. Army Corps of Engineers. These data sources are the only consistent means of volume analysis for U.S. Ports. This information, however, does not capture the commodities or products produced in the New England region that are being transported to domestic ports outside of the region for export. Typically, the point of origin for freight leaving the U.S. is recorded and credited to the port where the cargo is exported. As a result, it is difficult to track the freight to its exact point of origin. Regardless, it is likely that New England shippers are using New England ports whenever cost-effective and efficient, for at least a portion of their freight. It should be noted that most of the cargo originating in or destined for New England is moving by rail or truck to seaports outside of the region. Rail and truck transportation are the major competitors to ports in New England, as rates can be more cost-effective for shippers when considering the total cost of moving commodities. In order for New England ports to be more competitive, they either need waterborne feeder options or direct services, as is the case with Boston or the break bulk services that exist throughout New England. Ports are often categorized by the type of cargo and direction of throughput that constitutes their highest volume of shipments. Optimally, ports should have a diverse mix of different cargoes and as close to an equal balance of imports and exports as possible. A diverse cargo base compensates for cycles in supply and demand requirements for individual commodities. A balance of imports and exports reduces a shipper s repositioning costs for equipment such as containers, or a vessel s operating costs, which is passed onto the shipper, if there is no subsequent cargo. New England ports handle far more imports than exports, causing them to be categorized as unbalanced and import-based. The available public data, from which such assumptions are drawn, does not always present an accurate profile of the type or amount of cargo being handled. For example, in regard to exports, ports such as Portland, ME or Davisville, RI may not appear to be of much significance. Portland imports over 23,000,000 metric tons of petroleum products annually, making it the largest foreign import transit port in the United States. Since most of the cargo is destined, by pipeline, for Canada, Portland is classified as primarily a petroleum port. This far overshadows the 3.9 million tons of pulp and paper products exported by container last year which some consider more significant on account of the direct and indirect employment generated by that freight. In contrast, Davisville imports and processes nearly 125,000 new automobiles each year. Although their facilities are capable of handling many other commodities, the port does not have any significant imports other than automobiles or any export, which classifies it as a niche import cargo port. This often limits a ports market potential, as it has with Portland and Davisville, due to market perception. 1
4 New England ports have attracted a wide range of cargoes because of cost and efficiency advantages to the shippers. A profile of various prominent import and export cargo movements by geographic location indicated the following: Boston, MA: Manufactured goods, non-metal minerals, equipment/machinery, chemicals, automobiles, pulp and paper Bridgeport, CT: Sand and gravel, chemicals, bananas Chelsea River, MA: Non-metal minerals, chemicals, refined petroleum products Eastport, ME: Pulp and paper waste, seafood Fall River, MA: Chemicals, refined petroleum products Mystic River, MA: Iron and steel scrap, fabricated metal products, non-metal minerals, machinery New Bedford, MA: Sand and gravel, agricultural produce, seafood, refined petroleum products New Haven, CT: Chemicals, refined petroleum products, iron and steel scrap, non-metal minerals, sand and gravel New London, CT: Lumber, copper, steel Norwalk, CT: Sand and gravel Portland, ME: Refined petroleum, crude oil, clay, non-metal minerals, pulp and paper, manufactured goods Portsmouth, NH: Non-metal minerals, gypsum, scrap metal Providence, RI: Iron and steel scrap, non-metal minerals, concrete and cement, chemicals, steel Quonset Point/Davisville, RI: Automobiles Rockland, ME: Concrete and cement Salem, MA: Household goods (HHG) Searsport, ME: Non-metal minerals, chemicals, gypsum Town River, Quincy, MA: Vegetable oil Weymouth, MA: Chemicals Excluding petroleum and coal, which represent both significant domestic moves and specialized handling, the total tonnage of commodities moving through New England ports are represented in the following graph by state. Overall, Massachusetts ports, due primarily to the Port of Boston, handle the largest amount of tonnage for the range of commodities indicated earlier. 2
5 12,000,000 New England Ports by State, Total Commodities Excluding Petroleum and Coal 10,000,000 8,000,000 Annual Short Tons 6,000,000 4,000,000 CT Ports MA Ports NH-ME Ports RI Ports 2,000, Source: US Army Corps of Engineers, Waterborne Commerce Statistics Center; Part 1 Tons Direction/Year Calendar Years ; March Prepared by FXM Associates. Figure 1 New England Port Cargo Tonnages 2008 The handling of dry bulk commodities is also significant for New England ports. For example, seasonal commodities, such as road salt used by state and municipal agencies during the winter, are delivered year round to provide enough of a stockpile in winter so that if demand is higher due to weather conditions, the agency is prepared to handle it. The commodity is handled either in several selected New England ports, or moved by rail from New York, Canada, or other domestic sources into parts of the region where it is redistributed by truck to public entities. Demand for land and terminal space is becoming more significant in larger ports driving up the cost of handling dry bulk commodities. In addition, long haul rail and truck transportation costs are increasing. Shippers are looking to move commodities in the most cost-effective means possible between origin and destination points. All-water transportation with deliveries to the nearest accessible port area reduces the overall cost shippers and consignees, including municipal and other public agencies. 3
6 Dry Bulk Tons by Port (Short Tons) 6,000,000 1,000, ,000 5,000, ,000 4,000, , ,000 3,000, , ,000 2,000, ,000 1,000, Source: US Army Corps of Engineers, Waterborne Commerce Statistics Center; Part 1 Tons Direction/Year Years Prepared by FXM Associates. 200, ,000 0 Boston Providence New Haven Portland Bridgeport Searsport New Bedford New London Figure 2 Dry Bulk Tonnages by Port in New England In evaluating the profile of the Port of New Bedford for 2008, as compared with available federal data, the port has a range of commodities that it handles that is consistent with the rest of New England. The port has a variety of facilities, some of which are ideally suited to handling specific types of freight, and others that are far more flexible. The critical elements in developing revenue-generating facilities are their adaptability to a wide range of changing market demands, flexibility on the terminal site, and no limiting infrastructure. The recently announced plans to develop the South Terminal for the processing of wind turbine components will provide the port with a new and usable facility that will outlast the construction and installation of the Cape Wind project. A financial analysis completed for Mass Energy Cooperative as part of their study of port facilities by FXM Associates for offshore wind projects indicated that the South Terminal facility could generate enough commerce outside of the wind energy industry to sustain the facility. Along with the other existing public and private facilities in the port, the Port of New Bedford can develop a diversified cargohandling base that would provide the port with a wide range of capabilities to handle different types of commodities. Critical to this mix would be the ability to develop a throughput balance with increased exports. The port needs to identify and take advantage of opportunities that complement its higher-value imports. 4
7 New Bedford handles an estimated $230 million in cargo annually, consisting of mostly bulk and break bulk commodities, totaling 345,423 short tons. Approximately 9% of the total cargo handled cargo is international. Commodity Note Total-Short Tons Domestic Foreign Total 345, ,895 27,528 Petroleum 1 74,269 74,269 0 Chemicals 2 2, ,505 Crude Materials 3 240, ,428 0 Manufactured Goods Food-Farm Products 5 23, ,154 Machinery 6 3,213 3, Other 7 1, ,839 Notes: 1.Gasoline, Kerosene, Distillate Fuel Oil 2.Sodium Hydroxide 3.Sand and Gravel 4.Smelted Products 5.Fish (not shellfish), Vegetables, Fruits, Nuts, Food Products 6.Machinery, Manufactured Wood Products 7.Unknown or otherwise not classified. Figure 3 Port of New Bedford Cargo Tonnages by Commodity Despite New England s balance of moves favoring imports, exports are still significant. The largest volume of exports from New England consist of scrap metal, used automobiles, waste paper, pulp and paper products, cattle hides, furs and frozen seafood. New England also exports cargo with high value proportional to their volume, including medical Instruments, computers, pharmaceutical products, electric machinery, semiconductors, and similar commodities; however, these types of cargo do not generally travel by water. As an indicator, HDR looked at the smaller volumes of various commodities moving through the Port of Boston, which provides a sample profile of the New England market as a whole and what opportunities may exist for export that New Bedford may attract. The Port of Boston represents the only major containerized ocean carrier shipping option in New England. This does not, however, represent the total volume of New England exports or the potential export opportunity. As an example, Boston handled 9,341 TEU s of pulp and paper products last year. That is less than 5% of the estimate of the full export capacity of the pulp and paper industry in the State of Maine alone. This indicates that Maine pulp and paper mills are finding other ports from which to export their product approximately 95% of the time. As an example, pulp and paper is moved by rail to the Port of New York and New Jersey where it is transloaded into containers for export. Due to potentially lower transload costs in New Bedford, as well as heavy weight rail access and faster turnaround on rail equipment, there exists a potential opportunity for developing containerized New Bedford exports connecting via all-water service on the marine highway system to several larger hub ports. Selected New England Port Export Profile To provide a comparative base, export data for eight (8) selected New England ports was collected. The ports were selected based on volume of exports and availability of data. Dollar values were estimated based on claimed value as available from Bills of Lading. It should be noted, however, that monetary values are incomplete as Customs does not 5
8 publish all of the collected values due to Privacy of Information Rulings in 19 CFR Part 103; volumes tend to be more complete and less prone to sampling errors since they can be cross verified over multiple sources. The eight (8) selected ports represent the majority of all exports out of all New England ports and provide a basis for analysis of the New England export market as a whole. This analysis does not fully cover what is being produced in New England or the full market potential as it is based on data covering what has moved through these various ports. A total of 28,889 shipments was exported from the eight (8) highlighted New England ports over the course of The total estimated value of these shipments was approximately $10,097,253,000. The data shows that 15,689 of these shipments, valued at approximately $7,230,963,000, were not containerized and were moved as bulk or roll-on/roll-off (RO-RO) cargo. This comprises 54% of the total number of shipments and 72% of the total value of shipments. An analysis of the data suggests that this proportion favors non-containerized methods of transporting cargoes. The total value of the exported cargo is likely higher, as 1,855 or 6% of the shipments that were analyzed do not have a listed value. While it is possible that some of these shipments do not have monetary value, such as containers that are being repositioned to Asia, the data suggests that the majority of these shipments are valuable. Thus, the total value of New England export shipments shown above, based on the available data, can be considered conservative. This indicates that there may be a larger market opportunity available for New Bedford. A breakdown of the value and composition of shipments exported from the eight (8) indicated New England ports shows the following for calendar year 2009: Boston, MA a. Total value of shipments: $7,007,606,000. b. Total amount of containerized freight: 54,649 TEUs. c. Composition: Primarily used cars and waste paper (based on number of shipments) and scrap metal (based on value of shipments). d. Waste paper is approximately 23,974 TEUs of containerized export out of Boston. e. Pulp and paper constitutes 9,341 TEU s of containerized export. Eastport, ME a. Total value of shipments: $58,902,000. b. Total amount of containerized freight: None, all freight was shipped in bulk. c. Composition: Primarily wood pulp and seafood New Haven, CT a. Total value of shipments: $143,250,000. b. Total amount of containerized freight: None, all freight was shipped in bulk, c. Composition: Scrap metal and refined petroleum products. Portland, ME a. Total value of shipments: $3,791,000. b. Total amount of containerized freight: A containerized barge service between Portland and the Port of New York and New Jersey operated during the The service handled 4,760 TEU's of pulp on the barge service from Portland in The service was suspended in September of c. Composition: Pulp and paper products, manufactured goods. Portsmouth, NH a. Total value of shipments: $110,832,000. 6
9 b. Total amount of containerized freight: None, all freight was shipped in bulk. c. Composition: Scrap metal. Providence, RI a. Total value of shipments: $2,767,059,000. b. Total amount of containerized freight: None, all freight was shipped in bulk. c. Composition: Scrap metal d. Two shipments of over $1 billion each were listed being exported to Turkey from Providence. Based on the reported high value, it is likely that the material being exported was low weight and high value such as copper, tin or titanium. Salem, MA a. Total value of shipments: $5,813,000. b. Total amount of containerized freight: 140 TEU s. c. Composition: Household goods (HHGs) bound for Bermuda handled by a single carrier. New Bedford, MA a. Total value of shipments: $10,394,766. b. Total amount of containerized freight: None, all freight was shipped in bulk. c. Composition: Agricultural products, HHG s, bulk. Port Estimated Value of Volume of Containerized Freight Composition Shipments (in USD) (in TEUs) Boston, MA $ 7,007,606,000 58,649 Used Cars, Waste Paper, Scrap Metal Eastport, ME $ 58,902,000 All Bulk Seafood and Wood Pulp New Haven, CT $ 143,250,000 All Bulk Scrap Metal and Fuel Portland, ME $ 3,791,000 All Bulk Pulp & Paper Products Portsmouth, NH $ 110,832,000 All Bulk Scrap Metal Providence, RI $ 2,767,059,000 All Bulk Scrap Metal Salem, MA $ 5,813, HHGs New Bedford $10,394,766 All Bulk HHG s, Agricultural, bulk Figure 4 Export Commodities and Values for Selected New England Ports 7
10 Goods A wide variety of goods is being exported by New England ports. The majority of these export shipments are used cars, exported by a variety of shippers, constituting well over 16,000 of the nearly 29,000 shipments examined. The total value of these shipments was approximately $300,933,000. Proportional to the total value of shipments, however, the total value of all the used car shipments is very small, comprising only 3% of the total value of New England s exports. These shipments are shipped RO-RO and are originating almost exclusively in Boston. Lumber, Pulp, & Paper Products Used Cars Scrap Metal Other Figure 5 Goods by Number of Shipments Scrap metal comprises the majority of the value of shipments from New England ports. The total value of scrap metal shipments from New England ports was approximately $7,188,372,000, and accounted for 1,350 shipments. This means that scrap metal accounts for 71% of the total value of New England exports, but only 5% of the total number of shipments. The bulk of the value of scrap metal shipments is accounted for by four (4) shipments of scrap metal, two (2) originating in Boston and two (2) originating in Providence, whose combined value is approximately $6,474,715,000. If these shipments are written off as outliers (i.e., data that are so extreme that they skew the results of this analysis), scrap metal still comprises 20% of the remaining export market more than twice that of its closest competitor, used cars. Lumber, Pulp, & Paper Products Used Cars Scrap Metal Other Figure 6 Goods by Estimated Value The remainder of the export market is comprised of wood pulp, paper, waste paper, lumber, seafood, electronics, household goods, animal hides and furs, plastics, and food items, to name a few. None of these items constitutes a 8
11 large enough value to be statistically relevant on an individual basis, but taken collectively, they constitute about a quarter of both the total value and the total number of shipments of exported goods from New England ports. Being that Boston is the only major container port in New England, it has the largest diversity of exported items, thus giving the best example of what potential markets exist in New England for export. Figure 7 illustrates the breakdown of Boston-based containerized exports by commodity type (ranked by how many TEUs each commodity commands). Waste Paper Pulp & Paper Products Cattle Hides Lumber & Timber Seafood Used Cars Other Figure 7 Boston Exports by Commodity Shippers In terms of number of shipments generated by each shipper, no single shipper dominates the market. There is a wide distribution of shippers for each of the commodities being shipped and all of the shippers exclusively handle used cars. The largest shippers, in terms of number of shipments generated, included the following: Swiss Shipping Lines, generating 2,159 shipments Global Auto LLC, generating 899 shipments Golden Trust Shipping, generating 878 shipments The Sallaum group, generating 833 shipments MGM Global Trading, generating 822 shipments In terms of value of shipments generated, the market is dominated by Schnitzer Steel, which generated 42 shipments with a combined total value of approximately $5,393,483,000. Their freight was comprised entirely of scrap metal, which was all shipped in bulk. Schnitzer has some of their own port facilities in Providence, RI, Everett, MA and Portland, ME; however, they also have six (6) facilities in New Hampshire and one in Massachusetts that are inland. 9


12 Ports of Arrival The vast majority of export shipments from New England arrived in Cotonou, Benin, which is located on the west coast of Africa. A total of 8,180 of the 28,889 export shipments arrived in Cotonou, representing 28% of total outbound cargo. The shipments all originated in Boston, and were overwhelmingly, although not exclusively, comprised of used cars. The next most significant destination for export cargo was Beirut, Lebanon, where 3,895 shipments or 13% of the total outbound cargo arrived, again comprised primarily of used cars. Antwerp, Belgium was the third largest destination with 2,481 shipments, or 9% of the total. The goods arriving in Antwerp were widely distributed, including wood pulp and paper products, electronics, household goods, seafood, animal hides and furs, used cars, and scrap metal. The majority of these goods were destined for other countries after arriving in Antwerp. Waste Paper Destination Analysis The waste paper market out of Boston is a potential opportunity. More than 78% of the waste paper leaving Boston is destined for China. The next most common destination countries are Belgium and Germany, each representing about 4 percent of the total volume of wastepaper exported. The largest shippers for this outbound wastepaper are American Chung Nam, generating 32 percent of the volume of waste paper; Potential Industries, Inc, with 21 percent; and JC Horizon Limited with 7 percent. The three largest ports of arrival are Shanghai (5,372 TEUs), Qindao (3,749 TEUs), and Bremerhaven (3,553 TEUs). Shanghai Qindao Bremerhaven Antwerp Ningpo Hong Kong Taicang Valencia Other Figure 8 Waste Paper Destinations from Boston Pulp and Paper Destination Analysis Japan was the most popular destination country for containerized paper products, commanding over two-thirds (71%) of the total volume of pulp and paper products exported from New England ports. China was the next most popular with 10%, followed in turn by Korea, with 4%. Sea Trade International was the most common shipper, generating 76% of the shipments of pulp and paper products out of New England ports. They were followed by SD Warren Co., with 7%, and Newport CH International, with 4%. The most popular ports for pulp and paper were Tokyo (1,394 TEUs), Osaka (1,102 TEUs), and Nagoya (746 TEUs). 10

13 Nearly 300,000 short tons of wood pulp were exported out of Eastport, ME in For the most part, this product shipped in bulk and was sent to Northern China and Japan. Eastport is an example of a port with one significant paper mill nearby providing consistent bulk exports. Most other mills in New England are not as favorably situated and are having difficulty finding competitive access into export markets. Profit margins are very low for exported pulp and higher cost transportation has limited export opportunities for the production facilities. There is a significant amount of available production capacity in the New England pulp and paper mills that could be utilized for increased and profitable production if lower cost transportation services were available. The chart below illustrates that Sea Trade International is handling the majority of containerized pulp and paper out of Boston. While this is a significant percent of the Boston pulp and paper market, it is still a small amount of the New England pulp and paper export market as a whole. A significant amount of pulp and paper is being railed and trucked out of New England to other ports for export. Assuming that Sea Trade International is a significant exporter of New England pulp and paper products in other ports as well, it may be a good idea to evaluate what potential opportunities exist with the company. Their information can be found at: Their Secaucus, NJ office is handling most of their North American pulp and paper exports. Yachun Wu is the President and can be reached at This, again, does not represent all of the pulp and paper leaving New England; it is merely all of that which is leaving New England via New England ports. Sea Trade International Newport CH International Omya Incorporated Other SD Warren Co Belsun Corporation K-C Internationl LLC Figure 9 Pulp & Paper Export Shippers via Boston 11

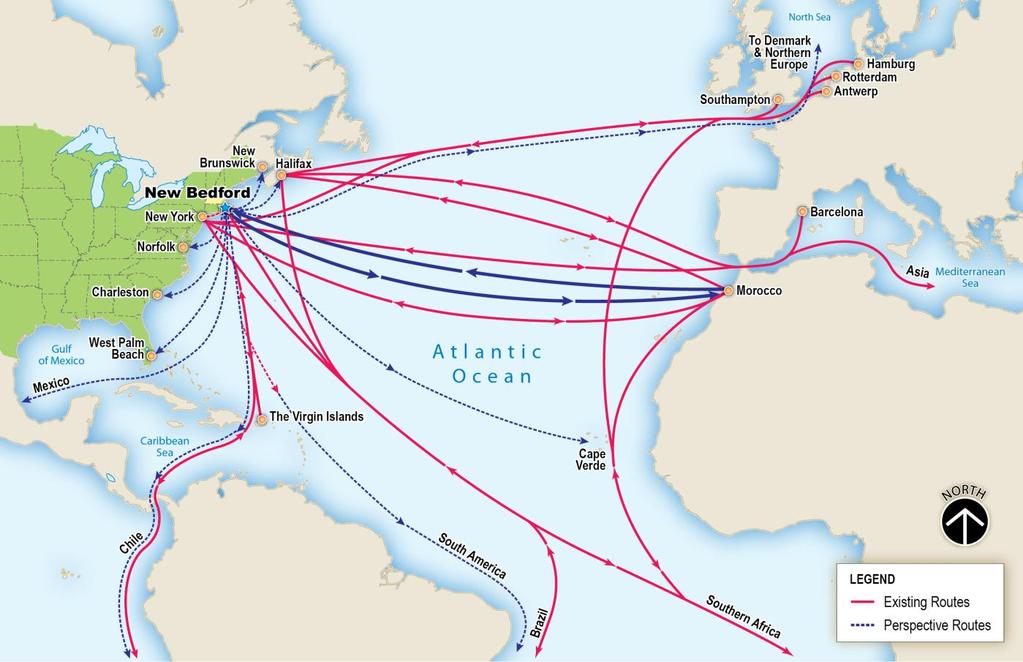
14 New Bedford Export and Import Breakdown New Bedford freight traffic is primarily comprised of domestic inbound and outbound freight, which is freight going to or coming from other ports in the U.S. This freight accounts for about 90% of the total freight moved through the Port of New Bedford. The port handles a small amount of international export tonnage annually, which is primarily break bulk cargo and consists mostly of fresh and frozen fish, such as herring, bound for northern Europe and household goods (HHG) bound for Cape Verde and Africa. Foreign import traffic rounds out the remainder of the New Bedford freight picture, with 27,528 short tons in The Port of New Bedford, however, handles the largest amount of foreign import tonnage of perishable agricultural commodities in New England. Most of the product, consisting of North African (Morocco) fruit, is handled break bulk and the port averages around 25 purpose built refrigerator ship calls, commonly called reefer ships, annually. Foreign import traffic, including fruits and nuts, totals over 20,300 short tons or 73% of the total foreign freight. Domestic Inbound - 45,989 Domestic Outbound - 265,970 Foreign Imports - 27,528 Figure 10 New Bedford Freight 2008 (Short Tons) In considering cargo prospects for New Bedford, the valuable marine fisheries trade needs also to be considered. In looking at imports and exports, marine fisheries statistics are not accounted for given that the fish is sourced or hunted locally and landed and is then processed in one form or another prior to its next evolution in the supply chain. The processed fish and products were considered in the export statistics used to analyze what is departing from New England ports. For example, Boston exported 1,459 TEU s of mostly frozen seafood in The total value of these exports was just over $32 million. New Bedford landed million pounds of seafood in 2008 valued at $241.3 million according to the NOAA U.S. Commercial Fishery Landings, If all of Boston s seafood traffic originated in New Bedford, it would only have handled 13% of New Bedford s catch. This indicates that while New Bedford has a significant resource in its fisheries, the majority of the catch is either being consumed domestically or transported over land to ports outside of New England for export. The majority of New Bedford large ship traffic is domestic outbound sand and gravel, with 240,428 short tons in This commodity alone accounts for 70% of all of the freight volume that moves through the Port of New Bedford. According to the Army Corps of Engineers Waterborne Commerce Statistics, there were minimal exports from New 12
15 Bedford in The only measurable foreign commerce passing through New Bedford in 2008 was the imported freight, as stated previously. Sand & Gravel - 240,428 Petroleum - 22,765 Manufactured Wood Products - 1,820 Machinery Figure 11 Total Outbound Freight 2008 (short tons) Petroleum dominates the inbound traffic in New Bedford, with 45,568 short tons in Fruits and nuts make up a substantial import volume with 20,300 short tons. The chart below illustrates the inbound volumes for New Bedford, not including marine fishery landings. Commodities marked with FI indicate Foreign Imports. Petroleum - 45,568 Sodium Hydroxide - 2,505 (FI) Manufactured Goods - 30 (FI) Fruit and Nuts - 20,300 (FI) Other food products - 2,854 (FI) Machinery Not categorized - 1,839 (FI) Figure 12 Total Inbound Freight 2008 (short tons; FI = Foreign Import) 13
16 The following is a breakdown of foreign import commodities handled for 2008 in the port. The table compares the foreign import tonnages to total cargo handled in New Bedford for 2008 and excludes domestic cargos. Commodity Note Total-Short Tons TOTAL PORT TONNAGE All 345,423 Total International 28,000 Petroleum 1 0 Chemicals 2 3,000 Crude Materials 3 0 Manufactured Goods 4 0 Food-Farm Products 5 23,000 Machinery 6 0 Other 7 2,000 Notes: 1. Gasoline, Kerosene, Distillate Fuel Oil 2. Sodium Hydroxide 3. Sand and Gravel 4. Smelted Products 5. Fish (not shellfish), Vegetables, Fruits, Nuts, Food Products 6. Machinery, Manufactured Wood Products 7. Unknown or not classified Figure 13 Port of New Bedford Import Tonnage by Commodity
17 Similar to exports, a profile for the imports passing through the Port of Boston provides a profile of commodities that are moving into the New England region. Unique to Boston is the large amount of containerized cargo handled on multiple direct call ocean carrier services from Asia and Europe; mostly, but not exclusively, at Massachusetts Port Authority (Massport) facilities. Containerized Cargo Units Volume Containerized Imports Metric Tons 1,000,000 Containerized Exports Metric Tons 540,500 TOTAL CONTAINERIZED TONNAGE Metric Tons 1,540,500 Containerized Imports TEU Loaded 100,000 Containerized Exports TEU Loaded 60,500 Empty Containers 43,500 TOTAL CONTAINERS TEU Loaded/Empty 204,000 Figure 14 Port of Boston Container Volume 2008 The Port of Boston has a wider range of bulk and neo-bulk import commodities that it handles at multiple facilities including those owned by Massport. Non-containerized bulk and neo-bulk commodities accounted for over 13.5 million tons of the total port tonnage, or nearly 85% of the cargo handled in Boston. Cargo Type Type/Unit Volume Short Tons Automobiles 27,000 Units Processed 32,000 Cement Liquid Bulk 162,000 Petroleum Liquid Bulk 7,500,000 Liquefied Natural Gas Liquid Bulk 2,750,000 Salt Dry Bulk 760,000 Gypsum Dry Bulk 31,000 Other Various 2,300,000 Total Non-Containerized Cargo Import 13,535,000 Figure 15 Port of Boston Import Volume
18 New Bedford Cargo Volumes in 2009 The charts and values below represent a comprehensive breakdown of New Bedford s marine freight for 2009, meant to provide a constructive comparison to the figures for 2008 provided above. It should be noted that the fruit and agricultural imports increased significantly (58%) from 20,300 short tons in 2008 to more than 35,000 short tons in The significance of this particular opportunity must be seen in relation to what efforts might be undertaken in order to take advantage of these cargoes to expand port volumes. Repositioning the port to modify its shipment mythology could allow New Bedford to capture more inbound refrigerated freight, which in turn would allow it to develop more of the outbound market of refrigerated/frozen seafood. This effort would focus on having the majority of agricultural imports arrive in reefer boxes on a container vessel, rather than by reefer ships themselves. This would then potentially position empty reefer boxes in New Bedford for the seafood market thus allowing for a potential two-way freight. Petroleum and Petroleum Products - Domestic - 48,911 Crude Materials, Inedible Except Fuels - Domestic - 21,000 Primary Manufactured Goods - Foreign - 17 Food and Farm Products - Foreign - 37,179 All Manufactured Equipment, Machinery - Domestic Unknown or Not Elsewhere Classified (Foreign) - 1,244 Fish Landings - 85,000 Figure 16 New Bedford Total Freight 2009 (USACE & NOAA) Figure 17 explains the breakdown of all freight moving through the Port of New Bedford, with the exception of Fish Landings. It is significant to note that the domestic traffic in and out of New Bedford is significantly greater than international moves at the port. The next two charts describe the breakdown of all inbound and outbound freight, once again with the exception of the fish landings. 16
 Inbound Freight Breakdown - CY 2009 (short tons) Petroleum and Petroleum Products - Domestic - 48,911 Crude Materials, Inedible Except Fuels - Domestic - 21,000 Primary Manufactured Goods -")
19 Freight Direction Breakdown CY 2009 (short tons) Domestic Inbound - 70,190 Domestic Outbound - 167,773 Foreign Imports - 37,215 Foreign Exports - 3,526 Figure 17 Freight Direction Breakdown CY 2009 (USACE) Inbound Freight Breakdown - CY 2009 (short tons) Petroleum and Petroleum Products - Domestic - 48,911 Crude Materials, Inedible Except Fuels - Domestic - 21,000 Primary Manufactured Goods - Foreign - 17 Food and Farm Products - Foreign - 37,179 All Manufactured Equipment, Machinery - Domestic Unknown or Not Elsewhere Classified (Foreign) - 1,244 Figure 18 New Bedford Inbound Freight Breakdown (USACE) The titles displayed in these charts are the U.S. Army Corps of Engineers derivations of the Standard International Trade Classification Codes. As petroleum is the largest inbound product, food and farm products is a more relevant focus area. As stated previously in this report, the lion s share of this line item is made up of imported foreign fruits and nuts. These are being imported primarily on reefer ships, and present an opportunity to transition to reefer containers, which can then be filled with seafood for outbound traffic. 17

20 Figure 19 illustrates that the vast majority of outbound freight from New Bedford is under the crude materials category. In New Bedford s case, this entire category is comprised of sand and gravel. This does not present an opportunity for containerization as sand and gravel are almost always exclusively shipped in bulk. Outbound Freight Breakdown CY 2009(short tons) Petroleum and Petroleum Products - Domestic - 24,384 Crude Materials, Inedible Except Fuels - Domestic - 141,984 Food and Farm Products - Foreign - 3,526 All Manufactured Equipment, Machinery - Domestic - 1,405 Figure 19 Outbound Freight Breakdown - CY 2009 (USACE) The effort by the port could be to increase foreign outbound in the food and farm products category (3,526 short tons 2009), which is entirely made up of outbound fish (not shellfish). This may require working closely with seafood processors in order to increase the volumes of outbound fish for export from the Port of New Bedford. 275,000, ,000, ,000, ,000, ,000, ,000, ,000, ,000, ,000, ,000, ,000,000 T2007 T2008 T ,000 84,000 82,000 80,000 78,000 76,000 74,000 72,000 70,000 68,000 66,000 Volume (short tons) Value (USD) Figure 20 New Bedford Fish Landing Volumes and Values (NOAA) 18
21 NOAA aggregates and provides the data for commercial marine fisheries. Specific data on the types of fish is not provided in the data. The difference in value versus volume in the above chart would indicate that New Bedford s catch fluctuates from year to year in terms of what fish are caught and their sales value. Working with New Bedford seafood processors would help to clarify what fish they primarily deal with and what opportunities exist for containerized or bulk fish outbound. New Bedford Ship and Freight Summary New Bedford developed in the same manner as many ports in the United States and in particular in a similar manner as most of the rest of the ports in New England. Historically, cargo flow developed around the natural resources available in the local region and expanded as more demand for international commodities began to increase. New Bedford is most noted for its whaling industry and the processing and export of whale-based products beginning in the 18 th century. In addition, fish landings and fish product exports were a substantial part of the growth of the port and the local economy. Historic records indicate the transportation of agricultural and general non-specific commodities through the port during this same period. The most significant change in commodity flow occurred in the late 19 th century when petroleum replaced whale oil as a lighting and cooking product. Cargo commodity type remained consistent through the transition from sail to steam, with the addition of manufactured goods in the later part of the 19 th century. The port saw a wide range of consumer products and manufactured goods imported and exported during the first half of the 20 th century. The port developed new facilities to accommodate larger steam powered ships during that same period with increased cargo activity taking place during the first and second world wars. Time Range Industry Inbound Outbound Notes Whaling Whale Oil Refined oil & Candles Decline began when Petroleum began to rise in 1860's Current Fishing Landed Fish Highest Catch Value in U.S. by Port, 1996 began to decline Current Petroleum Crude First Petroleum Fuel Refinery in U.S. (1845) Textiles Cotton Mfg Goods Figure 21 New Bedford Historical Overview Cargo activity, mostly break-bulk based, remain fairly consistent through the 1960 s and 1970 s when the impacts of containerization began to affect cargo flows in New Bedford and hundreds of other small ports throughout the world. Containerized freight shifted to larger ports where deep water facilities and advanced handling equipment were available and cargo could be distributed by truck and rail to regional destinations. That trend continues today with the largest amount of cargo from Southeast New England, estimated at 80%, handled through the Port of New York and New Jersey. Southeast New England container traffic alone passing through the Port of New York and New Jersey is estimated at between 48,000 and 50,000 TEU s per year. The Port of New Bedford has remained a connection point for bulk commodities including aggregates and petroleum. It has also remained a substantial fishing port in New England, although most fish and fish product exports now move through other seaports, such as Boston or New York/New Jersey. 19
22 Critical Recent Years, The critical period for commodity by vessel analysis has been the period beginning in the mid-1990 s through the current time frame. This data is most relevant for several key reasons. First, it reflects the changes in the post-initial containerization period when commodity movement began a shift into niche port areas. Second, it reflects the development of modern and accurate data collection and reporting methods. This data includes information on commodity movements, freight volumes, and vessel type. The primary source of information is the U.S. Army Corps of Engineers (USACE) who developed the databases in cooperation with U.S. Customs and other federal agencies. Data on freight correlated to vessel activity was not available prior to 1996; however, the data used for this report for is comprehensive and reliable. In order for consistent trends to be visible and accurate, a consistent and reliable source of data must be used, which was not available prior to the reporting period. So long as the data is consistent, such trends can indicate the rise and fall of ship calls and cargo volumes in a given port. Since 1922, the USACE Waterborne Commerce Statistics Center has been collecting vessel trip and cargo data for the sole purpose of exploring the feasibility of new projects and prioritizing the maintenance and/or expansion of existing maritime projects. In many cases, this data was used by USACE to make decisions regarding dredging projects. As such, the focus of vessel data is draft size. Federal agencies that collect this type of data are also not obligated to disclose specifics regarding movements of individual companies. The data is therefore aggregated by port, and must be reverse-constructed for comparison to elucidate trends in ship calls and cargo flows. Once in this form, certain assumptions can be made. For example, it is fair to assume that, for New Bedford, ships with a draft of under five feet are typically fishing vessels. Trends in the corresponding data point (ships under five feet) could then be generalized to fishing vessels. As previously mentioned, New Bedford has one of the most significant fishing and whaling histories among ports in the United States. This tradition carries over into modern times, where New Bedford stands alone as one of the largest fishing communities on the U.S. East Coast and is leading the nation in the highest value of catch category. This trend is reflected in the data, where the majority of vessels calling on New Bedford since 1996 had a draft smaller than 12 feet. Many of these vessels make up the vast fishing fleet that New Bedford is home to. This small draft constituency is also comprised of the tugs and barges that serve the petroleum or the sand and gravel industries. Since 1996 New Bedford s total ship calls have declined substantially starting at 6,295 and ending up at 2,173 in 2009 (a drop of about 65.5%). 95% of these were vessels with a draft less than 12 feet. Some of this is reflective of larger vessel sizes with increased cargo capacity. The dramatic reduction in small vessel traffic is largely attributed to the federal fishing amendments, passed in 1996, to the Magnuson Stevens Act, more commonly known now as the Sustainable Fisheries Act. As a result of this legislation, the fishing fleet out of New Bedford and other New England ports has declined steadily since the amendments came into effect. Fleets have consolidated and shifted among ports, which to a certain extent has mitigated the decline of fleet size in New Bedford. Most of the vessel calls for New Bedford were domestic traffic with a draft under 12 feet. USACE does not provide data on which ship is linked with which commodity. As a result, some assumptions must be made. The Army Corps vessel information is broken down into five main categories: 1. Self-Propelled Vessels Passenger & Dry Cargo (Fishing Boats, Ferries, Cruise Ships, Container Ships, Reefer Ships Break Bulk, etc.) 20
23 2. Self-Propelled Vessels Tanker (Oil Tanker, Chemical Tanker, Liquid Bulk, etc.) 3. Self-Propelled Vessels Tow or Tug (Tug Boats) 4. Non Self-Propelled Vessels Dry Cargo (Container Barge, Deck Barge, etc.) 5. Non Self-Propelled Vessels Tanker (Petroleum Barge, Chemical Tanker Barge, etc.) The categories are then broken down into draft sizes (depth of the hull below the waterline) and whether the vessel was Inbound or Outbound, Foreign or Domestic. This provides a range of vessel size and which trade they were involved in. The data is referenced to the cargo volumes recorded by the USACE for the same years and correlations developed. The data was organized by annual totals, to give a picture of trends, and aggregated to produce 14-year averages. A review of numerous federal and related government data sources showed that the Army Corps provides the most complete data on freight movements for the Port of New Bedford. The data, however, is not exhaustive, and their methods of data recording do not permit a high level of accuracy in estimating the draft size of vessels passing through New Bedford. This is because the low end of the draft sizes is grouped into a large category (0-5 ft. or 0-12 ft. depending on the year). Commodity data from do not give figures for volumes under 1,000 short tons aggregated per annum. This creates some degree of estimation variation, so commodity figures should be assumed to have a 5% margin of error. Regardless, the data does provide a good analysis of trends in commodity movement and the size of vessels passing through New Bedford. Data is complete for Data from before 1996 and data for 2010 are not available at this time. In 1998 and 2001, the data indicated which of New Bedford s foreign imports were from Canada and which were from further abroad. This data indicated that the majority of foreign inbound freight originated in Canada. This was mostly petroleum and non-metallic minerals and usually constituted between 50,000 and 100,000 short tons of freight for each given year. This represents the only point in the data where the origin or destination of freight is displayed. 21
24 Port of New Bedford Business Development Plan and Commodity Analysis S h o r t T o n s New Bedford Freight and Vessel Data T r i p s Freight Freight + Fish Landings Vessel Trips Figure 22 New Bedford Freight and Vessel Data The graph above provides an overview of the trends in New Bedford s freight and vessel traffic for the 14 years examined. Note that the freight (red line) starts proportionally lower than the number of vessel trips (blue line), meaning that the ships were smaller and carrying less than in later years. Again, this is largely due to the much larger size of the fishing fleet in (For clarity, the left y-axis, short tons, applies only to the red and green lines. The right y-axis, trips, applies only to the blue line. The two are matched up in order to efficiently display New Bedford s overall data, and to allow a sense of the trend in vessel size/load. Where the blue line is below the red, the vessels are larger or loaded more fully). This graph also displays a major jump in freight from In 2000 and 2001 this freight jump owed primarily to a large increase in the volume of domestic sand and gravel outbound freight. In 2002, the sand and gravel volumes returned to roughly where they had been, but there was a large jump in foreign oil imports (accounting for most of the increase in freight volume). A significant decline in freight volumes began in 2005, and the number of vessel trips steadily declined from The green line (freight and fish landings) has been included to show where the total freight for New Bedford might actually be. Fish landings are not noted by USACE because they are not passing from one port to another. This data was accessed from additional sources. Fish landings are significant because they greatly contribute to the small vessel traffic for New Bedford, and are largely not being moved by water to destination areas. 22
25 70 Large Ships by Type Number of Large Ship Visits Passenger/Dry Cargo 17-22ft Passenger/Dry Cargo 23-30ft Self-Propelled Tanker ft Non Self-Propelled tanker ft 0 Figure 23 Large Vessel Calls This graph displays visits by large vessels over the period in question. This shows how many visits were made by large vessels in each of three categories. In order to avoid skewing the graph, passenger and dry cargo vessels were split into 2 size categories: feet (blue line) and feet (red line). The biggest thing to note from this graph is that the two biggest years for sand and gravel, 2000 and 2001, saw the largest number of large (dry cargo) vessels call on New Bedford. Another point of interest is that there is a jump in large self-propelled tanker calls in This corresponds to an increase in foreign petroleum imports. 23
26 Freight Breakdown (Thousand Short Tons, not including fish landings) Petroleum and petroleum products Sand and Gravel Other Non-Metallic Minerals Fish Fruit and Nuts-121 Figure 24 Overall Freight Breakdown by Commodity (Does not include fish landings from NOAA) The above graph gives a breakdown of the total freight passing through New Bedford from The two largest commodities, as the graph displays, are petroleum and petroleum products and sand and gravel. The former is primarily inbound, which is overwhelming domestic in origin (except in , when there was a spike in foreign petroleum imports), and the latter is primarily domestic outbound freight. These two commodities make up 92.5% of New Bedford s freight volumes for The remaining 7.5% is made up of non-metallic minerals (3.1%), fruit and nuts (1.4%), fish (1.2%), and other commodities (wood products, iron and steel scrap, manufactured wood products, and others 1.8%). USACE data does not fully incorporate fish landings into their data set, instead keeping track of fishing vessel calls in a port. This data was available from NOAA s department of Marine Fisheries, which keeps aggregate totals for each port s fish landings and value of the cumulative landings. 24
27 Freight Movement Breakdown, (Thousand Short Tons) Internal Domestic Outbound Domestic Inbound Foreign Outbound Foreign Inbound Figure 25 Freight Direction Breakdown The above graph gives a look at the general point of origin and direction of freight moving through New Bedford for the 14 years in question. Proportionally, this graph demonstrates that New Bedford s largest freight amounts are bound for other U.S. ports (purple bar - this freight is comprised primarily of sand and gravel). For most years, the second largest freight amount came from freight originating in U.S. ports bound for New Bedford (green bar - comprised primarily of petroleum and petroleum products). The spike in foreign inbound freight (blue bar) in 2002 was comprised almost entirely of residual fuel oil. This graph also shows the overall trend in New Bedford s freight volumes with a spike in and a steady decline from Foreign outbound freight (red bar) and internal freight (teal bar) comprise very little of New Bedford s total freight volume. In the last 5 years, a significant growth point for New Bedford has been in the refrigerator or reefer ship category, which handles fruits and nuts (as classified by the Army Corps). This is significant because it is a unique niche adding value to the region. While the tonnages are small 37,000 short tons in 2009 it increases the large ship category, 17 feet of draft and higher, and creates a new opportunity for growth. If the 37,000 short tons of refrigerated freight were to be containerized, it could essentially lead to 4,000 TEU of annual containerized traffic, which would justify a bi-weekly service of a containerized vessel. If this were to happen, those containers could potentially be returned to the port for an outbound freight of either processed or frozen fish. If the trade were fully balanced, 4000 TEU in and 4000 TEU out, it could potentially justify a weekly service as refrigerated containers carry premium rates and would attract carriers. Based on current projections of potential cargo for barge or ship-based feeder services, this would be approximately one third of the estimated weekly containers the port could handle on a weekly feeder service, based on an annual estimate of 24,000 potential TEU s for a key feeder port in Southeast New England. It should be noted that a feeder service would compete with trucking services, which for New Bedford to and from New York is estimated at between $600 and $800 per trucking move for an export or import load. This would be equivalent 25
28 estimated comparable cost for a round trip by water. The aggregate cost of water transportation could be reduced by volume per trip. This is the largest potential growth area for vessel calls in the port. Historic Freight and Vessel Call Data Port calls over the indicated period by freight category are broken down in the following table. Freight Breakdown in Thousands of Short Tons Tons Foreign Domestic Internal Year Total Imports Exports Total Receipts Shipments Receipts Intraport x x x x x x x x x x x x x x x x x x 6 X=No commodity listed, 0= Less than 1,000 tons Table 1 New Bedford Freight Breakdown The table reflects a general decline in commodity flow in both domestic and international shipments. All values are in 1000 short tons; any values that are listed as "x" have no value, any values listed as "0" were less than 1000 short tons for the year, which is how the USACE data is categorized. Domestic values list inbound freight as "receipts" and outbound freight as "shipments" and internal values are values that were local: "intraport" is freight values moved between terminals within a port and "receipts", in this category represents freight movement on an inland waterway as "classified by the USACE". 26
29 The following table provides a breakdown of vessel calls by draft for the inclusive period. The vessels are categorized by draft and type, as well as means of propulsion including self-propelled (ships and boats) and non-self propelled (barge) vessels. Tugs are categorized under self-propelled but do not account for any on vessel cargo carriage. All non-self propelled vessels are assumed to be moved by tug, inclusive in the total tug-towing vessel numbers. Vessel Trip Breakdown By Draft Self-Propelled Vessels Non Self-Propelled Vessels Type Pass & Dry Cargo Tanker Tug-Towing Dry Cargo Tanker YR < < < < < Total ft 22 ft ft ft ft ft ft ft ft ft ft ft Table 2 New Bedford Vessel Call Breakdown Port Cost Comparison Most decisions made by shippers or ocean carriers on behalf of shippers are based primarily on cost. Among smaller niche ports in New England, there does not exist a great deal of variation in final cost to the shipper. Terminal costs, vessel fees including dockage and pilotage, labor costs, and port taxes are relatively consistent throughout New England except for Boston, where labor costs can be higher due to work rules and contract stipulations. The shipper always pays the final cost of transportation of cargo regardless of who is charging it. Ocean carriers, who develop all inclusive per unit, or per ton rates, build all of the final costs into the shipper s rate. These costs include: Terminal fees including wharfage, usage, service and gate fees Cargo demurrage, storage and free time provisions Vessel fees including dockage, pilotage, tug fees and line handling Fuel surcharges Labor rates including straight time and overtime differentials 27
30 Security fees Government fees and taxes Truck and rail transportation rates including intermodal handling charges, per ton or per unit rates and equipment repositioning charges The table below shows the various costing methods and labor rates for selected ports in New England. PORT Charge Portland, ME Portsmouth, NH Boston, MA Fall River, MA Davisville, RI Providence RI New Bedford Dockage p/day $2 per foot $.29 per NRT $.34 NRT* $600 $.20 NRT $.33 NRT $100-$600 per day Wharfage/ton $5.00 $.85 $2.75 $1.95 $1.00 $2.00 $1.00 Labor p/hr $800 $1,360 $1,184 $1,450 $2,250 $2,250 $1,550 Overtime p/h Differential $240 $200 $416 $550 $750 $750 $600 Crane Hire $350 $400 $400 $400 $400 $400 $400 Security p/day $1,000 $100 $1,200 $600 $ % Dkage $1,220 Accessorial Charges $1 per ton per day demurrage $.56 per 100 lbs. demurr. Per day $.22 per 100 lbs. demurr. Per day $.10 per 100 lbs. demurr. Per day *Net Registered Tonnage Table 3 New England Port Cost Comparison Overall, ports can only control the costs of services they provide. Competitive port costs must take into account the total cost to the shipper. Port costs may be low in a region, but can be offset by high vessel fees or the cost of landside transportation. Freight Rail Connections One of the most critical elements that differentiate small to medium niche ports from each other in the competitive regional market is their ability to offer a wide range of cost-effective and efficient land-based transportation services. This includes competitive truck and rail service providers, efficient road access and freight rail with efficient connections to the national rail system. Larger ports because of higher volume throughputs, and subsequent higher revenues, are able to maintain and improve these services because of the capability to handle large amounts of cargo cost-effectively to and from waterfront facilities. Smaller ports face pressure to redevelop rail properties as communities abandon port activities in favor of less-industrial economic development. Many ports have seen the erosion of freight rail infrastructure in favor of commercial development, recreational use of right-of-ways for trails or the development of commuter services. This erosion of freight rail infrastructure has contributed to the loss of port activity and opened the door to increased gentrification around marine facilities. This has reduced the competitive opportunities for several commercially viable seaports. 28

31 New Bedford has freight rail access and a pending rail improvement project that should benefit the local economy. The New Bedford Freight Rail Yard and proposed Transportation Center collectively constitute the primary rail facilities in the Port district of New Bedford. The Massachusetts Bay Transportation Authority (MBTA) has plans to develop the western side of the current New Bedford Rail Yard site as a passenger station and layover yard for MBTA commuter trains as part of the MBTA s South Coast Rail project, which entails the extension of commuter rail to New Bedford and Fall River. The passenger facility is sometimes referred to as the Whales Tooth facility. In addition to the station, the MBTA intends to create an adjacent parking lot. The Commonwealth recently completed the First Taking segment of a transaction between the Commonwealth of Massachusetts and freight railroad CSX. In that transaction, certain property along the eastern side of the current yard has been designated for freight purposes. The designated properties include serving yard tracks and connections to: The Team Track site owned by the City of New Bedford, The Environmental Protection Agency s (EPA) dredged material handling site along Herman Melville Blvd., Rail access to the former Revere Copper facility, Rail access to the Maritime Terminals, and Developable property along Herman Melville Blvd., retained by CSX. In addition to the designated freight-only facilities in New Bedford Yard, the serving freight railroad (Massachusetts Coastal Railroad, or Mass Coastal ) can access customers at and around Nash Road, and the New Bedford Industrial Park off Braley Road. While the New Bedford Yard site is key to assessing port development potential, the other sites mentioned above may provide additional opportunity for freight rail traffic. In aggregate, New Bedford has access to more rail facilities than many similar sized ports. Figure 26 Proposed New Bedford Freight and Commuter Rail Facility 29
32 Role of Rail in Development of Small to Medium Size Ports Rail is increasingly becoming a critical component of port development in small to medium sized ports throughout the United States and Canada. Ports that have allowed this infrastructure to erode have seen decreased port capacity for handling freight, shifting cargo moves to higher cost, lower volume methods, such as truck, making some ports less competitive. Ports that retain good rail and highway connections have found success in attracting freight and cargo from larger ports that have, in many instances, become more specialized and expensive. Smaller ports often have the ability to be more aggressive in labor costs and terminal pricing, but must retain the flexibility to handle a wide range of cargos and adapt to changing market conditions. Essential to this is the ability to handle cargo movements between various transportation modes (vessels, rail and trucks). Terminal and freight yards must be maintained and operated in an efficient manner. In addition, value added services such as Customs port of entry designation, free trade zones, cargo processing and warehousing all contribute to port competitiveness in regard to providing for a full range of services. There are certain elements that are necessary for freight rail infrastructure to provide proper support to a port. These elements include a local serving yard, transloading capabilities and warehouse and/or cross-dock capabilities. While ondock rail capabilities make movement of certain materials easier, on-dock rail is not an essential element. Additionally, specific operating capabilities and clearance restrictions play heavily into the mix. Rail access allows a port to carve a niche not available to non-rail-served ports. The universe of ports on the East Coast with active rail connections is limited. The Port of New York and New Jersey, Halifax, Norfolk, Savannah, Jacksonville and Miami have developed extensive rail-port infrastructure, which has allowed them to develop as significant container ports. Smaller less specialized ports with rail infrastructure have developed as neo-bulk, break bulk or bulk handling ports. The commodities moved through these ports vary. Some examples include Norfolk, which also handles large volumes of coal; Philadelphia, which moves significant amounts of steel and ingots; and New London, which handles large volumes of lumber. The lumber moving through the Port of New London is almost exclusively brought in by rail, stored at the port for distribution and then distributed to local retailers by truck. Other ports handle and process frozen fish as well as pulp and paper, which can be brought into port areas in larger shipments by rail that exceed over the road transportation limits. Rail Components Required for Efficient Marine/Rail Interface Having a local serving railyard of adequate size is critical to a port s freight handling capability. The serving yard needs to have sufficient tracks to switch inbound trains and build outbound trains while holding cars, both loaded and empty, for local customers. The yard tracks and switching leads should be of such length to support the longest train contemplated. The current yard at New Bedford meets this requirement. In addition to the existing infrastructure, New Bedford contains a property adjacent to the rail line (shown in red hash-marks in the figure below) that was retained by CSX and is available for development as a transload (or related) facility. 30

33 Figure 27 MBTA Sale Exclusion Sites Rail-served ports also need to have transload capabilities, which are critical to the intermodal supply chain. This provides the port with the capability to unload product from, or load product onto railcars. This includes facilities such as the team track facility, which was constructed by the City near the corner of Wamsutta and Herman Melville Blvd. This facility, with the paved area between tracks allowing trucks, forklifts and cranes, as needed, to access rail cars in loading and unloading operations. This transload infrastructure and capability allows New Bedford to support both the surrounding port area, and the general Southeast Massachusetts region. Additionally, the EPA-funded site on Herman Melville Blvd., currently utilized in connection with the New Bedford Harbor clean-up project, provides an additional transload capability, including direct rail to barge, or barge to rail capability. As discussed below, having both near-dock and on-dock capabilities provide a competitive advantage to New Bedford. Another element to consider in assessing rail-served capabilities is rail-served warehouse and transfer facilities. The EPAfunded site offers a number of future capabilities once the New Bedford Harbor clean-up project is completed. The Maritime Terminals facilities were also historically rail-served and served as a transfer point or in-transit facility between rail and ship. To be able to compete in certain markets such as in the handling of food and beverage products, finished goods, seafood or project cargoes, having warehouse and in-transit capacity capability is critical. New Bedford Connections to the National Rail Network The Mass Coastal Railroad is a short-line railroad based in Hyannis, Massachusetts that serves the city of New Bedford for freight rail purposes. Mass Coastal took over the New Bedford switching operations in early 2010, replacing CSXT, which had served New Bedford since the purchase of Conrail. Mass Coastal in turn interchanges with CSXT, one of two major (Class One) railroads on the U.S. East Coast. Interchange between Mass Coastal and CSXT occurs at Cotley Junction in East Taunton, Massachusetts near the intersection of Route 140 with Route 24. CSX has a rail network that operates from Florida to the northern border of the U.S., as shown in Figure 29 below. The company, which is headquartered in Jacksonville, Florida, owns approximately 22,000 route miles in the United States. It is one of the three Class I railroads serving most of the U.S. East Coast, along with Norfolk 31
 that could potentially be linked to New Bedford")
34 Southern Railway and Canadian Pacific Railway. From Cotley Junction, CSXT can also access other Class One railroads (such as Norfolk Southern, Canadian Pacific and Union Pacific) across the U.S. as well as regional/short line rail operations in New England. Several short-line railroads in Massachusetts have existing bulk transload and commodity distribution facilities (or have proposed these facilities) that could potentially be linked to New Bedford for import and export of cargoes. In addition, the Free Trade Zone in New Bedford is an attractive feature for developing partnerships with inland rail and facility operators. Figure 28 below shows the freight rail network in Massachusetts and surrounding states. Figure 28 Freight Rail Ownership in Massachusetts 32

35 Figure 29 CSX System Map The actual rail right-of-way into New Bedford is owned by the Commonwealth of Massachusetts and, upon completion of the South Coast Rail passenger project, will be maintained and controlled by the MBTA. Impacts of the MBTA project on potential freight rail in the area are generally positive. While commuter trains will occupy rush hour windows, currently anticipated passenger train operations will still allow daylight operations and daylight switching at New Bedford. The South Coast Rail project will also result in improved track conditions allowing for the safe and efficient handling of rail cars into the port. The Port of New Bedford has the potential to service several inland areas through rail connections that currently handle bulk, neo-bulk, and container cargo. This provides the port with the opportunity to develop an inland port connection. Inland ports are successful when they have a variety of transportation options including connections to seaports. Several smaller ports in New England have developed niche markets, which have been enhanced through effective rail connections, such as Portland, ME and Quonset Point-Davisville, RI. The study identified at least one short line railroad, the Mass Central Railroad that expressed interest in working with the port to develop marine transportation connections and take advantage of a foreign trade zone. The Mass Central Railroad (MCER) is a 26-mile railroad that connects with the CSX Railroad in Palmer and extends rail service as far as South Barre, MA. The railroad handles both domestic and international cargo, including commodities shipped to and 33

36 from Canada and Mexico as well as overseas shipments originating in South America that pass through the Port of New York. In 2009 the railroad moved 2,032 railcars handling approximately 200,000 tons, equivalent to 8,000 truck loads outbound. In 2010 as of June 30, the railroad moved 3,000 railcars handling 300,000 tons equivalent to 12,000 truck loads outbound. The railroad has a capacity to handle 10,000 railcars or 1 million tons equivalent to 40,000 truck loads outbound. There is also a large amount of available outdoor and indoor storage located in various facilities including 20 acres of outside storage with an additional 100 acres under option. The railroad has 100,000 square feet of indoor storage. The primary commodities that are handled by Mass Central include lumber, laminated veneer wood products, plastic, steel including large unit sizes for bridge construction, structural steel parts, rebar, pipe, paper including large rolls of news print, boxed consumer products, paper products, utility poles, electrical parts including transformers, bagged agricultural products, bagged animal feed products, large consumer products including appliances, railroad ties, fencing materials,, construction materials including bagged sand, cement and cement mixes, plumbing and electrical parts, marble, granite, limestone panels, bulk aggregate stone and or sand, auto parts including engines, transaxles and auto body and trim parts, truck parts including stackable truck bodies, engines and transmissions. The railroad also handles rock salt in bulk for use on municipal roadways. In addition to bulk products, the railroad also handles a variety of packaged food items including canned vegetables, canned specialty products such as ketchup, milk products, spices, herbs, coffee flavorings (Domestic and International), specialty pastas, canned cookies, bulk candies, bulk nuts, canned and bottled olive oil and vegetable oil, beverages including water, beer, formulated drinks, bagged flour, sugar and salt. Commercial and consumer goods include furniture, office equipment, janitorial products including 55 gallon packaged cleaning products, lawn mowers, snow blowers, lawn tractors, recreational equipment including recreational ski vehicles, water craft, consumer products including clothing, shoes, boots and kitchen wares. Most commodities handled by the railroad move domestically with origin and destination points throughout the United States; however, they also handle a number of products with O/D points in Canada and Mexico. Overseas bulk, neo-bulk and containerized freight is transshipped through U.S., Canadian and Mexican ports and includes specialty wood products shipped via container and originating in South America. Figure 30 New Mass Central Salt Shed Near Palmer, MA The railroad has planned a series of new infrastructure improvements over the next several years for the handling of various commodities. This includes additional inside storage, which will be planned to be added in a 2011 design to provide 40,000 square feet of storage capable of 3 pallet stacking under open span roof structures. Also planned for 2012 is an additional 40,000 square feet also designed for 3 pallet stacking under open span structures. The railroad is 34
Appendix B. Commodity Flow Profile
 Appendix B 1.0 Introduction The overall goal of the Kansas Department of Transportation (KDOT) Statewide Freight Plan is to develop a set of infrastructure, operational, and institutional recommendations
Accumulated data April 2017
 Port of Barcelona traffic statistics Accumulated data April 217 Statistics Service 17/5/217 Index Traffic indicators Container traffic Passenger traffic Automobile traffic Total traffic 3 Main indicators
Waterways 1 Water Transportation History
 Waterways 1 Water Transportation History Water Transportation Propulsion History Human (oars, poles) - - 7,000-10,000 BC Wind (sails) - - 3,000 BC Steamboat invented - - 1787 AD First diesel-powered ship
TRB - Annual Meeting
 TRB - Annual Meeting NATIONAL DREDGING NEEDS STUDY PHILLIP J. THORPE Institute for Water Resources 16 January 2002 AGENDA Background Information Historical Perspective Global and US Trade World and US
Statistics Overview. Vancouver Fraser Port Authority
 Statistics Overview Vancouver Fraser Port Authority 2017 Table of contents Overview 1 Foreign vessel traffic 2 Cargo summary by sector 2 Bulk sector 3 Container units and TEUs 4 Container sector 5 Breakbulk
Central Minnesota. Regional Freight Profile
 Central Minnesota Regional Freight Profile Working DRAFT May 21 Minnesota Department of Transportation The purpose of the Central Regional Freight Profile is to document freight movement trends in the
Warren County Freight Profile
 Warren County Freight Profile 2040 Freight Industry Level Forecasts ABOUT THIS PROFILE The NJTPA has developed a set of alternative freight forecasts to support transportation, land use, and economic development
Importance of the Commodity Flow Survey (CFS) in Developing the Freight Analysis Framework (FAF)
 in Developing the Freight Analysis Framework (FAF)") Bureau of Transportation Statistics Importance of the Commodity Flow Survey (CFS) in Developing the Freight Analysis Framework (FAF) Annual Meeting Transportation Research Board January 14, 2015 Michael
Bureau of Transportation Statistics Importance of the Commodity Flow Survey (CFS) in Developing the Freight Analysis Framework (FAF) Annual Meeting Transportation Research Board January 14, 2015 Michael
NYMTC Regional Freight Plan Update Interim Plan Task Commodity Flow Analysis
 TECHNICAL MEMO NYMTC Regional Freight Plan Update 2015-2040 Interim Plan Task 2.2.1 Commodity Flow Analysis REVISED, JANUARY 2014 technical memorandum Task 2.2.1 Technical Memorandum Commodity Flow Analysis
Essex County Freight Profile
 Essex County Freight Profile 2040 Freight Industry Level Forecasts ABOUT THIS PROFILE The NJTPA has developed a set of alternative freight forecasts to support transportation, land use, and economic development
NROC White Paper: Overview of the Maritime Commerce Sector in the Northeastern United States
 NROC White Paper: Overview of the Maritime Commerce Sector in the Northeastern United States rev. 18 February 2013 Hauke Kite-Powell, Research Specialist, Marine Policy Center, Woods Hole Oceanographic
Ohio Maritime Study. Ohio Transportation Engineering Conference (OTEC) October 10, 2017 Columbus, OH
 October 10, 2017 Columbus, OH") Ohio Maritime Study Ohio Transportation Engineering Conference (OTEC) October 10, 2017 Columbus, OH Presentation Map Context the Great Lakes Region Ohio Maritime Transportation Study What Overview Comes
Ohio Maritime Study Ohio Transportation Engineering Conference (OTEC) October 10, 2017 Columbus, OH Presentation Map Context the Great Lakes Region Ohio Maritime Transportation Study What Overview Comes
Supply Chain Management Summit August 23, 2012
 Supply Chain Management Summit August 23, 2012 Steven J. King, P.E. Managing Director Quonset Business Park 3,207 Total Acres 168 Companies 8,800 Jobs Transportation Facilities Freight Seaport: 2 piers
Waterborne Commerce Statistics Center
 Waterborne Commerce Statistics Center Amy Tujague, Special Requests Project Manager Waterborne Commerce Statistics Center Navigation & Civil Works Decision Support Center USACE 30 March 2016 US Army Corps
3.0 FREIGHT FLOW OVERVIEW
 3. FREIGHT FLOW OVERVIEW This analysis primarily uses IHS Global Insight s TRANSEARCH database and the Surface Transportation Board s Rail Waybill Sample. These datasets provide county-level data for freight
HALIFAX PORT AUTHORITY TARIFF RATE SCHEDULES TABLE OF CONTENTS
 TARIFF RATE SCHEDULES TABLE OF CONTENTS EFFECTIVE: January 1, 2019 Notice ID Tariff Description N - 1 N - 2 N - 3 N - 4 N - 5 N - 6 N - 9 N - 10 N - 11 N - 12 Berthage and Anchorage Notice Wharfage Notice
Ocean County Freight Profile
 Ocean County Freight Profile 2040 Freight Industry Level Forecasts ABOUT THIS PROFILE The NJTPA has developed a set of alternative freight forecasts to support transportation, land use, and economic development
Assessment of Houston Commodity Flows for Supply Chain Analyses
 This document provides an assessment of 29 commodity flows to assist with the identification of 10 supply chains for more detailed investigation as part of the Ports Area Mobility Study. The intent is
FDOT FREIGHT PERFORMANCE MEASURES
 FDOT FREIGHT PERFORMANCE MEASURES 1 PEOPLE FREIGHT Transit MODE QUANTITY QUALITY ACCESSIBILITY UTILIZATION Auto/Truck Pedestrian Bicycle Aviation Rail Seaports Truck Aviation Rail Seaports Vehicle Miles
RAIL COMMODITY FLOWS
 RAIL COMMODITY FLOWS. The major commodities handled by rail are bulk, with the exception of the automotive traffic. The following pages provide detailed information rail commodities in California, and
NEW HAVEN HARBOR CONNECTICUT NAVIGATION IMPROVEMENT
 NEW HAVEN HARBOR CONNECTICUT NAVIGATION IMPROVEMENT 255 255 255 237 237 237 0 0 0 217 217 217 163 163 163 200 200 200 INTEGRATED FEASIBILITY STUDY AND ENVIRONMENTAL IMPACT STATEMENT 131 132 122 PUBLIC
HALIFAX PORT AUTHORITY BERTHAGE AND ANCHORAGE NOTICE SCHEDULE OF RATES. Item Description Rate
 BERTHAGE AND ANCHORAGE NOTICE EFFECTIVE: January 1, 2018 NOTICE N-1 I 1. The berthage rates per gross registered tonne are: (a) for the first period of 12 hours or part thereof... $0.0508 (b) for the second
Monmouth County Freight Profile
 Monmouth County Freight Profile 2040 Freight Industry Level Forecasts ABOUT THIS PROFILE The NJTPA has developed a set of alternative freight forecasts to support transportation, land use, and economic
THE LOCAL AND REGIONAL ECONOMIC IMPACTS OF THE US DEEPWATER PORT SYSTEM, 2006 PREPARED FOR: AMERICAN ASSOCIATION OF PORT AUTHORITIES SEPTEMBER 5, 2007
 THE LOCAL AND REGIONAL ECONOMIC IMPACTS OF THE US DEEPWATER PORT SYSTEM, 2006 PREPARED FOR: AMERICAN ASSOCIATION OF PORT AUTHORITIES SEPTEMBER 5, 2007 MARTIN ASSOCIATES 941 WHEATLAND AVE, SUITE 203 LANCASTER,
Union County Freight Profile
 Union County Freight Profile 2040 Freight Industry Level Forecasts ABOUT THIS PROFILE The NJTPA has developed a set of alternative freight forecasts to support transportation, land use, and economic development
SOUTHWEST LOUISIANA PORT NETWORK THE ENERGY CORRIDOR S PATH TO GROWTH & SUCCESS
 SOUTHWEST LOUISIANA PORT NETWORK THE ENERGY CORRIDOR S PATH TO GROWTH & SUCCESS BRIDGING THE DISTANCE The distance separating a buyer from a seller is sometimes minimal; other times, it s an ocean. The
Morris County Freight Profile
 Morris County Freight Profile 2040 Freight Industry Level Forecasts ABOUT THIS PROFILE The NJTPA has developed a set of alternative freight forecasts to support transportation, land use, and economic development
IN THIS ISSUE NO. 4, APRIL 2017
 NO. 4, APRIL 2017 We are pleased to present the fourth issue of the Maritime Information System (MIS) newsletter. Thanks to the collaboration of the five Canadian port authorities (CPA) located in Québec,
THE LOCAL AND REGIONAL ECONOMIC IMPACTS OF THE US DEEPWATER PORT SYSTEM, 2007 PREPARED FOR: AMERICAN ASSOCIATION OF PORT AUTHORITIES JUNE 6, 2008
 THE LOCAL AND REGIONAL ECONOMIC IMPACTS OF THE US DEEPWATER PORT SYSTEM, 2007 PREPARED FOR: AMERICAN ASSOCIATION OF PORT AUTHORITIES JUNE 6, 2008 MARTIN ASSOCIATES 941 WHEATLAND AVE, SUITE 203 LANCASTER,
STRENGTHENING YOUR PORT S FINANCIAL STABILITY THROUGH DIVERSIFICATION
 STRENGTHENING YOUR PORT S FINANCIAL STABILITY THROUGH DIVERSIFICATION A Case Study of the Vancouver Fraser Port Authority s Natural Advantages and Diversification Strategies Larry Sawrenko, Director Finance
APPENDIX B COMMODITY FLOWS NOVEMBER 2018 DRAFT
 APPENDIX B COMMODITY FLOWS NOVEMBER 2018 DRAFT 2 CURRENT COMMODITY FLOWS IN THE BIRMINGHAM REGION A commodity flow analysis for a region allows for an understanding of which commodities generate a significant
Texas Ports and Texas Exports
 Texas Ports and Texas Exports Testimony of Ginger Goodin, P.E. Senior Research Engineer and Director, Transportation Policy Research Center Texas A&M Transportation Institute to Senate Select Committee
Waterborne Commerce Statistics Center
 Waterborne Commerce Statistics Center Amy Tujague, Data Liaison Waterborne Commerce Statistics Center Navigation and Civil Works Decision Support Center Institute for Water Resources 19 April 2018 US Army
Columbia Group of Companies
 Columbia Group of Companies Columbia Container Services Columbia Coastal Transport Columbia Leasing Columbia Intermodal Columbia Intermodal Container Drayage Services NY/NJ Port Terminals NY Metro area
Inland Waterway Navigation
 Inland Waterway Navigation Value of Inland Navigation As the sun rises over the Mississippi River a 15-barge tow slides slowly past the St. Louis Harbor and heads south to New Orleans where its cargo of
Waterborne Commerce and Performance Data
 Waterborne Commerce and Performance Data Douglas McDonald USACE 18-Jul-2013 US Army Corps of Engineers Waterborne Commerce Information Waterborne Trip & Tonnage Origin & Destination Location Port and Dock
The Economic Impacts of Virginia s Maritime Industry
 The Economic Impacts of Virginia s Maritime Industry PORT COMMERCE Million Tons of Cargo Moved 0,00 Jobs $. Billion In Wages $. Billion In Spending $. Billion In State/Local Taxes.% of Virginia Gross State
Port Partnerships Strategic Opportunities for Gateway & Closer Market Ports to Work Together Presented by Rainer Lilienthal General Manager-Trade
 Port Partnerships Strategic Opportunities for Gateway & Closer Market Ports to Work Together Presented by Rainer Lilienthal General Manager-Trade Development Port of Houston Overview The Port of Houston
Duluth-Superior Area Freight Planning
 Duluth-Superior Area Freight Planning AMPO Annual Conference Portland, Oregon October 23, 2013 Ron Chicka Duluth-Superior Metropolitan Interstate Council Duluth Superior MIC Area Freight Challenges Engaging
 http://e-asia.uoregon.edu THE ROLE OF SMALL & MEDIUM-SIZED ENTERPRISES IN EXPORTS TO CHINA: A STATISTICAL PROFILE Results from the 2003 Exporter Data Base International Trade Administration Manufacturing
Failure to Act. Of current Investment Trends in. Airports, Inland Waterways, and Marine Ports. Infrastructure EXECUTIVE SUMMARY
 Failure to Act The economic impact Of current Investment Trends in Airports, Inland Waterways, and Marine Ports Infrastructure EXECUTIVE SUMMARY EXECUTIVE SUMMARY Air and waterborne transportation infrastructure
TRANSPORT OF THE RUSSIAN FAR EAST AS A PART OF NEA REGIONAL TRANSPORTATION SYSTEM
 TRANSPORT OF THE RUSSIAN FAR EAST AS A PART OF NEA REGIONAL TRANSPORTATION SYSTEM Pavel MINAKIR COMMENTS Transportation system of the Russian Far East is a part of the entire Northeast Asian transportation
INTRODUCTION: ROLE OF AIR CARGO IN LANDLOCKED COUNTRIES
 INTRODUCTION: ROLE OF AIR CARGO IN LANDLOCKED COUNTRIES Potential market The demand for airfreight is limited by cost which is typically 4 5 times that of road transport and 12 16 times that of sea transport.
Ohio Department of Transportation Ohio Statewide Freight Study/ Plan
 Ohio Statewide Freight Study/ Plan Ohio Planning Conference July, 2014 Statewide Freight Plan Purpose: To understand to the greatest detail possible, how Ohio s freight infrastructure is being utilized.
Notice of Tariff Change Effective January 1, 2014
 Notice of Tariff Change Effective January 1, 2014 Port of Seattle Terminals Tariff No. 5 is revised as follows: RATE CHANGES: ITEM 1460 SMALL LOTS FEE A charge of $116.09 increased from $114.33 will be
Submission to the New Zealand Productivity Commission issues paper on international freight transport services.
 OCEANIC NAVIGATION LIMITED Oceanic Navigation Ltd August 31 2011 SHIPPING AGENTS & CHARTERING BROKERS MARINE & GENERAL TRANSPORTATION CONSULTANTS OCEANIC HOUSE, 465 PARNELL ROAD PO BOX 9454, AUCKLAND,
Please Do Not Copy or Distribute. Visit: for all the latest updates!
 Please Do Not Copy or Distribute Visit: www.nears.org for all the latest updates! The Port of Baltimore The Maryland Port Administration NEARS North East Association of Rail Shippers April 2013 Over 300
WINDSOR PORT AUTHORITY
 By-Law No. 1 WINDSOR PORT AUTHORITY a By-Law fixing the fees to be paid to enter or use the Port of Windsor May 1, 2017 By-Law No. 1 WINDSOR PORT AUTHORITY a By-Law fixing the fees to be paid to enter
2.00 PURPOSE AND NEED FOR ACTION Project Area
 2.00 PURPOSE AND NEED FOR ACTION 2.01 Project Area The project area is located in Chatham County, Georgia, and Jasper County, South Carolina. These counties lie in the Coastal Plain physiographic province
Southern Alberta: Growth of Import and Export Opportunities for West Coast Ports
 Southern Alberta: Growth of Import and Export Opportunities for West Coast Ports Stakeholders for the Study Port of Prince Rupert Province of Alberta Calgary Regional Partnership Calgary Economic Development
Factors Affecting Transportation Decisions. Transportation in a Supply Chain. Transportation Modes. Road freight transport Europe
 Transportation in a Supply Chain Factors Affecting Transportation Decisions Carrier (party that moves or transports the product) Vehicle-related cost Fixed operating cost Trip-related cost Shipper (party
Somerset County Freight Profile
 Somerset County Freight Profile 2040 Freight Industry Level Forecasts ABOUT THIS PROFILE The NJTPA has developed a set of alternative freight forecasts to support transportation, land use, and economic
INLAND WATERWAYS TRANSPORTATION: Our Competitive Advantage. Delbert R Wilkins Canal Barge Company Big River Moves Leadership Forum April 15, 2013
 INLAND WATERWAYS TRANSPORTATION: Our Competitive Advantage Delbert R Wilkins Canal Barge Company Big River Moves Leadership Forum April 15, 2013 INLAND WATERWAYS TRANSPORTATION: Our Competitive Advantage
Enjoy your. You are traveling through the Houston Ship Channel, a 52-mile, man-made wonder that connects Houston to the Gulf of Mexico.
 Enjoy your SAME Welcome 2015 JETC 2 0 to one of the nation s busiest industrial seaports. Each year, an average of 7,700 ship calls are made at the 1 Port of Houston, carrying everything from petroleum
Hunterdon County Freight Profile
 Hunterdon County Freight Profile 2040 Freight Industry Level Forecasts ABOUT THIS PROFILE The NJTPA has developed a set of alternative freight forecasts to support transportation, land use, and economic
Railroads and Grain. Association of American Railroads May Summary
 s and Grain Association of American s May 2018 Summary s are critical to grain transportation. In 2017, U.S. Class I railroads originated 1.46 million carloads of grain (5.1 percent of total carloads)
TOPICS FOR TODAY S DISCUSSION
 1 TOPICS FOR TODAY S DISCUSSION 1 2 3 Why is the US transportation infrastructure so critical to local, state, and national economies? What is the maritime segment's contribution to local, state, and national
BACKGROUNDER #6: Moving Goods & Services
 BACKGROUNDER #6: Moving Goods & Services Introduction The Metro Vancouver region plays a critical role as Canada s Pacific Gateway providing the network of roads, waterways, rail facilities, and air and
Freight Information Gathering System
 Freight Information Gathering System OCTOBER - DECEMBER QUARTER OF 2011 ISSN 2253-2560 JUNE 2012 QUARTERLY CONTAINER INFORMATION REPORT Contents 1. Executive Summary... 3 2. Limitations... 4 3. FIGS cargo
THE UK PORTS INDUSTRY:
 THE UK PORTS INDUSTRY: Forecasting Growth & Developing Capacity by MDS Transmodal 205024_presentationv5 1. AGENDA Past trends, 1965-2004 Ports & Public policy - History and forthcoming review Forecasting
EUROPEAN SEA PORTS ORGANISATION RAPID EXCHANGE SYSTEM GUIDELINES 2016
 TRAFFIC OF GOODS, VESSELS & PASSENGERS EUROPEAN SEA PORTS ORGANISATION RAPID EXCHANGE SYSTEM GUIDELINES 2016 A1 A2 A3 TOTAL THROUGHPUT (A2+A3+A4) LIQUID BULK (A21+A22+A23+A24+A25) A21 Crude oil A22 Refined
RECENT TRENDS OF NEW ZEALAND S INTERNATIONAL FREIGHT TRANSPORT
 RECENT TRENDS OF NEW ZEALAND S INTERNATIONAL FREIGHT TRANSPORT Haobo Wang and Joanne Leung Ministry of Transport 1, PO Box 3175, Wellington 6140, New Zealand ABSTRACT This paper investigates the extent
Railroads and Grain. Association of American Railroads June Summary
 s and Grain Association of American s June 2017 Summary s are critical to grain transportation. In 2016, U.S. Class I railroads originated 1.54 million carloads of grain (5.6 percent of total carloads)
American Association of Port Authorities Harbors & Navigation Committee September 27, 2018
 American Association of Port Authorities Harbors & Navigation Committee September 27, 2018 Lauren K. Brand, PPM Associate Administrator Ports & Waterways Maritime Administration 1200 New Jersey Ave., SE
Global Coalition for Efficient Logistics. The Shipping Industry and the Global Economy! June 2009! Swiss based non profit public private partnership
 The Shipping Industry and the Global Economy! June 2009! Swiss based non profit public private partnership INDEX The objectives of this document are to provide an overview of the Shipping Industry and
Chapter 5 Freight Movement
 Chapter 5 Freight Movement Truck passing under I-78 on Route 412 in Hellertown 34 35 Figure 7 Lehigh Valley Percent Freight Tonnage and Value by Direction, and This section details the tonnage and value
The Next Mode of Transportation. Presented By: Ronald J. Silva CEO-Westar Transport
 The Next Mode of Transportation Presented By: Ronald J. Silva CEO-Westar Transport - Short Sea Shipping is the diversion of domestic and international cargos that move by highway from major metropolitan
Port of Los Angeles Presentation to the Los Angeles Investors Conference March 19, 2018
 Port of Los Angeles Presentation to the Los Angeles Investors Conference March 19, 2018 1 Today s Focus Introduction to the Port of Los Angeles Market Position & Cargo Volumes Capital Improvement Program
PROJECTS. The KIPDA MPO s Central Location
 PROJECTS Freight The economy of the Louisville KY-IN) Metropolitan Planning Area MPA), similar to that of the United States as a whole, is largely dependent on the efficient, reliable, and safe movement
IMPORTING YOUR GOODS USING SEA FREIGHT. 1 Magellan Logistics
 IMPORTING YOUR GOODS USING SEA FREIGHT 1 Magellan Logistics 2017 - www.magellanlogistics.com.au Shipping containers were developed from the railway s iron boxes that were initially used to transport coal
Goods Flows in Sweden Report 2012:8
 Goods Flows in Sweden Summary Report 2012:8 Goods Flows in Sweden Summary Report 2012:8 Transport Analysis Address: Torsgatan 30 SE-113 21 Stockholm Phone: 010 414 42 00 Fax: 010 414 42 10 E-mail: trafikanalys@trafa.se
Danish Ports. Member of: ESPO, European Sea Ports Organisation Registered in the European Transparency Register
 Danish Ports Danish Ports Established in 1917 and represents Denmark s commercial ports 64 members, including the Association of Private Ports Represents the commercial ports when dealing with governments
Bayport, Texas August 27, 2012
 Panama Canal Stakeholder Working Group Bayport, Texas August 27, 2012 Texas Ports - VALUE TO THE NATION Col. Christopher W. Sallese Commander, Galveston District U.S. Army Corps of Engineers This briefing
Dalian the Nearest Port to the World in North China
 Dalian the Nearest Port to the World in North China 7 th Feb. 2012 Xiaoling Huang Dalian Maritime University in China Location Hinterland of Dalian Port Russia Northeast Asian economic circle Mongolia
Section 4 Vessel Charges/Cargo Charges
 Section 4 Vessel Charges/Cargo Charges FREE TIME FOR ASSEMBLING OUTWARD CARGO 400 A vessel shall be allowed the use of assigned wharf space for a free time period of 30 calendar days, for the purpose of
AAPA Port & Marine Terminal Operator Perspectives January 29, 2015
 AAPA Port & Marine Terminal Operator Perspectives January 29, 2015 Thriving California Hub Top 11% of US Ports For containerized and noncontainerized Cargo Port Governance Commercial Trade Gateway Port
Maritime Components of the Canada-European Union Comprehensive Economic and Trade Agreement (CETA)
") Maritime Components of the Canada-European Union Comprehensive Economic and Trade Agreement (CETA) Presented to SODES Montreal Presented by Louise Laflamme and Dean Corno November 25, 2014 XXXXX Annex
Maritime Components of the Canada-European Union Comprehensive Economic and Trade Agreement (CETA) Presented to SODES Montreal Presented by Louise Laflamme and Dean Corno November 25, 2014 XXXXX Annex
Statement on Marine Transportation
 Page 1 Introduction Statement on Marine Transportation The U.S. Marine Transportation System (MTS) consists of ports, coastal and inland waterways, the Great Lakes, and the St. Lawrence Seaway and is an
THE NUMBERS STEPHEN TAYLOR
 THE NUMBERS STEPHEN TAYLOR Millions of tonnes UK PORT TRAFFIC LONG TERM 600 500 One-port 5% Coastwise 8% Oneport 7% Coastwi se 27% Exports 15% Imports 51% 400 300 200 100 0 1975 1977 1979 1981 1983 1985
HALIFAX PORT AUTHORITY BERTHAGE AND ANCHORAGE NOTICE SCHEDULE OF RATES. Item Description Rate
 BERTHAGE AND ANCHORAGE NOTICE EFFECTIVE: January 1, 2017 NOTICE N-1 I 1. The berthage rates per gross registered tonne are: (a) for the first period of 12 hours or part thereof... $0.0502 (b) for the second
Harbour Dues & Fee Schedule
 2018 Harbour Dues & Fee Schedule P. O. Box 415 245 Harbour Rd. W. Goderich, ONT. N7A 4C6 Tel: (519) 524-4247 Fax: (519) 524-6918 www.goderichport.ca GODERICH PORT MANAGEMENT CORPORATION (GPMC) HARBOUR
Management Consulting Engineering
 Management Consulting Engineering Growth Opportunities for General Cargo and Shallow-Draft Ports Presented by Guillaume Lucci, P.E. Principal Vice President & General Manager Ports and Maritime Services
UNDERSTANDING THE GLOBAL IMPACT OF INCREASED WATERWAY COMMERCE. Bruce Lambert Executive Director, Institute for Trade and Transportation Studies
 UNDERSTANDING THE GLOBAL IMPACT OF INCREASED WATERWAY COMMERCE Bruce Lambert Executive Director, Institute for Trade and Transportation Studies Does Waterway Commerce: Improve system efficiency Encourage
The Emergence of. Florida s Seaports and Inland Ports. Florida League of Cities - International Relations Committee November 17, 2011
 The Emergence of Florida s Seaports and Inland Ports Florida League of Cities - International Relations Committee November 17, 2011 History of the Global Supply Chain 2 Supply Chain, Circa 1950 Regional
Economic Impact Study of. New Bedford/Fairhaven Harbor
 Economic Impact Study of New Bedford/Fairhaven Harbor Examining the Economic Impact of the Port of New Bedford and the Phase V & Navigational Dredging in New Bedford/Fairhaven Harbor September 2016 PREPARED
Freight Transportation Megatrends
 Freight Transportation Megatrends Copyright 2006 Global Insight, Inc. Freight Demand Modeling: Tools for Public-Sector Decision Making Conference Paul Bingham Global Insight, Inc. Washington, DC September
Appalachia s Coastal Port Partners, Gateways to Global Commerce
 Appalachia s Coastal Port Partners, Gateways to Global Commerce Jim Walker Director of Navigation Policy and Legislation American Association of Port Authorities November 13, 2013 American Association
Arkansas Transportation Report
 Arkansas Transportation Report February 2017 Arkansas River traffic up nearly 16% in 2016 Despite continued declines reported in iron and steel shipments, food and farm products and petroleum products,
THE LOCAL AND REGIONAL ECONOMIC IMPACTS OF THE PORT OF CORPUS CHRISTI
 THE LOCAL AND REGIONAL ECONOMIC IMPACTS OF THE PORT OF CORPUS CHRISTI prepared for February 10, 2004 Martin Associates 2938 Columbia Avenue, Suite 602 Lancaster, PA 17603 TABLE OF CONTENTS EXECUTIVE SUMMARY...1
Presentation to Investors
 Presentation to Investors September 2015 Rand Logistics, Inc. NASDAQ: RLOG Forward-Looking Statements This presentation contains forward-looking statements. For all forward-looking statements, we claim
Richard Teubner, Vice President INTRODUCTION TO SEACOR AMH
 Richard Teubner, Vice President INTRODUCTION TO SEACOR AMH OVERVIEW SEACOR AMH is part of SEACOR Holdings Inc. Inland River Services (SCF). SEACOR Holdings (NYSE:CKH) and its subsidiaries are in the business
Evolving Role of Trade and Logistics in the International Northeast
 Evolving Role of Trade and Logistics in the International Northeast Presented by Glen Weisbrod Economic Development Research Group, Inc. 2 Oliver Street, 9 th Floor Boston, MA 02109 USA www. edrgroup.com
LONE STAR HARBOR SAFETY COMMITTEE Roger Guenther Executive Director Port of Houston Authority
 LONE STAR HARBOR SAFETY COMMITTEE Roger Guenther Executive Director Port of Houston Authority Terminal/Refinery Symposium Thursday, February16, 2017 HOUSTON THE BUSIEST U.S. CHANNEL ECONOMIC IMPACTS FOR
SAINT JOHN PORT AUTHORITY TARIFF NOTICES. Effective: January 1, 2018
 SAINT JOHN PORT AUTHORITY TARIFF NOTICES Effective: January 1, 2018 797052 v5 TABLE OF CONTENTS Notice Tariff Page Definitions 2 N - 1 Berthage 4 N - 2 Wharfage 6 N - 3 Harbour Dues 10 N - 4 Water Services
GALVESTON DISTRICT DREDGING CONFERENCE
 GALVESTON DISTRICT DREDGING CONFERENCE October 24, 2012 TEXAS PORTS - VALUE TO THE NATION Col. Christopher W. Sallese Commander, Galveston District U.S. Army Corps of Engineers This briefing is USACE SNAPSHOT
Arkansas Transportation Report
 Arkansas Transportation Report January 2018 Arkansas River traffic up 3% in 2017 Despite a slow start in the spring, barge activity on the Arkansas River in 2017 reached its second-highest total in the
THE 2016 NATIONAL ECONOMIC IMPACT OF IMPORTED IRON AND STEEL PRODUCTS ON THE U.S. MARINE TRANSPORTATION SYSTEM AND THE U.S.
 THE 2016 NATIONAL ECONOMIC IMPACT OF IMPORTED IRON AND STEEL PRODUCTS ON THE U.S. MARINE TRANSPORTATION SYSTEM AND THE U.S. ECONOMY Prepared for: American Institute for International Steel 1101 King Street
Transform Milwaukee. Section 8 Freight Transportation and Logistics. Summary Findings
 Transform Milwaukee Section 8 Freight Transportation and Logistics Summary Findings Freight Originating in the Milwaukee CSA 2011 Estimates to 2040 Projections Mode 1000 s of Tons in 2011 1000 s of Tons
Revenue Freight Traffic Statistics for the Major North American Railroads. Weekly Railroad Traffic
 Revenue Freight Traffic Statistics for the Major North American Railroads Weekly Railroad Traffic Week 26, Ended June 28, Notes 1. Traffic of Canadian railroads reflects their Canadian and U.S. operations,
Port of New Bedford. AAPA Commissioners Seminar May 17, 2011 Prosperity through Economic Development Opportunities
 Port of New Bedford AAPA Commissioners Seminar May 17, 2011 Prosperity through Economic Development Opportunities Port of New Bedford, Massachusetts Niche Port You are here Connected to Global Markets