Grain and Soybean Industry Dynamics and Rail Service
|
|
|
- Marvin Clifton Allison
- 6 years ago
- Views:
Transcription

 Parr Rosson")
1 Grain and Soybean Industry Dynamics and Rail Service Econometric Analysis of Rail Transport Rates Final Report March 2016 Hani Mahmassani, Michael Hyland, Lama Bou Mjahed, and Breton Johnson Northwestern University Transportation Center (NUTC) Parr Rosson Texas A&M University 1
2 Grain and Soybean Industry Dynamics and Rail Service Econometric Analysis of Rail Transport Rates BACKGROUND The Staggers Act of 1980 gave railroads considerable freedom in terms of price discrimination. Despite expectations of the contrary, rail transport rates decreased for most shippers after the Staggers Act. The Surface Transportation Board (STB) is responsible for handling rate disputes between shippers and railroads in regions where competition is limited. The STB collects a 1% stratified sample of all waybills originated by major carriers in the United States. A version of the data is available to the public. The analysis presented in this report uses the STB s publicly available carload waybill sample (CWS) to analyze rail transport rates.. The analysis examines trends in rail transport rates for (a) all shipments, (b) specific commodity-types including grain, and (c) specific regions of the country including two regions that produce a large amount of grain, the Upper Midwest and the I-states. The analysis additionally attempts to examine (a) the shipment characteristics that impact rail revenue per ton-mile (RPTM) and revenue per carload-mile (RPCM), (b) how the impact of the characteristics differ as a function of commodity-type and region of origin, and (c) how this impact fluctuated between 2001 and METHODOLOGY The CWS is a very large data set; hence, it was necessary to conduct an indepth exploratory analysis of the data. First and foremost, the exploratory analysis revealed errors in the dataset; therefore, the data was cleaned to remove nonsensical shipments and also filtered in order to remove extreme outliers. Second, data exploration uncovered correlations between variables in the dataset and also determined important temporal trends of specific variables. The data exploration results informed econometric models, which were developed to further analyze rail transport rates. Multivariate regression models were developed to analyze rail transport rates and answer the research questions posed in the Background section. SUMMARY OF THE RESULTS Data Exploration Results The correlation matrix for the CWS s fields shows that freight revenue per ton-mile (RPTM) is negatively correlated with distance, route density, weight, and carload number. These correlations are tested more systematically in the econometric models. Average RPTM increased, in real terms, between 2001 and Specifically, RPTM for grain and coal increased, as did the RPTM for export shipments. Econometric Modeling Results All Waybills Average RPCM for rail shipments increased between 2006 and The following shipment types were associated with lower RPCM: long distance shipments (see Figure 1), large shipments, and shipments bound for export. After accounting for shipment characteristics, the RPCM for bulk grain was lower than every other commodity-type examined, including: crude oil and natural gas, coal, food products, non-grain agricultural products, and chemicals. Coefficient Figure 1: Coefficient values for the regression model s distance parameter. Points are relative to shipments traveling miles. Grain Waybills Only Average RPCM increased significantly between 2004 and Average RPCM for export grain shipments was lower than the RPCM for non-export shipments in the early 2000s; however in 2012 and 2013, export RPCM was higher than non-export. Interestingly, between 2010 and 2013 there was no noticeable difference between RPCM for 90+ carload shipments, carload shipments, and 6-49 carload shipments. Upper Midwest Waybills Only Average RPCM increased steadily between 2008 and RPCM for grain shipments was significantly lower than the RPCM of other commodities in the Upper Midwest between 2001 and Interestingly, between 2001 and 2003 the RPCM for shipments on very high density routes (100,000+ shipments annually) was significantly higher than the RPCMs for lower density routes. Conversely, between 2004 and 2013, the RPCM for very high density routes was lower than the RPCM of all lower density routes. CONCLUSIONS Distance miles miles miles miles The econometric model results indicate that after controlling for shipment characteristics and other exogenous factors the average RPCM of rail shipments increased significantly, in real terms, between 2001 and 2013 with most of the increase occurring between 2004 and Further analysis shows that although RPCM increased for bulk grain shipments, the increase was consistent with a general increase in RPCM for all commodities during the period from 2001 to The regression model results show that the RPCM for bulk grain was consistently lower than the RPCM for many other commodity-types after holding other variables such as carload number, shipment distance, route density, and railcar ownership constant in the multivariate regression models. The methodology presented in the report provides a systematic means of determining trends in not only overall rail transport rates but also the shipment characteristics and exogenous factors that impact rates in different segments of the data.
3 Executive Summary The production and transportation of grain and soybeans, especially in the North American western regions, are undergoing significant restructuring driven by the desire and need to achieve economies of scale and reach export markets. Within the framework of the Northwestern University Transportation Center (NUTC) study that is focused on gaining insight into the restructuring process via (1) modeling grain 1 and soybean transportation service and (2) analyzing the grain industry and its transportation needs, this third and final track of the study focuses on rail freight rates. The objective of the third track is to understand the direction and magnitude of rail transportation rates over time and the predominant factors impacting the rates in a statistical sense. Understanding and capturing the dynamics behind freight rates, as this work seeks to do, is both important and complex. It is important for many reasons such as the implications for rail competitiveness and market share, the economic viability and global competitiveness of the United States grain sector, and the relationship between the grain industry and the transportation sector. As previous tracks of the analysis have shown, understanding and capturing the dynamics behind rates is complex because providing transportation service depends on a multitude of factors occurring in dynamic contexts. These factors are often hard to isolate and capture, and rates in general, in any given service and sector, are the result of a range of variables, market circumstances, and management discretion. Over the past four decades, freight railroad rates have evolved considerably both in terms of their magnitudes and the freedoms/restrictions that federal regulators have placed on railroads in terms of rate discrimination. Often, in discussions of rail transport rates two regimes are identified for context: before and after the Staggers Act of The Staggers Act gave 1 In this report, the term grain refers to bulk grains and bulk oilseeds (i.e. corn, wheat, and soybeans). 2 Winston, Clifford. "The Success of the Staggers Rail Act of 1980." AEI- Brookings Institute Center for 2 Winston, Clifford. "The Success of the Staggers Rail Act of 1980." AEI- Brookings Institute Center for Regulatory Studies (2005): < winston/10_railact_winston.pdf>. 3
4 railroads considerable freedom in terms of which shipments to provide service to and the rates charged to those shippers. Conversely, prior to Staggers Act, railroad companies were required by law to service certain shipments regardless of their relative profitability and without total control over the rates charged to shippers. Instead of comparing those two regimes, this study focuses on the years between 2001 and The results uncovered in this analysis should be placed in the more recent context of the restructuring process of both production and grain logistics. The data used in the analysis were obtained through the publicly available carload waybill sample (CWS) that the Surface Transportation Board (STB) collects from major railroads. In this report we perform an in-depth analysis of rail transportation rates using the CWS. The analysis examines all shipment types but emphasizes bulk grain shipments and shipments originating in the Upper Midwest (North Dakota, South Dakota, and western Minnesota). The analysis attempts to uncover trends in rail transport rates for (a) all shipments, (b) specific commodity-types including grain, and (c) specific regions of the country including two regions that produce a large amount of grain, the Upper Midwest and the I-states (Iowa, Indiana, Illinois, and Missouri). The analysis additionally attempts to examine (a) the shipment characteristics that impact rail revenue per ton-mile (RPTM) and revenue per carload-mile (RPCM), (b) how the impact of the characteristics differ as a function of commodity-type and region of origin, and (c) how the impact of the characteristics fluctuated between 2001 and The key explanatory variables used in this study were chosen based on an extensive literature review of rail transportation rates. The literature review revealed that predominant factors affecting rail freight rates include: distance traveled, shipment weight, carload number, commodity-type, export vs. domestic, and route density. Those variables, along with freight rates, were examined in a two-step process. First, a preliminary analysis was conducted to understand correlations and trends in the CWS data. This paved the way to a more robust analysis of freight rates and their determinants through multivariate regression models. The exploratory analysis included first a correlation study of major relationships in the data. The emanating results showed that freight revenue per ton-mile (RPTM) is negatively correlated with (1) distance, (2) weight, (3) carload number, (4) route density, (5) grain shipments, (6) car capacity, (7) exports, and (8) number of interchanges. This implies that longer distance shipments, larger shipments (heavier shipments and more carload shipments), higher volume routes, and shipments going through more interchanges were associated with lower RPTM. With the exception of the number of interchanges (which is not addressed in the literature), these relationships confirm literature findings. Correlation tests between the variables also showed that weight and carload number are highly correlated, suggesting that one of the two is sufficient to model RPTM and RPCM. Additionally, higher route density is associated with longer distance shipments and fewer interchanges. Coal shipments were strongly correlated with carload number and shipment weight, perhaps reflecting the fact that most coal is shipped using shuttle trains. 4
5 The exploratory analysis also examined trends in relevant variables. In general, shipment distances varied minimally over time; the average shipment distance in a given year ranged from 1,150 miles to 1,214 miles over 13 years. Moreover, a large percentage of the shipments in the data (around 30%) traveled between 250 and 800 miles. The average shipment weight in the data ranged between 87 tons and 100 tons. Shipment weights, like distances, were stable over time. Furthermore, most shipments in the CWS data were one-carload shipments (98%). Moreover, the majority of shipments in the data did not go through any interchanges (88% of shipments do not go through any interchanges). As for route density, the majority of the shipments in the data traveled on routes with medium or heavy density (i.e. between 1,000 and 100,000 M railcars) with 65% of shipments in this range. Finally, shippers behavior changed in terms of choosing to use fewer railroad-owned railcars over time. The share of railroad-owned railcars in 2013 amounted to 17%, compared to 29% in As for freight RPTM trends, preliminary results suggest that average RPTM for coal shipments was lower than the RPTM for grain shipments, and the RPTMs for coal and grain shipments were both lower than the RPTM for all shipments (including grain and coal). Nominal RPTM for coal increased from 1.7 cents per ton-mile in 2001 to 3.1 cents per ton-mile in Nominal RPTM for grain increased from 2.0 cents per ton-mile in 2001 to 3.6 cents per ton-mile in However, RPTM for coal had the highest compound annual growth rate (CAGR 3 ) between 2001 and 2013 at 5%, followed by grain with a CAGR of 4.7%. The CAGRs for grain and coal between 2001 and 2013 were slightly higher than the CAGR for all shipments in the data (4.6%). Furthermore, the analysis showed that RPTM was lower for export shipments than all shipments. Within export shipments, RPTM was highest for coal shipments, followed by allcommodity exports, and finally grain exports. RPTM for coal exports increased at the highest pace (8% annually); the CAGR for both grain exports and all exports was 4.7%. The regression models presented in the second phase of the analysis build upon the results presented in the exploratory phase. The regression models aim to determine trends in average RPCM for rail transport between 2001 and 2013 for (a) all shipments, (b) shipments of a specific commodity-type including bulk grain and coal, and (c) shipments originating from specific regions of the country including the Upper Midwest and the I-states. Regression modeling techniques allow one to determine the trends in RPCM while controlling for changes in shipment characteristics over time. The second purpose of the regression models is to examine the impact of shipment characteristics and other exogenous factors on RPCM for rail transport. Aside from commodity-type and origination region the analysis examines distance, shipment weight, carload number, route density, railcar ownership, number of railroad interchanges, and export vs. domestic. We segmented the data by commodity-type, origination region, and year in the analysis to determine how shipment characteristics impacted RPCM differently for various commodities and origination regions and how the impacts fluctuated over time. 3 Compound annual growth rate (CAGR) is calculated as follows: CAGR =!"#$%!"#$%!"!#!$%!"#$%!!"#!"#$% 1 5
6 All Waybills Important and notable model results are highlighted below. Average RPCM 4 (after controlling for shipment characteristics and other exogenous factors): o was relatively constant between 2001 and 2006 o noticeably increased between 2006 and o leveled off between 2012 and 2013 The following shipment types were associated with lower RPCM: o Long distance shipments (exerts very large effect) o Shipments traveling between a high density origination-termination region pair o Large shipments (i.e. high carload number) o Export shipments o Railroad-owned railcars After controlling for shipment characteristics, the model results suggest that grain shipments were associated with lower RPCM than every other commodity-type examined, including: crude oil and natural gas, coal, coal and petroleum products, food products, non-grain agricultural products, chemicals, and pulp and paper. Grain Waybills Only Average RPCM for grain shipments increased significantly between 2004 and The RPCM for export grain shipments was lower than the RPCM for non-export grain shipments in the early 2000s. However, in 2012 and 2013, the RPCM was higher for export grain shipments than non-export grain shipments. Route density did not have a consistent and significant effect on the RPCM for grain shipments RPCM was similar for 6-49 carload shipments, carload shipments, and 90+ carload shipments between 2010 and 2013 for grain shipments. This result contradicts the model results for all waybills and economies of scale typically associated with rail transportation. Upper Midwest Waybills Only Average RPCM for shipments originating in the Upper Midwest increased steadily between 2008 and The RPCM for grain shipments in the Upper Midwest was consistently lower than the RPCM for every other commodity-type examined between 2001 and Between 2001 and 2003 the RPCM for shipments on very high density routes (100,000+ shipments annually) was significantly higher than the RPCMs for all lower density route categories. Conversely, between 2004 and 2013, the RPCM for very high density routes was lower than the RPCMs of all lower density route categories. The RPCM for export shipments was consistently lower than the RPCM for non-export shipments in the Upper Midwest. In summary, the econometric model results indicate that average RPCM increased significantly in real terms between 2001 and 2013 with most of the increase occurring between 2006 and Further analysis showed that although average RPCM increased in the Upper 4 All revenues and RPCM were adjusted for inflation 6
7 Midwest and for grain shipments; the increase was consistent with a general increase in average RPCM for all shipments during the period from 2001 to The regression model results show that the RPCM for grain shippers was lower than the RPCM for many other commodity-types. The econometric regression models exhibited the aforementioned results while simultaneously taking into account and measuring the impact of shipment characteristics. Many of the shipment characteristics associated with lower RPCM in the econometric regression modeling analysis (long distance shipments, shipments on high-density routes, large shipments, and railroad-owned railcars) conform to previous findings in the literature 5. In addition, the econometric analysis determined that the RPCM for export shipments was consistently lower than the RPCM for domestic shipments between 2001 and 2013 for all commodity-types. However, in 2012 and 2013 the RPCM for export grain shipments was higher than the RPCM for non-export grain shipments. The methodology presented in the report provides a systematic means of determining trends in not only overall rail transport rates but also the shipment characteristics and exogenous factors that impact rates in different segments of the data. The analysis presented in this track of the NUTC study complemented the work completed in the previous two tracks; it combines both railroad operations and grain industry characteristics in an analysis of actual, observed rail freight rates. Through a two-step process of first understanding correlations and trends in the data and second studying the determinants of freight rates, this study uncovered major trends in rail freight rates and determinants of rail freight rates between 2001 and The results emanating from this analysis have important implications for both grain industry stakeholders as well as transportation providers. Finally, the NUTC research group identified two potential areas for future research. The first, and most obvious path, requires access to the STB s confidential waybill sample. The confidential waybill data include a number of fields that would improve the regression model developed in the second part of the report, including: fuel surcharge, estimated railroad variable cost, and better and finer geographical information. The second opportunity to improve the regression model involves combining outside data sources with the CWS. For example, other researchers have examined how potential freight transport competition influences rail transport rates. They combined the CWS with information related to the nearest navigable inland waterway from the shipment s origin and termination points, and the number of competing railroads that could potentially serve the demand. Other data sources that could be integrated with the CWS include fuel prices, and aggregate rail indices. 5 References to the existing literature are provided in the main report. 7
8 Contents Executive Summary Introduction Preliminary Analysis of Waybill Data Overview of Waybill Data Data Filtering Filters Applied Filtered Data Data Description Variable Definitions Correlations in the Data Key Trends in the Data Trends in Freight Rates (RPTM) Commodity- type Exports From Exploratory Analysis to Regression Modeling Multivariate Regression Models Pooled Model Segmentation by Year Segmentation by Commodity- type Segmentation by Origination Region Analysis of Grain RPCM in the Upper Midwest Conclusions and Future Research Appendix Exhibit A: CWS Variables (as given by the STB) Exhibit B: Shipment Origins Removed from the Data Exhibit C: Spatial Distribution of BEA Origins in the CWS data (as given by the STB) Exhibit D: STCC Code for Commodities Examined in this Study Exhibit E: List of BEA Origins in the CWS data (as used in this study) Exhibit F: List of BEA Termination Regions in the CWS data (as used in this study) Exhibit G: Shipment Distance Coefficient Value Results Exhibit H: Railcar Ownership and Export/Domestic Coefficient Value Results
9 1 Introduction Often in discussions of freight rail transport rates two regimes are identified for context: before and after the Staggers Act of The Staggers Act of 1980 gave railroads considerable freedom in terms of which shipments to provide service to and the rates charged to shippers. Conversely, prior to the Staggers Act, railroad companies were required by law to service certain shipments regardless of their relative profitability and without total control over the rates charged to shippers. The deregulation that emerged from the Staggers Act resulted in reduced rail transport rates to most shippers between 1980 and the end of the century. However, concerns still exist regarding rates charged to shippers, especially in regions of the country where shippers do not have alternative transportation options. Concerns have increased as the number of Class I railroads has decreased from thirty to seven over the past three decades due to rapid consolidation through mergers. Despite significant deregulation, rail rates are still subject to regulation and monitoring through the Surface Transportation Board (STB). The STB collects a 1% stratified sample of waybills from the Class I railroads each year in order to handle rate disputes and understand general trends in rail transportation rates. Fortunately, the STB releases a significant portion of the data (the released data includes all the waybills; however, a number of data fields are removed) to the public. The analysis presented in this report makes use of the publicly available carload waybill sample (CWS) provided to the public by the STB. Understanding and capturing the dynamics behind freight rates is both important and complex. It is important for many reasons such as the implications for rail competitiveness and market share, the economic viability and global competitiveness of the United States grain sector, and the relationship between the grain industry and the transportation sector. As previous tracks of the analysis have shown, understanding and capturing the dynamics behind rates is complex because providing transportation service depends on a multitude of factors occuring in dynamic contexts. These factors are often hard to isolate and capture, and rates in general, in any given service and sector, are the result of a range of variables, market circumstances, and management discretion. The work presented in this report addresses these difficulties by studying actual shipment records (waybills) over 13 years (from 2001 to 2013) to examine both the direction and magnitude of the changes in rates over time and the predominant factors determining them in a statistical sense. In particular, the analysis examines evidence for increases and decreases in 6 Winston, Clifford. "The Success of the Staggers Rail Act of 1980." AEI- Brookings Institute Center for Regulatory Studies (2005): < winston/10_railact_winston.pdf>. 9
10 average revenue per carload-mile (RPCM) and average revenue per ton-mile (RPTM) for rail transport. By doing so, the report will seek to answer the following questions: Have average RPCM and average RPTM for rail transport increased or decreased over the past 13 years? How has this increase or decrease been different for different commodities (i.e. grain versus coal, versus all others)? What shipment characteristics and other exogenous factors are associated with higher or lower average RPCM and RPTM? The report answers the previous set of questions through two main sections. Section 2 presents a preliminary analysis of the data that includes a description of key variables, correlations between the variables, and trends of individual variables over time. Section 3 details the econometric models used to uncover the predominant factors that can explain trends in RPCM and their relative importance. 2 Preliminary Analysis of Waybill Data The first part of the report aims at understanding the data broadly with the objective of (1) providing direction for a deeper analysis of freight rail rates and (2) providing context for the analysis of the model results presented in the econometric modeling portion of the report. For that purpose, the data is described, filtered, and analyzed through (1) correlations between key variables and (2) individual trends. 2.1 Overview of Waybill Data The data used to analyze rail rates in this study come exclusively from the CWS available on the STB s website 7. The CWS is a 1% stratified sample of all rail movements originating or terminating in the U.S. by rail carriers terminating more than 4,500 revenue carloads annually. The CWS dataset contains approximately 600,000 waybills per year from 1986 through Table 2-1 below displays the exact number of waybills corresponding to the years analyzed in this study (i.e ). Each publicly available waybill contains 63 fields, the most interesting of which are discussed and analyzed throughout this section. The full list of fields is presented in Exhibit A: CWS Variables (as given by the STB) of the Appendix. The confidential waybill sample contains 130 additional fields that are removed from the publicly available sample. The most interesting variables excluded from the publicly available sample include: total variable cost (computed using the Uniform Railroad Costing System), the carrier, fuel surcharge, and variable cost and revenues broken down by carrier. 7 STB Waybill s website: 10
11 Table 2-1: Total Waybills per Year in the STB's Carload Waybill Sample Year Waybills , , , , , , , , , , , , , Data Filtering The CWS, like any large dataset, contains errors and outliers that should be accounted for before the data are used in econometric models. Based on an extensive literature review as well as scientific judgment, the filters applied to the data are described below. Filters Applied The dataset was trimmed with respect to four factors: origination region, weight, distance, and freight rates (i.e. RPTM). Shipments Origination The final analysis only includes shipments originating in the United States. This excludes waybills with Business Economic Area (BEA) origins falling in Canada or Mexico. The full list of origins removed from the data and their corresponding BEA codes, as defined by the STB, can be found in Exhibit B: Shipment Origins Removed from the Data of the Appendix. Between 3% and 4% of the data were removed after this filter was applied (6.6% removed for 2003). Weight It is common practice that shippers do not pay for empty shipments (i.e. zero weight shipments). Also, carload specifications dictate that no more than 130 tons/railcar of laden weight can be shipped 8. Therefore, shipments with reported weights of: less than or equal to zero, or greater than 130 tons were removed from the dataset. Less than a half percent of the data were removed after this filter was applied. 8 Analysis of Freight Rail Rates for U.S. Shippers, Escalation Consultants Inc., March 2014 suggests that Gross track weight limitations are 286,000 lbs. or 143 tons. The tare weight or empty weight of typical railcars range between 26 and 55 tons, adding 130 tons of laden to an empty car will exceed the 143- ton limit. 11
12 Distance The literature suggests that shipments transported less than 20 miles are switching movements between railroads rather than actual shipments. Therefore, an analysis of those shipments would not reflect a true analysis of shipment rates. Hence, these shipments were removed from the dataset. Naturally, this filter accounts for the removal of zero-miles shipments. Between 1% and 2% of the data were removed after this filter was applied. Freight Rates (RPTM) Freight rates here are defined as the total revenue divided by shipment length and weight for each waybill, i.e. revenue per ton-mile (RPTM). Both shippers and carriers perspectives were taken into account for this filtering. First, because carriers do not ship at a loss, nonpositive RPTMs were removed from the dataset. Also, because shippers do not pay more than $30,000/carload for their shipments, waybills with revenue per carload exceeding this value were removed from the dataset. Less than a half percent of the data was removed after these filters were applied. Moreover, to avoid outliers in the data, and because it is suggested by the STB that between a quarter and half of 1% of the data contain errors, we removed the top and bottom 0.5% of the data after applying all the filters described above. Filtered Data The resulting dataset contains 94% of the publicly available CWS waybills for 2004 through 2013, 91% for 2003 and 93% for 2001 and 2002 (See Table 2-2). Table 2-2: Pre- and Post-Filtered Waybill Data Summary ( ) Total waybills Number of waybills Percent of in original CWS after filtering original CWS Year N 0 N % , , , , , , , , , , , , , , , , , , , , , , , , , , The filtering process did not change the trend in the average RPTM. The average RPTM for different years, commodity-types, and regions of origin are described in detail in the following sections. 12
13 2.3 Data Description The objective of this section is to explore the data via describing the key variables, their respective categories, and their evolution over time. Variable Definitions An extensive literature review revealed that key determinants of RPTM include distance traveled 9, shipment size 10, commodity-type 11, and shipment type 12. Those variables are therefore important to the analysis and are described in Table 2-3 as found in the CWS. We also aimed to understand the effect of car ownership-type (private or railroad-owned) on RPTM and its evolution over time because railroads offer incentives to shippers using their own railcars. We contribute to other studies by additionally looking at the number of interchanges and the spatial distribution (See Table 2-4) of shipments. Finally, shipment weights are important because they are used to calculate RPTM for individual shipments. More variables were of interest to this study than the basic variables given in the CWS. Using the basic variables in the CWS we created new variables; additionally, we created explicit categories for the variables displayed in Table 2-3. Table 2-4 describes the added variables used in the analysis. First, RPTM and other shipment characteristics vary substantially across specific commodities, therefore the analysis differentiates between commodity-types. Second, with the increased differentiation in performance and use of shuttle trains versus traditional trains, the carload number were segmented into different categories. Finally, route density is a factor that is increasingly discussed in the performance of railroads; therefore its implication on RPTM is examined in this analysis. The route density variable was created by summing the number of carloads moving between each origin-termination pair in the CWS for each year. 9 References: Rail Tariff Rates for Grain by Shipment Size and D Distance Shipped, Marvin Prater Daniel O Neil, Jr, AMS, USDA, June 2014; Review and Analysis of Corn Rail Rates, Informa Economics, June 2010; Rail Rate and Revenue Changes Since the Staggers Act, by Ken Casavant, Eric Jessup, Marvin E. Prater, Bruce Blanton, Pierre Bahizi, Daniel Nibarger, Johnny Hill, and Isaac Weingram; Study of Railroad Rates: , Office of Economics, Environmental Analysis & Administration Section of Economics, STB, January Reference: Rail Tariff Rates for Grain by Shipment Size and Distance Shipped, Marvin Prater Daniel O Neil, Jr, AMS, USDA, June References: Rail Tariff Rates for Grain by Shipment Size and Distance Shipped, Marvin Prater Daniel O Neil, Jr, AMS, USDA, June 2014; Review and Analysis of Corn Rail Rates, Informa Economics, June 2010; Rail Rate and Revenue Changes Since the Staggers Act, by Ken Casavant, Eric Jessup, Marvin E. Prater, Bruce Blanton, Pierre Bahizi, Daniel Nibarger, Johnny Hill, and Isaac Weingram; Study of Railroad Rates: , Office of Economics, Environmental Analysis & Administration Section of Economics, STB, January Reference: Study of Railroad Rates: , Office of Economics, Environmental Analysis & Administration Section of Economics, STB, January
14 Table 2-3: Description of Freight Variables in the CWS Used in Econometric Models Freight Variable Description 13 Freight Revenue Billed Weight in Tons Estimated Short Line Miles Carload Number Commodity Code (STCC) Type of Move 14 The total line-haul freight revenue, from origin to destination, shown in $ The billed weight of lading, calculated in tons The short line miles (shortest rail distance between origin and destination) rounded to the nearest ten miles The total carload number on the sampled waybill The standard Transportation Commodity Code (STCC) identifies the product designation for the transported commodity. Designation of export, import, or domestic shipment (P) Privately-owned car Car Ownership Code Car Capacity Number of Interchanges Miscellaneous Charges ($) Origin and Termination BEA 15 (R) Railroad-owned car (T) Trailer Train owned car Cubic foot capacity of car (for all car types except flat) The figure represents the total number of interchanges between railroads in the route The total of all miscellaneous charges (excluding transit charges and freight revenue) shown in dollars The Business Economic Area code for the reported waybill movement's origin or termination location. See Department of Commerce Bureau of Economic Analysis, Business Economic Area Codes revised for The description is taken from STB s documents accompanying the CWS data 14 Unfortunately a large portion of the shipments are labeled unknown rather than import, export, or domestic. In the exploratory analysis and regression modeling sections we create a dummy variable for exports. All shipments labeled export are given a value of one; whereas, shipments with any other label are given a value of zero, including, domestic, import, and unknown. 15 The complete set of BEAs on a map can as given by STB data be found in Exhibit C: Spatial Distribution of BEA Origins in the CWS data (as given by the STB) of the Appendix. 14
15 Table 2-4: Description of Freight Flow Variables created for use in the Econometric Models Freight Variable Description Grain = Wheat, Corn, and Soybean; Crude oil and Natural Commodity-Type 16 gas; Coal; Chemicals; Farm non-grain; Pulp/Paper; Oil and Coal Products; Food; and Other. Number of Interchanges 0; 1; 2; and 3+ Carload Number 1; 2-5; 6-49; 50-90; and 90+ Route Density (Continuous) The carload number traveling between a given OD pair in a given year Route Density (Categorical) Distance Spatial distribution 17 Less than 100 carloads annually Between 100 and 1,000 carloads Between 1,000 and 10,000 carloads Between 10,000 and 100,000 carloads More than 100,000 carloads Short! Estimated Short Line Miles Low-Medium! miles High-Medium! miles Long! miles Very Long! miles Origin dummy variables: Northeast (NE), Southeast (SE), Penn_Ohio_Mich_Wisc, I-states, Upper Midwest (UMW), Nebraska_Kansas_Colorado, Texas_Oklahoma_NewMexico and Wyoming_Missouri_Idaho Termination dummy variables: Texas, the Pacific Northwest (PNW), and Louisiana. Correlations in the Data This section examines correlations in the data to better understand prevalent relationships before delving deeper into individual trends. The matrix below examines the correlation between key variables discussed in the previous section. The matrix in Figure 2-1 corresponds to the 2001 CWS but is meant to describe relationships throughout the years, as preliminary analysis determined that the correlation between variables was consistent between 2001 and The corresponding STC codes can be found in Exhibit D: STCC Code for Commodities Examined in this Study of the Appendix. 17 The complete list of regions can be found in Exhibit E: List of BEA Origins in the CWS data (as used in this study) of the Appendix. 15

16 *Freight rates 1 = Revenue/ton- mile Figure 2-1: Correlation Matrix of Key Variables in the Data The correlation matrix displayed in Figure 2-1 is more helpful in describing the direction of correlations in the data than the strength of the correlations. Robust regression models presented in the next section serve this specific purpose. Freight Rates (RPTM) Determinants The correlation matrix shows that RPTM is negatively correlated with (1) distance, (2) weight, (3) carload number, (4) route density, (5) grain, (6) car capacity, (7) exports, and finally (8) number of interchanges. First, this implies that RPTM is higher for shorter distance shipments. This conforms to the results in the literature which show that RPTM is lower for longer shipment distances than shorter shipment distances 18. This is explained by the railroads desire to increase asset utilization and revenue generation of their rolling stock. Second, the results suggest that RPTM is lower for larger shipments (more carload shipments and heavier shipments). This is consistent with previous studies including a recent 18 Reference: Study of Railroad Rates: , Office of Economics, Environmental Analysis & Administration Section of Economics, STB, January
17 USDA report 19 suggesting that smaller shipments are associated with noticeably higher RPTM than large shipments. The report found that in 2011 RPTM for large shipments were 30 percent lower (equivalent to just over 1.3 cents/ton-mile less) than those for the smallest shipment size. Third, the results also suggest that RPTM is lower for high volume routes. This also goes along the same direction as results found in the literature 20. The matrix also shows that lower RPTM is associated with grain shipments and shipments going to export. This invites further investigation through the models developed in the second part of this report. Finally, the matrix indicates that lower RPTM is associated with a higher number of interchanges. The interpretation of this result is not very clear and is left for the second part of this report. Correlations between the Variables in the Data The correlation matrix shows that carload number and shipment weight are highly positively correlated. This suggests that using only one of the two variables in the regression model is sufficient for the analysis. In fact, using both variables might lead to multi-collinearity issues. In the following econometric analysis section, RPCM is used rather than RPTM. The correlation matrix suggests that results should be similar for both definitions. In fact, regression models confirmed that using RPCM and RPTM produced very similar results. Second, the number of interchanges and route density are negatively correlated. This might reflect the fact that shippers and railroads both want to avoid the costs of switching rail operators. Coal shipments are strongly correlated with carload number and shipment weight. This likely reflects the fact that shuttle and unit trains are being used for coal shipments. Finally, a higher route density is associated with longer distance shipments. This could indicate that railroads are more efficient at transporting shipments long distances and that railroad pricing reflects these efficiencies. Key Trends in the Data After identifying key variable relationships in the data, this section turns to a more differentiated analysis of each variable. The variables discussed include: (1) distance, (2) weight, (3) railcar ownership, (4) carload number, (5) commodity-type, (6) exports (7) number of interchanges, (8) route density, (9) spatial distribution of shipments, and (10) RPTM. Distance In general, shipment distances varied very little over time ranging from 1,150 miles to 1,214 miles over 13 years. The majority of the shipments in the data (around 30%) are in the low-to-medium category (i.e. between 250 and 800 miles), followed by very long shipments (i.e. 19 Reference: Rail Tariff Rates for Grain by Shipment Size and D Distance Shipped, Marvin Prater Daniel O Neil, Jr, AMS, USDA, June Reference: Competition and Rail Rates for the Shipment of Corn, Soybeans, and Wheat, James M. MacDonald 17
18 more than 2000 miles) with a share of approximately 23% of the shipments, slightly higher than medium-to-high shipments (i.e. between 800 and 1200 miles) and long-distance shipments (i.e. between 1200 and 200 miles) with around 20% of the shipments each. The lowest share of 8% is for the short distances (i.e. between 20 and 250 miles). Weight The average weight in the data ranged between 87 tons (reached in 2013) and 100 tons (reached in 2009). Shipments weights, like distances were stable over time. Railcar Ownership Unlike distance and weight, railcar ownership changed over time, with shippers using fewer railroad-owned railcars over time. In 2013, 17% of shipments used railroad-owned railcars compared with 29% in This could be due to the premiums that railroads charge for using railroad-owned railcars 21. Carload Number Most shipments in the CWS data are one-carload shipments (98%). It is likely that onecarload shipments make up a huge majority of all rail waybills; however, it was brought to the NUTC s attention that sometimes each single carload on multi-car, unit, and shuttle trains are given their own waybill. This misreporting of carload number in the waybill sample may be the reason why the proportion of one-carload shipments is so high. The next highest share is for 2-5 carloads (1-1.5%), followed by 6-49 carloads (0.5% to 0.8%), and followed by 90+ carloads ( %) and finally carloads ( %). The percentages were relatively stable over time. Commodity- type Table 2-5 below shows the percentages of different commodities in the data. 21 It is worth noting here that shipments in the data can also be categorized as Trailer Train; however, the percentage of shipments designated Trailer Train is very low.. Those were not taken into consideration in this analysis. Also, some shipments were unpopulated (neither private, nor railroad, nor Trailer Train). Those shipments as well were dropped from the analysis. The percentages here reflect the number out of both railroad- owned and private railcars. 18
19 Table 2-5: Commodity Percentages in the Data Commodity Percentage of shipments Percentage of carloads Chemical 8-9 % 6-8% Bulk Grain (corn, wheat, soybean) 0.4% 3.1% Coal 0.7% 22% Oil and Gas 2 % 2% Farm (non-grain) 1-2% 2-3% Food 6-8% 5-6% Pulp paper 3-4% 2-2.6% The number of coal shipments decreased significantly between 2001 and Grain shipments fluctuated with peaks in 2007 and Chemical shipments increased over time with a drop between 2008 and Farm (non-grain) shipments significantly increased between 2007 and 2008 and continued rising until Exports Figure 2-2a and Figure 2-2b show that the percentage of all shipments and carloads labeled export was relatively constant between 2001 and 2013, respectively. The percentage of shipments labeled export was between 4% and 7% every year from 2001 to Figure 2-2a shows that the percentage of coal shipment labeled export decreased significantly between 2005 and Between 2001 and 2005 the percentage of coal shipments labeled export was between 35% and 60%; whereas, after 2005 the percentage ranged from 3% to 5%. However, Figure 2-2b shows that the percentage of coal carloads labeled export remained relatively stable between 2001 and The largest percentage of coal carloads labeled export was 3.5% and the lowest was 1.3% between 2001 and Figure 2-2a and Figure 2-2b show that the percentage of grain shipments and carloads labeled export increased significantly and steadily between 2001 and 2011/2012, respectively. The percentage of grain shipments labeled export increased from 3-5% in the early 2000s to 20-30% between 2009 and
20 70% Percentage of Shipments Labeled Export 60% 50% 40% 30% 20% 10% 0% All Shipments Grain Coal Figure 2-2a: The percentage of shipments labeled export by commodity-type 25.00% Percentage of Carloads Labeled Export 20.00% 15.00% 10.00% 5.00% 0.00% All Shipments Grain Coal Figure 2-2b: The percentage of carloads labeled export by commodity-type We use the phrase labeled export because each year between 51% and 55% of all shipments are labeled unknown in the move type data field which designates shipments import, export, or domestic. The results in Figure 2-2a and Figure 2-2b include the shipments labeled unknown; hence, the figures understate the percentage of shipments in each commodity category that are bound for export each year. Figure 2-3a and Figure 2-3b display the percentage of shipments bound for export after excluding the shipments labeled unknown. As expected the percentage going to export increases (i.e. it nearly doubles) for all shipments, grain, and coal. The percentage of grain shipments bound for export between 2010 and 2013 ranges from 45% to 60%; whereas, the percentage of grain carloads bound for export ranges from 35% to 43% over the same period. Despite the change in magnitude that occurs when the shipments labeled 20
21 unknown are removed, the general trends displayed in Figure 2-2a and Figure 2-2b remain the same. 80% 70% 60% 50% 40% 30% 20% 10% 0% Figure 2-3a: Percent of shipments not labeled unknown that are bound for export by commodity-type 45% 40% 35% 30% 25% 20% 15% 10% 5% Percentage of Labeled Shipments bound for Export Figure 2-3b: Percent of carloads not labeled unknown that are bound for export by commodity-type Number of Interchanges All Shipments Grain Coal Percentage of Labeled Carloads bound for Export 0% All Shipments Grain Coal The majority of shipments in the data do not go through any railroad interchange (88% yearly), 12% go through one interchange, 1% to 2% go through two interchanges and less than 0.5% go through three or more interchanges. The number of shipments and their percentages are relatively stable over time. The largest decrease occurred for shipments going through one interchange. 21
22 Route Density Route densities for shipments in the CWS mostly fall under medium (between 1,000 and 10,000 carloads) and heavy (10,000 and 100,000 carloads) route density with 65% of shipments in these two categories. Next comes really high route density (i.e. more than 100,000 carloads) with a share of 23%. The next largest category is low route density (between 100 and 1,000 carloads) with a share of 7%, and finally no route density (less than 100 carloads) with a share of 4%. The percentages are relatively stable over time except for 2009 and In 2009 there were no shipments in the really high route density category. In 2010 there were no shipments in the small and medium congestion categories and all the majority of the shipments travelled on congestion-free routes. Spatial Distribution of Shipments Table 2-6 below shows the percentage of different shipment origins and terminations in the CWS dataset. The Upper Midwest origination point makes up 1.3% of all shipments and 4% of the carloads, indicating that the average carload number of shipments originating in the Upper Midwest is significantly higher than the national average. Origin Table 2-6: Percentage of Different Regions in the United States Percentage of shipments Percentage of carloads Northeast 35% 28% Pennsylvania- Ohio-Michigan-Wisconsin 23% 18% Southeast 6.3% 10% Texas-Oklahoma-New Mexico 6% 5% Wyoming-Montana-Idaho 1.1% 12% I-states (Indiana, Iowa, Illinois and Missouri) Upper Midwest (North Dakota, South Dakota, western Minnesota) 3.8% 4% 1.3% 4% Nebraska-Kansas-Colorado 1% and less 1.6% Termination Percentage of shipments Percentage of carloads Texas 3% to 4% 4% Pacific Northwest (Northern California, Oregon, Washington) 2% to 5% 3% Louisiana 1% and less 1% and less 2.4 Trends in Freight Rates (RPTM) This last section of the first part of the report serves as a preliminary step in understanding trends in RPTM. Below we look at RPTM based on (1) commodity-type: all 22
23 shipments versus grain shipments versus coal shipments and (2) export vs. domestic: all shipments versus export shipments and export shipments segmented into grain and coal. Commodity- type Figure 2-4a and Figure 2-4b show that the average RPTM for coal was less than the average RPTMs for bulk grain and all shipments. The only major difference between Figure 2-4a and Figure 2-4b is that adjusting for inflation flattens-out the increase in RPTM for all shipments, grain, and coal. Nominal RPTM for all shipments increased from 2.9 cents per tonmile in 2001 to 5.3 cents per ton-mile in Nominal RPTM for grain (coal) shipments increased from 2.0 (1.7) cents per ton-mile in 2001 to 3.6 (3.1) cents per ton-mile in However, the average RPTM for coal had the highest compound annual growth rate (CAGR 22 ) at 5.0%, followed by grain with a CAGR of 4.7%. The CAGR for average RPTM for all shipments was 4.6%. 6.0 Nominal RPTM Trends - Commodity Analysis 5.0 Cents/ton- mile All Shipments Grain Coal Figure 2-4a: Trends in average nominal RPTM by commodity-type 22 Compound annual growth rate (CAGR) is calculated as follows: CAGR =!"#$%!"#$%!"!#!$%!"#$%!!"#!"#$% 1 23
24 Real RPTM Trends- Commodity Analysis Cents/ton- mile Figure 2-4b: Trends in average real (2010 dollars) RPTM by commodity-type Exports All Shipments Grain Coal Figure 2-5 displays the average real RPTMs for grain export shipments and coal export shipments compared with the average real RPTMs for all exports and all shipments (export and domestic). The figure shows that the average real RPTM for grain shipments was consistently the lowest of the four categories; moreover, Figure 2-5 shows that the average real RPTM for all export shipments was consistently lower than the RTPM for all shipments. The result that the RPTM for export shipments is lower than the RPTM of all shipments is examined more formally in Section 3. Lastly, the figure shows that even in real terms, the average real RPTM for coal shipments significantly increased between 2001 and In 2001 the average RPTM (in 2010 dollars) for export coal shipments was 4.2 cents per ton-mile; whereas, in 2013 the RPTM (in 2010 dollars) for export coal shipments increased to 8.8 cents per ton-mile. Out of all exports, coal export RPTM increased at the highest rate (8% annually). Export grain increased annually at the same rate as all export shipments (4.8% annually). 24
25 12.00 Real RPTM Trends- Export Shipments Cents/ton- mile All Exports Grain Exports Coal Exports All Shipments Figure 2-5: Trends in average RPTM for different export commodities in real terms 2.5 From Exploratory Analysis to Regression Modeling The exploratory analysis undergone in the first part of the report serves as a preliminary step in understanding the data at hand through: (1) the identification of key variables, their statistics and trends, (2) examining correlations between variables, and (3) looking at trends in RPTM and other variables over time. While this is a crucial step to provide background, direction, and a sense of which variables are related and the degree of their relation, it does not tell the entire story. For example, weak correlations do not allow for strong conclusions; therefore a deeper statistical analysis is necessary. Furthermore, correlations and relationships between multiple variables need to be considered simultaneously to avoid spurious correlations and omitted variable bias. The next section of this reports builds on the results presented above to address the limitations of simple exploratory analysis and variable correlation through robust econometric models. 3 Multivariate Regression Models The econometric regression models and the results presented in this section serve two main purposes. The first is to determine trends in average RPCM for rail transportation between 2001 and 2013 after controlling for shipment characteristics such as carload number, shipment distance, route density, railcar ownership, and export vs. domestic. We specifically determine whether or not trends in RPCM differed for grain shipments and shipments originating in the Upper Midwest (North Dakota, South Dakota, and western Minnesota) relative to overall trends in RPCM for all shipments. The second purpose of the regression models is to determine the shipment characteristics associated with higher and lower RPCM and examine how the associations varied across origination region and commodity-type. The regression models include the following shipment characteristics: shipment distance, carload number, number of railroad interchanges, route density, export vs. domestic, railroad or private railcar ownership, 25
26 and shipment weight. The models also take into account the commodity-type, shipment origination and termination point as well as the year the shipment occurred. Using the entire CWS, Section 3.1 presents a multivariate regression model to determine how specific shipment characteristics impacted RPCM. Additionally, the analysis determines whether average RPCM increased or decreased between 2001 and 2013 in real terms, controlling for the aforementioned shipment characteristics. The regression models in Section 3.1 are run on all the waybills that remained after the filtering process described in Section 2.2. In Section 3.2 we segment the data by year (i.e. we run the same regression model on data from 2001, 2002,, 2013 separately) in order to determine trends in the impacts of shipment characteristics on average RPCM. The combined model in Section 3.1 determines how, on average between 2001 and 2013, RPCM was impacted by different shipment characteristics, commodity-type, and region of origin. Section 3.2 examines whether and how the impact of the shipment characteristics, commodity-type and region of origin varied between 2001 and Section 3.3 analyzes grain and coal rail shipments exclusively and Section 3.4 analyzes shipments originating in the Upper Midwest and in the I-states (Iowa, Indiana. Illinois, and Missouri) exclusively. The goal of these two sections is to analyze grain transport rates and transport rates in the Upper Midwest; however, we also analyze coal and the I-states in order to compare grain shipments and shipments originating in the Upper Midwest with comparable segments of the dataset. In both Section 3.3 and Section 3.4 we analyze the types of shipment characteristics associated with higher and lower average RPCM. Like Section 3.2, separate regression models are run for each year between 2001 and Section 3.5 focuses solely on grain shipments originating in the Upper Midwest. The analysis aims to determine the shipment characteristics associated with higher and lower average RPCM. 3.1 Pooled Model In this section we examine the entire filtered CWS dataset, i.e. the data were not segmented by commodity, year, geographical region, or any other factor. The entire, filtered CWS dataset was the input to the multivariate regression model displayed in Equation 1. revenue ln carloads dist weight = β! carloads + β! dist!"#$ + β! RouteDen!"#$ + β! Carloads!"#$ Equation 1 + β! Interchanges!"#$ + β! Commod!"#$ + β! Origin!"##$ + β! Term!"##$ + β! Ownership!"##$ + β!" Export!"#!" Equation 1 is a log-linear model, a generalization of a linear model wherein the log of the dependent variable is used to reduce heteroscedasticity and model non-linear relationships. The term on the left-hand side of Equation 1 (i.e. the dependent variable) is the natural logarithm of RPCM. The first term on the right-hand side of Equation 1 is the ratio of a shipment s total weight divided by the number of carloads in the shipment. We expect the heavier the average carloads in a shipment the higher the RPCM, i.e., we expect β! to be positive. The next four 26
27 explanatory variables (dist!"#$, RouteDen!"#$, Carloads!"#$, Interchanges!"#$ ) are ordinal variables. For example, the variable dist!"#$ has five ordinal levels: miles, miles, miles, , and 2000 or more miles. The Commod!"#$ variable defines the commodity-type that was transported. Each waybill is assigned a commodity-type by the carrier; in this analysis we narrow the number of commodity-types considerably. The Commod!"#$ variable only includes chemicals, bulk grain, crude oil and natural gas, coal, food, non-grain agricultural products, and coal and petroleum products. All the remaining waybills with different commodity-types are grouped together and labeled other. The variables with a subscript dummy indicate binary variables. For example, Ownership!"##$ equals one if the railroad owns the railcars and zero if the railcars are privately-owned. The origin and termination variables actually represent a group of dummy variables. For example, we assigned dummy variables to shipments terminating in Texas, the Pacific Northwest, and Louisiana (three of the largest regions for export shipments). Presented below are the variable descriptions. revenue: price paid by shippers to railroad carloads: number of carloads on a waybill dist: distance the shipment traveled weight: total weight transported RouteDen: density (carloads/year) of the shipment s origin-termination pair Origin: a shipment s origination point Term: a shipment s termination point Commod: commodity-type Interchanges: number of railroad interchanges between origin and destination Ownership: 1 if railroad owns railcars on waybill; 0 if railcars privately-owned Export: 1 if the shipment is bound for export; otherwise, 0 β! : coefficient estimate of variable i [0,10] time: year the shipment was transported Table 3-1 displays the results of the multivariate regression model, presented in Equation 1, run on the pooled dataset (i.e. all the filtered CWS s between 2001 and 2013). Each of the variables included in the model along with their relative factor levels, if relevant, are listed in the first column. The second column displays the coefficient value estimates for each of the variables in the model. The third column displays the p-value of each of those coefficient estimates. The p-values were calculated using heteroscedastic consistent standard errors Reference: Long, J. Scott, and Laurie H. Ervin. "Using Heteroscedasticity Consistent Standard Errors in the Linear Regression Model." The American Statistician 54.3 (2000): 217. Web. 27
28 Table 3-1: Results of multivariate regression model run on entire CWS. Parameter Coefficient Estimate P-value (Intercept) tons/ carloads Distance (base = miles) miles miles miles miles Route Density (base = <100 carloads) carloads ,000-9,999 carloads ,000-9,999 carloads ,000+ carloads Carloads (base = 1 Carload) 2-5 Carloads Carloads Carloads Carloads Interchanges (base = 0) 1 Interchange Interchanges Interchanges Commodity (base = Other) Chemical Coal Crude Oil and Natural Gas Agriculture (excluding grain) Food Products Grain Coal and Petroleum Products Pulp and Paper Regional Dummy Variables UMW Origin I-States Origin TxOkNm Origin Northeast Origin WyMoId Origin Texas Termination PNW Termination Louis Termination Other Dummy Variables Railroad Owned Export R 2 = , Adjusted R 2 = Residual Standard Error: on degrees of freedom 28
29 The interpretation of the parameter coefficient values in Table 3-1, due to the fact that we used a log-linear model, are as follows: a one unit increase in the parameter (e.g. export) produces an expected change in the log of the dependent variable (RPCM) of β!" (the coefficient in Equation 1 for the export dummy variable) 24. More intuitively, the percent change in RPCM as a parameter increases by one unit is defined as follows: 29 y + y y let y = RPCM = exp β!" Export!"##$ = exp β!" 1 y y = exp β!" 1 As an example, the percent change in RPCM if a shipment is labeled export rather than nonexport is -29%. y y = exp = y y = 0.29 The third column of Table 3-1 shows that all of the coefficient value estimates have p-values less than except for the dummy variable designating shipments originating in the I-states. An interesting result, displayed in Table 3-1, is that the RPCM was lower for export shipments than non-export shipments. This result takes into account carload number, shipment distance, route density, and commodity-type. This result is consistent with the exploratory analysis in Section 2. In contrast to the results of the exploratory analysis, which suggest that average RPCM decreased with the number of railroad interchanges, Table 3-1 shows that the RPCM is actually higher for one or two railroad interchanges than zero interchanges. It is unclear why the coefficient for three or more interchanges is smaller than the coefficient for one interchange and two interchanges. We can think of two possible explanations: (1) the number of shipments in the three or more category is relatively small suggesting that there is not enough data to make a strong conclusion about the magnitude of the parameter (however, the p-value for the parameter is indicating that the standard-error is small relative to the coefficient estimate) and (2) given how rare it is for shipments to be transported by more than three railroads, it is possible that the number of interchanges is being misreported. The coefficient values for the first five variables and the railroad ownership variable presented in Table 3-1 conform with railroad economic principles. The model results suggest: (1) The more weight a shipper put in a carload, the higher the average RPCM, likely due to the fact railroad costs per carload increase with heavier carloads. (2) Average RPCM was lower for 24 Reference: Benoit, Kenneth. "Linear regression models with logarithmic transformations." London School of Economics, London (2011).
30 longer distance shipments, likely due to economies of distance. (3) Average RPCM was lower for shipments traveling between high density origin-termination pairs, likely due to Average fact that fewer inter-and intra-train switches are required for shipments on routes with high density. (4) Average RPCM was lower for larger shipments (i.e. shipments with more carloads), likely due to economies of scale. (5) Average RPCM was higher for shipments with more inter-railroad interchanges, likely due to the increased operational and accounting/financial burden of switching carloads from one carrier to another. (6) Lastly, average RPCM was lower for shippers using their own railcars than shippers using railroad-owned railcars. The results in Table 3-1 also indicate that the RPCM for grain shipments, across the country, was lower on average than the RPCM for non-grain shipments. Specifically, the results indicate that the RPCM for grain was definitely lower on average than the RPCMs for chemicals, coal, crude oil and natural gas, food products, non-grain agricultural products, coal and petroleum products, and pulp and paper. Once again grain shipments only includes bulk grain: corn, wheat, and soybeans. Additionally, Table 3-1 indicates that the RPCM for shipments originating in the Upper Midwest was lower than the average RPCM of shipments that did not originate in the Upper Midwest. However, the RPCMs for shipments originating in the Wyoming-Montana-Idaho and Texas-Oklahoma-New Mexico regions were lower than the RPCM of shipments originating in the Upper Midwest. The statements made in the previous paragraph regarding the lower RPCM of grain shipments and shipments originating in the Upper Midwest require the use of econometric methods. A naïve methodology, wherein, the analyst simply takes the average RPCM of grain shipments and compares it with the average RPCM of non-grain shipments, may or may not yield the same results as the econometric method. The naïve methodology does not account for external factors such as shipment distance, number of railroad interchanges, and carload number in its comparison of the RPCM across commodity-types or regions of origin. Not accounting for these factors can lead to erroneous results. For example, if the average grain shipment were shorter than the average non-grain shipment, and because the RPCM is lower for longer shipments (see Table 3-1), using the naïve methodology would erroneously suggest that average PRCM for grain is higher, in comparison with average RPCM for non-grain, than it truly are. Hence, it is necessary to account for these external factors when comparing RPCM across different commodities or shipment origination points. Multivariate regression methods explicitly separate the impacts of exogenous variables, such as, shipment distance and carload number from other explanatory variables such as commodity-type. A second multivariate regression model was run on the entire CWS. The second model includes a variable that designates the year the shipment occurred ( time!"#$ ) in order to provide insights into how average RPCM varied between 2001 and Unfortunately, due to the enormous size of the data set and the software s random-access memory (RAM) storage procedure, the route density variable and most of the origination and termination dummy variables are not included in the second regression model. Adding the time variable to the 30
31 regression model and removing the route density and origination and termination variables did not alter the coefficient estimates for the other parameters (displayed in Table 3-1 above) significantly. The coefficient estimates for the time!"#$ variable are displayed in Figure 3-1. A point on the graph indicates the relative increase or decrease in average RPCM between the given year (x-axis) and the base year of Figure 3-1 shows that average RPCM was relatively constant between 2001 and 2006, steadily increased between 2006 and 2012, and then leveled off between 2012 and It is important to note that the revenue component of RPCM was adjusted for inflation; therefore Figure 3-1 shows the trend for real, as opposed to nominal, RPCM. The Consumer Pricing Index (CPI) was used in this analysis to adjust for inflation. 0.3 Rail RPCM over Time Coefficient Figure 3-1: Coefficient values for the time variable in the regression model. The coefficient values are relative to the 2001 base level which was set to zero. 3.2 Segmentation by Year Table 3-1 illustrates how a number of variables impact RPCM including carload number, shipment distance, commodity-type, and shipment origin. However, the results in Table 3-1 do not show whether the impact of these variables remained constant or changed between 2001 and There are two methods to determine how the impact of specific variables on RPCM changed between 2001 and 2013, taking into account the overall trend of higher RPCM displayed in Figure 3-1. The first method involves interacting each of the variables in Equation 1 with the year variable in the pooled data set. Due to the limitations of the software s RAM storage procedures, mentioned in Section 3.1, this method was infeasible. A second and equally effective method involves segmenting the dataset by year, running the same model on data from each year independently, and determining how the variable coefficients changed over time. The results of the second method are presented in Figure 3-2 through Figure 3-7. Figure 3-2a and Figure 3-2b display the coefficient values for the origination and termination dummy variables in the multivariate regression model, respectively. The figures illustrate the trend in dummy variable coefficient values for a number of origination and
32 termination points. It is imperative to note that these figures do not illustrate the overall trend in RPCM in the specific regions displayed, rather, they display the trend in the difference between average RPCM for specific regions and the average RPCM for all other regions. For example, Figure 3-2a illustrates that the RPCM for shipments originating in the Wyoming-Montana-Idaho region decreased steadily between 2001 and 2013 relative to shipments not originating in Wyoming-Montana-Idaho. It is possible, and likely, given the results presented in Figure 3-1, that average RPCM increased in Wyoming-Montana-Idaho between 2001 and 2013, but we definitively know, from Figure 3-2a, that average RPCM in Wyoming-Montana-Idaho decreased relative to the average RPCM of shipments not originating in Wyoming-Montana-Idaho between 2001 and Regional Analysis (Origin) UMW_orig Istates_orig TxOkNm_orig NorthEast_orig WyMoId_orig 0.1 Coefficient Figure 3-2a: Coefficient values for the origination region dummy variables. A separate regression model was run for every year between 2001 and 2013 in order to track trends. The regression model coefficients displayed in Figure 3-2a show that the RPCM for shipments in the Upper Midwest was consistently lower than the RPCM for shipments not originating in the Upper Midwest (i.e. the light-blue UMW_orig line is always below zero). Figure 3-2a also shows that the RPCM for shipments originating in the Texas-Oklahoma-New Mexico region was consistently lower than the RPCM for shipments not originating in this region. Additionally, the RPCM for shipments originating in both the Northeast and the Wyoming-Montana-Idaho region steadily decreased between 2001 and 2013 relative to shipments not originating in these two regions. The analysis of three termination points, illustrated in Figure 3-2b, shows that the RPCM for shipments terminating in Texas was consistently higher than the RPCM for shipments not terminating in Texas; whereas, the RPCM for shipments terminating in the Pacific Northwest and Louisiana were lower than the average RPCM of other termination regions. However, the RPCM for the Pacific Northwest termination point increased slowly but steadily between 2001 and 2013 relative to shipments not terminating in the Pacific Northwest. 32
33 Regional Analysis (Termina;on) Texas_Term PNW_Term Louis_Term Coefficient Figure 3-2b: Coefficient values for the termination region dummy variables. Figure 3-3a and Figure 3-3b display the coefficient values for the commodity variable; each point in each of the figures represents the relative difference between the average RPCM of the specified commodity and the average RPCM of the all other commodity category described in Section 3.1. Both figures compare the RPCM of grain shipments with the RPCMs of a few other commodities. Figure 3-3a illustrates that the RPCM for grain shipments was consistently lower than the RPCM for all other commodities as well as the fossil fuel commodities. Figure 3-3a shows that the RPCM for crude oil and natural gas was highly variable. In 2006, 2007, and 2008 the RPCM for crude oil and natural gas shipments was significantly higher than other commodities; then in 2010 and 2011 the RPCM for crude oil and natural gas was lower than other commodities; then in 2012 and 2013 the RPCM for crude oil and natural gas was once again significantly higher than other commodities. The RPCM for coal shipments was similarly volatile between 2001 and The RPCM for coal and petroleum products steadily increased between 2001 and 2013 relative to other commodities. The RPCM for grain shipment was consistently lower than other commodities, although in 2006 and 2011 the difference was not as large as other years. Figure 3-3b illustrates that the RPCM for bulk grain (corn, wheat, and soybeans) was also lower than the RPCMs for other, more similar, commodites including non-grain agricutural products, food products, as well as chemical and pulp-paper commoditites. Besides the average RPCM of pulp-paper shipments that steadily decreased relative to the other four commodities in Figure 3-3b between 2006 and 2013, the commodities in Figure 3-3b are nearly constant in their relative position compared with grain. That is, the RPCM of grain was always lower than the RPCM of non-grain agricultural, which, in turn, was always lower than the RPCM for food products, which was always lower than the RPCM for chemicals. 33
34 Coefficient Commodity Analysis 1 Grain Coal_Oil_Product Coal Crude_Oil_NG Figure 3-3a: Coefficient values the for commodity variables (values are relative to other commodity which includes all the commodities not explicitly enumerated in the commodity analysis). Comparison of the average RPCM of grain with the average RPCM of fossil fuel. 0.4 Commodity Analysis 2 Grain Chemical Pulp- Paper Farm_(Non- Grain) Food Coefficient Figure 3-3b: More commodity variable coefficient values. Comparison of the average RPCM of grain with the average RPCM of related commodities. The next four figures display the coefficient values for the the shipment characteristics included in the model in Equation 1. The figures display how the RPCMs of different shipmenttypes varied between 2001 and Figure 3-4 shows that the more carloads that are shipped together on a single waybill the lower the average RPCM of the shipment. This result is not entirely surprisingly but it is quite important for shippers to understand. After factoring in a number of other variables including shipment distance, and route density; the RPCM charged by railroads is systematically lower for larger shipments. Shippers should consider consolidating their products into larger shipments in order to receive lower per carload-mile rail transport costs. However, Figure 3-4 does show that the RPCM gap between all the non one-carload
35 segments, and the one-carload segment, decreased between 2011 and 2013 and significantly between 2001 and Carload Number Carloads 2-5 Carloads 6-49 Carloads Carloads Over Coefficient Figure 3-4: Coefficient values for carload number segments (values relative to one-carload shipments). Figure 3-5 shows that RPCM is lower for longer distance shipments. The RPCM of shipments that traveled miles was significantly lower than the RPCM of shipments that traveled less than 250 miles and shipments. Figure 3-5 shows that the decrease in RPCM for increasingly longer distance shipments continues all the way up to miles. The coefficient values for these distance parameters are not only highly statistically significant, their magnitude in the real-world sense is also very high. The coefficient value for mile shipments, relative to mile shipments is approximately This indicates that the RPCM for mile shipments is 75% lower than the RPCM for mile shipments. Coefficient Distance miles miles miles miles Figure 3-5: Coefficient values for shipment distance segments (values relative to mile distance). 35
36 Figure 3-6 shows that the RPCM is lower for high density routes. The RPCM of very high density routes is significantly lower than the RPCM of lower density routes. The large discrepancy in RPCM across route density levels is likely due to the fact that carloads on these routes probably do not have to enter more than one classification yard. For example, a container shipment moving between Los Angeles and Chicago is going to pay a lower RPCM than a container shipment moving between Boston and Salt Lake City because, on any given day, there are huge volumes of carloads moving between Los Angeles and Chicago. Hence, a 100 or 120+ carload train can be formed in Los Angeles, and that train can go directly to Chicago without having to be disassembled and reassembled at classification yards. Whereas, there are significantly fewer containers moving from Boston to Salt Lake City; hence, a carload moving between these two cities will likely need to enter multiple classification yards, reducing efficiency and adding operation costs. 0.1 Route Density - All Data 100-1K railcars 1K- 10K railcars 10K- 100K railcars 100K+ railcars Coefficient Figure 3-6: Coefficient values for shipment route density segments (values relative to carloads). Lastly, Figure 3-7 shows that, as expected, railroads charge higher a RPCM for railcars they own than privately-owned railcars. Figure 3-7 also shows that the RPCM of shipments bound for export was consistently lower than the RPCM of domestic shipments. The lower RPCM for export shipments is separate from the carload number, shipment distance, and route density effects described earlier in this section. It is interesting that the RPCM for export shipments is consistently lower than the RPCM for domestic shipments even after accounting for these other shipment characteristics. 36
37 Coefficient Export and Railroad Owned Railroad_own Export Figure 3-7: Coefficient values for the railroad ownership and export-bound dummy variables. 3.3 Segmentation by Commodity- type In this section we examine grain and coal shipments exclusively. The results presented in this section mirror the results presented in Section 3.2 except rather than including all commodities, Section 3.3 only includes grain and coal shipments. Figure 3-8 illustrates that the RPCMs for grain and coal commodities increased between 2002 and It is important to note the fact that the coal line is higher than the grain line indicates that the RPCM for coal was higher in year X relative to the RPCM for coal in year 2001 than the RPCM for grain in year X relative to the RPCM for grain in Hence, Figure 3-8 shows that the RPCM for coal increased at a greater rate than the RPCM for grain between 2001 and The RPCM increases for grain and coal displayed in Figure 3-8 are very similar to the RPCM increases displayed in Figure 3-1 for all shipments. The RPCM for grain transport, like the RPCM for all commodities together, were relatively stable between 2001 and Additionally, the RPCMs for both grain and coal level-off between 2011 and 2013, similar to the results for all commodities displayed in Figure
38 Coefficient Grain and Coal RPCM over the Years Figure 3-8: Coefficient values for the year variable (relative to the year 2001) for exclusively grain waybills and, separately, exclusively coal waybills. The next four figures display the coefficient values for the origination and termination variables in the coal and grain segment models. Figure 3-9a and Figure 3-9b illustrate the effect of a shipment s origination location on the RPCMs of grain and coal, respectively. Figure 3-9c and Figure 3-9d illustrate the effect of a shipment s termination location on the RPCMs of grain and coal, respectively. Figure 3-9a shows that the RPCM for grain originating in the Upper Midwest was lower than the RPCM for grain not originating in the Upper Midwest, and specifically grain originating in the I-states. Figure 3-9a shows that Upper Midwest shippers never paid a premium for grain transport compared with non-upper Midwest shippers between 2001 and Figure 3-9b shows that the RPCM of coal shipments originating in the Wyoming-Montana-Idaho region was consistently lower than the RPCM of coal shipment not originating in the Wyoming-Montana-Idaho region. This result is not surprising given that the Powder River Basin is located in Wyoming and 40% of U.S. coal comes from the Powder River Basin. Figure 3-9b also shows that relative to other regions, the RPCM for coal transport in the I- states and the Northeast region of the country steadily declined between 2001 and Grain Coal 38
39 Regional Analysis (Origin) - Grain 0.1 UMW_orig Istates_orig Coefficient Figure 3-9a: Coefficient values for the origination region dummy variables grain waybills only. Regional Analysis (Origin) - Coal 0.4 UMW_orig Istates_orig NorthEast_orig WyMoId_orig Coefficient Figure 3-9b: Coefficient values for the origination region dummy variables coal waybills only. The results presented in Figure 3-9c, relating to the termination point of grain, are especially interesting. Figure 3-9c shows that in the early 2000s the RPCM of grain shipments terminating in Louisiana was lower than the RPCM for grain shipments not terminating in Louisiana; in contrast, in the early 2000s the RPCM for grain shipments terminating in Texas was significantly higher than the RPCM for grain shipments not terminating in Texas. However, between 2001 and 2010 the RPCM for Louisiana termination points began to increase steadily, whereas the RPCM for Texas termination points began to decrease steadily, and by 2010 and through 2013 the RPCM for grain shipments terminating in Louisiana and Texas were very similar. During this period between 2001 and 2013, the RPCM for grain terminating in the Pacific Northwest fluctuated considerably; however between 2010 and 2013 the RPCM for grain 39
40 terminating in the Pacific Northwest was comparable to the RPCM for grain terminating in Texas and Louisiana. Coefficient Regional Analysis (Term.) - Grain Texas_Term PNW_Term Louis_Term Figure 3-9c: Coefficient values for the termination region dummy variables grain waybills only. Figure 3-9d illustrates that the RPCM of coal terminating in Texas went from being significantly lower than the RPCM of coal not terminating in Texas in the early 2000s, to being significantly higher in the early 2010s. Comparing the Texas termination coefficient values in Figure 3-9c and Figure 3-9d, we see that in the early 2000s the coefficient for grain was positive and the coefficient for coal was negative; however, by the end of the 2000s and between 2011 and 2013, the Texas termination coefficient for grain is negative and the coal coefficient in positive Regional Analysis (Term.) - Coal Texas_Term Coefficient Figure 3-9d: Coefficient values for the termination region dummy variables coal waybills only. 40
41 Figure 3-10a and Figure 3-10b display the coefficient values for the carload number variable for the grain and coal models, respectively. Figure 3-10a shows the same general results as Figure 3-4, which displays the carload number coefficient values for all commodities together. Interestingly, the coefficient for larger grain shipment sizes decreased steadily (indicating a lower RPCM relative to one-carload shipments) between 2006 and 2011 before quickly receeding back to pre-2006 levels in 2012 and Additionally, in Figure 3-10a, between 2009 and 2012 the RPCMs of 6-49 carloads and carloads were comparable to the RPCM of shipments with greater than 90 carloads. These results for grain shipments in Figure 3-10a contradict Figure 3-4, which showed that adding more carloads to a shipment, up to and including 90+ carloads, resulted in a lower RPCM Carload Number - Grain Carloads 2-5 Carloads 6-49 Carloads Carloads Over Coefficient Figure 3-10a: Coefficient values for carload number segments (values relative to one-carload shipments) grain waybills only. Figure 3-10b heavily contradicts the principles of economies of scale and Figure 3-4 and Figure 3-10a. Figure 3-10b shows that the RPCM for coal shipments with 6-49 carloads was higher than the RPCM for one-carload shipments at least three years between 2001 and However, the RPCMs for 90+ railcar shipments and railcar shipments were lower than RPCM for one-carload shipments. One possible reason for the contradictory results presented in Figure 3-10b is that railroads misreported the number of carloads traveling in a shipment. In fact, it was brought to the NUTC research team s attention that some railroads create separate waybills for every single carload, even if those carloads traveled together on a unit or shuttle train from origin to termination point. Misreporting data can cause serious modeling issues. 41
42 Carload Number - Coal Carloads 2-5 Carloads 6-49 Carloads Carloads Over 90 Coefficient Figure 3-10b: Coefficient values for carload number segments (values relative to one-carload shipments) coal waybills only. The distance variable coefficient values for grain and coal shipments were consistent with the distance coefficient values for all commodity-types displayed in Figure 3-5. Hence, the graphs for coal and grain shipments are not displayed in this section; the charts are available in Exhibit G: Shipment Distance Coefficient Value Results of the Appendix. Similarly, the coefficient values for the railroad ownership dummy variable for the grain and coal models were also consistently significant and positive between 2001 and 2013 mirroring the results in Figure 3-7 for all commodity-types; hence, the results for grain and coal are in Exhibit H: Railcar Ownership and Export/Domestic Coefficient Value Results of the Appendix. Interestingly, the route density results for coal and grain shipments for most years were not significantly different from zero. The reason why route density had a significant effect on all commodities but had no significant effect for grain and coal is unknown. Figure 3-11 displays the coefficient values for the export dummy variable for coal and grain shipments between 2001 and In the analysis of all commodity-types (see Figure 3-7), the RPCM of export shipments was consistently lower than the RPCM for domestic shipments between 2001 and In contrast, the RPCMs for coal and grain shipments bound for export were significantly higher than the RPCMs for domestic shipments in 2012 and The RPCM for export grain shipments went from being significantly lower than the RPCM for domestic grain shipments in 2001 to being significantly higher in The coefficient value for the dummy export variable steadily increased for grain shipments between 2001 and This result is important for grain shippers searching for potential markets to sell their grain; it appears that after at least a decade of lower RPCM for export shipments, grain shippers might now have to pay a higher cost per carload-mile for export shipments. 42
43 0.4 Export vs. Domes;c Shipments Grain Coal 0.2 Coefficient Figure 3-11: Coefficient values for the export dummy variable for exclusively grain waybills and, separately, exclusively coal waybills. 3.4 Segmentation by Origination Region This section examines RPCM for shipments originating in the Upper Midwest and the I- states. The focus of the analysis is on shipments originating in the Upper Midwest but the I-states provide a useful region for comparison. Figure 3-12 illustrates that similar to the analysis of all shipments and grain and coal commodities, RPCM increased between 2001 and 2013 for shipments originating in the Upper Midwest and the I-states. However, the increase in average RPCM for the Upper Midwest mainly occurred between 2008 and 2013; whereas, average RPCM increased mainly between 2006 and 2012 for all shipments (see Section 3.1) as well as grain and coal shipments (see Section 3.3). Coefficient Upper Midwest and Istates RPCM over Time UMW I- states Figure 3-12: Coefficient values for the year variable (relative to the year 2001) for exclusively waybills originating in the Upper Midwest and, separately, exclusively waybills originating in the I-states. 43
44 Figure 3-13a and Figure 3-13b display the coefficient values for the termination region variables in the regression model for shipments originating in the Upper Midwest and the I- states, respectively. Figure 3-13a displays high variability in the coefficient values for each of the termination points. One useful result is that after 2003 the coefficient values for shipments originating in the Upper Midwest and terminating in either the Pacific Northwest or Louisiana were never greater than zero. In most years, aside from 2004 and 2012, the Texas termination coefficient was significantly greater than zero. The coefficient values for the I-state dataset, presented in Figure 3-13b, are considerably more stable between 2001 and 2013 than those in Figure 3-13a. The coefficient values for shipments originating in the I-states and terminating in Texas were positive and statistically significant every year between 2001 and In every year between 2001 and 2012 shipments originating in the I-states and terminating in Louisiana or the Pacific Northwest received a small but statistically significantly lower RPCM. However, in 2013 the RPCM for shipments terminating in the Pacific Northwest was greater than the RPCM for shipments not terminating in the Pacific Northwest. Despite the variability in Figure 3-13a, the results are quite similar to those in Figure 3-13b. The similarity in results is not surprising given that the Upper Midwest and the I-states are geographically close Regional Analysis (Term.) - Upper Midwest Texas_Term PNW_Term Louis_Term 0.1 Coefficient Figure 3-13a: Coefficient values for the termination region dummy variables Upper Midwest waybills only. 44
45 1.5 Regional Analysis (Term.) - Istates Texas_Term PNW_Term Louis_Term 1.0 Coefficient Figure 3-13b: Coefficient values for the termination region dummy variables I-state waybills only. Figure 3-14a through Figure 3-14d display the coefficient values for the commodity variables for shipments originating in both the Upper Midwest and the I-states. Figure 3-14a illustrates that the coefficient for grain in the Upper Midwest segment of the data was negative in 2004 through 2006, 2009, 2012 and 2013; positive in 2001 and 2011; and not significant in 2002, 2003, 2007, 2008 and An interesting result is that prior to 2008 no data for crude oil and natural gas in the Upper Midwest exists and after 2007 no data for coal shipments exists in the Upper Midwest. The RPCMs for coal and petroleum shipments originating in the Upper Midwest were significantly greater than the RPCM of all other commodities between 2001 and In the I-states, the grain and coal coefficients were negative and statistically significant every year between 2001 and 2013; conversely the coefficient for coal and petroleum products was most often positive between 2001 and
46 Coefficient Commodity Analysis 1 - Upper Midwest Grain Coal_Oil_Product Coal Crude_Oil_NG Figure 3-14a: Coefficient values for commodity variables (values are relative to other commodity which includes all the commodities not explicitly enumerated in the commodity analysis) Upper Midwest waybills only. Comparison of grain RPCM with fossil fuel RPCM. 1.0 Commodity Analysis 1- Istates Grain Coal_Oil_Product Coal 0.5 Coefficient Figure 3-14b: Coefficient values for commodity variables I-state waybills only. Comparison of grain RPCM with fossil fuel RPCM. Figure 3-14c and Figure 3-14d illustrate the same results for grain commodities as Figure 3-14a and Figure 3-14b but rather than displaying the results next to fossil fuel commodities, the results are displayed next to non-grain agricultural products, food products, chemicals, and pulppaper. Figure 3-14c shows that the RPCMs for non-grain agricultural and food product shipments were higher than the RPCM for all shipments between 2001 and 2004; however, after 2004, the RPCMs for non-grain agricultural and food products continued to decrease until by 2010 the RPCMs for non-grain agricultural and food product shipments were significantly lower than the RPCM for all other commodity-types. Every one of the commodity RPCMs in Figure 3-14c decreased between 2001 and 2013 relative to all other commodities. Figure 3-14d shows
47 considerably less variability; the RPCM for chemicals was consistently higher than food and non-grain agricultural products, which are both consistently higher than the RPCM for grain shipments. 0.6 Commodity Analysis 2 - Upper Midwest Grain Chemical Pulp- Paper Farm_(Non- Grain) Food Coefficient Figure 3-14c: Coefficient values for commodity variables Upper Midwest waybills only. Comparison of grain RPCM with similar commodities Commodity Analysis 2 - Istates Grain Chemical Farm_(Non- Grain) Food 0.2 Coefficient Figure 3-14d: Coefficient values for commodity variables I-state waybills only. Comparison of grain RPCM with similar commodities. Figure 3-15a and Figure 3-15b display the coefficient values for the carload number variable for shipments originating in the Upper Midwest and the I-states respectively. In both graphs, the RPCM for 90+ carload shipments was significantly lower than one-carload shipments; however, in 2007 and 2009, the RPCM for 90+ carload shipments in the Upper Midwest was noticeably closer to the RPCM of one-carload shipments than all other years between 2001 and Additionally, both graphs show that the RPCMs for 2-5 and
48 carload shipments were significantly lower than the RPCM for one-carload shipments between 2001 and 2003; however, between 2004 and 2013 the RPCM of one-carload shipments is not significantly different from the RPCMs of 2-5 carload and 6-49 carload shipments Carload Number - Upper Midwest Carloads 2-5 Carloads 6-49 Carloads Carloads Over 90 Coefficient Figure 3-15a: Coefficient values for carload number segments (values relative to one-carload shipments) Upper Midwest waybills only. 0.2 Carload Number - Istates Carloads 2-5 Carloads 6-49 Carloads Carloads Over 90 Coefficient Figure 3-15b: Coefficient values for carload number segments (values relative one-carload shipments) I- state waybills only. Once again, the graphs displaying the coefficient values for the distance variable for shipments originating in the Upper Midwest and the I-states are in Exhibit G: Shipment Distance Coefficient Value Results of the Appendix because the results are very similar to the coefficient values for all shipments (see Figure 3-5). In addition, the graphs of the coefficient values for the export variable and the railroad ownership variable are in Exhibit H: Railcar Ownership and Export/Domestic Coefficient Value Results of the Appendix because the results were similar to 48
49 the results for all shipments (see Figure 3-7); i.e. the coefficients for export were negative and the coefficients for railroad-owned were positive in both the Upper Midwest and the I-states consistently between 2001 and Figure 3-16 illustrates the coefficient values for the route density variable for shipments originating in the Upper Midwest. None of the route density levels were statistically different from the low route density level for shipments originating in the I-states. Figure 3-16 shows that the RPCM for Upper Midwest shipments traveling on very high density routes as significantly higher than low density routes between 2001 and Conversely the figure shows that the RPCM for the high density route category was significantly lower than the RPCMs for the low route density route categories between 2004 and Route Density - Upper Midwest 100-1K railcars 1K- 10K railcars 10K- 100K railcars 100K+ railcars Coefficient Figure 3-16: Coefficient values for shipment route density segments (values relative to carload) Upper Midwest waybills only. 3.5 Analysis of Grain RPCM in the Upper Midwest In this final multivariate regression modeling section, we exclusively examine grain shipments originating in the Upper Midwest. Interestingly, Figure 3-17 shows that not until 2007 did the grain RPCM in the Upper Midwest exceed the grain RPCM in Comparing Figure 3-17 with Figure 3-1, Figure 3-8, and Figure 3-12 (graphs depicting increasing RPCM for different regional and commodity segments), although it will be little consolation to grain shippers in the Upper Midwest, the increase in RPCM they experienced between 2006 and 2013 was not unique, almost all regions of the country and shippers of all commodity-types experienced RPCM increases during this time period. 49
50 Upper Midwest Grain RPCM over Time Coefficient Figure 3-17: Coefficient values for the year variable (relative to the year 2001) for exclusively grain waybills originating in the Upper Midwest. Figure 3-18 presents the coefficient values for the termination point variables in the Upper Midwest grain regression model. The figure shows that between 2001 and 2012 the RPCM of shipments terminating in the Pacific Northwest decreased steadily. However, in 2013 the RPCM for shipments terminating in the Pacific Northwest was not statistically significant. Figure 3-18 also shows that the RPCMs for shipments terminating in either Texas or Louisiana were either the same or higher than the RPCM for all termination points between 2001 and Regional Analysis (Term.) - Upper Midwest Grain Texas_Term PNW_Term Louis_Term Coefficient Figure 3-18: Coefficient values for the termination region dummy variables Upper Midwest grain waybills only. Figure 3-19 displays the carload number coefficient values for grain shipments originating in the Upper Midwest. Between 2006 and 2008, none of the coefficients were significantly different from one-carload shipments. In the other years, the coefficient values for 50
51 the different carload segments do not form a clear trend. The results in Figure 3-19 strongly contradict previous results relating to carload number s relationship with RPCM as well as economies of scale in transportation Carload Number- Upper Midwest Grain Carloads 2-5 Carloads 6-49 Carloads Carloads Over 90 Coefficient Figure 3-19: Coefficient values for carload number segments (values relative to one-carload shipments) Upper Midwest grain waybills only. Figure 3-20 shows the coefficient values for the shipment distance variable. The results in Figure 3-20 are significantly different from those in the model with all shipments (Figure 3-5) and the other segments. The coefficient values for the distance segments varied considerably between 2001 and Additionally, it does not appear that the RPCM of the longest shipments (2000+ miles) was significantly lower than the RPCM of shipments that traveled miles or miles. This result is surprising given the operational advantages of shipping products over 2000 miles compared with only miles. It is possible that with more data the results in Figure 3-20 would be more consistent with the other distance coefficient results obtained in the model with all shipments. 51
52 Coefficient miles miles miles miles Distance - Upper Midwest Grain Figure 3-20: Coefficient values for shipment distance segments (values relative to mile shipments) Upper Midwest grain waybills only. Figure 3-21 displays the coefficient values for the railroad ownership and export dummy variables. The results indicate that once again the RPCM for privately-owned railcars was lower than the RPCM for shipments transported with railroad-owned railcars. Figure 3-21 also shows that the RPCM for grain shipments originating in the Upper Midwest bound for export was either lower than the RPCM for domestic shipments or the RPCMs for the two segments were not statistically different. This result is especially interesting given the fact that we account for not only the distance and carload number, but we also have dummy variables for three of the most common grain export destinations: Texas, Louisiana and especially the Pacific Northwest. 0.6 Export and RR- Owned - Upper Midwest Grain Railroad_own Export 0.4 Coefficient Figure 3-21: Coefficient values for the railroad ownership and export-bound dummy variables Upper Midwest grain waybills only. 52
53 4 Conclusions and Future Research This report set out to examine trends in rail transport rates and the shipment characteristics that impact rail transport rates in a robust statistical sense. We used the STB s CWS, which is a 1% stratified sample of all rail waybills originated by major carriers in the United States, to conduct the rate analysis. We conducted an in-depth exploratory analysis of the waybill data to determine correlations between different variables and analyze general trends in rail transport rates and other important variables, in order to inform our econometric models. A series of multivariate regression models were developed to answer the following questions: Has average RPCM increased or decreased over the past 13 years? How has this increase or decrease varied by commodity-type (i.e. grain versus coal, versus all other commodities) and origination region? What shipment characteristics and other exogenous factors are associated with higher or lower RPCM? Do the shipment characteristics and other exogenous factors associated with higher or lower RPCM vary across time, commodity-type, and/or origination region? The results presented in the exploratory analysis section, suggest that RPTM is negatively correlated with distance, shipment weight, carload number, route density, car capacity, export shipments, and the number of interchanges. Additionally, higher route density was correlated with longer distance shipments and fewer railroad interchanges. Coal shipments were strongly correlated with carload number and shipment weight indicating that most coal is shipped in unit or shuttle trains. An analysis of average RPTM for grain and coal found that RPTM was lowest for coal but RPTM was also quite low for grain compared to all shipments. Interestingly, average RPTM was lower for all export shipments than all shipments. Lastly, the average RPTM for export coal shipments was significantly higher than the RPTM for export grain shipments. The econometric model results indicate that average RPCM increased significantly in real terms between 2001 and 2013 with most of the increase occurring between 2006 and Further analysis showed that although average RPCM increased in the Upper Midwest and for grain shipments; the increase was consistent with a general increase in average RPCM for all shipments during the period from 2001 to In fact, the regression model results show that the RPCM for grain shippers was lower than the RPCM for many other commodity-types. The econometric regression models determined the aforementioned results while simultaneously taking into account and measuring the impact of shipment characteristics. Many of the shipment characteristics associated with lower RPCM in the econometric regression modeling analysis (long distance shipments, shipments on high-density routes, large shipments, and railroad-owned railcars) conform to previous findings in the literature. In addition, the econometric analysis determined that the RPCM for export shipments was consistently lower than the RPCM for nonexport shipments between 2001 and 2013 for all commodity-types. However, in 2012 and 2013 the RPCM for export grain shipments was higher than the RPCM for non-export grain shipments. Another interesting result obtained in the analysis is that, in the Upper Midwest, 53
54 between 2001 and 2003 the RPCM for shipments traveling on very high density routes was higher than the RPCM of shipments in lower route density categories; conversely, between 2004 and 2013, the RPCM for the very high route density category was significantly less than the RPCMs of the other route density categories. The methodology presented in the report provides an excellent means of determining trends in not only overall rail transport rates but also the shipment characteristics and exogenous factors that impact rates in different segments of the data. The NUTC research group identified two potential areas for future research. The first, and most obvious path, requires the STB s confidential waybill sample. The confidential waybill data includes a number of fields that would improve the regression model developed in Section 2, including, fuel surcharge, railroad variable cost, and better and finer geographical information. The second opportunity to improve the regression model involves combining outside data sources with the CWS. For example other researchers examined how potential freight transport competition influences rail transport rates 25,26,27. They combined the CWS with information related to the nearest navigable inland waterway from the shipment s origin and termination points and the number of competing railroads that could potentially serve the demand. Other data sources that could be integrated with the CWS include fuel prices, and aggregate rail indices. 25 Reference: Laurits, R. "An update to the study of competition in the U.S. freight railroad industry: Final report. Christensen Associates, Inc. A report prepared for The Surface Transportation Board (STB)." (2010). 26 Reference: Mac Donald, James M. "Railroad deregulation, innovation, and competition: Effects of the Staggers Act on grain transportation." Journal of Law and Economics (1989): Reference: MacDonald, James M. "Competition and rail rates for the shipment of corn, soybeans, and wheat." The RAND Journal of Economics (1987):
55 Appendix Exhibit A: CWS Variables (as given by the STB) FIELD DATA DESCRIPTION FIELD DATA DESCRIPTION 1 Waybill Date (mm/dd/yy) 33 Origin Freight Rate Territory 2 Accounting Period (mm/yy) 34 Interchange State #1 3 Number of Carloads 35 Interchange State #2 4 Car Ownership Code 36 Interchange State #3 5 AAR Car Type 37 Interchange State #4 6 AAR Mechanical Designation 38 Interchange State #5 7 ICC Car Type 39 Interchange State #6 8 TOFC/COFC Plan Code 40 Interchange State #7 9 Number of TOFC/COFC Units 41 Interchange State #8 10 TOFC/COFC Unit Ownership Code 42 Interchange State #9 11 TOFC/COFC Unit Type Code 43 Termination BEA Area 12 Hazardous/Bulk Material in Boxcar 44 Termination Freight Rate Territory 13 Commodity Code (STCC) 45 Waybill Reporting Period Length 14 Billed Weight in Tons 46 Car Capacity 15 Actual Weight in Tons 47 Nominal Car Capacity 16 Freight Revenue ($) 48 Tare Weight of Car 17 Transit Charges ($) 49 Outside Length 18 Miscellaneous Charges ($) 50 Outside Width 19 Inter/Intra State Code 51 Outside Height 20 Type of Move 52 Extreme Outside Height 21 All Rail/Intermodal Code 53 Type of Wheel Bearings and Brakes 22 Type of Move via Water 54 Number of Axles 23 Transit Code 55 Draft Gear 24 Substituted Truck for Rail Service 56 Number of Articulated Units 25 Rebill Code 57 AAR Error Codes 26 Estimated Short Line Miles 57-A Blank 27 Stratum Identification 58 Routing Error Flag 28 Subsample Code 59 Expanded Carloads 29 Exact Expansion Factor 60 Expanded Tons 30 Theoretical Expansion Factor 61 Expanded Freight Revenue 31 Number of Interchanges 62 Expanded Trailer/Container Count 32 Origin BEA Area 55
56 Exhibit B: Shipment Origins Removed from the Data Origin BEA Code Area 173 Newfoundland 174 Nova Scotia 175 Prince Edward Island 176 New Brunswick 177 Quebec 178 Ontario 179 Manitoba 180 Saskatchewan 181 Alberta 182 British Columbia 183 Yukon/Northwest Territories 184 Puerto Rico 185 Mexico 56

57 Exhibit C: Spatial Distribution of BEA Origins in the CWS data (as given by the STB) 57
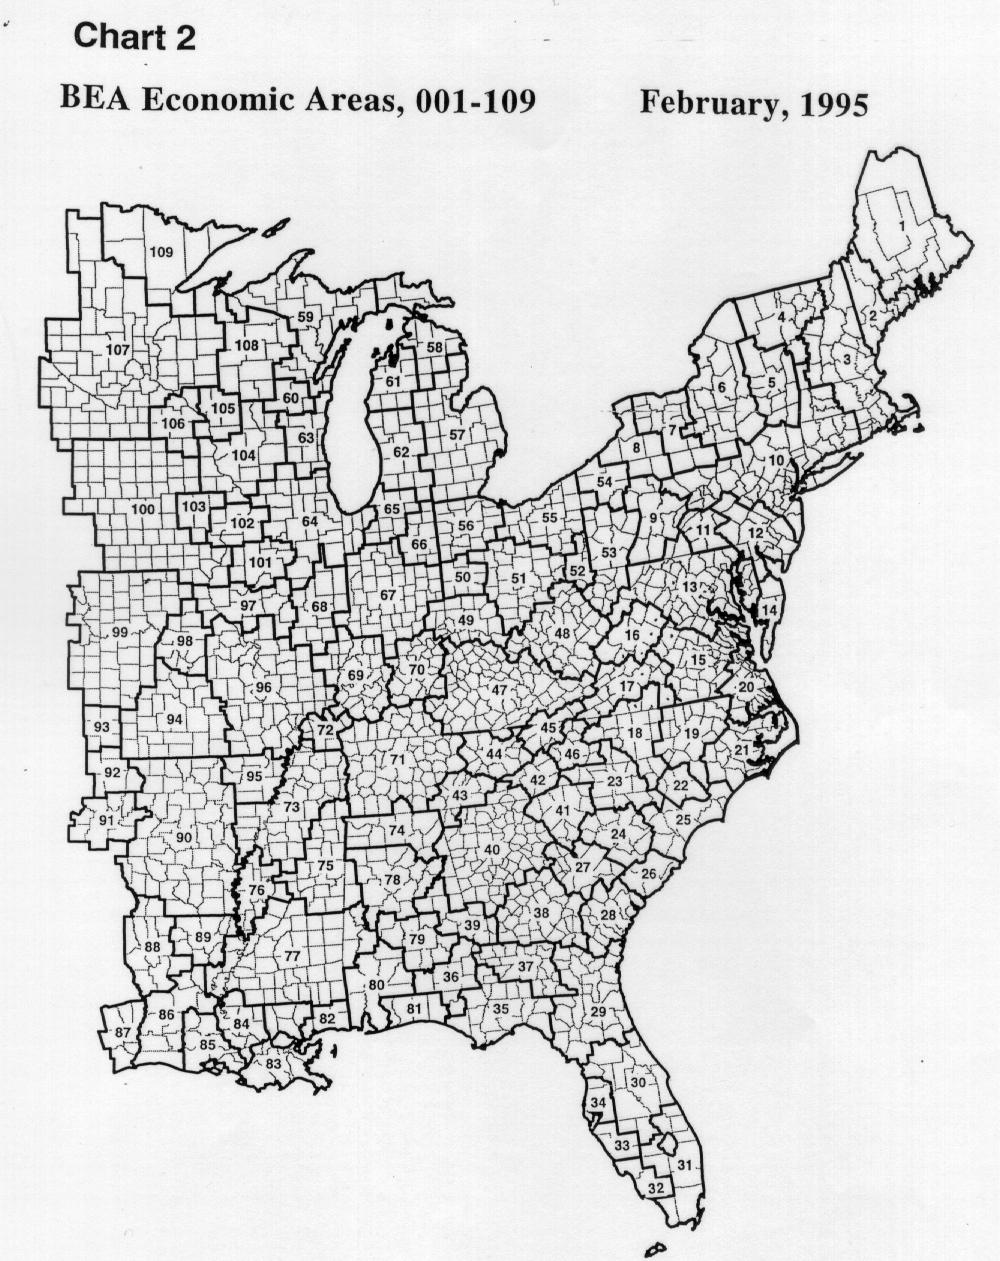
58 58
Railroads and Grain. Association of American Railroads June Summary
 s and Grain Association of American s June 2017 Summary s are critical to grain transportation. In 2016, U.S. Class I railroads originated 1.54 million carloads of grain (5.6 percent of total carloads)
Railroads and Grain. Association of American Railroads May Summary
 s and Grain Association of American s May 2018 Summary s are critical to grain transportation. In 2017, U.S. Class I railroads originated 1.46 million carloads of grain (5.1 percent of total carloads)
Joel Palley Office of Policy Office of Rail Policy and Development Federal Railroad Administration April 2013 FREIGHT RAILROADS BACKGROUND
 Joel Palley Office of Policy Office of Rail Policy and Development Federal Railroad Administration April 2013 FREIGHT RAILROADS BACKGROUND Flexibilities from the Staggers Rail Act of 1980 have led to reduced
FREIGHT POLICY TRANSPORTATION INSTITUTE. Rail to Rail Competition and its Importance to Agriculture
 FREIGHT POLICY TRANSPORTATION INSTITUTE Rail to Rail Competition and its Importance to Agriculture Rail to Rail Competition and its Importance to Agriculture FPTI Research Report Number 8 By Ken Casavant
FREIGHT P T OLICY RANSPORTATION INSITUTE. Rail to Rail Competition and its Importance to Agriculture
 FREIGHT P T OLICY RANSPORTATION INSITUTE Rail to Rail Competition and its Importance to Agriculture Rail to Rail Competition and its Importance to Agriculture FPTI Research Report Number 8 By Ken Casavant
SOYBEANS: HIGHEST PRICES IN OVER SEVEN YEARS. January 2004 Darrel Good 2004 NO. 2
 SOYBEANS: HIGHEST PRICES IN OVER SEVEN YEARS January 2004 Darrel Good 2004 NO. 2 Summary At 2.418 billion bushels, the 2003 U.S. soybean crop was 34 million bushels smaller than the USDA s November forecast
THE IMPORTANCE OF BARGE TRANSPORTATION FOR AMERICA'S AGRICULTURE. Jerry Fruin
 MN DEPT OF TRANSPORTATION 3 0314 00024 5042 Staff Paper Series Staff Paper P95-4 February 1995 THE IMPORTANCE OF BARGE TRANSPORTATION FOR AMERICA'S AGRICULTURE by Jerry Fruin CTS HE 595.F3 F78 1995 i Department
RAIL COMMODITY FLOWS
 RAIL COMMODITY FLOWS. The major commodities handled by rail are bulk, with the exception of the automotive traffic. The following pages provide detailed information rail commodities in California, and
Rail Competition Changes Since the Staggers Act
 Rail Competition Changes Since the Staggers Act by Marvin E. Prater, Ken Casavant, Eric Jessup, Bruce Blanton, Pierre Bahizi, Daniel Nibarger, and Isaac Weingram Agricultural and other shippers are concerned
USDA s Perspective on Agricultural Transportation Priorities
 Bruce Blanton Director, Transportation Services Division USDA s Perspective on Agricultural Transportation Priorities Ag Transportation Summit August 4, 2015 Rosemont, IL Why Are We At This Summit? Transportation
Appendix B. Commodity Flow Profile
 Appendix B 1.0 Introduction The overall goal of the Kansas Department of Transportation (KDOT) Statewide Freight Plan is to develop a set of infrastructure, operational, and institutional recommendations
Central Minnesota. Regional Freight Profile
 Central Minnesota Regional Freight Profile Working DRAFT May 21 Minnesota Department of Transportation The purpose of the Central Regional Freight Profile is to document freight movement trends in the
Market Concentration in the Wheat Merchandizing Industry. Anton Bekkerman and Mykel Taylor
 Market Concentration in the Wheat Merchandizing Industry by Anton Bekkerman and Mykel Taylor Suggested citation format: Bekkerman, A., and M. Taylor. Market Concentration in the Wheat Merchandizing Industry.
FREIGHT POLICY TRANSPORTATION INSTITUTE. The Critical Status of Agricultural Transportation in the Pacific Northwest
 FREIGHT POLICY TRANSPORTATION INSTITUTE The Critical Status of Agricultural Transportation in the Pacific Northwest The Critical Status of Agricultural Transportation in the Pacific Northwest FPTI Research
Industrial Energy Efficiency as a Resource by Region
 Industrial Energy Efficiency as a Resource by Region Garrett Shields and Robert D. Naranjo, BCS Incorporated Sandy Glatt, U.S. Department of Energy ABSTRACT The energy intensity of specific manufacturing
CORN: MARKET TO REFLECT U.S. AND CHINESE CROP PROSPECTS
 CORN: MARKET TO REFLECT U.S. AND CHINESE CROP PROSPECTS JULY 2001 Darrel Good 2001 - No. 6 Summary The USDA s June Acreage and Grain Stocks reports provided some modest fundamental support for the corn
The Indiana Rail Road Company
 FT INRD 4001 The Indiana Rail Road Company FREIGHT TARIFF INRD 4001 C (Cancels & Replaces FT INRD 4000 B and all Supplements) NAMING LOCAL & PROPORTIONAL RATES ON CARLOADS OF GRAIN & GRAIN PRODUCTS BETWEEN
Weekly Farm Economics: Geographical Acreage Changes between 2006 and 2012 in Corn, Soybeans, Wheat, and Cotton
 Weekly Farm Economics: Geographical Acreage Changes between 2006 and 2012 in Corn, Soybeans, Wheat, and Cotton Gary Schnitkey Department of Agricultural and Consumer Economics University of Illinois (3):58
DIFFERENTIAL EFFECTS RAIL DEREGULATION IN THE U.S. GRAIN INDUSTRY
 DIFFERENTIAL EFFECTS RAIL DEREGULATION IN THE U.S. GRAIN INDUSTRY Authors Kimberly Vachal, Advanced Research Fellow, Upper Great Plains Transportation Institute, North Dakota State University*; John Bitzan,
SOYBEANS: LARGE SUPPLIES CONFIRMED, BUT WHAT ABOUT 2005 PRODUCTION?
 SOYBEANS: LARGE SUPPLIES CONFIRMED, BUT WHAT ABOUT 2005 PRODUCTION? JANUARY 2005 Darrel Good 2005 NO. 2 Summary USDA s January reports confirmed a record large 2004 U.S. crop, prospects for large year-ending
SOYBEANS: SURPLUS GROWS, ACREAGE TO DECLINE
 SOYBEANS: SURPLUS GROWS, ACREAGE TO DECLINE JANUARY 2007 Darrel Good 2007 NO. 2 Summary The 2006 U.S. soybean crop was a record 3.188 billion bushels, but was 16 million smaller than the November 2006
SOYBEANS: LARGE U.S. CROP, WHAT ABOUT SOUTH AMERICA? October 2005 Darrel Good 2005 No. 8
 SOYBEANS: LARGE U.S. CROP, WHAT ABOUT SOUTH AMERICA? October 2005 Darrel Good 2005 No. 8 Summary USDA reports provided two fundamental surprises for the market over the past three weeks. First, the September
Class I Railroad Statistics
 Class I Railroad Statistics Class I Railroads Class I Railroads are U.S. line haul freight railroads with operating revenue in excess of $266.7 million. Two Canadian railroads, Canadian National Railway
U.S. Drought Monitor, August 28, 2012
 University of Nebraska - Lincoln DigitalCommons@University of Nebraska - Lincoln US Ag in Drought Archive Drought -- National Drought Mitigation Center 8-28-2 U.S. Drought Monitor, August 28, 2 Brian Fuchs
U.S. Drought Monitor, September 4, 2012
 University of Nebraska - Lincoln DigitalCommons@University of Nebraska - Lincoln US Ag in Drought Archive Drought -- National Drought Mitigation Center 9--12 U.S. Drought Monitor, September, 12 Brian Fuchs
U.S. Drought Monitor, July 31, 2012
 University of Nebraska - Lincoln DigitalCommons@University of Nebraska - Lincoln US Ag in Drought Archive Drought -- National Drought Mitigation Center -3-2 U.S. Drought Monitor, July 3, 2 Mark D. Svoboda
FREIGHT POLICY TRANSPORTATION INSTITUTE. Spatial Patterns in Household Demand for Ethanol Hayk Khachatryan, Ken Casavant and Eric Jessup
 FREIGHT POLICY TRANSPORTATION INSTITUTE Spatial Patterns in Household Demand for Ethanol Hayk Khachatryan, Ken Casavant and Eric Jessup Spatial Patterns in Household Demand for Ethanol Hayk Khachatryan,
EP US RAIL SERVICE ISSUES - DATA COLLECTION
 1. System-Average Train Speed by Train Type for the Reporting Week (MPH) Intermodal 31.7 AAR train speed measure. Calculated by dividing train-miles by total Grain unit 24.0 hours from origin to destination,
KYLE Charge Schedule. Optional Services Catalog Customer Switching and Accessorial Services. Customer Switching.
 Charge Schedule Intra-Plant Switch $250 Item 6000 Intra-Terminal Switch $500 Item 6010 Inter-Terminal Switch $500 Item 6020 Diversion/Re-consignment $350 Item 6210 Error Moves $500 Item 6040 Car Released
3.0 FREIGHT FLOW OVERVIEW
 3. FREIGHT FLOW OVERVIEW This analysis primarily uses IHS Global Insight s TRANSEARCH database and the Surface Transportation Board s Rail Waybill Sample. These datasets provide county-level data for freight
Concerns Regarding Freight Rail Transportation and Regulation. Marvin E. Prater, Ph.D. US Department of Agriculture Transportation Services Division
 Concerns Regarding Freight Rail Transportation and Regulation Marvin E. Prater, Ph.D. US Department of Agriculture Transportation Services Division Staggers Act Benefitted All Parties Average real rail
INDIANA HARBOR BELT RAILROAD
 INCLUSIVE OF ALL INCREASES STB IHB 8300-I INDIANA HARBOR BELT RAILROAD FREIGHT TARIFF 8300-I CANCELS FREIGHT TARIFF 8300-H CONTAINING INTERSTATE AND INTRASTATE RATES RULES AND REGULATIONS GOVERNING ACCEPTANCE
Crop / Weather Update
 Crop / Weather Update Corn Crop Condition Percent of Acreage Rated Good or Excellent 85 80 75 70 65 60 55 50 45 The USDA s weekly Crop Progress report rated the U.S. corn crop as of September 30 as being
Transportation Research Forum
 Transportation Research Forum RProfile of Short Line Railroads in High Grain Producction States Author(s): Michael W. Babcock Source: Journal of the Transportation Research Forum, Vol. 56, No. 3 (Fall
U.S. Drought Monitor, August 7, 2012
 University of Nebraska - Lincoln DigitalCommons@University of Nebraska - Lincoln US Ag in Drought Archive Drought -- National Drought Mitigation Center -- U.S. Drought Monitor, August, Mark D. Svoboda
U.S. Drought Monitor, August 14, 2012
 University of Nebraska - Lincoln DigitalCommons@University of Nebraska - Lincoln US Ag in Drought Archive Drought -- National Drought Mitigation Center 8-4-2 U.S. Drought Monitor, August 4, 2 Michael J.
MINNESOTA SOYBEAN MOVEMENTS
 MINNESOTA SOYBEAN MOVEMENTS 1979 Agricultural Extension Service University of Minnesota Minnesota Department of Transportation Extension Bulletin 468-1982 MINNESOTA SOYBEAN MOVEMENTS 1979 Extension Bulletin
Facts on Direct-to-Consumer Food Marketing
 United States Department of Agriculture Agricultural Marketing Service May 2009 Facts on Direct-to-Consumer Food Marketing Incorporating Data from the 2007 Census of Agriculture Written by: Adam Diamond
Grain Price SOYBEANS: SMALLER U.S. CROP, WILL SOUTH AMERICA FILL THE GAP? OCTOBER 2002 Darrel Good 2002 NO. 8. Summary
 UNIVERSITY OF ILLINOIS EXTENSION Grain Price OUTLOOK A joint publication of the Department of Agricultural Economics, College of Agriculture, Purdue University, West Lafayette, Indiana, and the Department
SOYBEANS: FOCUS ON SOUTH AMERICAN AND U.S. SUPPLY AND CHINESE DEMAND
 SOYBEANS: FOCUS ON SOUTH AMERICAN AND U.S. SUPPLY AND CHINESE DEMAND APRIL 2002 Darrel Good 2002-NO.4 Summary Soybean prices during the first half of the 2001-02 marketing year were well below the prices
THE NEW YORK, SUSQUEHANNA AND WESTERN RAILWAY
 THE NEW YORK, SUSQUEHANNA AND WESTERN RAILWAY NYSW 8001 - G - SWITCHING RULES AND MISCELLANEOUS CHARGES - AT STATIONS ON THE NEW YORK, SUSQUEHANNA AND WESTERN RAILWAY This tariff is governed by NYSW Conditions
NYMTC Regional Freight Plan Update Interim Plan Task Commodity Flow Analysis
 TECHNICAL MEMO NYMTC Regional Freight Plan Update 2015-2040 Interim Plan Task 2.2.1 Commodity Flow Analysis REVISED, JANUARY 2014 technical memorandum Task 2.2.1 Technical Memorandum Commodity Flow Analysis
The Fertilizer Institute. Current Transportation Dynamics November 6, 2006 By Tom Williamson, Transportation Consultants Co.
 The Fertilizer Institute Current Transportation Dynamics November 6, 2006 By Tom Williamson, Transportation Consultants Co. Questions What will be the cost of fuel, insurance, taxes, and new transportation
USDA Acreage & Stocks Report
 Wednesday June 30 th 2010 Acreage & Grain Stocks Estimates Bullish for Corn Mildly Friendly Old Soybeans, Bearish New Soybeans Bearish Wheat Corn stock reported 288 million less than average trade estimates.
Watershed Condition Framework
 US Forest Service - Watershed Condition Classification Maps http://www.fs.fed.us/publications/watershed/ Page 1 of 2 1/9/2013 Watershed Condition Framework The Forest Service has released the first national
Energy and Regional Economics
 Energy and Regional Economics Michael Carliner International instability and possible war affect the overall US economy, and economic conditions in different regions, in a variety of ways. Changes in energy
South Dakota State Rail Plan
 South Dakota State Rail Plan presented to Rail Stakeholders presented by Cambridge Systematics, Inc. in partnership with Civil Design Inc November 2013 Agenda State Rail Plan Overview» Purpose, Plan and
SOYBEANS: SMALLER STOCKS, MORE ACRES, AND EARLY WEATHER WORRIES
 SOYBEANS: SMALLER STOCKS, MORE ACRES, AND EARLY WEATHER WORRIES APRIL 2000 Darrel Good Summary March 1, 2000 stocks of soybeans were estimated at 1.397 billion bushels, 60 million less than on the same
On the Fed-Beef Production/Distribution System. Clemson Agricultural Experiment Station Technical Article No. 2422
 Effects of Changing Economic Relationships On the Fed-Beef Production/Distribution System Clemson Agricultural Experiment Station Technical Article No. 2422 by Gregory M. Clary, Assistant Professor Dept.
CGR TARIFF NO 01b Supplement 2 CANCELS CGR TARIFF NO. 01b, Supplement 1 IN ITS ENTIRETY. CG Railway, Inc.
 CGR TARIFF NO 01b Supplement 2 CANCELS CGR TARIFF NO. 01b, Supplement 1 IN ITS ENTIRETY CG Railway, Inc. CGR TARIFF NO. 01b, Supplement 2 CHARGES, RULES AND REGULATIONS GOVERNING ACCESSORIAL, DEMURRAGE,
The U.S. Railroad Regulation Experience and Future Changes July 2015 APAS. Whiteside & Associates Billings, Montana
 The U.S. Railroad Regulation Experience and Future Changes July 2015 APAS Whiteside & Associates Billings, Montana First Let s Cover Some Background So we are all on the same page Whiteside & Associates
Commercial Fleet Integration Program Western Canada Grain 2017
 Western Canada Commercial Fleet Integration Program CN is offering a Commercial Fleet Integration Program for grain, oilseed and special crop shippers who wish to enter agreements to supply privately owned,
THE NEW YORK, SUSQUEHANNA AND WESTERN RAILWAY
 THE NEW YORK, SUSQUEHANNA AND WESTERN RAILWAY NYSW 8001 - H - SWITCHING RULES AND MISCELLANEOUS CHARGES - AT STATIONS ON THE NEW YORK, SUSQUEHANNA AND WESTERN RAILWAY This tariff is governed by NYSW Conditions
A Study of United States Hydroelectric Plant Ownership
 INL/EXT-06-11519 A Study of United States Hydroelectric Plant Ownership Douglas G. Hall, INL Project Manager Kelly S. Reeves, NPS June 2006 The INL is a U.S. Department of Energy National Laboratory operated
Understanding Grain Movements for Demand Estimation
 The Navigation Economic Technologies Program July 24, 2004 navigation economics technologies Understanding Grain Movements for Demand Estimation The Columbia-Snake River System in Washington State US Army
CORN: USDA REPORTS FAIL TO CONFIRM SMALLER SUPPLIES
 CORN: USDA REPORTS FAIL TO CONFIRM SMALLER SUPPLIES JANUARY 2001 Darrel Good No. 1 Summary Corn prices managed a significant rally from late September to late December 2000, partially on anticipation of
THE NEW YORK, SUSQUEHANNA AND WESTERN RAILWAY CORP. NYSW C
 THE NEW YORK, SUSQUEHANNA AND WESTERN RAILWAY CORP. NYSW 8001 - C - SWITCHING RULES AND MISCELLANNEOUS CHARGES - AT STATIONS ON THE NEW YORK, SUSQUEHANNA AND WESTERN RAILWAY This tariff is governed by
CORN: SMALLER SUPPLIES ON THE HORIZON. April 2001 Darrel Good No. 3
 CORN: SMALLER SUPPLIES ON THE HORIZON April 2001 Darrel Good 2001- No. 3 Summary The USDA s March Grain Stocks and Prospective Plantings report released on March 30 provided some fundamentally supportive
CGR TARIFF NO 01b CANCELS CGR TARIFF NO. 01a IN ITS ENTIRETY. CG Railway, Inc.
 CGR TARIFF NO 01b CANCELS CGR TARIFF NO. 01a IN ITS ENTIRETY CG Railway, Inc. CGR TARIFF NO. 01b CHARGES, RULES AND REGULATIONS GOVERNING ACCESSORIAL, DEMURRAGE, STORAGE, SWITCHING, FUEL SURCHARGES, AND
HESR Charge Schedule: Customer Switching Billing Guarantee Timely Invoicing
 Charge Schedule: Intra-Plant Switch $250 Item 6000 Intra-Terminal Switch $500 Item 6010 Inter-Terminal Switch $500 Item 6020 Diversion/Re-consignment $350 Item 6210 Error Moves $500 Item 6040 Car Released
Chapter 3 Missouri Freight System
 Chapter 3 Missouri Freight System KEY POINTS One of the key products of this Missouri State Freight Plan is a defined Missouri freight network. This is the first time Missouri has had a defined freight
CORN: ATTENTION NOW TURNS TO THE NEW CROP
 CORN: ATTENTION NOW TURNS TO THE NEW CROP APRIL 2002 Darrel Good 2002-No. 3 Summary The USDA s March Grain Stocks report revealed larger corn inventories than the market expected, but recent export activity
SOYBEANS: DECLINING EXPORTS, LARGE STOCKS
 SOYBEANS: DECLINING EXPORTS, LARGE STOCKS JANUARY 2006 Darrel Good 2006 NO. 2 Summary At 3.086 billion bushels, the 2005 U.S. soybean crop was 43 million larger than the November forecast and only 38 million
August 4, The Honorable Donald J. Trump President 1600 Pennsylvania Avenue, NW Washington, DC Dear Mr. President:
 August 4, 2017 The Honorable Donald J. Trump President 1600 Pennsylvania Avenue, NW Washington, DC 20500 Dear Mr. President: On behalf of the more than 200 organizations representing rural communities,
Labor Market Outlook. Labor Market Outlook Survey Q (October December) Published by the Society for Human Resource Management
 Published by the Society for Human Resource Management") October December 2009 Labor Market Outlook Published by the Society for Human Resource Management Labor Market Outlook Survey Q4 2009 (October December) LABOR MARKET OUTLOOK SURVEY Q4 2009 (October December)
October December 2009 Labor Market Outlook Published by the Society for Human Resource Management Labor Market Outlook Survey Q4 2009 (October December) LABOR MARKET OUTLOOK SURVEY Q4 2009 (October December)
Rail Solutions and America s Future Prosperity Michael O Malley, July 12, 2008
 1 Rail Solutions and America s Future Prosperity Michael O Malley, July 12, 2008 Freight Railroads Deliver Every Day In 2005, U.S. freight railroads hauled enough: Wheat to make more than 400 loaves of
U.S. Drought Monitor, October 2, 2012
 University of Nebraska - Lincoln DigitalCommons@University of Nebraska - Lincoln US Ag in Drought Archive Drought -- National Drought Mitigation Center -2-12 U.S. Drought Monitor, October 2, 12 Anthony
Assessing the Importance of Freight Transportation to U.S. Agriculture
 Assessing the Importance of Freight Transportation to U.S. Agriculture Authors: Marina Denicoff USDA/AMS email: Marina.Denicoff@ams.usda.gov Ph: 202-694-2504 Eric Jessup WSU email : eric_jessup@wsu.edu
Profile of Short Line Railroads in High Grain Production States
 Profile of Short Line Railroads in High Grain Production States Michael W. Babcock Department of Economics Kansas State University Manhattan, KS 66506 Author Contact: Michael W. Babcock, mwb@ksu.edu, 785-532-4571
Q October-December. Jobs Outlook Survey Report. Published by the Society for Human Resource Management
 Q4 2011 October-December Jobs Outlook Survey Report Published by the Society for Human Resource Management JOBS OUTLOOK SURVEY REPORT Q4 2011 (October-December) OPTIMISM ABOUT JOB GROWTH IN Q4 2011 (OCTOBER-DECEMBER)
February 22, The Honorable Donald J. Trump President. Dear Mr. President:
 February 22, 2017 The Honorable Donald J. Trump President Dear Mr. President: On behalf of our respective organizations, which collectively represent U.S. agricultural producers, rural businesses, rural
ANNEX E: Methodology for Estimating CH 4 Emissions from Coal Mining
 1 1 1 1 1 1 1 1 0 1 0 1 ANNEX E: Methodology for Estimating CH Emissions from Coal Mining The methodology for estimating methane emissions from coal mining consists of two distinct steps. The first step
Introduction to North American Rail Transportation
 Introduction to North American Rail Transportation Christopher Barkan Professor & Executive Director Rail Transportation & Engineering Center University of Illinois at Urbana-Champaign Presentation Outline
The Intermodal Connection to Rural America's Resources, Economic Development, and Sustainability
 The Intermodal Connection to Rural America's Resources, Economic Development, and Sustainability July 20, 2017 Libby Ogard Prime Focus LLC Freight Rail Overview Each American requires the movement of approximately
IN THE PAST, research in transportation
 AGRICULTURAL ECONOMICS RESEARCH VOL. XIX, No. 2, APRIL 1967 Estimating the Demand for Truck and Rail Transportation: A Case Study of California Lettuce By Walter Miklius IN THE PAST, research in transportation
Review of Manitoba Hydro Export Price Forecast for Needs For and Alternatives To (NFAT)
") Review of Manitoba Hydro Export Price Forecast for Needs For and Alternatives To (NFAT) Douglas J. Gotham Purdue University TABLE OF CONTENTS Introduction 1 Manitoba Hydro s Supporting Information 1 Transmission
Review of Manitoba Hydro Export Price Forecast for Needs For and Alternatives To (NFAT) Douglas J. Gotham Purdue University TABLE OF CONTENTS Introduction 1 Manitoba Hydro s Supporting Information 1 Transmission
Test bank Chapter 4. Multiple Choice
 Test bank Chapter 4 Multiple Choice 1. During 1997, railroads carried what percentage of the total intercity freight traffic? a. 47 percent b. 39 percent c. 51 percent d. 25 percent 2. Which is considered
Q October-December. Jobs Outlook Survey Report. Published by the Society for Human Resource Management
 Q4 2012 October-December Jobs Outlook Survey Report Published by the Society for Human Resource Management JOBS OUTLOOK SURVEY REPORT Q4 2012 (October-December) OPTIMISM ABOUT JOB GROWTH IN Q4 2012 (OCTOBER-DECEMBER)
April June Labor Market Outlook. Published by the Society for Human Resource Management. Labor Market Outlook Survey Q (April June)
") April June 2009 Labor Market Outlook Published by the Society for Human Resource Management Labor Market Outlook Survey Q2 2009 (April June) LABOR MARKET OUTLOOK SURVEY Q2 2009 (April June) OPTIMISM ABOUT
April June 2009 Labor Market Outlook Published by the Society for Human Resource Management Labor Market Outlook Survey Q2 2009 (April June) LABOR MARKET OUTLOOK SURVEY Q2 2009 (April June) OPTIMISM ABOUT
Analyst: Meilin C. Pierce Spring Recommendation: Hold Target Stock Price (12/31/2016): $120
: $120") Recommendation: Hold Target Stock Price (12/31/2016): $120 1. Reasons for the Recommendation My recommendation is to hold Union Pacific Corporation (UNP) because my forecast shows that the stock is currently
Recommendation: Hold Target Stock Price (12/31/2016): $120 1. Reasons for the Recommendation My recommendation is to hold Union Pacific Corporation (UNP) because my forecast shows that the stock is currently
Q October-December. Jobs Outlook Survey Report. Published by the Society for Human Resource Management
 Q4 2013 October-December Jobs Outlook Survey Report Published by the Society for Human Resource Management JOBS OUTLOOK SURVEY REPORT Q4 2013 (October-December) OPTIMISM ABOUT JOB GROWTH IN Q4 2013 (OCTOBER-DECEMBER)
CORN: PRODUCTION EXCEEDS EXPECTATIONS
 CORN: PRODUCTION EXCEEDS EXPECTATIONS OCTOBER 2001 Darrel Good 2001 NO. 7 Summary The USDA's October Crop Production report forecast the 2001 U.S. corn crop at 9.43 billion bushels. The crop is about 540
KANSAS & OKLAHOMA RAILROAD, INC.
 (Cancels FT KO 8000-A) KANSAS & OKLAHOMA RAILROAD, INC. FREIGHT TARIFF KO 8000-B (Cancels Freight Tariff KO 8000-A) CONTAINING MISCELLANEOUS RULES AND CHARGES ALSO SWITCHING CHARGES ON TRAFFIC BETWEEN
Analysis & Comments. Livestock Marketing Information Center State Extension Services in Cooperation with USDA. National Hay Situation and Outlook
 Analysis & Comments Livestock Marketing Information Center State Extension Services in Cooperation with USDA April 2, 2015 Letter #12 www.lmic.info National Hay Situation and Outlook The 2014 calendar
APPENDIX B COMMODITY FLOWS NOVEMBER 2018 DRAFT
 APPENDIX B COMMODITY FLOWS NOVEMBER 2018 DRAFT 2 CURRENT COMMODITY FLOWS IN THE BIRMINGHAM REGION A commodity flow analysis for a region allows for an understanding of which commodities generate a significant
Importance of the Commodity Flow Survey (CFS) in Developing the Freight Analysis Framework (FAF)
 in Developing the Freight Analysis Framework (FAF)") Bureau of Transportation Statistics Importance of the Commodity Flow Survey (CFS) in Developing the Freight Analysis Framework (FAF) Annual Meeting Transportation Research Board January 14, 2015 Michael
Bureau of Transportation Statistics Importance of the Commodity Flow Survey (CFS) in Developing the Freight Analysis Framework (FAF) Annual Meeting Transportation Research Board January 14, 2015 Michael
Testimony on the Value of the Mississippi River for U.S. Agriculture
 Testimony on the Value of the Mississippi River for U.S. Agriculture Presented to the Mississippi River Caucus Washington D.C. FAPRI-UMC Briefing Paper #06-04 July 8, 2004 Prepared by the Food and Agricultural
THE NEW YORK, SUSQUEHANNA AND WESTERN RAILWAY
 THE NEW YORK, SUSQUEHANNA AND WESTERN RAILWAY NYSW 8001 - I - SWITCHING RULES AND MISCELLANEOUS CHARGES - AT STATIONS ON THE NEW YORK, SUSQUEHANNA AND WESTERN RAILWAY This tariff is governed by NYSW Conditions
The Economic Impact of Privately-Owned Forests in the United States
 The Economic Impact of Privately-Owned Forests in the United States The Economic Impact of Privately-Owned Forests in the United States Prepared for: National Alliance of Forest Owners Contact: Gretchen
Ag TC Meeting June 26, 2014 San Francisco. Whiteside & Associates/Alliance for Rail Competition Billings, Montana
 Ag TC Meeting June 26, 2014 San Francisco Whiteside & Associates/Alliance for Rail Competition Billings, Montana www.heavytrafficahead.org About The Study Team Terry C. Whiteside Whiteside & Associates
BEFORE THE SURFACE TRANSPORTATION BOARD. Docket Ex Parte No. 711 PETITION FOR RULEMAKING TO ADOPT REVISED COMPETITIVE SWITCHING RULES
 BEFORE THE SURFACE TRANSPORTATION BOARD Docket Ex Parte No. 711 PETITION FOR RULEMAKING TO ADOPT REVISED COMPETITIVE SWITCHING RULES Comments of the American Chemistry Council March 1, 2013 The American
US Crops and Where They re Grown. Introduction. Corn, Soybeans, Barley, and Oats
 US Crops and Where They re Grown Introduction The United States is a market leader in many of the world's major crops. Understanding where and when major US crops are grown can help Canadian farmers market
A Short History of U.S. Freight Railroads
 A Short History of U.S. Freight Railroads Association of American Railroads August 2017 Summary Since their birth more than 185 years ago, railroads have played a crucial role in America s development.
Transportation Research Forum
 Transportation Research Forum State Variation in Railroad Wheat Rates Author(s): Michael W. Babcock, Matthew McKamey, and Phillip Gayle Source: Journal of the Transportation Research Forum, Vol. 53, No.
Statement of. Thomas M. Hoenig. President. Federal Reserve Bank of Kansas City. before the. Senate Committee on Agriculture, Nutrition and Forestry
 Statement of Thomas M. Hoenig President Federal Reserve Bank of Kansas City before the Senate Committee on Agriculture, Nutrition and Forestry United States Senate February 17, 2011 Thank you, Madam Chair.
Land Values 2013 Summary
 United States Department of Agriculture National Agricultural Statistics Service Land Values 2013 Summary August 2013 ISSN: 19491867 Contents Agricultural Land Values Highlights... 4 Farm Real Estate,
THE TRANSSHIPMENT PROBLEM IN TRAVEL FORECASTING: TOUR STRUCTURES FROM THE ONTARIO COMMERCIAL VEHICLE SURVEY
 THE TRANSSHIPMENT PROBLEM IN TRAVEL FORECASTING: TOUR STRUCTURES FROM THE ONTARIO COMMERCIAL VEHICLE SURVEY University of Wisconsin Milwaukee Paper No. 09-3 National Center for Freight & Infrastructure
CORN: BETTER DEMAND, PRODUCTION CONCERNS
 CORN: BETTER DEMAND, PRODUCTION CONCERNS April 2000 Darrel Good Summary The USDA s March Grain Stocks report, released on March 31, confirmed a high rate of domestic corn use during the second quarter
2012 Distribution Best Practices Benchmarking Company Profile Data Packet
 American Gas Association January 2012 Company Name: DOT Operating ID(s): Person Completing Form: Phone Number: Email Address: Required Fields Deadline for data submittal in BESS, http://www.aga.org/research/bess/
Grain Stocks. Corn Stocks Up Slightly from September 2015 Soybean Stocks Up 3 Percent All Wheat Stocks Up 21 Percent
 Grain Stocks ISSN: 949-095 Released September 30, 06, by the National Agricultural Statistics Service (NASS), Agricultural Statistics Board, United s Department of Agriculture (USDA). Corn Stocks Up Slightly