Manufacturing Facility Layout: A thesis presented to. the faculty of. In partial fulfillment. of the requirements for the degree.
|
|
|
- Gabriel Cannon
- 6 years ago
- Views:
Transcription
1 Manufacturing Facility Layout: A Methodology Incorporating Rotated Aisles into Layout Design A thesis presented to the faculty of the Russ College of Engineering and Technology of Ohio University In partial fulfillment of the requirements for the degree Master of Science Dean A. Marinchek December Dean A. Marinchek. All Rights Reserved.
2 This thesis titled 2 Manufacturing Facility Layout: A Methodology Incorporating Rotated Aisles into Layout Design by DEAN A. MARINCHEK has been approved for the Department of Industrial and Systems Engineering and the Russ College of Engineering and Technology by Dale T. Masel Associate Professor of Industrial and Systems Engineering Dennis Irwin Dean, Russ College of Engineering and Technology
3 Abstract 3 MARINCHEK, DEAN A., M.S., December 2014, Industrial and Systems Engineering Manufacturing Facility Layout: A Methodology Incorporating Rotated Aisles into Layout Design Director of Thesis: Dale T. Masel This thesis provides a methodology to allow for rotated interior aisles to reduce the total transportation cost within a facility that is using the flexible bay structure. The methodology contains a construction phase where the optimal Input/Output points and aisle structure are found followed by an improvement phase that optimizes the aisle rotations within a facility. The methodology was applied successfully to three problems from the literature with a maximum improvement of about 21%. All results from the testing are interpreted along with a conclusion including possible extensions of the study.
4 Table of Contents 4 Page Abstract... 3 List of Tables... 7 List of Figures Introduction Importance of Layout Motivation Objective Literature Review Department Layout Heuristic approaches Metaheuristic approaches Input/Output Point and Aisle Configuration I/O point determination I/O and aisle layout determination Layout and I/O determination Layout and aisle layout determination Rotated Aisles Methodology... 36
5 5 3.1 Assumptions & Constraints Implementation Construction Phase Department corner calculation Candidate Input/Output location calculation Distance between Input/Output points calculation and optimization Extract aisle structure Improvement Phase Recalculation of department coordinates Alternate aisle rotation Recalculation of distances between Input/Output points Feasibility of New Department Geometries Results Test 1: Vertical Aisle Rotation van Camp 10 department problem Bazaraa 14 department problem Armour & Buffa 20 department problem Test 2: Horizontal Aisle Rotation van Camp 10 department problem Bazaraa 14 department problem
6 Armour & Buffa 20 department problem Interpretation of Results Conclusion Summary of Results Contributions Benefits Implementation Approach Other considerations Future Work References Appendix: Problem Flow Matrices and Department Areas... 85
7 List of Tables 7 Page Table 1.1: Closeness relationship ratings Table 3.1: Cost of aisle layouts Table 4.1: VC10 optimal vertical aisle rotations Table 4.2: B14 optimal vertical aisle rotations Table 4.3: AB20 optimal vertical aisle rotations Table 4.4: VC10 optimal horizontal aisle rotations Table 4.5: B14 optimal horizontal aisle rotations Table 4.6: AB20 optimal horizontal aisle rotations Table 4.7: Summary of results Table 4.8: Changes in aisle length after rotation Table A.1: VC10 flow matrix Table A.2: VC10 department areas Table A.3: B14 flow matrix Table A.4: B14 department areas Table A.5: AB20 flow matrix Table A.6: AB20 department areas... 88
8 List of Figures 8 Page Figure 1.1: Example of flexible bay layout Figure 3.1: Candidate I/O point numbering Figure 3.2: Trapezoidal bay/department calculations Figure 3.3: Bay shape with negative z-value Figure 3.4: Trapezoidal shapes with horizontal aisle rotations Figure 3.5: Aisle structure generalization Figure 3.6: Example of department layout adapting to new geometry Figure 3.7: Example of an acute aisle angle Figure 3.8: Unusable floor space examples Figure 4.1: VC10 vertical aisle rotation results Figure 4.2: B14 vertical aisle rotation results Figure 4.3: AB20 vertical aisle rotation results Figure 4.4: VC10 horizontal aisle rotation results Figure 4.5: B14 horizontal aisle rotation results Figure 4.6: AB20 horizontal aisle rotation results Figure 4.7: Number of departments vs percent improvement Figure 4.8: Rotation type vs percent improvement... 72
9 1 Introduction 9 The facility layout problem has been studied and improved for decades. Facility layout determines the best locations for departments within a manufacturing facility to reduce total transportation costs (Drira, Pierreval, & Hajri-Gabouj, 2007). This can also include aisle construction and selection of material handling systems. In order to determine the optimal layout, all factors such as department locations, shapes, and flows must be taken into account to reduce the costs involved with material handling. It is wellknown that aisle structures must be included in the design process in order provide designs that are adaptable into a real-world facility. Up to this point, manufacturing facility layout methods assume the aisles must be parallel to the exterior walls. This limits possible routes of travel, in addition to constraining department shapes. The idea of this thesis is to relax this assumption and allow for rotated aisles within a manufacturing facility. The goal of rotating aisles is to reduce travel costs by providing more direct paths between departments. This optimization can be difficult due to the vast number of combinations of aisle rotations, so there must be a limit on which aisles to rotate in order to simplify the problem. Additionally, as the aisles rotate, departmental geometries can become complex, causing difficulty in the calculations. Steps must be taken to maintain departmental geometries that provide usable floor space while still allowing for rotated aisles. With this taken into account, this thesis will explain the steps involved in developing the methodology to incorporate rotated aisles into the design process. An optimized layout will be used as the starting point, from which aisles will be reoriented to reduce transportation costs while maintaining the required department floor space.
10 10 This section provides necessary information relating to the topic beginning with extensive background information in section 1.1, followed by the motivation specific to aisle structure in section 1.2, and objective of the thesis in section Importance of Layout In addition to material handling costs, a good layout can allow for cost savings in other categories such as reducing work-in-process inventory and increasing overall efficiency (Kim & Kim, 2000). With the possible reduction in various non-value added tasks throughout the manufacturing process, it is clear why this topic is still relevant in the industry and is constantly being studied and improved. This further emphasizes the fact that any improvement during the design phase can result in substantial cost reduction later on. Facility layout is of extreme importance not only during new facility design but also in redesigns that can greatly reduce non-value added tasks. If a new layout can reduce material handling times, the advantages are obvious. It is found that 15-70% of manufacturing costs can be attributed to material handling, which represents of 87% of all manufacturing time (Tompkins, White, Bozer, & Tanchoco, 2010). This clearly indicates how important facility layout can be, since any reduction in handling costs can greatly benefit a manufacturer. There are four main features that must be addressed during manufacturing facility layout design: the area of each department within a given building, interdepartmental flows, the input and output locations (I/O) for each department, and the aisle configuration. While the order of these four aspects being addressed in the design process may vary, they all must be considered to produce a complete design.
11 When the design process begins, the areas of the building and of each required 11 department are typically known. This puts restrictions on the design, as each department must fit within the facility boundaries while maintaining the required usable floor space. Additionally, the flow between the departments must be considered. The interdepartmental flow can be considered in two ways: qualitatively and quantitatively. As explained by Tompkins et al. (2010), the typical qualitative values detailed in Table 1.1 are used to describe the necessary adjacency of departments in a facility. The quantitative relationships frequently used in analysis are the transportation cost involved with movement between departments in the form of a cost per distance travelled and the amount of flow. This will require departments that have high transportation costs and a high closeness rating to be near each other to minimize total transportation cost in the facility layout. Table 1.1: Closeness relationship ratings Rating A E I O U X Description Absolutely Necessary Especially Important Important Ordinary Closeness OK Unimportant Undesireable Another major aspect of facility layout is determining the location of the I/O point for each department. The I/O point of each department is where the product/material enters and exits the department. This could be a single point that constrains all flow in and out of the department, or multiple points, depending on departmental design. The
12 12 location of the I/O point greatly affects the quality of the facility layout because it has a significant effect on travel distances. The last feature of facility design is the aisle structure. This determines where the aisles should be located in order to direct flow throughout the facility. The objective is to minimize travel distances and space dedicated to aisles. Because aisles require valuable floor space, it is important to balance the use of aisles between minimizing both travel distances and floor space dedicated to aisles. There are various ways to measure the distances between departments during facility layout design. Centroid-to-centroid distances are the most typical form of measurement used throughout studies because of their simplicity. The measurement techniques most frequently used to measure this distance are either a Euclidean or rectilinear measurement. Euclidean distance measures the direct distance in the form of a straight line while rectilinear distance is the sum of the differences in Cartesian coordinates. Neither of these two measurement techniques can be considered accurate, especially in the form of centroid-to-centroid, because of two reasons. First, the flow from department to department does not typically start or end at the department s center. Second, these measurements assume flow through other departments rather than around them which is not typical in an actual facility. The measurement technique that most resembles actual aisle travel is contour distance (Norman, Arapoglu, & Smith, 2001). This takes all departmental boundaries as possible aisles and uses these as the constraints for all travel. Additionally, this technique is most accurate when measuring distances beginning and ending at department I/O rather than department centroids because I/O points are located on departmental boundaries.
13 1.2 Motivation 13 There is an evident trend in publications addressing facility layout problems. Recent articles are implementing simultaneous solving of different design problems into a single calculation (Drira et al., 2007). The authors explain how layout problems are being combined with factors such as I/O locations, difficult geometries, aisles, and even multiple floors. These more comprehensive calculations should allow for better end results and easier adaptation to real-world situations. Specifically addressing the aisle aspect, it is of great importance to include actual aisle structures in the layout calculations to make them more adaptable to a real-world facility. Most previous works have failed to account for the actual aisles within a facility and only focused on department location (Alagoz, Norman, & Smith, 2008). This is a shortcoming, as actual aisle locations can vary greatly in a facility. For this reason, it is particularly important to not only determine locations of departments, but also specific travel routes between them. One example of how aisles can be accounted for in layout calculations is work of Alagoz et al. (2008). The authors were able to successfully incorporate aisle structures by integrating the cost per aisle length into the equation. However, one assumption made throughout the work is that the aisles must run parallel to the facility s exterior walls. This is a limitation as it restricts the possible routes of travel within a facility. If this constraint were removed, it would allow for aisles to run in more direct routes between departments to reduce travel distances. The idea that a rotated aisle can provide a shorter trip from one point to another is not a new idea, but has not been studied in a manufacturing facility layout specifically.
14 14 Gue and Meller (2009) looked at a similar situation in unit-load warehouses and determined rotated aisles to have great benefits in travel distance reduction. They were able to reduce expected travel times by more than 20%. This should allow for adaptation into manufacturing facilities with similar benefits. If rotated aisles can reduce travel distances, it is important to take this into account with the layout calculations for a manufacturing facility and remove the restriction that all aisles must run parallel to the building s exterior walls. It is important to note that Gue and Meller s (2009) work cannot be directly applied to manufacturing facility layout because of the overall difference in design requirements. Warehouses are designed to have consistent aisles throughout the facility whereas manufacturing facilities must adapt to various department sizes and shapes. Additionally, the flow within a manufacturing facility greatly differs. Warehouses typically have a consistent flow from and to a certain point (shipping/receiving area), while a manufacturing facility has a large variety of flows among all departments. For these reasons, only the general idea of allowing for rotated aisles can be implemented, not the specific methodology. 1.3 Objective The objective of this thesis is to develop a methodology to incorporate rotated aisles into a manufacturing facility layout design in order to reduce travel distance among departments. There is an assumption in most previous works that the aisles in the facility must be parallel to the exterior walls of the building. This assumption is unnecessary and limits the possible routes of travel. A rotated aisle can provide for a shorter, more direct trip than travelling on two perpendicular aisles. However, adding this variable to the
15 15 design process complicates the situation because not only does the size and location of each department matter, the angles of the boundaries must be taken into account as well. One common example of facility layout that is often addressed in design studies is the flexible bay layout. This is described by Tate & Smith as the division of a given facility into bays that run in one direction (1995). These bays can then vary in length adapting to the area requirements of the departments that fall within the bay. An example of this layout can be seen in Figure 1.1. The boundaries of each bay form aisles that run the entire width of the facility and shall be referred to as the main vertical aisles. There are secondary aisles that divide the bay into departments that shall be referred to as horizontal aisles. All transportation throughout the facility is then constrained to these potential aisle locations. Figure 1.1: Example of flexible bay layout One constraint on all studies using flexible bay layout in facility design is that the aisles must remain parallel to the facility s exterior walls. Removing this constraint allows the aisles to be rotated individually to allow more direct flow paths between
16 16 departments. In order for this to occur, the decision variables when determining the aisle configuration must include the aisle angles rather than simply the I/O points. The general objective is to allow for a reduction in overall expected travel distance. Specifically, the objective is to change the way aisles are configured in a manufacturing facility by removing the unnecessary restriction of only allowing vertical and horizontal aisles. The flexible bay layout is the most applicable example when considering rotated aisles because there are consistent candidate aisles throughout the layout. Other layout designs may produce many short, inconsistent aisles throughout the facility that do not necessarily follow a consistent path. The flexible bay layout is the good option since adding the aisle angle variable to the design complicates the process, so longer, more consistent aisles are desirable. The procedure of improving the layout must now consist of two major steps which are dependent on the aisle rotation: determine the new locations of the department corners, and calculate the new travel distance between departments. When the rotations of the aisles change, the boundaries of the departments also change in both shape and location. The first step must be to determine the new locations of the department. Once the locations of all corners for each department are calculated, the distances between departments I/O points can be calculated. As stated, all factors are dependent on the aisle angle, which allows for a determination of the angles that provide the minimum total travel distance for all interdepartmental flow. The potential negative effects of rotated aisles must also be considered during the design process. Rotated aisles can cause unusable space within the departments if the angle between aisles at an intersection is too small. Extreme aisle angles could also
17 17 hinder usable aisle space as transportation devices may not be capable of making a sharp turn. Therefore this factor must be taken into account in the calculations as it may necessitate a larger facility overall. This thesis explains the methodology developed for determining the aisle angles in a manufacturing facility layout to reduce total travel distance. Additionally, supplemental tests are provided to demonstrate the methodology s effectiveness in reducing transportation costs. Since current publications are lacking in their consideration of allowing for rotated aisles, this thesis explains the methodology developed for determining the optimal aisle angles in a manufacturing facility layout to reduce total travel distance. This methodology uses an optimized flexible bay layout as the basis of all aisle rotations that further reduce the transportation costs. Additionally, supplemental tests are provided to demonstrate the methodology s effectiveness in reducing transportation costs. Two types of aisle rotations are tested in addition to a penalty function being considered to prevent undesirable department shapes. The overall goal is to further reduce the cost of department layouts simply by rotating aisles within the facility. The layout of this thesis is as follows: Section 2 gives an extensive literature review of the current state of facility design and how aisle construction has been considered in the past. Section 3 explains the methodology in detail to give a better understanding of the steps involved in the process. Section 4 presents the results collected for various layouts that have been studied by other publications to show the potential benefits of applying the rotated aisle methodology. Finally, section 5 gives an overall
18 18 conclusion of the paper explaining the prospective applications of the methodology and suggestions for future improvements.
19 2 Literature Review 19 With such a well-studied topic, there have been a large number of techniques and approaches applied to the facility layout problem. Various objectives within the problem can be addressed, either stepwise or concurrently, while being solved with various methods. Drira et al. (2007) gave an extensive overview of the current state of published literature in the field. They explained that designs are greatly dependent on department types, such as those that require certain I/O point locations or flow types (e.g. conveyors or automated guided vehicles). Additionally, it was shown that the overall literature can be divided up into two main categories: static layout and flexible layout. Drira et al. (2007) noted that the majority of all methods are formulated as either quadratic assignment problems (QAP) or mixed-integer programs (MIP). QAP formulation is when a facility is divided into a grid and departments are assigned to a blocks of the grid, while MIP formulation allows for continuous placement of departments anywhere within the facility. The current trend is shown to be multiobjective problems with the goal of calculating a design that is easily adaptable into a facility. Drira et al. (2007) also showed the various methods that have been applied to layout design, in both single and multi-objective optimization. One method is an exact approach which finds the guaranteed optimal design, but is limited in the size of problem for which it can be computed. The other main approach is to seek an approximated optimum by implementing techniques such as tabu search (TS), simulated annealing (SA), genetic algorithms (GA), ant colony optimization (ACO), and heuristic algorithms. These methods are capable of handling much larger problems with fewer restrictions.
20 20 Davoudpour, Jaafari, & Farahani (2010) conducted a survey that was specific to bay layouts. Topics addressed were the various methodologies for measuring department distances such as rectilinear or department contours. It was also shown that most bay layout problems, because of their extreme complexity, are addressed with techniques like TS and GA. The various methods of encoding layouts with these approaches were explained showing how a final layout can be extracted from these methods. Additionally, similar to Drira et al. (2007), it was shown how the bay layout has been successfully implemented in both static and dynamic layouts. The following is a detailed literature review of the facility layout problem and how it pertains to aisle selection in particular. Section 2.1 is an overview of general layout development methods that have been studied recently. Section 2.2 covers studies that more directly pertain to the selection of I/O points, aisles, and the interaction with layout design. Lastly, section 2.3 is the current state of rotated aisles in recent literature. 2.1 Department Layout The foundation of the facility layout problem is optimizing the locations of departments to minimize transportation costs and/or maximize department adjacencies. These problems date back decades, but continue to be studied. Currently the problem is addressed with many formulation techniques. The following are some recent and relevant published studies addressing departmental layout specifically Heuristic approaches. Kim & Kim (2000) utilized a traditional MIP to optimize material flow between departments. In order to do so effectively even on large problems, the study looked at a specific case in which the department shapes and I/O points are preselected. The algorithm then determined a layout, which it then improved
21 upon using a set of four heuristics. The first heuristic used a department swapping 21 procedure, the second changed the orientation and location of the departments, the third changed only the orientations, and the last focused on a sub-section of the layout and applied similar approaches like orientation and location changes. The heuristic approach is used in order to perform well on larger layouts since no search or evolutionary algorithms like GAs are used. With the heuristic approach in addition to the problem restrictions, the calculation was able to provide solutions for problems up to 20 departments. Rawabdeh & Tahboub (2006) developed a software package called FLASP, which can be used for the facility layout problem. Their methodology used adjacency ratings alongside distance measures between departments when calculating a layout. This allows for both qualitative and quantitative relationships between departments to be accounted for. The calculations behind the software combine heuristic and probabilistic techniques to remain effective and efficient on large problems. The objective of the program was to create an approach for the user to have extensive input throughout the design process while being able to modify many parameters in order to produce a realistic layout that is easily adapted into a facility Metaheuristic approaches. While many studies still use traditional heuristic methods, most recent publications use metaheuristics in order to be applicable and efficient on larger problems. GAs are one popular metaheuristic technique that is used by many, such as Tate & Smith (1995). A GA s ability to successfully find a global optimum when many local optima are present, combined with flexible bay layouts, limited the search area to a more realistic design. The genetic coding used represents the
22 22 flexible layout with a string of numbers ordered from top-to-bottom and left-to-right in the facility, followed by a second string representing the breakpoints corresponding to the bays. Additionally, the form of breeding used selects the location of each department and bay break with equal likelihood from one of the parents with the rule that all departments must be present in the offspring. A methodology was also in place to make parent choice give preferential status to fitter parents. As far as mutation goes, the design had three methods: the mutations can flip the subsequences, combine bays, or divide bays. These were distributed so the quantities for creation and deletion of bays would be equal and an optimal mutation rate was found to be 50% for a population of 10. An aspect ratio constraint or minimum side length, to maintain plausible department shapes, was applied as a penalty function dependent on the number of infeasible departments. Applying their formulation, they were able to attain results that ranged from 16 to 19% reduction in transportation costs over previously published works. Ye & Zhou (2007) used a combination of GA and TS to solve a multi-objective facility layout problem in which the adjacency rating technique and the total transportation cost technique were combined when determining the facility layout. The exact design addressed in this study was one with pre-determined fixed aisles within the facility and pre-determined facility areas. This design is applicable in facilities where there are necessary aisle locations in place that run to locations such as a main entrance or delivery/shipping facility location. This caused the facility layout to be in the form of a grid where potential locations for departments can be defined by row and column for the mathematical formulation.
23 In Ye & Zhou s (2007) combined GA/TS formulation, the GA techniques are 23 similar to others used in facility layout planning with the addition of the TS as the tactic for the local search to better the capability and efficiency. This technique was used to prevent the TS results from being too dependent on the initial solution, since the initial solutions were varied by the GA, while also preventing the GA from finding a suboptimal solution due to computation time constraints. It was said that the disadvantages of each algorithm were offset by the advantages of the other in order to obtain a combined formulation to accurately find the global optimum. It was noted that the algorithm was not efficient enough to be used on large problems but was used effectively on an eleven department problem. Kulturel-Konak (2012) created an algorithm that implements TS in addition to linear programming (LP) techniques to determine layout design for a flexible bay layout. Specifically, probabilistic TS, which was used in this literature, is a version of TS that requires less computational power by limiting the search area using probability to decide upon an admissible move. The approach was to remove some of the drawbacks that are associated with typical flexible bay layouts such as the limited number of feasible solutions due to shape constraints and the fact that the facility area must equal the sum of all departmental areas. The algorithm was based off of the idea that the departments in a given bay can vary in width as long as they fit within the bay and do not overlap other departments. This idea allowed for empty space within the bay, which may not be ideal in all cases, but allowed for more freedom in design of the layout. Kulturel-Konak (2012) used an encoding technique that only required one array that is represented by 2N elements, where the departments are labeled 1 to N. The
24 24 encoding listed the departments in the order of which they were shown in the final layout with 0 s indicating where the bay breaks are located. The 2N indicates the maximum number of encoding elements necessary when each department would be allocated to its own bay. The local move operators used in this study were swap and insert, which allowed for a given department to be either swapped with another department or inserted before a given element. For each candidate encoding, LP was applied to determine the optimal locations of the departments within the bays. In order to keep the program linear, tangential support department area approximation was applied. The proposed algorithm improved upon all prior studies based on flexible bay layout with empty space. Previous studies such as Tate and Smith s (1995) required the addition of either dummy departments or artificially enlarged departments in order to compensate for empty space within the facility such as. Another study by Kulturel-Konak & Konak (2011) used ACO to determine an optimal flexible bay layout for various problems. ACO is similar to a GA in that it develops a solution based off of a population, but differs in that each new solution is developed from a random selection rather than from parent solutions. The same aspect ratio/minimum side length constraints that are used by many layout methods were implemented to maintain feasible layouts by applying them as a penalty function. With respect to modification, insert and swap functions that have been used in other studies were applied to further improve each iterative solution that is better than the current optimum. The algorithm was able to improve upon Tate and Smith s (1995) results for the well-studied 20 department problem (AB20) first published by Armour & Buffa
25 25 (1963). For all smaller problems, the algorithm was either able to improve upon or match the best previously published results based on flexible bay layouts. 2.2 Input/Output Point and Aisle Configuration As explained previously, the full facility layout problem involves more than simply determining department locations within a facility. It includes the layout and design of I/O points and the corresponding aisle structure that links these points. This has been studied by many authors alongside various other aspects which are explained in the following subsections I/O point determination. Kim and Kim (1999) implemented an approach to determine the optimal location of I/O points for a given a layout. The authors proved that the optimal I/O locations will always be at department boundary intersections when considering department contours as the distance metric. This idea significantly reduced the search of potential locations for the I/O points. The proof was based off of the idea that any travel to or from a department must travel through one of its intersections. Therefore, choosing a location for an I/O point anywhere on the department s boundary other than an intersection simply added to the overall travel distance. Additionally, it was proven that some intersections were dominated by others, further reducing the search area. A dominant region was defined as a rectangular region in which all segments of the region lie on a department border with at least one border of each department included. The assumptions involved in Kim and Kim s (1999) study were that all departments are rectangular, all transportation was constrained to departmental boundaries, and distances were measured as shortest paths between I/O points using these boundaries. The algorithm used to find the optimum locations was branch and bound,
26 following several constraints. The problem was divided so that some I/O points were 26 fixed when solving optimal locations of other I/O points. The initial step set the I/O point for any departments that have only one unique, non-dominated intersection. Then the bounds of the root node were calculated using linear programming and heuristic approaches. Children nodes were calculated and changed if the upper bound was lower than the current node I/O and aisle layout determination. With a given flexible bay layout, the objective of Alagoz, Norman, & Smith s (2008) study was to determine the optimal aisle layout. A heuristic algorithm determined the candidate aisles, followed by an enumeration algorithm which selected the final aisle structure, followed by a genetic algorithm to determine the single I/O point location for each department. Distances between I/O points were calculated using contour distances with the assumption that all I/O points lie at an intersection as proven by Kim & Kim (1999). The user selects a minimum aisle length to prevent short and dead-end aisles but is not forced to preselect an aisle structure style. Since the layout is predetermined, the algorithm was able to perform on large problems. The aisle-selecting algorithms of Alagoz et al. (2008) were based off the idea that the vertical aisles between bays are always candidates, and horizontal aisles are candidates if they were relatively close in relation to the adjacent bay s horizontal aisles. Once the algorithm determined the aisle structure, the facility layout must be adjusted to fit the new structure including readjusting the areas of departments. The final layout, due to these adjustments, does not strictly follow a flexible bay layout since departments may now span multiple bays as long as there is not an interference with the newly constructed
27 aisles. Additionally, following these adjustments, the optimal I/O points had to be 27 recalculated using the GA again. However, it was found that the last step of again moving the I/O points provided negligible gains, making it possible to simplify the algorithm by only performing this last step on the final layout rather than each intermediate layout. Another method to determine an aisle structure was developed by Lee, Kim, & Kim (2009). This utilized a MIP that finds the optimal flow network by minimizing the total transportation cost and various penalty and construction costs. The assumption for this method was that the layout is given with the objective of locating the I/O points and all necessary aisles to minimize cost. Two other heuristic approaches were also developed in order to reduce the computation time, but still find an optimal or nearoptimal solution. The two given heuristics used Lagrangian relaxation and LP-relaxation in order to find the solution without restricting the number of departments due to computational limits. The relaxation techniques were applied heuristically in order to set certain binary variables, like flow path arc selection, making the problem more manageable. This was continued incrementally in order to determine the flow paths and the I/O points. Lee et al. (2009) conducted experiments on the popular van Camp 10 department problem (VC10), AB20 problem, and a randomly generated 30 department problem. The original VC10 problem only used unidirectional flow, so the flows were also applied in the opposite direction to give bidirectional flow that is used throughout the methodology (van Camp, Carter, & Vannelli, 1992). All departments were rectangular in shape with a certain maximum aspect ratio, no empty spaces within the facility were allowed, and continual layout design was implemented. Varying aisle capacity constraints, aisle
28 construction cost constraints, and turn penalty constraints were applied to each study 28 showing the adaptability of each approach. Overall the Lagrangian relaxation heuristic performed marginally better than the LP-relaxation technique, but also required more computation time. Both techniques were able to find the optimal solution in the majority of cases within a 24 hour time limit Layout and I/O determination. Another common way I/O points are determined is alongside the department layout problem. Kim & Goetschalackx (2005) used LP and heuristic approaches to solve these problems concurrently. Since this multiobjective optimality function is difficult to solve, the initial formulation was forced to use rectilinear centroid-to-centroid distances to determine the departmental layout in addition to rectilinear distances for the initial I/O point determination. The optimal I/O points were then determined by a set of heuristics, which in turn decided upon potential material flow paths since the shortest distance is found using the shortest path algorithm with department contours. All I/O points followed Kim & Kim s (1999) proof of being located at intersections of departmental boundaries. The formulation of Kim & Goetschalackx was modeled as a non-linear MIP that was converted into a LP by fixing the binary variables and using a set of linear constraints to replace the non-linear constraint (2005). Feasible candidate block layouts were formulated using SA with a sequence-pair technique. Sequence-pair is a method that can uniquely describe a block layout and does not depend on the type of block layout present. The sequence pair allowed for binary variables to be set, while the non-linear department area constraint was linearized by a tangential support estimation technique. These two manipulations allowed for each sequence pair to be solved with a LP.
29 29 The last step of Kim & Goetschalackx s (2005) technique determined the optimal I/O points using the all-pairs shortest path algorithm based on three heuristics as follows: the first method changed I/O points sequentially; the second method changed all input or all output points until the optimal was reached, then changed the other in a similar manner; the third method was the same as the second except that once the optimal solution was reached, one point was swapped to a worse location then run again to prevent a local optimum from being chosen. Both the LP and the I/O heuristics were calculated by the SA algorithm to select the optimum sequence-pair. The results showed an average improvement of over 20% for the well-known VC10 and AB20 problems in addition to randomly generated problems up to 40 departments. Konak, Kulturel-Konak, Norman, & Smith created an exact method for calculating facility layout using a MIP (2006). The nature of integer programming limits the size of problems in which it is applicable, typically fewer than 9 departments unless there are certain restrictions such as predetermined department size and I/O points. The flexible bay configuration, as will be used in this study, limits the number of possible layouts when compared to a continuous layout, allowing the exact approach to be successfully applied to problems up to 14 departments. Additionally, previous exact approaches have been limited by the non-linear department area constraint. Due to its complexity, this has typically been converted into a set of linear constraints that estimate the area and give upper and lower bounds. Since this is not accurate, this study used the characteristics of the flexible bay layout to prevent the non-linear constraint from being necessary, greatly improving the capability of the calculation. Many techniques were
30 used to further improve the efficiency of the program by eliminating cases such as 30 symmetrical layouts and empty bays between departments. Similarly, Norman, Arapoglu, & Smith used the flexible bay layout to help constrain the multi-objective calculation for locating both departments and I/O locations (2001). The authors allowed for the number of I/O points for each department to be unconstrained since they will only lie at department boundary intersections, which is a nominal value. It was explained that the number of potential I/O points is bounded by 2n- 2 where n is the number of departments. The distances between all the potential points, following department contours, were calculated with the shortest path algorithm since all arc lengths are determined by the departmental boundaries. The formulation was then applied using a GA to determine potential layouts, which are penalized based on the number of infeasible departments. The algorithm was successfully used in many of the popular layout problems, but results were not directly comparable since contour distances rather than centroid-to-centroid were used, in addition to allowing multiple I/O points per department. With a similar approach to Norman et al. s (2001), Aiello, Enea, & Galante (2002) used a GA to determine department and I/O locations in a flexible bay layout using department contour distances. One key difference in their problem description, however, was that the flow was unidirectional, so as to optimize for a cyclic flow pattern, which is ideal for automated guided vehicles. The GA used four strings that give the department order, bay breaks, I/O location, and flow path direction. The I/O points, with optimal locations calculated by a zero-one linear program model, were located on the left or right side of the department in parallel with the department s centroid. This type of
31 layout has not been studied previously, but the algorithm was able to complete a department layout to minimize the total transportation cost Layout and aisle layout determination. Another multi-objective problem commonly studied includes department and aisle layouts. Leno, Sankar, Raj, & Ponnambalam used a GA to solve this type of problem (2013). This study assumed that all department shapes and I/O locations were predetermined. The objective was to develop a layout that provides the optimal placement and orientation of each department to maximize the adjacency rating while minimizing the travel distance among departments. The adjacency ratings are related to the qualitative descriptions from Table 1.1, which were quantified in order to apply to the formulation. Leno et al. (2013) then applied an elitist GA to the traditional MIP model to determine the final layout. The chromosome string implemented had three components that gave the sequence pair, department orientations, and the department locations within the facility in the form of offsets. From the string, the coordinates of the departments and I/O points were calculated along with the best travel path between departments. The travel distance between departments was calculated using the shortest path algorithm and the candidate aisle locations, created by extending vertical and horizontal lines from all department corners and I/O points. In turn, this algorithm allowed for the layout and flow network to be constructed simultaneously. The approach was found to be successful in calculating better designs than traditional approaches, but was only applied to facilities with 12 or fewer departments. Similarly, Gómez, Fernández, De la Fuente García, & García used a GA to solve department and aisle layout, but with an innovative structure so that aisles would be
32 accounted for in the design (2003). The idea was similar to flexible bays but had a set 32 area between columns (considered a bay in flexible bay structure) to accommodate an aisle. The columns are addressed in two cases. One case had a set column length where all columns are a predefined length while the other case allowed for columns to vary in length similar to flexible bay construction. The fixed width columns caused a unique case where, if the department cannot fit within the column, the department will extend over into the adjacent bays to form a nonrectangular department shape. The fitness of the layouts was based upon a combination of department distances (measured centroid-tocentroid) and adjacency ratings. This formulation allowed for multi-objective functionality in the sense that it used two forms of fitness testing in addition to forming a layout that contains aisle structures in the design. Wu & Appleton (2002) used SA to solve the integrated problem. A slicing floor plan was implemented for the department layout because of its straightforward depiction by tree representation for the SA. The cut lines were numbered in the order in which they occurred, making all vertical cuts an odd level and even cuts horizontal. This technique allowed for the rebuilding of the layout with a bottom-up approach from any given string. The problem statement included the restriction that I/O points for each department were located either on the same side or on opposite sides, but can be oriented in any direction. This required 3 strings in the annealing: department, cut-line, and orientation. In Wu & Appleton s (2002) study, new layouts were determined by changing the department orientation, the order of departments, or the slicing tree layout. With the unique properties of a slicing floor plan, all potential aisle arcs were calculated from the annealing strings. Mathematical formulation was then applied to optimize the aisle
33 33 structure, favoring the shortest paths between departments and penalizing decisions that caused incomplete aisles. The same problem formulation was also applied by the main author in another article (Wu, 2002), using a GA as the approach rather than SA. Chittratanawat & Noble studied an optimization problem that included the material handling system in addition to both the department and I/O point locations (1999). As with many other multi-objective facility layout problems, there were limiting characteristics in the problem assumptions. For example, this study assumed that all departments are of equal size, either rectangles or squares, which was initially determined and then fixed for the entirety of the heuristic. The measurement technique used by the algorithm was rectilinear distances between I/O points, with the assumption that all I/O points must lie on a department s boundary. The algorithm utilized both qualitative and quantitative measurement to determine a layout s quality. Chittratanawat & Noble s (1999) study was approached using three methods. The first employed TS to determine potential department layouts. Second, a heuristic based on the quadrant approach optimized I/O point locations. Third, a construction algorithm selected the material handling equipment for the facility. Once the TS determined a layout, the I/O point algorithm decided which segment of the department s boundary, which was split up into 8 segments, was the optimal location. This was done for each department, followed by the construction algorithm deciding on the best material handling equipment for the given layout. While this approach is limited in the fact that an important assumption that all departments are equal in size must be made, it does show the benefits of applying a heuristic that takes multiple design factors into account when optimizing a layout.
34 2.3 Rotated Aisles 34 Although rotated aisles have not been studied in the traditional facility layout problem, they have been considered in an alternative setting by Gue & Meller (2009). The setting studied was in single command unit-load warehouses where orders are picked one at a time by the pallet rather than multiple individual items in various storage locations per order. This type of warehouse was previously found to not see any benefits from a cross-aisle as it simply takes up valuable storage space without increasing productivity. The authors argued this finding with the idea of relaxing the assumption that the cross-aisle must run perpendicular to the storage aisles. They found that the optimal cross-aisle layout for a warehouse with vertical storage aisles is in the shape of a V with the apex of the V being at the pickup/delivery location. This layout allowed for an improvement in travel distance of 8-12%. Additionally, another layout was found to reduce travel distance even further, over 20%. This layout, called the fishbone layout by the authors, used a V shaped cross aisle with vertical storage aisles above the cross-aisle and horizontal storage aisles below the cross-aisle. There are some downsides to the layouts considered however. The layouts were found to require slightly larger warehouses as a side-effect of the aisles taking up storage space. This is an important consideration in many cases, especially in a warehouse where storage density is of utmost importance. Additionally, it was considered that the fishbone layout could be disorienting to workers if the warehouse was large. The potential benefits of rotated aisles within a manufacturing facility can clearly be seen from this study. While the layout is different, the general idea of allowing for a more direct route between two places is apparent. With this consideration, along with the
35 importance of an all-encompassing facility layout design, the potential benefits are 35 obvious. The literature review has shown that developing a facility that includes department locations, I/O locations, and an aisle structure is much more easily adapted into a real-world scenario allowing for the most optimal layout. This, in combination with allowing for rotated aisles in a flexible bay layout is the focus of this thesis.
36 3 Methodology 36 The specific situation studied in this thesis involves a predefined flexible bay department layout. Additionally, there is to be one I/O point for each department with total transportation for the entire facility being calculated as a sum of weighted flows among departments. Distances between department I/O points are measured using the shortest path algorithm following department contours. The objective is to minimize total transportation cost by allowing for either the horizontal or vertical aisles to be rotated. 3.1 Assumptions & Constraints The first assumption for this methodology is that the layout and flow costs between departments are predefined. This is important in order to make the calculations manageable since the objective is multifaceted. This is a common assumption in many published studies that involve locating optimal I/O points and aisle structures due to the difficulty (Kim & Kim, 1999; Lee et al., 2009; Alagoz et al., 2008). This is especially true in this study becaus there is an added variable of aisle angle since the assumption that aisles must be parallel to the exterior walls is removed. This assumption can hinder the results somewhat because the optimal aisle angle may not truly provide the global optimum for the facility since the solution is dependent on the predefined layout. Other publications have used other assumptions such as predetermined department shapes and I/O point locations that can also limit the optimization process (Leno et al., 2013; Wu & Appleton, 2002; Wu, 2002; Chittratanawat & Noble, 1999). For this research, it was decided that the predefined layout assumption is more relevant and can provide for a more easily-adapted solution into a manufacturing facility. Lastly, this assumption allows for easier computation of larger problems.
37 37 Another assumption regarding department layout is that the facility configuration must follow the flexible bay structure, which is similar to many publications (Aiello et al., 2002; Norman et al., 2001; Konak et al., 2006; Alagoz et al., 2008). This assumption is widely used in multi-objective calculations involving aisles structures due to its inherent nature of providing good candidate aisles. This is of utmost importance in this study as the main objective is to determine aisle angles to minimize transportation costs, which can be easily adapted to this structure. Additionally, flexible bay layouts have been used as a way to limit the search area when determining an optimal layout (Konak et al., 2006). This is due to the fact that there are only a certain number of feasible layouts in flexible bays whereas continual layout allows for an infinite number of possibilities. The flexible bay layout exchanges a larger variety of potential layouts for a final layout that is more easily adapted into a facility by providing more consistent aisles. Furthermore, it is assumed that each department has a single I/O point, similar to many publications (Aiello et al., 2002; Kim & Kim, 1999; Lee et al., 2009; Alagoz et al., 2008; Kim & Goetschalckx, 2005). This assumption is for two main reasons: ease of computation and common real-world scenario. The single I/O point allows for a more straightforward distance calculation and optimization of I/O location, as there is only one variable for each department rather than multiple. Publications have varied in this assumption, from a single I/O point, one input and one output point (Leno et al., 2013; Wu & Appleton, 2002; Kim & Kim, 2000), and even an unbounded number of I/O points (Norman et al., 2001). The latter option was ruled out due to the unrealistic nature of departments having numerous I/O points. The first option was decided to be the most relevant in this study due to its simplicity and it should show the effects of rotated aisles
38 on total travel distance effectively. The single I/O point should not have any adverse 38 effects on the optimization problem as it is simply a design tactic. This assumption could easily be adapted to other situations where individual input and output points may be necessary or multiples of each. Additionally, all potential I/O point locations are assumed to be at the intersection of department boundaries. This was proven to be optimal by Kim & Kim (1999) and used by many publications due to its effectiveness in limiting the search area while not limiting the optimal solutions (Kim & Goetschalckx, 2005; Norman et al., 2001; Alagoz et al., 2008). This assumption hinders the results in no way, but provides a much easier determination of optimal I/O points. It is important to note that this assumption is only valid with the contour distance metric. The idea is based off of the notion that any travel to or from a department will travel through one of its intersections; therefore choosing a location anywhere else on a department s boundaries for an I/O point will simply add travel distance and provide no benefits. The distance between departmental I/O points is to be measured using contour distance, which has been proven useful by many publications and is a necessary assumption to validate the I/O location assumption (Norman et al., 2001; Kim & Goetschalckx, 2005; Alagoz et al., 2008). The reason for this assumption is the fact that rectilinear and Euclidean distances assume that it is possible to travel through other departments. Transportation within a manufacturing facility would not realistically travel through departments but would go around them. Using the department boundaries as the paths for measurement requires that all travel is around departments rather than through, allowing for a more accurate measurement of true travel distance. Without this
39 39 measurement technique, the true effects of rotating the aisles would not be as apparent. Furthermore, no additional calculations for arc lengths, which are the distances between any two nodes on the flow path following department contours, are necessary. This is because of the department sizes being already known, allowing for direct input into the shortest path algorithm. Additionally, using this distance metric allows for easy adaptation into an aisle structure since all measurements have been made on potential aisles. This allows for direct representation of necessary aisles. Lastly, the layout within departments is assumed to be capable of adapting to the departmental shapes generated during the optimization process. The original problem statement s minimum aspect ratio or minimum side length constraints are implemented to maintain normal departmental shapes. This ensures that each department shall have sufficient floor space to adapt to the new layout. This is a common assumption throughout facility layout problems, as department layout problems require a separate study. 3.2 Implementation There are two major steps involved in the methodology: the construction phase and the improvement phase. The construction phase takes the given layout and determines the I/O points and aisle structure. Then the improvement phase allows for the rotation of aisles to reduce travel distances while adjusting I/O point coordinates and department shapes accordingly. The latter is the main contribution of this thesis. Given a facility layout, the first step of the construction phase is to determine the coordinates of each department s corners. From this information, the next step is to
40 determine the optimal I/O point for each department. The last step of the construction 40 phase is to determine the aisle structure associated with the I/O points. With the information from the construction phase known, it is possible to further improve the aisle structure by allowing for rotated aisles. The improvement phase involves steps that must occur simultaneously to minimize transportation costs. Allowing for rotated aisles requires the recalculation of department corner locations and the corresponding distances between I/O points. The following is a list of all notations used throughout the study: n = number of departments within the facility j = "from" department (1,2,, n) k = "to" department (1,2,, n) f(j, k) = flow cost between j and k for a given time period d(j, k) = distance between the I/O points of department j and k using contours L = length of the facility (horizontal dimension in Figure 1. 1) W = width of the facility (vertical dimension in Figure 1. 1) i = index of department (1,2,, n) LTX i = left top x coordinate of department i LTY i = left top y coordinate of department i RTX i = right top x coordinate of department i RTY i = right top y coordinate of department i LBX i = left bottom x coordinate of department i LBY i = left bottom y coordinate of department i RBX i = right bottom x coordinate of department i
41 RBY i = right bottom y coordinate of department i 41 a = number of bays within the facility c = index of bay (1,2,, a) h c = number of departments in bay c g i = bay where department i is located m = maximum number of departments allowed in any bay within the facility a i = area of department i A c = area of bay c u (i,c) = 1 if department i is in bay c, 0 otherwise r i = index of candidate I/O points for department i {1,2,, (h gi +1 + h gi 1 + 2)} S i = set of candidate I/O points of department i s (i,r) = candidate I/O point r on department i p i = index of I/O points along the right side of department {3,4,, (h gi )}, excluding corners q i = index of I/O points along the left side of department {(h gi ),, (h gi +1 + h gi 1 + 2)}, excluding corners s (i,p) = I/O point p on department i s (i,q) = I/O point q on department i B c = set of horizontal aisle y coordinates in bay c, excluding facility boundaries e c = index of horizontal aisles in bay c {1,2,, (h c 1)} b cec = y coordinate of horizontal aisle e c
42 The overall objective is to minimize the cost related to the distance between 42 department I/O points and the corresponding flow as seen in equation 1. Min n n Total transportation cost = f(j, k) d(j, k) j=1 k=1 (1) 3.3 Construction Phase As stated, the given information about the facility layout and department areas are used to calculate the coordinates of each department s corners in order to optimize the I/O point location for each department and to find the corresponding aisles connecting them. The following is a detailed breakdown of the construction phase and the calculations involved. All steps are conducted on a layout found in other publications where authors have optimized the layout using various techniques and follow the flexible bay structure Department corner calculation. The initial step in the process is to determine the exact location of each department s corners in the original layout. As a byproduct, this also determines the arc lengths for all department contours within the facility, which are used in the subsequent step. It is important to note that the bottom-left corner of the facility is considered as the origin of the Cartesian coordinate system. The flexible bay layout facilitates the calculations because with department and facility sizes and layout given, the department corners can easily be extracted. Knowing each department s area in addition to the location within a bay, the corners of each bay must be calculated first. Each bay s area is the sum of all departments within the bay as seen in Equation 2. Additionally, all layouts studied have no empty
43 space within the facility or empty space is considered as an additional department, as 43 shown in Equation 3. n A c = a i u (i,c) c i=1 n a i = L W i=1 (2) (3) Since the width (vertical dimension on Figure 1.1) of each bay is equal to the width of the facility, the only unknown dimension is the length (horizontal dimension on Figure 1.1). This is the unique characteristic of the flexible bay layout in that the length changes to accommodate the area of the departments within the bay. Once the bay s corners are calculated, the same approach can be implemented to find the corners of each department within the bay. The department s length is now known along with the area, so the department s width can now be calculated to determine each corner s Cartesian coordinates. As stated, when determining department corners, each department s boundary dimensions are calculated, which will be used for distance calculations later Candidate Input/Output location calculation. The next step is to determine the optimal location for the I/O point of each department. There are many tasks involved in this step. First it is important to identify the potential I/O locations. With the assumption that all I/O s will be at department intersections, this phase is straightforward. Each department has a potential location at each of its four corners and at any additional intersections that lie on its boundaries. This calculation is shown in equations 4 through 7, which determine the set, Si, of potential I/O points for each department. Equations 4

, s (i,2) S i (4) If h gi +1 > 1 s (i,p) S i p RBY i < b (gi +1,p 2) < RTY i (5) s (i,hc+1 +2), s (i,hc+1 +3) S i (6) If h gi 1 > 1 s (i,q) S")
44 44 and 6 correspond to the corners of the department, which are always candidate I/O points while equations 5 and 7 correspond to potential locations along the right and left sides of the department respectively. The coordinates of each of these potential locations are already calculated in the first step since they all are at departmental corners. s (i,1), s (i,2) S i (4) If h gi +1 > 1 s (i,p) S i p RBY i < b (gi +1,p 2) < RTY i (5) s (i,hc+1 +2), s (i,hc+1 +3) S i (6) If h gi 1 > 1 s (i,q) S i q LBY i < b (gi 1,[h gi +1+h gi 1+3 q]) (7) < LTY i Figure 3.1: Candidate I/O point numbering
45 45 It can be seen from Figure 3.1 that the numbering of candidate I/O points begins in the upper left corner of the department with 1 and continues clockwise with each successive integer. The corners s (i,1), s (i,2), s (i,hc+1 +2), s (i,hc+1 +3) are always elements of set Si, as shown in equations 4 and 6, which are 1, 2, 4, and 5, respectively, in this example. For the right side of the department, it can be seen that h gi +1 > 1, so equation 5 must be applied. By applying this equation, the node on the boundary of department i corresponding to the second horizontal aisle in bay c+1, labeled as 3, is chosen as the first and only candidate I/O point chosen on the right side of the department because its y- coordinate falls between the top and bottom of department i. Likewise, candidate I/O points 6 and 7 are chosen using equation 7 because h gi 1 > 1 and there are 2 horizontal aisles in this bay whose y-coordinates are between the top and bottom of the department. It is important to note that due to the clockwise labeling technique, the candidate I/O points along the left side of the department are labeled from the bottom up Distance between Input/Output points calculation and optimization. The all-pairs shortest path algorithm is a well-known algorithm that efficiently calculates the shortest path between nodes, which in this case corresponds to potential I/O locations (Ahuja, Magnanti, & Orlin, 1993). It is an implementation of the famous Dijkstra s algorithm that repeats, varying the source node, or starting point, for each of the nodes on the network (Ahuja et al., 1993). This allows for each potential I/O point to be applied to the algorithm to find its distance and shortest path to all other nodes on the network. In this study, an open-source Java implementation of Dijktra s algorithm was adapted and used for all shortest path calculations ( Dijkstra algorithm, n.d.). A list of all arc lengths on the network must be created first. This is a table that contains the
46 distance between all connected nodes within the facility, which is calculated using the 46 coordinates of each node that were found as described in section Equation 8 is used for this calculation to find the Euclidean distance between any two points. Euclidean distance is implemented because all connected nodes within the facility have a potential aisle that runs directly between them, which differs from the measurement technique used to measure between departments which is contour distance. arc distance (1,2) = (x 2 x 1 ) 2 + (y 2 y 1 ) 2 (8) Not only does this table indicate the distances between nodes, but also which nodes in the network are directly connected. This table is then input into the program, running the algorithm with each node as the source node iteratively. It is important to note that the network studied here is undirected, meaning the flow on each arc can occur in both directions. This is to not limit the direction of flow within the facility. The results from this repetition of the algorithm allow for the creation of a table containing the shortest distance between each pair of nodes. This can then be used as the reference list when optimizing for the minimum total travel distance within the facility. Microsoft Excel Solver was used to obtain the optimal I/O point for each department. With the variables as the I/O point of each department, there were the following constraints on the problem when finding the minimum total travel distance: the I/O point must be an integer between 1 and [h gi +1 + h gi 1 + 2] due to the labeling of these locations as seen in Figure 3.1 and equation 9 only feasible I/O points are potential candidates indicated by a binary variable all variables are positive
47 The results from Solver allow for the selection of the optimal I/O point for each 47 department within the facility to minimize the objective function (equation 1). 1 < r i < (h gi +1 + h gi 1 + 2) (9) Extract aisle structure. The results from Solver indicate the optimal I/O point for each department, but do not show the aisle structure corresponding to the points. The aisle structure can easily be extracted from the shortest path algorithm. With the I/O points now set, the corresponding distances among departments with flow between them can be found in the table created by the initial step which indicates the distance between each node to all other nodes on the network. The shortest path between any two points on the network can be found using information from running the shortest path algorithm. The implementation used for this thesis indicates the last node travelled on its path to each node. Using this information, the path between nodes can be traced back node by node. If this information were not provided, the shortest path could be found by using a combination of arc lengths and shortest path distances to find the path. With this repeated for all flows within the facility, the optimal aisle structure for the given layout without rotated aisles is then complete. 3.4 Improvement Phase The next step after I/O point and aisle structure determination, and the main contribution of this thesis, is to improve the aisle structure. This is done by allowing aisles to rotate freely, without the restriction of running parallel to exterior walls. Since the I/O points and general aisle structure are now known, the decision variables are the angle of each vertical aisle that separates bays. It is important to note that the aisles
48 corresponding to the facility boundaries do not rotate so the facility shape remains 48 constant. Constraints involved in the optimization are limited to the following: aisle angles must be between 0 and 180 all departments are constrained by either the minimum side length or the minimum aspect ratio constraint indicated by the original problem description The minimum side length indicates the smallest length allowed for any side of a department, while the minimum aspect ratio is the minimum ratio between the smallest and largest of the four sides of a department. This setup allows for the optimization of the aisle structure dependent on the optimized I/O locations and initial flow paths. The following section is an explanation of the details involved in the calculation of the revised facility layout Recalculation of department coordinates. An important aspect of the improvement phase is the recalculation of coordinates for each department corner. The department shapes are not confined to the normal rectangular shape, so the calculation must adapt to trapezoidal geometries as seen in Figure 3.2. It is shown that there are four main configurations of department geometries depending on the angle of the main vertical aisles as shown in Figure 3.2 and the subsequent equations. Bays in which both main aisles are parallel to each other require separate calculations, with the same basic area calculation of width length that were shown in the construction phase.

 w =")
49 49 Figure 3.2: Trapezoidal bay/department calculations z = (x coordinate of rightmost point on left side of bay) (x coordinate of leftmost point on right side of bay) w = width of the topmost department within bay W = width of the facility
50 50 If θ 1 < 90 l 1 = W W else l tan θ 1 = 0 (10) If θ 2 > 90 l 3 = 1 tan(180 θ 2 ) else l 3 = 0 (12) W If θ 1 > 90 l 2 = tan(180 θ 1 ) else l 2 = 0 (11) If θ 2 < 90 l 4 = W tan θ 2 else l 4 = 0 (13) If θ 1 < 90 v 1 = w W w else v tan θ 1 = 0 (14) If θ 2 > 90 v 4 = l 3 v 5 = 1 tan(180 θ 2 ) else v 4 = 0 (17) W w If θ 1 < 90 v 2 = l 1 v 1 = else v tan θ 2 = 0 (15) If θ 2 > 90 v 5 = 1 w tan(180 θ 2 ) else v 5 = 0 (18) w If θ 1 > 90 v 3 = tan(180 θ 1 ) else v 3 = v 2 (16) If θ 2 > 90 v 6 = w else v tan θ 6 = v 4 (19) 2 α = index of l & v values 4 z = a c W 1 2 [ l α] (20) α=1 w = a top department 6 [ α=1 v α 2 + z] (21) Similar to the initial corner calculation, the bay s corners must be calculated first. The bay s width and area are known, which allows for the calculation of the bay s top and bottom lengths corresponding to the l and z values in Figure 3.2. With the dimension of the bays now calculated using equations 10 through 13 and equation 20, the coordinates of the bay corners can then be extracted. Finally, the calculation which determines the individual department dimensions can be determined with equation 21 and intermediate calculations of equations 14 through 19. Once again, knowing the dimensions of the department allows for the coordinates of the department corners to be extracted. Additionally, if there are more than two departments within the bay, this sequence of finding the bay dimensions then the top department s dimensions must be

51 51 repeated iteratively within the bay, dropping the top department from consideration once its coordinates are determined, until all department dimensions are found. An important design restriction implemented in the rotation of the aisles was that the z value must remain positive. This was decided not only to keep the formulation simple, but because of the likelihood that departments with a negative value for z would violate the aspect ratio constraints on department shapes. With a negative z value, as shown in Figure 3.3, the bay shape would be an extreme geometry translating to extreme department geometries which are undesirable. Figure 3.3: Bay shape with negative z-value Alternate aisle rotation. Up to this point, the focus has been on rotating the vertical main aisles that separate the bays in the facility. This was simply because this is the most straightforward approach since these aisles are the most consistent within the facility. This is not a requirement for this methodology, however. The same approach can be applied to rotating the secondary horizontal aisles instead. The only change that needs to be made is in the way the dimensions of the individual departments are calculated. The approach is identical with the exception that now the bay lengths are constant and the trapezoidal shapes are rotated with respect to the vertical aisle rotation calculations as
52 52 seen in Figure 3.4. It can be seen that the same four potential shapes are now possible, so the calculation procedure remains similar. Figure 3.4: Trapezoidal shapes with horizontal aisle rotations Recalculation of distances between Input/Output points. This step is fairly simple since the I/O points of each department and the travel paths are set, so the Euclidean distance between any arc on the travel path can be calculated using Equation 8. The coordinates of the corresponding arc endpoints were calculated previously, allowing for direct input to the equation. With the new optimal aisle angles determined, the optimization of the I/O location and aisle structure can be recalculated accordingly, to determine if any additional improvements in the path are possible. The same procedure from and is followed with the aisle rotation now set.
53 53 It was found during testing that this sequence of steps was effective. The problem of determining optimal I/O points and aisle structure when allowing for rotated aisles is too computationally intensive, so it must be divided into individual problems. Initial testing with the VC10 problem showed that varying the aisle angles prior to setting the I/O points and aisle structure had little effect on the overall structure of the aisles. The I/O points and aisle structure tended to stay nearly the same regardless of how the aisles were rotated in the initial testing. Figure 3.5 shows the results from the initial testing of the VC10 problem allowing for various rotations of the vertical main aisles to determine their effect on the I/O points for each department and the corresponding aisle layout. This was simply testing predetermined rotational patterns, not optimization. Figure 3.5 shows only layouts b and h have a different general aisle structure than the original layout. This led to the simplification of the methodology to only determine the I/O points and travel paths prior to finding the optimal aisle rotations. Table 3.1 corresponds to Figure 3.5 and shows the cost for each given layout. The two cheapest layouts, f and d, follow the exact same aisle structure as the original layout, a. This demonstrates the idea of using the initial aisle layout for all future optimizations because it can provide for a low overall transportation cost without hindering the results. Furthermore, the most expensive layout shown, b, is one of the two layouts which deviate most from the original aisle structure and is about 19% more expensive than the original. The other layout which has a significantly different layout than the original layout is layout h, which does not have a major difference in cost from the original. However, it is clear that regardless of the aisle rotations, the original aisle structure is the most prevalent and provides the two lowest transportation costs.


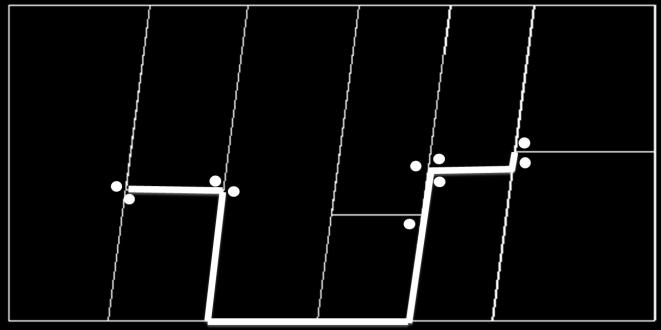
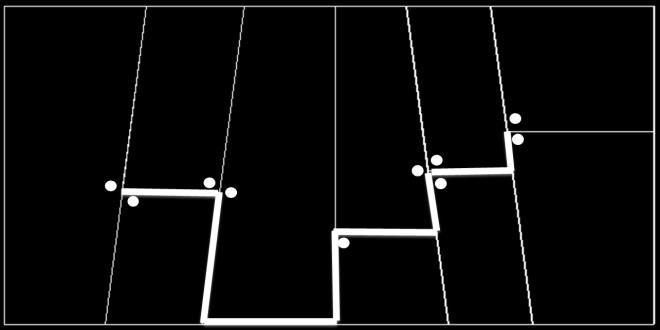
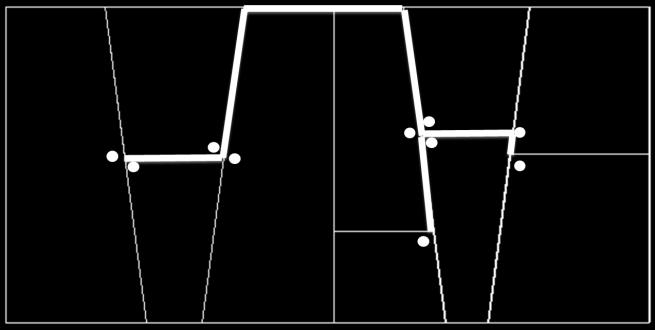
54 54 a b c d e f g h i Figure 3.5: Aisle structure generalization
55 Table 3.1: Cost of aisle layouts 55 Layout Total Transportation Cost Percent Difference from Original a $7, % b $8, % c $7, % d $6, % e $7, % f $6, % g $7, % h $7, % i $7, % 3.5 Feasibility of New Department Geometries A major concern with rotating the aisles is having undesirable aisle angles and department shapes. One reason for this concern is the adaptability of the layout within each department. This is stated in the assumptions of this methodology that this is ignored during construction. This idea is addressed, however, by a minimum aspect ratio constraint or minimum side length constraint. This is used commonly in facility layout problems to maintain usable department geometries. It can be seen from Figure 3.6 that even though layout within the departments is being ignored, it is feasible that equipment configuration can adapt to the new geometries after aisle rotation. Figure 3.6 shows one example of a rectangular floor space being changed to a trapezoidal floor space, while the department area and machine dimensions remain constant. It can be seen that the new flow within the department remains similar and there is adequate floor space for the required equipment.

56 56 Figure 3.6: Example of department layout adapting to new geometry Another reason for this concern is that rotating the aisles can cause departments to have unusable floor space due to acute angles as shown in Figure 3.7. Additionally, extreme aisle angles could cause increased travel time, not due to an increase in distance, but rather a slowing in the transportation speed. This is because transportation vehicles would have to further slow down for a turn if the angle was extremely acute like Figure 3.7. Extreme angles could also cause safety concerns due to the difficulty of seeing traffic on the cross-aisles. Figure 3.7: Example of an acute aisle angle
57 In order to make the layouts more adaptable and desirable to a manufacturer, a 57 penalty function that would prevent the methodology from overly reducing the usable floor space within a facility. The purpose of the penalty function is to add cost to the objective function (equation 1) when floor space is lost. This can be seen in the revised objective function in equation 22. The penalty function is simply the total area of lost floor space within the facility multiplied by a cost per unit area. This additional cost added to the objective function will prevent layouts from excessively reducing the usable floor space during the optimization process. As an additional side effect, preventing the layouts from reducing usable floor space also will prevent the aisle structure from having overly sharp turns. This, in turn, avoids safety and travel rate concerns. n n n Min Total transportation cost = f(j, k) d(j, k) + δ i β Where: j=1 k=1 i=1 (22) δ i = unusable floor space for department i β = cost per unit area floor space It can be seen by Figure 3.8 and accompanying equations that the lost floor space for each department is dependent on the department s shape. Additionally, it can be seen from Figure 3.8 that the locations where floor space is lost are where there are acute angles at the department s corners. It is also shown that the area lost for each department is largely dependent on the λ value, which is the minimum width in which an item can fit into the corner of the department. This value would be determined by the manufacturer, and would be directly related to the items that must fit within the departments.
58 58 Figure 3.8: Unusable floor space examples λ = minimum width in which an item can fit into corner of department If θ 1 > 90 & θ 2 < 90 If θ 1 > 90 & θ 2 > 90 δ = λ 2 2tan(180 θ 1 ) λ2 + λ2 2tanθ 2 λ2 (23) δ = + (25) 2tanθ 1 2tanθ 2 If θ 1 < 90 & θ 2 > 90 If θ 1 < 90 & θ 2 < 90 = λ2 δ = δ λ 2 + 2tanθ 1 2tan(180 θ 2 ) λ 2 2tan(180 θ 1 ) + λ 2 2tan(180 θ 2 ) (24) (26) It can be seen that there are two variables involved in this penalty function, λ & β, which would require direct input from a manufacturer to determine a sufficient value. β is a straightforward variable as it is the cost per unit area of floor space. λ, on the other hand, would have to be determined either on a department-by-department basis or for the facility as a whole as it is based on the items within the departments.
59 4 Results 59 This chapter is a compilation of all testing results completed using the methodology described in the prior chapter. There were two main tests completed which were based on different orientations of aisle rotation. The first test was to allow the vertical aisles between the bays to rotate, while the horizontal aisles between departments remained unchanged. The second test was to rotate the horizontal aisles between departments while the vertical aisles between bays remained constant. These tests were conducted on three commonly studied problems: the van Camp 10 department problem (VC10) (van Camp et al., 1992), the Bazaraa 14 department problem (B14) (Bazaraa, 1975), and the Armour & Buffa 20 department problem (AB20) (Armour & Buffa, 1963). The layouts used for these problems were taken from other publications which used various techniques to optimize the design and are cited in their following problem descriptions. The objective of this thesis is to improve upon a given layout. Direct comparison was not possible for the selected layouts because of the distance metric used; therefore it was also necessary to create results for a comparable situation in addition to improving the layout. This was simple since the developed methodology already created the optimal layout for aisles and I/O points during the construction phase. Therefore, the optimal layout with rotated aisles for each problem can be directly compared to the optimal of the final layout from the construction phase.
60 4.1 Test 1: Vertical Aisle Rotation 60 The focus of Test 1 is to rotate the vertical main aisles that run between the bays while the secondary horizontal aisles remain unchanged. Test 1 was completed on the VC10, B14, and AB20 problems van Camp 10 department problem. As shown in Chapter 3, the initial testing was completed on the van Camp 10 department problem (VC10). Specifically, Tate and Smith s (1995) layout of the VC10 department problem was used for the initial setup because of their implementation of flexible bay layout on the problem. Tate and Smith only looked at optimizing the layout to reduce total travel distance, which in their case was distance between department centroids. On the other hand, the methodology developed in this thesis uses I/O points on the department boundaries and contour distance measurements between departments. For this reason, Tate and Smith s layout was the only aspect used in this thesis and direct comparison of their results was not possible. Figure 4.1 shows a comparison of the optimal design from the construction phase and the optimal layout with rotated aisles after the improvement phase has been applied. Each department s I/O point is shown with a dot, while the selected aisle structure connecting these I/O points is shown by the bold lines.
.")

61 Original Cost: $7,166 Rotated Aisle Cost: $5, Figure 4.1: VC10 vertical aisle rotation results Figure 4.1 shows the total transportation cost has been reduced by about 21% for the VC10 problem. The rotated layout remains compliant with minimum side length constraint of 1 meter as used by Tate and Smith (1995). It is shown that the methodology has successfully reduced transportation distances while leaving the relative locations of the departments within the facility and flow paths constant. The general trend of flow for the original layout was through the bottom of the facility. The rotated layout follows this same trend, but is able to reduce the overall transportation cost by allowing for the aisles to angle towards the middle-bottom of the facility, providing more direct routes. Table 4.1 shows the angle at which each of the aisles between bays is rotated. The angles are measured from the bottom of the facility to the left of the vertical aisle. Table 4.1: VC10 optimal vertical aisle rotations Aisle Number Angle ( )
 article. The layout contains 14 departments which follow the flexible bay structure.")
62 Bazaraa 14 department problem. The B14 problem was very similar to the VC10 problem in that an optimal department layout was taken from a different publication, specifically Konak et al. s (2006) article. The layout contains 14 departments which follow the flexible bay structure. One unique aspect of this problem is that one department, department 14, is empty space and has no flow interaction with the other departments, and consequently has no I/O point. Other than that, the problem was approached in the same way as the VC10 problem where the final improvements are compared to the results from the construction phase because Konak et al. used centroidto-centroid distances rather than contour distances among I/O points. Figure 4.2 shows a comparison of the layouts for the B14 problem. Original Cost: $4,718 Rotated Aisle Cost: $4,256 Figure 4.2: B14 vertical aisle rotation results The rotated layout shown in Figure 4.2 remains compliant with the minimum side length constraint of one unit length as used by Konak et al. (2006). The overall
63 63 transportation cost was reduced by about 10%. The majority of flow in this layout was through the top of the facility due to the optimal placements for the I/O points, which is why the aisles have angled towards the top-middle of the facility in order to provide for more direct routes of flow. The individual aisle angles are provided in Table 4.2. Table 4.2: B14 optimal vertical aisle rotations Aisle Number Angle ( ) Armour & Buffa 20 department problem. The largest problem tested had 20 departments. The department layout used was from Kulturel-Konak & Konak (2011) which followed the flexible bay structure. The selected layout followed a maximum aspect ratio of 3, which was also used in the optimization of the aisle rotations. Figure 4.3 shows the original layout and the optimized layout for Test 1 of the AB20 problem.


64 Original Cost: $3,484 Rotated Aisle Cost: $3, Figure 4.3: AB20 vertical aisle rotation results Figure 4.3 shows a reduction in the total transportation cost of about 5.6%. This problem s optimized aisle structure was unique in that the majority of the flow was not through the top or bottom of the department. Instead, the flow was concentrated mostly through the center of the facility. This caused the vertical aisles to alternate rotations in order to bring the secondary horizontal aisles closer to one another. It can be seen in Figure 4.3 that the optimal aisle structure has more consistent horizontal aisles that travel through multiple bays compared to the shorter, less-consistent horizontal aisles of the original layout. This, in turn, brought the I/O points of departments closer to each other which lowered the transportation cost. This is similar to the findings of Alogoz et al (2008), that horizontal aisles should be selected for travel if they are close in relation to the adjacent bay s horizontal aisles. The individual aisle angles are shown in Table 4.3.

65 Table 4.3: AB20 optimal vertical aisle rotations 65 Aisle Number Angle ( ) Test 2: Horizontal Aisle Rotation The focus of Test 2 was to rotate the horizontal secondary aisles that run between the individual departments while the vertical main aisles remain unchanged. Test 2 was completed on the VC10, B14, and AB20 problems van Camp 10 department problem. The same problem as described in section was tested again in a similar way, except the horizontal aisles were now allowed to rotate freely instead of the vertical aisles. Figure 4.4 shows a comparison of the original layout to the optimized layout. Original Cost: $7,166 Rotated Aisle Cost: $5,992 Figure 4.4: VC10 horizontal aisle rotation results
66 It is seen in Figure 4.4 that the general department locations and aisle structure 66 remain constant, but the secondary horizontal aisles were rotated to provide a more direct flow path. It can be seen that the horizontal aisles have angled towards the bottom-middle of the facility similar to that of the vertical aisle rotation results. The bold dashed line on the rotated layout indicates a change in the general aisle structure that allowed the rotated structure to further improve upon the original layout. This change in aisle structure was done after the horizontal aisle angles were optimized and the shortest path problem was rerun. The final cost after finalizing the aisle structure is shown above the rotated layout with an asterisk indicating the change in aisle structure, which brought the improvement from 12.4% to 16.4%. It is also interesting to note that the optimized aisle structure now closely resembles Gue & Meller s (2009) findings of the V shaped aisle structure. This is not to say that this would be applicable to all situations, since manufacturing facilities do not have the same flow characteristics as a unit load warehouse where all flow starts and ends at a single point. It can be concluded that the V shaped aisle structure is likely in a facility layout design similar to the VC10 problem where all flow is through either the top or bottom of the facility. The angle of each aisle is shown in Table 4.4. The aisles are indicated by bay number, and then numbered from top to bottom within the facility. The angle is measured between the vertical aisle on the left side of the bay to the top of the horizontal aisle.

67 Table 4.4: VC10 optimal horizontal aisle rotations 67 Bay Number Aisle Number Angle ( ) Bazaraa 14 department problem. The B14 problem had unique results in that the rotation of the horizontal aisles did not provide more direct routes of travel between departments as much as it simply reduced the travel distance by moving department s I/O points. This can be seen in the rotated layout in Figure 4.5, specifically departments 6 and 8. Since the flow to and from these departments is mostly through the top of the facility, the horizontal aisles rotated so that the I/O points of these departments were moved closer to the top of the facility. Original Cost: $4,718 Rotated Aisle Cost: $4,262 Figure 4.5: B14 horizontal aisle rotation results
68 68 Similar to the horizontal aisle rotation of the VC10 problem, the final run of the shortest path algorithm slightly changed the aisle structure with the amended path shown in Figure 4.5, with the dashed line and the cost shown with an asterisk. The final improvement increased from about 9.5% to about 9.7%. Table 4.5 shows the aisle angles for each horizontal aisle. Table 4.5: B14 optimal horizontal aisle rotations Bay Number Aisle Number Angle ( ) Armour & Buffa 20 department problem. The horizontal aisle rotation of the AB20 problem was similar to the vertical aisle rotation in that it provides shorter, more direct routes of travel toward the center of the facility as shown in Figure 4.6.

69 Original Cost: $3,484 Rotated Aisle Cost: $3, Figure 4.6: AB20 horizontal aisle rotation results The majority of the horizontal aisles in the rotated layout angle toward the center of the facility, which is seen in Figure 4.6. The rotation of the horizontal aisles allowed for a 5.7% reduction in total transportation cost within the facility. Table 4.6 indicates the angle of each horizontal aisle within the facility. Table 4.6: AB20 optimal horizontal aisle rotations Bay Number Aisle Number Angle ( )
70 Interpretation of Results In summary, all results from the testing of the methodology were positive. Rotating the aisles allowed for a reduction in total transportation cost for all three problems in both tests. This can be seen in Figure 4.7 which shows the percent improvement in transportation cost over the original, with the data series with diamonds indicating test 1 and the data series with squares indicating test 2. It is shown that every test was successful in reducing transportation cost, with the maximum improvement of about 21% and the minimum improvement of 5.6%. It appears there is a trend in the magnitude of reduction in transportation cost with respect to the number of departments. This translates to a possible trend of as the number of departments increase, the improvement decreases. This cannot be definitively concluded since only three problems have been tested, but it is important to note.
71 71 Figure 4.7: Number of departments vs percent improvement Another comparison can be extracted from the results when looking at the two tests, which is shown in Figure 4.8. This graph compares the percent improvement of each problem for both tests. The ten department problem was the only problem that had a significant difference between the results of the two tests, with vertical rotation being about 4.5% cheaper. The other two problems were about equivalent between the two tests, which shows no significant trend can be extracted from this comparison without more test problems. Table 4.7 summarizes all results from the three problems and two tests.

72 72 Figure 4.8: Rotation type vs percent improvement Table 4.7: Summary of results # Departments Aisle Rotation Transportation Cost Improvement 10 None $7, % 10 Vertical $5, % 10 Horizontal* $5, % 14 None $4, % 14 Vertical $4, % 14 Horizontal* $4, % 20 None $3, % 20 Vertical $3, % 20 Horizontal $3, % * Indicates the final aisle structure is not identical to the original
73 73 Some might assume that rotating the aisles would increase the overall aisle length since an angled aisle will be longer than a nonrotated aisle. This would then also lead to the assumption that rotating the aisles would reduce usable floor space since the aisles would require more area. This is not necessarily the case, as seen in Table 4.8. The aisle length is the sum of department boundary lengths that are selected for aisle travel. Table 4.8: Changes in aisle length after rotation Problem Original Aisle Length Vertical Rotation Aisle Length Change Horizontal Rotation Aisle Length Change VC % % B % % AB % % This table shows that the only increases in overall aisle length appeared in the B14 problem, and even then, only small increases were seen. The VC10 problem and the AB20 problem saw decreased aisle length after rotation, in both the vertical and horizontal aisle rotation tests. This is due to the fact that the rotated aisles provide a more Euclidean travel between departments rather than rectilinear travel, making the overall aisle length decrease. This is not only beneficial to the reduction in transportation costs, but also the offsetting effect of the lost floor space in the department areas because less area will be used by the aisles. Furthermore, if increased aisle length were an issue for a manufacturer, a cost per unit aisle length could be incorporated into the objective function similar to Alagoz et al. (2008).
74 5 Conclusion 74 This thesis was successful in creating a methodology that allows interior aisles of a facility to rotate in order to reduce transportation distance. The methodology is adaptable in order to pertain to the various unique constraints of a manufacturing facility. This chapter contains the following: a summary of the contributions of this thesis in section 5.1, implementation techniques the end users must follow in order to successfully apply the methodology in section 5.2, and finally some ideas for potential future studies that apply to the rotated aisle idea in manufacturing facility layout in section Summary of Results Contributions. Throughout the development of this thesis, much has been learned about facility layout design. The creation of the methodology which allows for rotated aisles within a facility came with many aspects that must be addressed in order to create a solvable problem. The methodology addresses these aspects with the use of assumptions and constraints which do not necessarily cause an unrealistic problem or overly simplistic problem, but rather create a very realistic problem that is not unnecessarily complicated. The largest contribution of this thesis is the methodology itself, which is innovative in the idea of allowing for interior aisles within a manufacturing facility to rotate in order to provide shorter travel distances between departments. The idea of rotated aisles has only been studied in a warehousing environment by Gue and Meller (2009); therefore this methodology is the first of its kind in manufacturing facility layout. This thesis has proven the benefits of rotating aisles in a manufacturing facility can reduce the total transportation cost. Three separate problems were studied, in two
75 75 different tests, and all showed significant reductions in transportation costs. This shows the potential benefits of rotated aisles, and that the methodology can be applied to various layouts. With a given layout, the methodology in this thesis can determine the optimal I/O points and aisle structure then reduce the transportation costs by rotating the interior aisles of the facility. With this said, the extent of the benefits are dependent on the restrictions put on the problem such as minimum aspect ratio and the penalty function values. During the development of this methodology, it was found that the general aisle structure is not significantly dependent on the rotation of the aisles as shown in Figure 3.5. This allows for the simplification of setting the selected flow paths as constant during the aisle rotation. This observation was significant as it allowed the problem to be solved without requiring metaheuristic approaches Benefits. The methodology developed in this thesis provides many potential benefits to a manufacturer. Transportation among departments within a manufacturing facility is a non-value added activity, but is necessary for production. Therefore, reducing the cost involved with this activity is extremely valuable to a company in order to maximize profits. This methodology was developed with this in mind in order to aid in the reduction of total transportation time within a facility. Following the methodology as described in this thesis allows a manufacturer to take a given flexible bay layout and determine the optimal I/O points for each department and the corresponding aisle structure connecting them. Furthermore, the methodology allows for a reduction of transportation distances by allowing either the vertical main aisles or the secondary horizontal aisles to rotate from the traditional aisle structure
76 design where the interior aisles are parallel with the exterior walls. Not only do the 76 rotated aisles provide more direct and shorter routes of travel between departments, but can also allow the I/O points of departments to be physically moved closer to one another since the departments are no longer restricted to rectangular shapes. In addition to this methodology providing shorter transportation distances among departments, it contains restrictions that prevent the department shapes and aisle structure from becoming undesirable. Similar to most facility layout problems, the methodology maintains the restriction on department geometries of either a minimum aspect ratio constraint or minimum side length constraint. This prevents the departments from having extreme geometries. Along with this constraint, the methodology incorporates its own technique of maintaining normal departmental geometries by preventing extremely skewed departments as shown in Figure 3.3. Lastly, the proposed penalty function will prevent aisles and department boundaries from having overly acute angles which can reduce the benefits of minimizing transportation distances. With this combination of constraints, this methodology should be easily adaptable to fit the unique requirements of various manufacturers. 5.2 Implementation Approach. In order for this methodology to be implemented by a manufacturer, there are a few aspects the manufacturer must know. The manufacturer must be aware of the flow matrix for the facility. This is the unit cost of flow between departments per unit distance. Additionally, the manufacturer must know the floor space requirements for each department. Having either a minimum aspect ratio constraint or minimum side length constraint is also beneficial to maintain normal department
77 77 geometries. Also, the manufacturer must know the cost per unit area of floor space and the minimum dimensions of equipment within the departments in order to implement the penalty function. Lastly, the layout of the departments within the facility must also be known prior to the implementation of this methodology. This can either be the current layout of the departments if this methodology in being used as a redesign procedure, or the layout must be constructed using the various methods of departmental layout design that follow the flexible bay structure. The latter would be used for new construction of a facility, or a complete facility redesign. Once this data is collected, the methodology can be implemented. Starting with the construction phase, the optimal I/O points and aisle structure are found. From that, the improvement phase then rotates the selected aisles, either horizontal or vertical, in order to minimize the distances between departments using the contour distance metric. This methodology will never increase the total transportation cost as long as it is implemented correctly. This is because if all possible rotations of the aisles increase total transportation, the aisles should remain unchanged Other considerations. There are some considerations a manufacturer must address when determining if this methodology is applicable in their company. Most importantly, rotating the aisles will cause a loss of floor space. If floor space is the largest concern of the manufacturer, the benefits of transportation cost reduction may not outweigh the loss of floor space. This is when the penalty function described in section 3.5 would be applicable. This penalty function, if implemented correctly, should prevent the aisles from significantly reducing the floor space.
78 78 Another consideration is the safety concerns involved with rotating the aisles. The rotated aisle could allow for acute angles on the travel paths, which are considered unsafe due to the difficulty of seeing cross traffic. This concern is mostly relieved by the penalty function preventing overly acute angles. Additionally, with an overly acute angle, there would not be much in the corner of the department to hinder sight of the cross traffic. With these facts stated, it still may be something a manufacturer would like to consider. Lastly, as stated in Gue & Meller (2009), a very large facility with rotated aisle could be disorienting to workers. Most workers are used to facilities with relatively consistent, right-angle aisles, and an inconsistent aisle structure without right-angle turns could be confusing to employees. This confusion would likely be relieved with experience and time, but should be considered if a manufacturer requires a very large facility with numerous aisles. 5.3 Future Work There are some limitations involved in the methodology developed in this thesis. The most significant limitation is that the optimization of the aisle rotations is dependent on the original layout used in the construction phase. This can limit the process and provide a sub-optimal facility layout. This was taken into consideration in the development of the methodology and decided to be acceptable since it significantly reduces the computational complexity. In order to provide further reductions in total transportation cost, it would be beneficial to incorporate some of the construction phase steps (e.g. I/O point and aisle structure location) and possibly even some of the improvement phase steps (e.g. aisle rotation) into the determination of the original layout. This would most likely require metaheuristic approaches in order to handle the increased
79 complexity. Additionally, a multiphase approach similar to the one described in this 79 thesis would be beneficial in order to reduce the complexity of solving multiple design aspects simultaneously. Another possible extension of this thesis would be to allow any aisle within the facility to rotate during the optimization instead of limiting the rotation to be either vertical or horizontal aisles. This can significantly increase the difficulty of optimization due to the complex departmental geometries and would likely require some new assumptions and constraints to make the problem feasible. Again, this could be broken into phases in order to make the objective feasible. It could be greatly beneficial to allow both horizontal and vertical aisles to rotate simultaneously because it could produce more direct flowpaths between departments and could also prevent short and inconsistent aisles from forming due to the optimization. Some post-processing techniques could also be beneficial to the methodology. For example, once the optimal aisle rotations have been determined, further improvement to the department geometries could be studied to normalize the shapes closer to typical rectangles. This would be beneficial to a manufacturer because only the travel paths selected for transportation between departments need to be rotated in order to see the majority of the benefit of aisle rotations. For example, the methodology in this thesis rotates the entire boundary between two bays when the vertical aisles are rotated. The entire portion of a bay boundary may not be selected for the travel path, therefore rotating only the travelled portion could allow for more typical department boundaries. A side effect of this will be some increasing of the transportation costs since the locations of the
80 aisles and I/O points may be affected, but this tradeoff could still be beneficial to a 80 manufacturer seeking more rectangular departments. Lastly, developing methodologies for different I/O point configurations could be beneficial to manufacturers. For example, a requirement of a company could be that the departments must have one input point and one output point on opposite sides of the department. This would not be able to be directly implemented into the methodology in this thesis and would require adaptation to accept this type of constraint.
81 References 81 Aiello, G. G., Enea, M. M., & Galante, G. G. (2002). An integrated approach to the facilities and material handling system design. International Journal Of Production Research, 40(15), doi: / Alagoz, O., Norman, B. A., & Smith, A. E. (2008). Determining aisle structures for facility designs using a hierarchy of algorithms. IIE Transactions, 40(11), doi: / Ahuja, R. K., Magnanti, T. L., & Orlin, J. B. (1993). Network flows : theory, algorithms, and applications / Ravindra K. Ahuja, Thomas L. Magnanti, James B. Orlin. Englewood Cliffs, N.J. : Prentice Hall, c1993. Armour, G. C., & Buffa, E. S. (1963). A heuristic algorithm and simulation approach to relative location of facilities. Management Science, 9(2), Bazaraa, M. S. (1975) Computerized layout design: a branch and bound approach. AIlE Transactions, 7, Chittratanawat, S. S., & Noble, J. S. (1999). An integrated approach for facility layout, P/D location and material handling system design. International Journal Of Production Research, 37(3), 683. Davoudpour, H., Jaafari, A., & Farahani, L. (2010). Facility Layout Problems Using Bays: A Survey. AIP Conference Proceedings, 1247(1), doi: / Dijkstra algorithm. (n.d.). Retrieved January 14, 2014, from
82 82 Drira, A., Pierreval, H., & Hajri-Gabouj, S. (2007). Facility layout problems: A survey. Annual Reviews In Control, 31(2), doi: /j.arcontrol Gómez, A. A., Fernández, Q. I., De la Fuente García, D. D., & García, P. J. (2003). Using genetic algorithms to resolve layout problems in facilities where there are aisles. International Journal Of Production Economics, 84(3), 271. doi: /s (02) Gue, K. R., & Meller, R. D. (2009). Aisle configurations for unit-load warehouses. IIE Transactions, 41(3), doi: / Kim, J. G., & Kim, Y. D. (1999). A branch and bound algorithm for locating input and output points of departments on the block layout. Journal Of The Operational Research Society, (5), 517. Kim, J., & Kim, Y. (2000). Layout planning for facilities with fixed shapes and input and output points. International Journal Of Production Research, 38(18), doi: / Kim, J. G., & Goetschalckx, M. M. (2005). An integrated approach for the concurrent determination of the block layout and the input and output point locations based on the contour distance. International Journal Of Production Research, 43(10), doi: / Konak, A., Kulturel-Konak, S., Norman, B. A.,, & Smith, A. E. (2006). A new mixed integer programming formulation for facility layout design using flexible bays. Operations Research Letters, 34(6), doi: /j.orl
83 83 Kulturel-Konak, S. (2012). A linear programming embedded probabilistic tabu search for the unequal-area facility layout problem with flexible bays. European Journal Of Operational Research, 223(3), doi: /j.ejor Kulturel-Konak, S., & Konak, A. (2011). Unequal area flexible bay facility layout using ant colony optimisation.international Journal Of Production Research, 49(7), doi: / Norman, B. A., Arapoglu, R., & Smith, A. E. (2001). Integrated facilities design using a contour distance metric. IIE Transactions, 33(4), 337. Lee, M., Kim, J., & Kim, Y. (2009). Linear programming and Lagrangian relaxation heuristics for designing a material flow network on a block layout. International Journal Of Production Research, 47(18), doi: / Leno, I., Sankar, S., Raj, M., & Ponnambalam, S. (2013). An elitist strategy genetic algorithm for integrated layout design. International Journal Of Advanced Manufacturing Technology, 66(9-12), Rawabdeh, I., & Tahboub, K. (2006). A new heuristic approach for a computer-aided facility layout. Journal Of Manufacturing Technology Management, (7), 962. doi: / Tate, D. M., & Smith, A. E. (1995). Unequal-area facility layout by generic search. IIE Transactions, (4), 465. Tompkins, J. A., White, J. A., Bozer, Y. A., & Tanchoco, J.M. A. (2010). Facilities planning (4th ed.). Hoboken, NJ: John Wiley & Sons.
84 van Camp, D. J., Carter, M. W., & Vannelli, A. (1992). A nonlinear optimization 84 approach for solving facility layout problems. European Journal Of Operational Research, 57(2), Wu, Y. E. (2002). The optimisation of block layout and aisle structure by a genetic algorithm. Computers & Industrial Engineering, 41(4), 371. Wu, Y. Y., & Appleton, E. E. (2002). Integrated design of the block layout and aisle structure by simulated annealing. International Journal Of Production Research, 40(10), doi: / Ye, M. M., & Zhou, G. G. (2007). A local genetic approach to multi-objective, facility layout problems with fixed aisles. International Journal Of Production Research, (22), doi: /
85 Appendix: Problem Flow Matrices and Department Areas 85 VC10 Problem Table A.1: VC10 flow matrix From\To Cost of Flow Table A.2: VC10 department areas Department Area (m 2 ) A T 1275
86 B14 Problem 86 Table A.3: B14 flow matrix From\To Table A.4: B14 department areas Department Area (units 2 ) A T 63
87 AB20 Problem 87 Table A.5: AB20 flow matrix From\To
88 Table A.6: AB20 department areas 88 Department Area (ft 2 ) A T 60000

89 !!!!!!!!!!!!!!!!!!!!!!!!!!!!!!!!!!!!!!!! Thesis and Dissertation Services!
Genetic Algorithm for Designing a Convenient Facility Layout for a Circular Flow Path
 Genetic Algorithm for Designing a Convenient Facility Layout for a Circular Flow Path Hossein Jahandideh, Ardavan Asef-Vaziri, Mohammad Modarres Abstract In this paper, we present a heuristic for designing
A Genetic Algorithm for Order Picking in Automated Storage and Retrieval Systems with Multiple Stock Locations
 IEMS Vol. 4, No. 2, pp. 36-44, December 25. A Genetic Algorithm for Order Picing in Automated Storage and Retrieval Systems with Multiple Stoc Locations Yaghoub Khojasteh Ghamari Graduate School of Systems
Integrating Block Layout Design and Location of Input and Output Points in Facility Layout Problems
 Integrating Block Layout Design and Location of Input and Output Points in Facility Layout Problems Ashok Srinivasan A Thesis in the Department of Mechanical and Industrial Engineering Presented in Partial
CHAPTER 1 INTRODUCTION
 1 CHAPTER 1 INTRODUCTION 1.1 FACILITY LAYOUT DESIGN Layout design is nothing but the systematic arrangement of physical facilities such as production machines, equipments, tools, furniture etc. A plant
Routing order pickers in a warehouse with a middle aisle
 Routing order pickers in a warehouse with a middle aisle Kees Jan Roodbergen and René de Koster Rotterdam School of Management, Erasmus University Rotterdam, P.O. box 1738, 3000 DR Rotterdam, The Netherlands
Chapter 2. 2 Literature review
 2 Literature review Chapter 2 This chapter discuss about findings from the literature review. The literature review is focused on layout planning methods, efficiency improvement in layout planning special
Metaheuristics. Approximate. Metaheuristics used for. Math programming LP, IP, NLP, DP. Heuristics
 Metaheuristics Meta Greek word for upper level methods Heuristics Greek word heuriskein art of discovering new strategies to solve problems. Exact and Approximate methods Exact Math programming LP, IP,
A Methodology to Incorporate Multiple Cross Aisles in a Non-Traditional Warehouse Layout. A thesis presented to. the faculty of
 A Methodology to Incorporate Multiple Cross Aisles in a Non-Traditional Warehouse Layout A thesis presented to the faculty of the Russ College of Engineering and Technology of Ohio University In partial
Evolutionary Algorithms
 Evolutionary Algorithms Evolutionary Algorithms What is Evolutionary Algorithms (EAs)? Evolutionary algorithms are iterative and stochastic search methods that mimic the natural biological evolution and/or
AN INTEGRATED MODEL OF STORAGE AND ORDER-PICKING AREA LAYOUT DESIGN
 AN INTEGRATED MODEL OF STORAGE AND ORDER-PICKING AREA LAYOUT DESIGN Goran DUKIC 1, Tihomir OPETUK 1, Tone LERHER 2 1 University of Zagreb, Faculty of Mechanical Engineering and Naval Architecture Ivana
The order picking problem in fishbone aisle warehouses
 The order picking problem in fishbone aisle warehouses Melih Çelik H. Milton Stewart School of Industrial and Systems Engineering, Georgia Institute of Technology, 30332 Atlanta, USA Haldun Süral Industrial
Dynamic Facility Layout Problems: A Survey
 Dynamic Facility Layout Problems: A Survey Rahul A. Lad 1 M. E. Mechanical (Production) Pursuing, R.I.T., Sakharale, Maharashtra, India Dr. M. T. Telsang 2 Professor, Mechanical Engineering, R.I.T., Sakharale,
Rehandling Strategies for Container Retrieval
 Rehandling Strategies for Container Retrieval Tonguç Ünlüyurt and Cenk Aydin Sabanci University, Faculty of Engineering and Natural Sciences e-mail: tonguc@sabanciuniv.edu 1 Introduction In this work,
Introduction to Artificial Intelligence. Prof. Inkyu Moon Dept. of Robotics Engineering, DGIST
 Introduction to Artificial Intelligence Prof. Inkyu Moon Dept. of Robotics Engineering, DGIST Chapter 9 Evolutionary Computation Introduction Intelligence can be defined as the capability of a system to
Locating Input and Output Points in Facilities Design A Comparison of Constructive, Evolutionary, and Exact Methods
 192 IEEE TRANSACTIONS ON EVOLUTIONARY COMPUTATION, VOL. 5, NO. 3, JUNE 2001 Locating Input and Output Points in Facilities Design A Comparison of Constructive, Evolutionary, and Exact Methods Rifat Aykut
Simulation based Performance Analysis of an End-of-Aisle Automated Storage and Retrieval System
 Simulation based Performance Analysis of an End-of-Aisle Automated Storage and Retrieval System Behnam Bahrami, El-Houssaine Aghezzaf and Veronique Limère Department of Industrial Management, Ghent University,
How to load a ferry: a comparison of packing algorithms for the vehicle ferry industry
 How to load a ferry: a comparison of packing algorithms for the vehicle ferry industry C. Bayliss, A. Martinez-Sykora, C. Currie, M. So, J.A. Bennell ICCL Southampton October 2017 This work was funded
University Question Paper Two Marks
 University Question Paper Two Marks 1. List the application of Operations Research in functional areas of management. Answer: Finance, Budgeting and Investment Marketing Physical distribution Purchasing,
TIMETABLING EXPERIMENTS USING GENETIC ALGORITHMS. Liviu Lalescu, Costin Badica
 TIMETABLING EXPERIMENTS USING GENETIC ALGORITHMS Liviu Lalescu, Costin Badica University of Craiova, Faculty of Control, Computers and Electronics Software Engineering Department, str.tehnicii, 5, Craiova,
CHAPTER 3 FLOW, SPACE, AND ACTIVITY RELATIONSHIPS. In determining the requirement of a facility, three important consideration are: Flow
 1 CHAPTER 3 FLOW, SPACE, AND ACTIVITY RELATIONSHIPS Asst.Prof.Dr.BusabaPhruksaphanrat IE333 Industrial Plant Design Introduction 2 In determining the requirement of a facility, three important consideration
We are IntechOpen, the world s leading publisher of Open Access books Built by scientists, for scientists. International authors and editors
 We are IntechOpen, the world s leading publisher of Open Access books Built by scientists, for scientists 3,500 108,000 1.7 M Open access books available International authors and editors Downloads Our
PARALLEL LINE AND MACHINE JOB SCHEDULING USING GENETIC ALGORITHM
 PARALLEL LINE AND MACHINE JOB SCHEDULING USING GENETIC ALGORITHM Dr.V.Selvi Assistant Professor, Department of Computer Science Mother Teresa women s University Kodaikanal. Tamilnadu,India. Abstract -
College of information technology Department of software
 University of Babylon Undergraduate: third class College of information technology Department of software Subj.: Application of AI lecture notes/2011-2012 ***************************************************************************
Modelling Load Retrievals in Puzzle-based Storage Systems
 Modelling Load Retrievals in Puzzle-based Storage Systems Masoud Mirzaei a, Nima Zaerpour b, René de Koster a a Rotterdam School of Management, Erasmus University, the Netherlands b Faculty of Economics
OPERATIONAL-LEVEL OPTIMIZATION OF INBOUND INTRALOGISTICS. Yeiram Martínez Industrial Engineering, University of Puerto Rico Mayagüez
 OPERATIONAL-LEVEL OPTIMIZATION OF INBOUND INTRALOGISTICS Yeiram Martínez Industrial Engineering, University of Puerto Rico Mayagüez Héctor J. Carlo, Ph.D. Industrial Engineering, University of Puerto Rico
Impressum ( 5 TMG) Herausgeber: Fakultät für Wirtschaftswissenschaft Der Dekan. Verantwortlich für diese Ausgabe:
 Herausgeber: Fakultät für Wirtschaftswissenschaft Der Dekan. Verantwortlich für diese Ausgabe:") WORKING PAPER SERIES Impressum ( 5 TMG) Herausgeber: Otto-von-Guericke-Universität Magdeburg Fakultät für Wirtschaftswissenschaft Der Dekan Verantwortlich für diese Ausgabe: Otto-von-Guericke-Universität
WORKING PAPER SERIES Impressum ( 5 TMG) Herausgeber: Otto-von-Guericke-Universität Magdeburg Fakultät für Wirtschaftswissenschaft Der Dekan Verantwortlich für diese Ausgabe: Otto-von-Guericke-Universität
Generational and steady state genetic algorithms for generator maintenance scheduling problems
 Generational and steady state genetic algorithms for generator maintenance scheduling problems Item Type Conference paper Authors Dahal, Keshav P.; McDonald, J.R. Citation Dahal, K. P. and McDonald, J.
Intelligent Techniques Lesson 4 (Examples about Genetic Algorithm)
") Intelligent Techniques Lesson 4 (Examples about Genetic Algorithm) Numerical Example A simple example will help us to understand how a GA works. Let us find the maximum value of the function (15x - x 2
Intelligent Techniques Lesson 4 (Examples about Genetic Algorithm) Numerical Example A simple example will help us to understand how a GA works. Let us find the maximum value of the function (15x - x 2
RELAYOUT OF A MANUFACTURING FACILITY WITH SAFETY CONSIDERATIONS. Shamaya Morris
 RELAYOUT OF A MANUFACTURING FACILITY WITH SAFETY CONSIDERATIONS Shamaya Morris Problem Report submitted to the Benjamin M. Statler College of Engineering and Mineral Resources at West Virginia University
COMPARING ALTERNATIVE PLANT LAYOUTS BASED ON CRAFT AND BLOCPLAN ALGORITHMS
 COMPARING ALTERNATIVE PLANT LAYOUTS BASED ON CRAFT AND BLOCPLAN ALGORITHMS Leonardo 1, Hotma Antoni Hutahaean 2, Hui-Ming Wee 3 1,2 Department of Industrial Engineering, Atma Jaya Catholic University of
Flexible and Reconfigurable Layouts in Complex Manufacturing Systems
 Flexible and Reconfigurable Layouts in lex Manufacturing Systems Maria Manuela Azevedo 1,2,*, José António Crispim 2,3, and Jorge Pinho de Sousa 1,2 1 Faculty of Engineering, University of Porto, Porto,
Robust Integration of Acceleration and Deceleration Processes into the Time Window Routing Method
 Robust Integration of Acceleration and Deceleration Processes into the Time Window Routing Method Thomas Lienert, M.Sc., Technical University of Munich, Chair for Materials Handling, Material Flow, Logistics,
A Solution Approach for the Joint Order Batching and Picker Routing Problem in Manual Order Picking Systems
 A Solution Approach for the Joint Order Batching and Picker Routing Problem in Manual Order Picking Systems André Scholz Gerhard Wäscher Otto-von-Guericke University Magdeburg, Germany Faculty of Economics
Aisle Configurations for Unit-Load Warehouses
 Aisle Configurations for Unit-Load Warehouses Kevin R. Gue Department of Industrial & Systems Engineering Auburn University Auburn, Alabama 36849 kevin.gue@auburn.edu Russell D. Meller Department of Industrial
Production Facility Optimization Prepared By:
 Production Facility Optimization Prepared By: Maxine Cunningham John Schmidt Jonathan Braams 4/9/2009 Table of Contents Executive Summary... 3 Problem... 4 Problem Breakdown... 4 1) Determining Demand
Ant Colony Optimization for Road Modifications
 Ant Colony Optimization for Road Modifications Storm Beck 1 and John Sessions 2 Abstract Non-conventional products provide opportunities for the forest industry to increase economic value from forests;
A Genetic Algorithm on Inventory Routing Problem
 A Genetic Algorithm on Inventory Routing Problem Artvin Çoruh University e-mail: nevin.aydin@gmail.com Volume 3 No 3 (2014) ISSN 2158-8708 (online) DOI 10.5195/emaj.2014.31 http://emaj.pitt.edu Abstract
DEVELOPMENT OF MULTI-OBJECTIVE SIMULATION-BASED GENETIC ALGORITHM FOR SUPPLY CHAIN CYCLIC PLANNING AND OPTIMISATION
 From the SelectedWorks of Liana Napalkova May, 2008 DEVELOPMENT OF MULTI-OBJECTIVE SIMULATION-BASED GENETIC ALGORITHM FOR SUPPLY CHAIN CYCLIC PLANNING AND OPTIMISATION Galina Merkuryeva Liana Napalkova
Use of Genetic Algorithms in Discrete Optimalization Problems
 Use of Genetic Algorithms in Discrete Optimalization Problems Alena Rybičková supervisor: Ing. Denisa Mocková PhD Faculty of Transportation Sciences Main goals: design of genetic algorithm for vehicle
Optimal Design of Laminated Composite Plates by Using Advanced Genetic Algorithm
 International Refereed Journal of Engineering and Science (IRJES) ISSN (Online) 2319-183X, (Print) 2319-1821 Volume 3, Issue 5(May 2014), PP.77-86 Optimal Design of Laminated Composite Plates by Using
Study of Optimization Assigned on Location Selection of an Automated Stereoscopic Warehouse Based on Genetic Algorithm
 Open Journal of Social Sciences, 206, 4, 52-58 Published Online July 206 in SciRes. http://www.scirp.org/journal/jss http://dx.doi.org/0.4236/jss.206.47008 Study of Optimization Assigned on Location Selection
A Simulation-based Multi-level Redundancy Allocation for a Multi-level System
 International Journal of Performability Engineering Vol., No. 4, July 205, pp. 357-367. RAMS Consultants Printed in India A Simulation-based Multi-level Redundancy Allocation for a Multi-level System YOUNG
Artificial Intelligence Breadth-First Search and Heuristic
 Artificial Intelligence Breadth-First Search and Heuristic Chung-Ang University, Jaesung Lee The original version of this content is came from MIT OCW of MIT Electrical Engineering and Computer Science
GENETIC ALGORITHMS. Narra Priyanka. K.Naga Sowjanya. Vasavi College of Engineering. Ibrahimbahg,Hyderabad.
 GENETIC ALGORITHMS Narra Priyanka K.Naga Sowjanya Vasavi College of Engineering. Ibrahimbahg,Hyderabad mynameissowji@yahoo.com priyankanarra@yahoo.com Abstract Genetic algorithms are a part of evolutionary
Getting Started with OptQuest
 Getting Started with OptQuest What OptQuest does Futura Apartments model example Portfolio Allocation model example Defining decision variables in Crystal Ball Running OptQuest Specifying decision variable
The Metaphor. Individuals living in that environment Individual s degree of adaptation to its surrounding environment
 Genetic Algorithms Sesi 14 Optimization Techniques Mathematical Programming Network Analysis Branch & Bound Simulated Annealing Tabu Search Classes of Search Techniques Calculus Base Techniqes Fibonacci
Part 1: Motivation, Basic Concepts, Algorithms
 Part 1: Motivation, Basic Concepts, Algorithms 1 Review of Biological Evolution Evolution is a long time scale process that changes a population of an organism by generating better offspring through reproduction.
General-purpose SPWA with the Class-type Skill by Genetic Algorithm
 General-purpose SPWA with the Class-type Skill by Genetic Algorithm Daiki Takano Graduate School of Engineering, Maebashi Institute of Technology Email: futsal_ido_me_jp@yahoo.co.jp Kenichi Ida Graduate
Metaheuristics for scheduling production in large-scale open-pit mines accounting for metal uncertainty - Tabu search as an example.
 Metaheuristics for scheduling production in large-scale open-pit mines accounting for metal uncertainty - Tabu search as an example Amina Lamghari COSMO Stochastic Mine Planning Laboratory! Department
International Journal of. Railway Research. Train Scheduling Problem - Phase I: A General Simulation Modeling Framework
 International Journal of Railway Research, (2014), Vol.1, No2, pp 23-30 ISSN: 236153768187 International Journal of Railway Research Train Scheduling Problem - Phase I: A General Simulation Modeling Framework
Artificial Intelligence Computational Techniques to Optimize a Multi Objective Oriented Distribution Operations
 Proceedings of the 2010 International Conference on Industrial Engineering and Operations Management Dhaa, Bangladesh, January 9 10, 2010 Artificial Intelligence Computational Techniques to Optimize a
ABSTRACT. Timetable, Urban bus network, Stochastic demand, Variable demand, Simulation ISSN:
 International Journal of Industrial Engineering & Production Research (09) pp. 83-91 December 09, Volume, Number 3 International Journal of Industrial Engineering & Production Research ISSN: 08-4889 Journal
A thesis presented to. the faculty of. the Russ College of Engineering and Technology of Ohio University. In partial fulfillment
 Methodology for Data Mining Customer Order History for Storage Assignment A thesis presented to the faculty of the Russ College of Engineering and Technology of Ohio University In partial fulfillment of
Simulation approaches for optimization in business and service systems
 Simulation approaches for optimization in business and service systems Imed Kacem kacem@univ-metz.fr Professor - Université Paul Verlaine Metz http://kacem.imed.perso.neuf.fr/site/ FUBUTEC 2, Future Business
Available online at International Journal of Current Research Vol. 9, Issue, 07, pp , July, 2017
 z Available online at http://www.journalcra.com International Journal of Current Research Vol. 9, Issue, 07, pp.53529-53533, July, 2017 INTERNATIONAL JOURNAL OF CURRENT RESEARCH ISSN: 0975-833X RESEARCH
Software Next Release Planning Approach through Exact Optimization
 Software Next Release Planning Approach through Optimization Fabrício G. Freitas, Daniel P. Coutinho, Jerffeson T. Souza Optimization in Software Engineering Group (GOES) Natural and Intelligent Computation
Transactions on the Built Environment vol 33, 1998 WIT Press, ISSN
 Effects of designated time on pickup/delivery truck routing and scheduling E. Taniguchf, T. Yamada\ M. Tamaishi*, M. Noritake^ "Department of Civil Engineering, Kyoto University, Yoshidahonmachi, Sakyo-kyu,
Transportation problem
 Transportation problem Operations research (OR) are concerned with scientifically deciding how to best design and operate people machine systems, usually under conditions requiring the allocation of scarce
Machine Learning: Algorithms and Applications
 Machine Learning: Algorithms and Applications Floriano Zini Free University of Bozen-Bolzano Faculty of Computer Science Academic Year 2011-2012 Lecture 4: 19 th March 2012 Evolutionary computing These
CHAPTER 3 RESEARCH METHODOLOGY
 72 CHAPTER 3 RESEARCH METHODOLOGY Inventory management is considered to be an important field in Supply chain management. Once the efficient and effective management of inventory is carried out throughout
CROSS-DOCKING: SCHEDULING OF INCOMING AND OUTGOING SEMI TRAILERS
 CROSS-DOCKING: SCHEDULING OF INCOMING AND OUTGOING SEMI TRAILERS 1 th International Conference on Production Research P.Baptiste, M.Y.Maknoon Département de mathématiques et génie industriel, Ecole polytechnique
Factors that influence layout
 Facility Layout Design : Arrangement of machines, storage areas, and/or work areas usually within the confines of a physical structure, such as a retail store, an office, a warehouse, or a manufacturing
Designing a Forest Road Network using Heuristic Optimization Techniques
 Designing a Forest Road Network using Heuristic Optimization Techniques Woodam Chung and John Sessions Graduate Research Assistant and Professor, respectively, Department of Forest Engineering, Oregon
Genetic Algorithms and Sensitivity Analysis in Production Planning Optimization
 Genetic Algorithms and Sensitivity Analysis in Production Planning Optimization CECÍLIA REIS 1,2, LEONARDO PAIVA 2, JORGE MOUTINHO 2, VIRIATO M. MARQUES 1,3 1 GECAD Knowledge Engineering and Decision Support
A Particle Swarm Optimization Algorithm for Multi-depot Vehicle Routing problem with Pickup and Delivery Requests
 A Particle Swarm Optimization Algorithm for Multi-depot Vehicle Routing problem with Pickup and Delivery Requests Pandhapon Sombuntham and Voratas Kachitvichayanukul Abstract A particle swarm optimization
Global Logistics Road Planning: A Genetic Algorithm Approach
 The Sixth International Symposium on Operations Research and Its Applications (ISORA 06) Xinjiang, China, August 8 12, 2006 Copyright 2006 ORSC & APORC pp. 75 81 Global Logistics Road Planning: A Genetic
Genetic Algorithm: An Optimization Technique Concept
 Genetic Algorithm: An Optimization Technique Concept 1 Uma Anand, 2 Chain Singh 1 Student M.Tech (3 rd sem) Department of Computer Science Engineering Dronacharya College of Engineering, Gurgaon-123506,
Comparison of a Job-Shop Scheduler using Genetic Algorithms with a SLACK based Scheduler
 1 Comparison of a Job-Shop Scheduler using Genetic Algorithms with a SLACK based Scheduler Nishant Deshpande Department of Computer Science Stanford, CA 9305 nishantd@cs.stanford.edu (650) 28 5159 June
initial set of random solutions called population satisfying boundary and/or system
 CHAPTER 4 Genetic Algorithm GAs are stochastic search algorithms based on the mechanism of natural selection and natural genetics. GA, differing from conventional search techniques, start with an initial
Travel Models for Warehouses with Task Interleaving
 Proceedings of the 2008 Industrial Engineering Research Conference J. Fowler and S. Mason, eds. Travel Models for Warehouses with Task Interleaving Letitia M. Pohl and Russell D. Meller Department of Industrial
CHAPTER 1 INTRODUCTION
 1 CHAPTER 1 INTRODUCTION 1.1 MANUFACTURING SYSTEM Manufacturing, a branch of industry, is the application of tools and processes for the transformation of raw materials into finished products. The manufacturing
CHAPTER 2 REACTIVE POWER OPTIMIZATION A REVIEW
 14 CHAPTER 2 REACTIVE POWER OPTIMIZATION A REVIEW 2.1 INTRODUCTION Reactive power optimization is an important function both in planning for the future and day-to-day operations of power systems. It uses
Optimisation and Operations Research
 Optimisation and Operations Research Lecture 17: Genetic Algorithms and Evolutionary Computing Matthew Roughan http://www.maths.adelaide.edu.au/matthew.roughan/ Lecture_notes/OORII/
LEARNING OBJECTIVES FOR QUIZ 1
 LEARNING OBJECTIVES FOR QUIZ 1 CHAPTER 1 After completing chapter 1, students will be able to: Describe the significance of facilities planning. Describe how facilities planning is important to the field
Volume to Capacity Estimation of Signalized Road Networks for Metropolitan Transportation Planning. Hiron Fernando, BSCE. A Thesis CIVIL ENGINEERING
 Volume to Capacity Estimation of Signalized Road Networks for Metropolitan Transportation Planning by Hiron Fernando, BSCE A Thesis In CIVIL ENGINEERING Submitted to the Graduate Faculty of Texas Tech
Vehicle Routing with Cross Docks, Split Deliveries, and Multiple Use of Vehicles. Arun Kumar Ranganathan Jagannathan
 Vehicle Routing with Cross Docks, Split Deliveries, and Multiple Use of Vehicles by Arun Kumar Ranganathan Jagannathan A thesis submitted to the Graduate Faculty of Auburn University in partial fulfillment
EMM4131 Popülasyon Temelli Algoritmalar (Population-based Algorithms) Introduction to Meta-heuristics and Evolutionary Algorithms
 Introduction to Meta-heuristics and Evolutionary Algorithms") 2017-2018 Güz Yarıyılı Balikesir Universitesi, Endustri Muhendisligi Bolumu EMM4131 Popülasyon Temelli Algoritmalar (Population-based Algorithms) 2 Introduction to Meta-heuristics and Evolutionary Algorithms
2017-2018 Güz Yarıyılı Balikesir Universitesi, Endustri Muhendisligi Bolumu EMM4131 Popülasyon Temelli Algoritmalar (Population-based Algorithms) 2 Introduction to Meta-heuristics and Evolutionary Algorithms
Automated Test Case Generation: Metaheuristic Search
 Automated Test Case Generation: Metaheuristic Search CSCE 747 - Lecture 21-03/29/2016 Testing as a Search Problem Do you have a goal in mind when testing? Can that goal be measured? Then you are searching
Using Multi-chromosomes to Solve. Hans J. Pierrot and Robert Hinterding. Victoria University of Technology
 Using Multi-chromosomes to Solve a Simple Mixed Integer Problem Hans J. Pierrot and Robert Hinterding Department of Computer and Mathematical Sciences Victoria University of Technology PO Box 14428 MCMC
Analysis and Modelling of Flexible Manufacturing System
 Analysis and Modelling of Flexible Manufacturing System Swetapadma Mishra 1, Biswabihari Rath 2, Aravind Tripathy 3 1,2,3Gandhi Institute For Technology,Bhubaneswar, Odisha, India --------------------------------------------------------------------***----------------------------------------------------------------------
Introduction To Genetic Algorithms
 Introduction To Genetic Algorithms Cse634 DATA MINING Professor Anita Wasilewska Computer Science Department Stony Brook University 1 Overview Introduction To Genetic Algorithms (GA) GA Operators and Parameters
Applying Tabu Search to Container Loading Problems
 Applying Tabu Search to Container Loading Problems A. Bortfeldt and H. Gehring, FernUniversität Hagen Abstract: This paper presents a Tabu Search Algorithm (TSA) for container loading problems with a container
Evolutionary Algorithms and Simulated Annealing in the Topological Configuration of the Spanning Tree
 Evolutionary Algorithms and Simulated Annealing in the Topological Configuration of the Spanning Tree A. SADEGHEIH Department of Industrial Engineering University of Yazd, P.O.Box: 89195-741 IRAN, YAZD
A Viral Systems Algorithm for the Traveling Salesman Problem
 Proceedings of the 2012 International Conference on Industrial Engineering and Operations Management Istanbul, Turkey, July 3 6, 2012 A Viral Systems Algorithm for the Traveling Salesman Problem Dedy Suryadi,
EVOLUTIONARY ALGORITHMS AT CHOICE: FROM GA TO GP EVOLŪCIJAS ALGORITMI PĒC IZVĒLES: NO GA UZ GP
 ISSN 1691-5402 ISBN 978-9984-44-028-6 Environment. Technology. Resources Proceedings of the 7 th International Scientific and Practical Conference. Volume I1 Rēzeknes Augstskola, Rēzekne, RA Izdevniecība,
What is an Evolutionary Algorithm? Presented by: Faramarz Safi (Ph.D.) Faculty of Computer Engineering Islamic Azad University, Najafabad Branch
 Faculty of Computer Engineering Islamic Azad University, Najafabad Branch") Presented by: Faramarz Safi (Ph.D.) Faculty of Computer Engineering Islamic Azad University, Najafabad Branch Chapter 2 Contents Recap of Evolutionary Metaphor Basic scheme of an EA Basic Components: Representation
Presented by: Faramarz Safi (Ph.D.) Faculty of Computer Engineering Islamic Azad University, Najafabad Branch Chapter 2 Contents Recap of Evolutionary Metaphor Basic scheme of an EA Basic Components: Representation
Evolutionary Computation. Lecture 3. Evolutionary Computation. X 2 example: crossover. x 2 example: selection
 Evolutionary Computation Lecture 3 Evolutionary Computation CIS 412 Artificial Intelligence Umass, Dartmouth Stochastic search (or problem solving) techniques that mimic the metaphor of natural biological
Vincent L. Bernardin (corresponding), Resource Systems Group
, Resource Systems Group") Paper Author (s) Vincent L. Bernardin (corresponding), Resource Systems Group (Vince.Bernardin@RSGinc.com) Steven Trevino, Resource Systems Group, Inc. (Steven.Trevino@RSGinc.com) John P. Gliebe, Resource
Paper Author (s) Vincent L. Bernardin (corresponding), Resource Systems Group (Vince.Bernardin@RSGinc.com) Steven Trevino, Resource Systems Group, Inc. (Steven.Trevino@RSGinc.com) John P. Gliebe, Resource
Logistics. Final exam date. Project Presentation. Plan for this week. Evolutionary Algorithms. Crossover and Mutation
 Logistics Crossover and Mutation Assignments Checkpoint -- Problem Graded -- comments on mycourses Checkpoint --Framework Mostly all graded -- comments on mycourses Checkpoint -- Genotype / Phenotype Due
MODULE 3. Facilities Planning, Location, Layout And Movement Of Materials. Factors To Be Considered For Selection Of Region.
 MODULE 3 Facilities Planning, Location, Layout And Movement Of Materials Factors To Be Considered For Selection Of Region Primary Factors Market nearness Raw-material availability Labour availability Transport
The Genetic Algorithm CSC 301, Analysis of Algorithms Department of Computer Science Grinnell College December 5, 2016
 The Genetic Algorithm CSC 301, Analysis of Algorithms Department of Computer Science Grinnell College December 5, 2016 The Method When no efficient algorithm for solving an optimization problem is available,
A HYBRID ALGORITHM TO MINIMIZE THE NUMBER OF TARDY JOBS IN SINGLE MACHINE SCHEDULING
 DAAAM INTERNATIONAL SCIENTIFIC BOOK 2010 pp. 549-558 CHAPTER 48 A HYBRID ALGORITHM TO MINIMIZE THE NUMBER OF TARDY JOBS IN SINGLE MACHINE SCHEDULING BANCILA, D.; BUZATU, C. & FOTA, A. Abstract: Starting
INTEGRATING VEHICLE ROUTING WITH CROSS DOCK IN SUPPLY CHAIN
 INTEGRATING VEHICLE ROUTING WITH CROSS DOCK IN SUPPLY CHAIN Farshad Farshchi Department of Industrial Engineering, Parand Branch, Islamic Azad University, Parand, Iran Davood Jafari Department of Industrial
Design and Operational Analysis of Tandem AGV Systems
 Proceedings of the 2008 Industrial Engineering Research Conference J. Fowler and S. Mason. eds. Design and Operational Analysis of Tandem AGV Systems Sijie Liu, Tarek Y. ELMekkawy, Sherif A. Fahmy Department
Analysis of Shear Wall Transfer Beam Structure LEI KA HOU
 Analysis of Shear Wall Transfer Beam Structure by LEI KA HOU Final Year Project report submitted in partial fulfillment of the requirement of the Degree of Bachelor of Science in Civil Engineering 2013-2014
Operation and supply chain management Prof. G. Srinivasan Department of Management Studies Indian Institute of Technology Madras
 Operation and supply chain management Prof. G. Srinivasan Department of Management Studies Indian Institute of Technology Madras Lecture - 37 Transportation and Distribution Models In this lecture, we
Iterative train scheduling in networks with tree topologies: a case study for the Hunter Valley Coal Chain
 22nd International Congress on Modelling and Simulation, Hobart, Tasmania, Australia, 3 to 8 December 2017 mssanz.org.au/modsim2017 Iterative train scheduling in networks with tree topologies: a case study
Transshipment. Chapter 493. Introduction. Data Structure. Example Model
 Chapter 493 Introduction The transshipment model is a special case of the minimum cost capacitated flow model in which there are no capacities or minimums on the arc flows. The transshipment model is similar
Genetic Algorithm to Dry Dock Block Placement Arrangement Considering Subsequent Ships
 Genetic Algorithm to Dry Dock Block Placement Arrangement Considering Subsequent Ships Chen Chen 1, Chua Kim Huat 2, Yang Li Guo 3 Abstract In this paper, a genetic algorithm (GA) is presented in order
An Evolutionary Solution to a Multi-objective Scheduling Problem
 , June 30 - July 2,, London, U.K. An Evolutionary Solution to a Multi-objective Scheduling Problem Sumeyye Samur, Serol Bulkan Abstract Multi-objective problems have been attractive for most researchers