Tri-Cities Transportation Study Area Congestion Management System Operations Plan
|
|
|
- Christine Ford
- 6 years ago
- Views:
Transcription

1 Tri-Cities Transportation Study Area Congestion Management System Operations Plan
2 Executive Summary This report is update to the report developed in Federal regulations require that a Congestion Management System be in place in all Transportation Management Areas (TMAs), which are metropolitan areas with a population over 200,000. This document is called an operational CMS because it specifies how the performance of the transportation system is being monitored to identify existing and future congestion locations. Highway improvement projects located on the CMS network may not be programmed into the metropolitan Transportation Improvement Program in a Transportation Management Area that is a non-attainment or maintenance area without being part of the CMS process. The Tri-Cities region is a non-attainment area for ozone within the northern part of its boundary (Colonial Heights, Hopewell and S. Chesterfield) and is currently classified as part of the Richmond Ozone Maintenance Area. Transportation Management Area The Tri-Cities Area TMA includes the Cities of Colonial Heights, Hopewell and Petersburg and the urbanized portions of the Counties of Chesterfield, Dinwiddie and Prince George. Within these communities, specific elements of the transportation system will be identified and measured through the CMS process. According to FTA, the Tri-Cities TMA was merged with the Richmond TMA at the time the Petersburg and Richmond urbanized areas were merged by the U.S. Census Bureau. The CPDC staff questioned this interpretation, but FTA did not change its position. Based on the federal definition, the Tri-Cities MPO is currently part of the Richmond TMA. The network is defined in Section 4. Performance Measures for Highway Segments and Transit In order to determine the level of congestion for a highway segment, the CMS will use two performance measurements - volume/capacity (v/c) and vehicle occupancy rates (VOR). The v/c ratio will be determined for each segment in the CMS transportation network. Vehicle Surveys will provide vehicle occupancy data. Two performance measures are used to indicate transit performance: Reported Total Passenger Miles and Number of Unlinked Passenger Trips. Since expanded GRTC service was recently implemented at the time of this report, performance measures from GRTC are not available for this report. However, the expanded service should be represented in future CMS reports. Data Collection and System Monitoring The major data component of the Tri-Cities CMS is a database named the Statewide Highway Plan (SHiP) containing roadway characteristics, traffic counts, service volumes, and other data for each road segment in the CMS. Congested segments for the existing and future study years are displayed below. This database will be reviewed annually to estimate congested conditions. A
 capacity proposed for construction of the CMS network and determine the effectiveness of proposed projects in eliminating congestion.")
3 Congested Segments on the CMS System Identification and Evaluation of Strategies The process of the CMS should identify any possible alternatives to projects that would increase Single Occupancy Vehicle (SOV) capacity proposed for construction of the CMS network and determine the effectiveness of proposed projects in eliminating congestion. In this urban area, the congestion management strategies will contribute to the reduction of the congestion identified by the CMS. The process will evaluate the effectiveness of the proposed strategies based on the performance measures identified for the Tri-Cities area. It is required that the CMS provide an analysis of reasonable alternatives to any project proposed on the CMS network that will result in a significant increase in single occupancy vehicle (SOV) capacity. The B
4 CMS must demonstrate that there are no reasonable alternatives that can fully satisfy the need for additional capacity other than the proposed SOV alternative. During the MPO s Transportation Technical Committee (TTC) meeting on March 3, 2003, seven categories of CMS strategies were reviewed for their feasibility in the Tri-Cities area. Six of the seven potential strategies are applicable to the area, as described below. The seventh category, Bike/Pedestrian Strategies, is not considered applicable to the Tri-Cities urban area for supporting substantial commuting activities. A. Arterials and Local Streets Design 1. Super Street Arterials 2. Intersection Improvements 3. One-way/Reversible Streets 4. Access Management B. Arterials and Local Streets Operations 1. Signal Improvements 2. Arterial Surveillance 3. Turn Prohibitions 4. Improve Traffic Control 5. Freight Movement C. Freeways 1. Incident Management Systems 2. Highway Information Systems 3. High Occupancy Vehicle (HOV) lanes (2+ or 3+ vehicles / Buses / carpool vans on exclusive lane) 4. Park n- Ride D. Transit PAT service currently 1. System Service Expansion 2. Improved Routing 3. Fare Structures 4. Rail Service E. Intelligent Transportation Systems 1. Regional Multimodal Traveler Information/Traveler Assistance 2. Electronic Toll Collection 3. Railroad Grade Crossing Warning System F. Transportation Demand Management This fits into many of the categories above. The success of TDM may depend on the availability of alternatives. TDM can also be implemented as a short-term approach to reducing congestion. 1. Site-Specific 2. Alternative Hours of Travel 3. Assistance Programs In addition, any other strategies agreed upon by the MPO as having the potential to relieve congestion in the Tri-Cities area will be evaluated. Those will be considered on a case-by-case basis. Schedule of Implementation and Strategies for Congested Segments From these projects, the MPO will choose those projects that should be included in the Transportation Improvement Program (TIP). This evaluation should include the strategies for minimizing congested segments outlined in the final section (Section 9) of the CMS. The TIP includes an implementation C
5 schedule for all projects and expected sources of funding. The schedule below is a general schedule for the operation and maintenance of the CMS. The CMS process occurs on an annual basis as TIP projects are selected. The formal CMS Operations Plan is prepared every three years and reports the status of the process and approach. Unified Work Program and CMS Schedule Prepare preliminary draft of TIP Update database with new data from VDOT s air quality monitoring Identify alternative strategies for projects on CMS network as needed Receive final Six Year Plan from VDOT Evaluate alternative strategies and propose final strategies for inclusion in TIP MPO approve final TIP Update CMS network as needed J F M A M J J A S O N D Review potential Strategies and Performance Measures in CMS J F M A M J J A S O N D D
6 Tri-Cities Transportation Study Area Congestion Management System Operations Plan April 2003
7 Table of Contents 1. Introduction Congestion Management System Areas of Application Transportation System Definition Performance Measures Performance Measures for Highway Segments V/C Ratios Vehicle Occupancy Rates Performance Measures for Transit Systems Data Collection and System Monitoring CMS Screening Results CMS Screening Results (Years 2003, 2015, and 2025) Comparison To Peer Urban Areas Roadway Mileage Vehicle Miles Traveled Identification and Evaluation of Proposed Strategies Implementation of Strategies Schedule of Implementation Strategies for Congested Segments Congested Arterial Streets Congested Freeway Segments General Congestion Management Strategies Programs to Improve Mobility and Decrease Congestion ITS Activities in the Region Job Access and Reverse Commute Program Evaluation of the Effectiveness of Implemented Strategies...40 i
8 List of Appendices APPENDIX A: Vehicle Occupancy Survey Results... A-1 APPENDIX B: 1997 and 2003 CMS Operations Plan Screening Results... B-1 APPENDIX C: Transportation Improvement Plan (TIP) with CMS Data... C-1 APPENDIX D: Tri-Cities Area Summary of Congestion Management Initiatives... D-1 List of Maps Map 1 Area of Application...6 Map 2 CMS Highway Network...10 Map 3 Potentially Congested CMS Network Segments (Present)...18 Map 4 Potentially Congested CMS Network Segments (2015)...19 Map 5 Potentially Congested CMS Network Segments (2025)...20 List of Tables Table 1 CMS Network Roadways...8 Table 2 Vehicle Occupancy Rate Survey Summary...13 Table 3 Potentially Congested Segments in CMS Network...17 Table 4 Comparison of Roadway Miles in Peer Urban Areas...24 Table 5 Strategies to Improve Arterial Design...31 Table 6 Strategies to Improve Arterial Operations...32 Table 7 Strategies to Improve Freeway Operations...33 Table 8 Strategies to Improve Transit Operations...34 Table 9 Strategies to Improve ITS Operations...35 Table 10 TDM Strategies...36 List of Figures Figure 1 Unified Work Program and CMS Schedule...4 Figure 2 Total Congested Miles by Roadway Type...21 Figure 3 Number of Congested Segments by Roadway Type...21 Figure 4 VMT for entire CMS network...22 Figure 5 Total VMT in Peer Urban Areas...25 Figure 6 VMT by Roadway Type in Peer Urban Areas...25 Figure 7 Unified Work Program and CMS Schedule...29 ii
9 CONGESTION MANAGEMENT SYSTEM FOR THE TRI-CITIES METROPOLITAN PLANNING ORGANIZATION 1. Introduction This report is the second in a series of Congestion Management System (CMS) studies for the Tri-Cities area. It is an update to the report developed and approved in Federal regulations require that a Congestion Management System be in place in all Transportation Management Areas (TMAs), which are metropolitan areas with a population over 200,000. The Tri-Cities Area MPO includes a population of approximately 100,000 in an area comprised of the Cities of Petersburg, Colonial Heights and Hopewell, and portions of Chesterfield County, Prince George County and Dinwiddie County. Representatives from each of the six localities with the study area, along with representatives from the Virginia Department of Transportation (VDOT), the Virginia Department of Rail and Public Transportation (VDRPT), Federal Highway Administration (FHWA) and Federal Transit Administration (FTA) comprise the Metropolitan Planning Organization (MPO) for the Tri-Cities area. Together these entities are organized with the purpose of developing a systematic process for planning and implementation of transportation system improvements in the Tri-Cities transportation study area. The Tri-Cities transportation study area is located in southeastern Virginia within the I-85, I-95 and I-295 travel corridors. Major arterial routes servicing the area are Virginia Route 10, Virginia Route 36, US 301, US 1, US 460, Virginia Route 156 and Virginia Route 144. The Tri-Cities supports a multi modal transportation system with highway, transit, rail, pedestrian and bicycle transportation accessible to its population. Localities within the study area also have access to the international water ports and airports located in Richmond and Norfolk. The Tri-Cities MPO adopted a draft CMS document in October of 1995 based on interim CMS regulations published in the December 1, 1993 Federal Register. This document outlined how the Tri-Cities Area MPO proposed to address any existing or future congestion problems that may be identified by an operational CMS. As used in this context, the term congestion refers to the level at which the performance of the transportation system reaches a point of not being acceptable because of traffic interference. Subsequently, the Federal Highway Administration (FHWA) and the Federal Transit Administration (FTA) issued final CMS regulations applicable to the Tri-Cities Area MPO. The final CMS regulations were published in the December 16, 1996 Federal Register and became effective January 21, After October 1, 1997, highway improvement projects on the CMS network that increase Single Occupancy Vehicle 1
10 (SOV) capacity must be evaluated in order to determine if there are any feasible alternatives to adding travel lanes to an existing corridor or proposed new location. The improvement in mobility and reduction in congestion should be aimed at more than improving the highway system. The CMS should incorporate multimodal transportation systems including transit systems, Intelligent Transportation System (ITS) enhancements and Transportation Demand Management (TDM) measures, such as ridesharing programs. The final rule enables State and local officials to retain the authority to select performance measures and to define acceptable existing and future congestion levels. This document is called an operational CMS because it specifies how the performance of the transportation system is being monitored to identify existing and future congestion locations. The CMS will incorporate strategies to reduce congestion, increase mobility and develop conceptual timing and costing estimates. Highway improvement projects located on the CMS network may not be programmed into the metropolitan Transportation Improvement Program in a Transportation Management Area that is a non-attainment or maintenance area without being part of the CMS process. The Tri-Cities region is a non-attainment area for ozone within the northern part of its boundary (Colonial Heights, Hopewell and S. Chesterfield) and is currently classified as part of the Richmond Ozone Maintenance Area. This designation is described in more detail in Chapter 3. 2
11 2. Congestion Management System The purpose of a CMS is to provide for... effective management of new and existing transportation facilities... through the use of travel demand reduction and operational management strategies. The regulations provided by FHWA provide guidelines for developing and implementing a CMS, but allow a lot of discretion to the MPO to establish the CMS to meet regional needs. There are five specific components that must be included in the CMS. These components are as follows: 1. Performance Measures: These measures will provide the initial measure of the extent of traffic congestion. The performance measures will also provide a means for evaluation of the effectiveness of congestion reduction and mobility enhancement strategies for the movement of people and goods. 2. Data Collection and System Monitoring: This component requires a continuous program of data collection and system monitoring... The data collection and monitoring program will provide the means for evaluating the effectiveness of implemented strategies. 3. Identification and Evaluation of Proposed Strategies: Anticipated performance and expected benefits of traditional and non-traditional strategies shall be identified and evaluated based on the performance measures. 4. Implementation of Strategies: For each strategy, or combination of strategies, proposed for implementation, an implementation schedule, implementation responsibilities, and possible funding sources shall be identified. 5. Evaluation of Implemented Strategies: A periodic assessment of the effectiveness of the implemented strategies, in terms of the performance measures, must be undertaken. Using these components as guidelines, the Tri-Cities Area MPO has developed an operational congestion management system. The system is designed to meet the unique needs of the Tri-Cities area and will be reviewed annually to determine any adjustments that may be necessary. A tentative schedule has been created to approximate the role the CMS will play in the Tri-Cities MPO s annual Unified Work Program (UWP) of which the Transportation Improvement Plan (TIP) is a key component. The TIP, along with the Long Range Transportation Plan will serve as the primary means to implement the recommendations developed through the CMS process. This CMS schedule must remain relatively flexible due to the changing requirements and timetables involved when developing the long-range transportation planning projects. The schedule shown in Figure 1 below indicates the annual schedule of the TIP and the CMS process. 3
12 It is also anticipated that the CMS Operations Plan report will be assembled every three years to report the level of congestion based on the performance indicators and the availability and usage of alternative modes that indicate improved transportation efficiency. This will provide state and federal agencies with indicators on the success of the region s programming to maximize mobility. This 2003 version of the CMS updates the previous Tri-Cities Study Area CMS Operations Plan, dated September Figure 1 Unified Work Program and CMS Schedule Prepare preliminary draft of TIP Update database with new data from VDOT s air quality monitoring Identify alternative strategies for projects on CMS network as needed Receive final Six Year Plan from VDOT Evaluate alternative strategies and propose final strategies for inclusion in TIP MPO approve final TIP Update CMS network as needed J F M A M J J A S O N D Review potential Strategies and Performance Measures in CMS J F M A M J J A S O N D 4
13 3. Areas of Application The area of application is defined as the key roadways, transportation systems and programs within the specific jurisdictions to be included in the CMS. This specifically includes those communities that have been identified as exceeding the applicable standard for airborne pollutants. The U.S. Environmental Protection Agency (EPA) has determined that the City of Colonial Heights, the City of Hopewell and southern portions of Chesterfield County are part of the Richmond Ozone Non-Attainment Maintenance Area and have previously exceeded the applicable national standard for ground level ozone. Because these specific areas are designated non-attainment for ozone, the entire metropolitan planning area is included in the TMA boundary. The Tri-Cities Area TMA includes the Cities of Colonial Heights, Hopewell and Petersburg and the urbanized portions of the Counties of Chesterfield, Dinwiddie and Prince George. Within these communities, specific elements of the transportation system will be identified and measured through the CMS process. Map 1 identifies the area of application including the ozone maintenance area as well as the Tri-Cities Transportation Management Area (TMA). According to FTA, the Tri-Cities TMA was merged with the Richmond TMA at the time the Petersburg and Richmond urbanized areas were merged by the U.S. Census Bureau. The CPDC staff questioned this interpretation, but FTA did not change its position. Based on the federal definition, the Tri-Cities MPO is currently part of the Richmond TMA. 5
14 Map 1 Area of Application 6
15 4. Transportation System Definition Within the area of application, the Tri-Cities MPO staff has identified critical roadway segments within the area of application to be evaluated by the CMS. These critical segments have remained consistent from the 1997 CMS analysis. Proposed projects on these chosen transportation facilities will need to be evaluated using the CMS. Only the facilities of the National Highway System (NHS) are required by FHWA to be evaluated by the CMS. Other projects not occurring on the NHS, such as regionally significant or major projects on non-nhs facilities, may be evaluated on a project-byproject basis. Also, improvements on non-traditional transportation facilities, such as pedestrian and bicycle facilities, will be assumed to provide relatively minimal congestion relief in the area, but are important for recreational and mobility purposes. Roadways on the CMS will be divided into segments. These segments will match those used by VDOT in their air quality monitoring modeling efforts. In addition, these segments will be numbered according to their individual CMS segment identification number (CMS Segment Number). This numbering will help in identifying specific congested roadway segments within the text, in tables and on maps. By dividing the roadways into smaller segments and numbering them by a specific identification number, the CMS will be able to identify congestion in greater detail, pinpointing congestion rather than identifying large portions of roadway as congested when only specific portions are congested. Perhaps more importantly, roadway improvements can be concentrated on the congested segments. By using the same roadway segments as VDOT, the CMS database can be easily updated as new data is produced by VDOT. VDOT now separately categorizes their roadway system into Arterial, Freeway, Rural Multi-Lane, and Rural Two-Lane facilities. The CMS database has been categorized in a like manner. Table 1 lists road segments that constitute the CMS network. Map 2 displays the roadway segments that constitute the CMS road network. 7

16 Table 1 CMS Network Roadways 8

17 CMS Network Roadways (continued) Note: Number of lanes is for both directions where applicable. One-way roads are highlighted. 9
18 Map 2 CMS Highway Network 10
19 5. Performance Measures Performance measures provide a means of evaluating the efficiency of the transportation system. These measures provide parameters necessary to identify the location and severity of congestion. Performance measures also allow evaluation of the effectiveness of proposed strategies/alternatives for both highway segments and transit facilities. 5.1 Performance Measures for Highway Segments In order to determine the level of congestion for a highway segment, the Tri-Cities CMS will use two performance measurements - volume/capacity (v/c) and vehicle occupancy rates (VOR). This ratio will be determined for each segment in the CMS transportation network. Existing and projected performance measures will then be displayed graphically on the transportation system map and numerically in the CMS database. Such a process will allow the MPO to determine present conditions, as well as to project possible future conditions on the network V/C Ratios In order to determine the level of congestion for a highway segment, the Tri-Cities CMS will use a performance measurement of volume of traffic on the roadway divided by the capacity of the roadway (v/c). This value will be determined for each segment of highway in the transportation system model. The v/c calculations are determined for existing conditions (2003) and future conditions (2015 and 2025). The projected v/c for 2015 in this study can be compared with the 1997 previous study s projected v/c for Projected congestion is displayed graphically on the transportation system map and numerically in the CMS database. Such a process will allow the MPO to determine present congestion, as well as to project possible locations for future congestion on the CMS network. A road segment showing a v/c ratio of 1.0 or greater (volume is greater than capacity) in the congestion management system will be considered congested. The concept of level of service (LOS) is defined as a qualitative measure describing the operational conditions of traffic flow and how these conditions are perceived by motorists. Factors such as speed and travel time, freedom to maneuver, traffic interruptions, comfort and convenience, and safety are used to describe level of service. Six levels of service are defined and each of given a letter designation from A to F. LOS A represents the best operating conditions and LOS F the worst. Levels of service are defined as follows for uninterrupted traffic flow: 11
20 LOS A: LOS B: LOS C: LOS D: LOS E: LOS F: (Free flow conditions) Vehicles are almost completely unimpeded in their ability to maneuver within the traffic stream with a high level of physical and psychological comfort. The effects of minor accidents or breakdowns are easily absorbed at this level. (Reasonably free flow conditions) The ability to maneuver within the traffic stream is only slightly restricted and the general level of physical and psychological comfort provided to drivers is still high. The effects of minor incidents and breakdowns are still easily absorbed. (Stable operations) Traffic flows are approaching the range in which small increases in traffic will cause substantial deterioration in service. Freedom to maneuver within the traffic stream is noticeably restricted and lane changes require additional care and vigilance. Minor accidents may still be absorbed, but the local deterioration in service will be substantial with delay forming behind any significant blockage. The driver now experiences a noticeable tension due to the additional vigilance required for safe operation. (High density, but stable flow. Bordering unstable flow) Small increases in traffic may cause substantial deterioration in service. Freedom to maneuver within the traffic stream is severely limited and the driver experiences drastically reduced physical and psychological comfort levels. Even minor accidents can be expected to create substantial delays because the traffic stream has little space to absorb disruptions. (Very unstable operations) Virtually no usable gaps exist within the traffic stream. This means that any disruption, such as a vehicle entering from a ramp or changing lanes, causes following vehicles to slow or stop to admit the vehicle disrupting the flow. Any incident can be expected to produce substantial delay. Maneuverability within the traffic stream is extremely limited and the level of physical and psychological comfort is extremely poor. (Forced or breakdown flow) Such conditions generally exist for a number of reasons such as traffic accidents, recurring points of congestion, or peak hour conditions which exceed the current design of the facility. LOS F is used to identify that point where the facility has reached maximum capacity and a complete breakdown of service occurs. The Virginia Department of Transportation identifies the congestion threshold for the road segments in an urban setting as level of service D. The volume of traffic that a roadway can serve at level D is the service volume of the roadway, which is used as the capacity value (the c in v/c) for determining congestion in the Tri-Cities CMS. Level of service is not used as a specific transportation performance measure in the CMS. 12
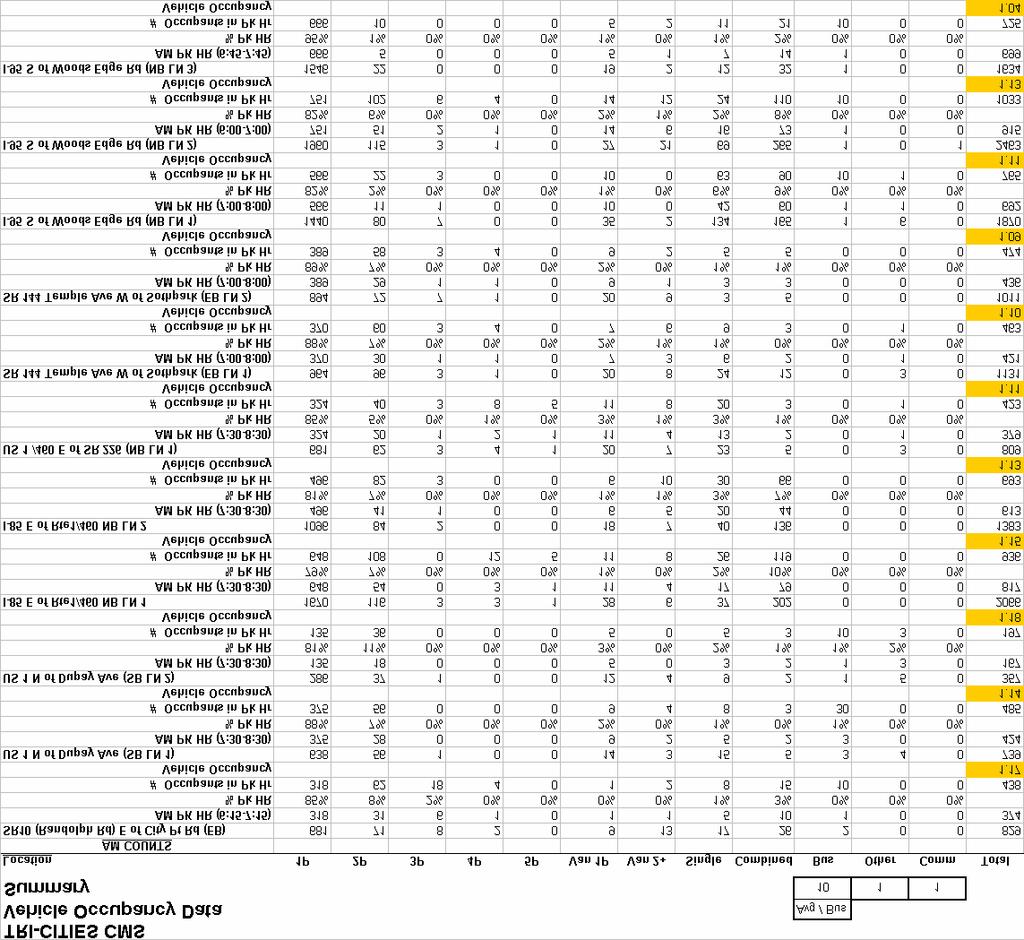
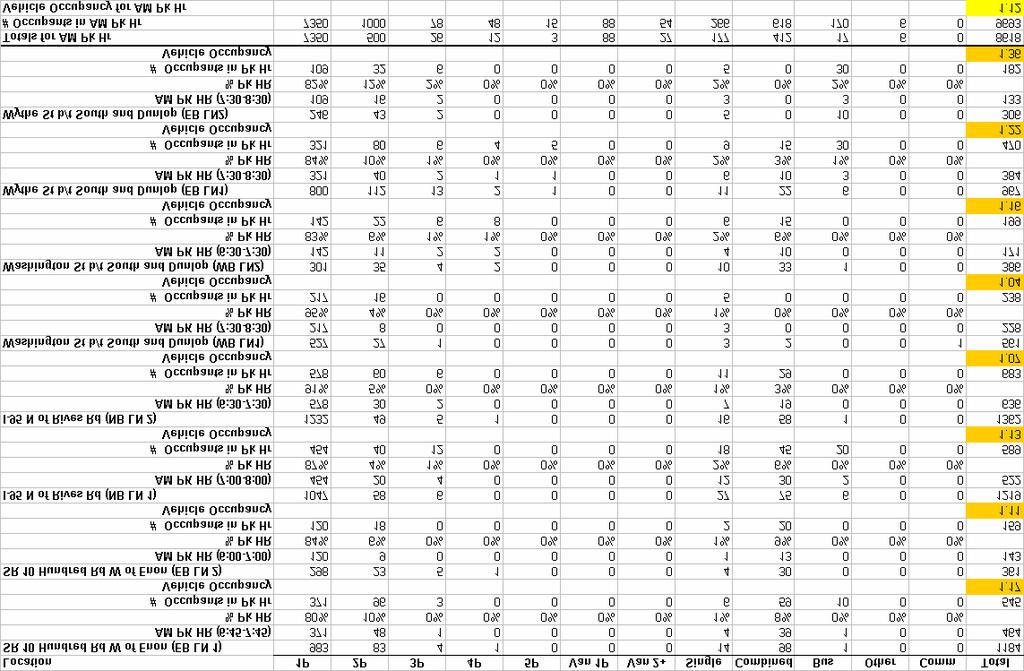
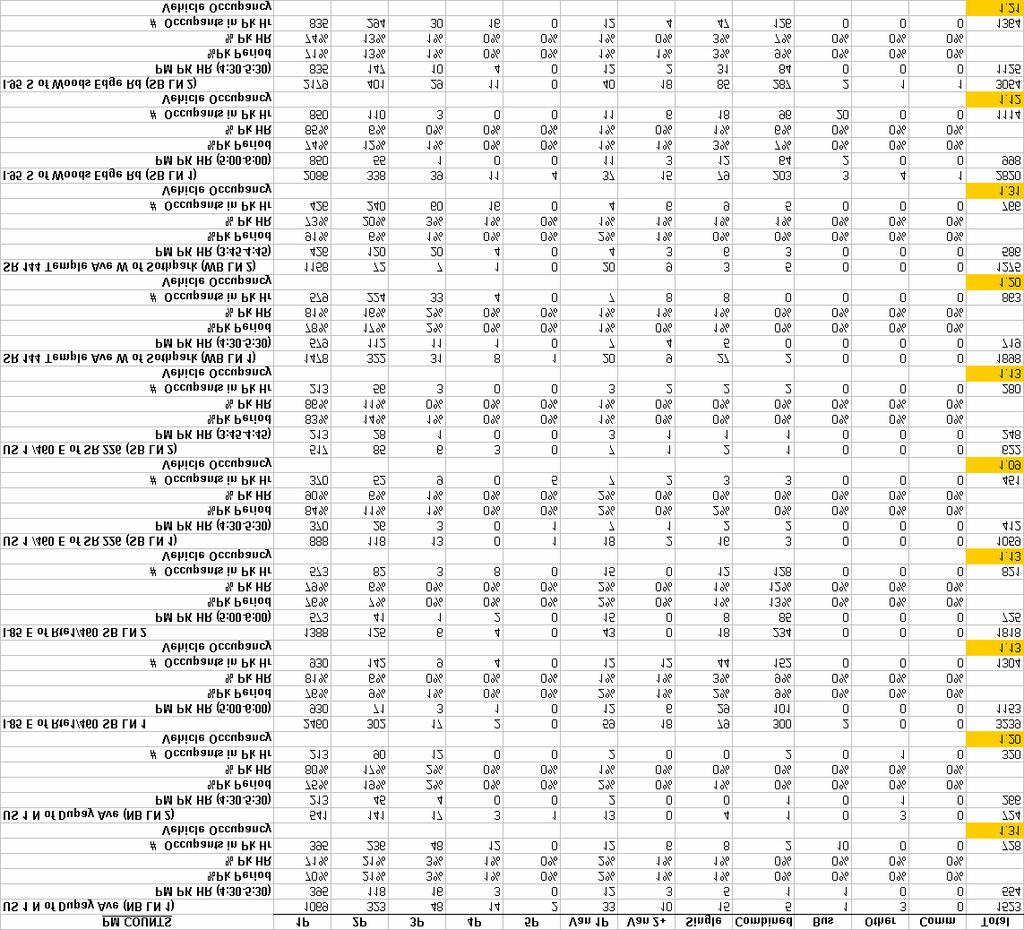
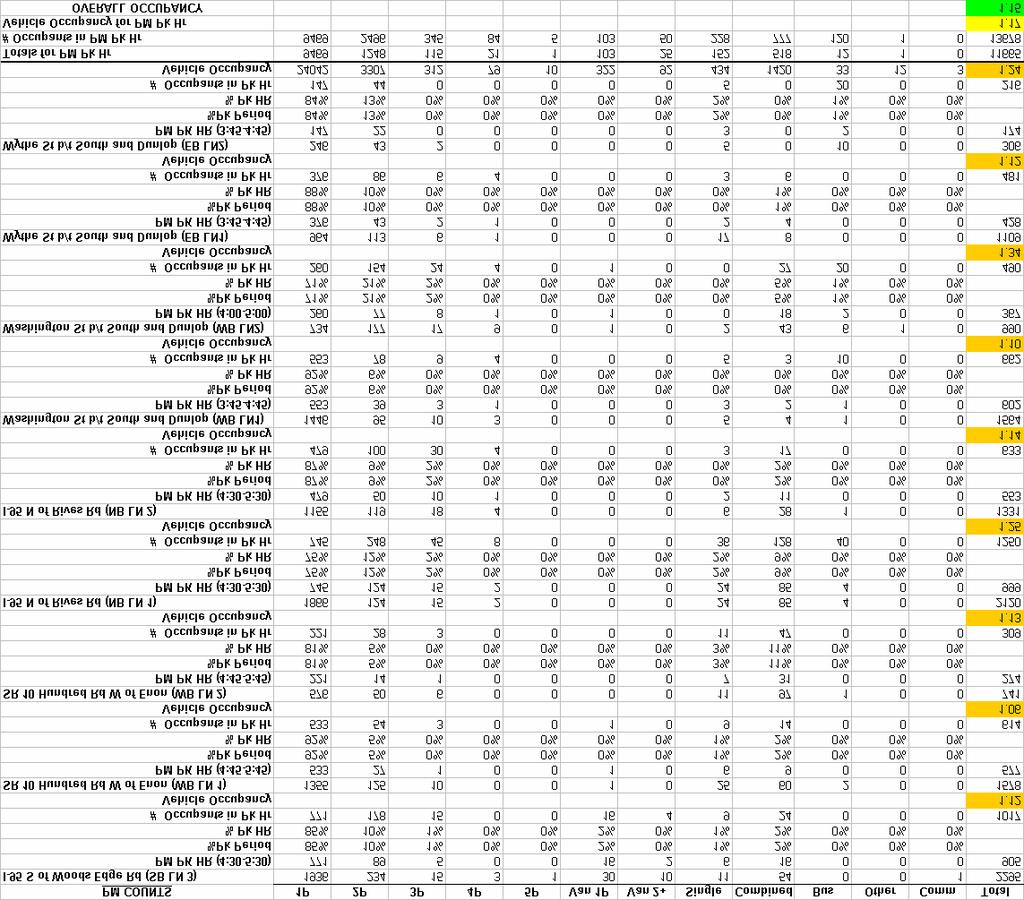
21 5.1.2 Vehicle Occupancy Rates The Vehicle Occupancy Rate (VOR) measures the number of people moved on the roadway network at specific locations as compared to the number of vehicles at those same locations. It is used in Congestion Management Systems because it indicates whether or not programs to reduce travel demand are successful. This CMS Operations Plan has introduced the use of VOR as a performance measure and will serve as a baseline for future VOR analyses. VDOT coordinated the data collection effort for the MPO by having observers count the number of people in vehicles at specific observation areas throughout the region during November and December This survey data was then summarized to determine a VOR for each segment by AM and PM peak hour. In addition, an overall VOR was developed for the area. This summary data is displayed in Table 2 and in detail in Appendix A. Table 2 Vehicle Occupancy Rate Survey Summary 13
22 5.2 Performance Measures for Transit Systems Petersburg Area Transit (PAT) is the primary local transit operator for fixed-route public mass transit service in the Tri-Cities urban area. Its current routes serve the City of Petersburg and the village of Ettrick, located in Chesterfield County. Greater Richmond Transit Company (GRTC) has also recently expanded their service to the Tri-Cities region. These transit systems can play a critical role in mobility enhancement and congestion relief. Due to the role transit can play in regional mobility, transit performance measures were added to the CMS Plan. It was decided during the Transportation Technical Committee Meeting on February 3, 2003 that two performance measures would be used to indicate transit performance. These measures would be derived from the Section 15 Report for Petersburg Area Transit (Transit Agency Service Form 406). Since the expanded GRTC service was just implemented, performance measures will not be available for this report. However, the expanded service should be represented in future CMS reports. PAT GRTC Reported Total Passenger Miles 1,287,368 in 2001 n/a* Number of Unlinked Passenger Trips 715,262 in 2001 n/a * n/a: information not available for this report Since this is the first CMS Operations Plan to use transit performance measures, these performance measures will set the baseline to which future plans will be compared. Annual passenger miles and Annual unlinked passenger trips are reported for the previous analysis year in the Transit Agency Service Form 406 report provided by PAT on November 18,
23 6. Data Collection and System Monitoring The process of collecting data and monitoring the transportation system should be an ongoing program to determine and monitor the level and severity of congestion that may occur and to evaluate the effectiveness of implemented actions. Existing data sources of the affected localities, the MPO and the Virginia Department of Transportation shall be utilized. The major data component of the Tri-Cities CMS is a database named the Statewide Highway Plan (SHiP) containing roadway characteristics, traffic counts, service volumes, and other data for each road segment in the CMS. The information in the database will be updated regularly as transportation improvements are completed, congestion strategies are implemented or as new traffic counts are supplied by the Virginia Department of Transportation. The database also includes projected traffic counts and service volumes for the road segments of the CMS. These projected figures are supplied by VDOT through their transportation planning efforts. Existing traffic counts are projected to future volumes using growth rates reflected in the region s modeling efforts. Such modeling is based on changes proposed by the Tri-Cities Area 2023 Long-Range Transportation Plan. This data is used for planning purposes, rather than for operational analysis. The data used to support the CMS may be affected by routine traffic maintenance or special events in the region. Traffic management services on all interstate facilities and all highway facilities located in the county portions of the study area are provided by VDOT. The traffic management services for all other highway facilities located in the study area are provided by local governments. Congestion resulting from routine maintenance and/or special events, such as sporting events, is most often temporary and will be evaluated by the MPO on a case-by-case basis. Long-term strategies may not be the most cost effective for such temporary congestion problems CMS Screening Results The 1997 CMS Operations Plan established the CMS network to be monitored, the performance measures to be applied and the database from which the information would be gathered. The results of the 1997 CMS indicated eleven roadway segments as Present Potential Congested Segments (Existing Congested Segments) and 33 roadway segments as Potential Future Congested Segments. These segments are identified in Appendix B. Since the time of this last report, the Highway Capacity Manual (HCM) methodology has been revised. To remain consistent with the latest methodologies, VDOT has updated the SHiPs database to utilize the most recent HCM methodologies. This resulted in changes in the capacities that are used in the v/c ratio calculations in the 2003 report. 15
24 Consequently, analysis results may be inconsistent in some cases when comparing 1997 and 2003 analyses CMS Screening Results (Years 2003, 2015, and 2025) Using the latest methodologies included in the SHiPs database, The 2003 CMS report identifies congested segments based on v/c calculations. The 2003 report also includes data beyond what was included in the 1997 CMS Operations Plan, including a summation of congested roadway miles, a count of congested segments, and a calculation of vehicle-miles traveled (VMT). The performance measures that are new to the 2003 CMS are discussed further below and provide the baseline for further studies. The number of congested roadway miles reflects the total number of miles of roadway segments potentially congested for the analysis year. The number of congested segments reflects a simple tally of congested segments on the CMS network. The VMT is an aggregated calculation of number of vehicles on each segment of the CMS network multiplied by the lengths of each of the individual segments on the CMS network. Table 3 lists the segments in the CMS network that are potentially congested in 2003, 2015 or Segments are considered to be congested when the v/c ratio is 1.0 or greater. These segments are listed by roadway type to reflect the functional class as per VDOT s criteria. The table lists each segment and its length as well as the peak hour volume in vehicles per hour (vph), daily traffic volume in vehicles per day (vpd), and vehicle-miles traveled (vmt), which is the daily vehicular volume multiplied by the segment length in miles. In performing calculations, the peak hourly volume is assumed to be ten percent of the daily volume. As shown in Table 3, this current 2003 CMS Operations Plan identifies thirteen roadway segments that are potentially congested in the present. In addition, 26 segments are shown as potentially congested in 2015, and 34 are shown as congested in Potentially congested segments are shaded on the table. As mentioned previously in this report, the roadway segments have been classified to reflect the functional class as per VDOT s criteria; Urban arterials, Freeways, Rural Multilane, and Rural Two-lane categories. In addition, the study years have been combined on the same table to facilitate comparison between the years. 16

25 Table 3 Potentially Congested Segments in CMS Network Segments that are potentially congested in 2003 are highlighted on the CMS roadway network on Map 3. Map 4 displays potentially congested conditions in Map 5 displays potentially congested conditions in The congested segments are identified by their CMS link identification number on each of the maps. 17
26 Map 3 Potentially Congested CMS Network Segments (2005) 18
27 Map 4 Potentially Congested CMS Network Segments (2015) 19
28 Map 5 Potentially Congested CMS Network Segments (2025) 20
29 Figure 2 and Figure 3 list the total congested miles and number of congested segments by roadway type in the network, respectively. Figure 2 Total Congested Miles by Roadway Type 35.0 Congested Miles by Roadway Type Miles Arterials Freeways Rural 2-Lane Rural Multilane Total Note: congested links have v/c > 1.0 Figure 3 Number of Congested Segments by Roadway Type Number of Congested Segments in CMS Network # of segments Arterials Freeways Rural 2-Lane Rural Multilane Total
30 Figure 2 displays that freeways will reach congested conditions at a faster rate than the other roadway types. Rural multilane roadways in the CMS network are not expected to reach congested levels within the analysis period. As can be seen in Figure 3, the total number of congested segments doubles by 2015 and approximately triples by Figure 4 provides a summary of vehicle-miles traveled (VMT) for the entire CMS network (congested and uncongested segments). This value provides an indication as to the amount that vehicles travel on the entire CMS network. This value is a baseline for comparison with other CMS studies. Figure 4 VMT for Entire CMS Network VMT for Entire CMS Network Thousands of Vehicle Miles Arterials Freeways Rural 2- Lane Rural Multilane Total
31 7. Comparison To Peer Urban Areas A discussion of other similar regions is useful to distinguish how the Richmond/Tri-Cities urban area compares to urban areas of similar population. On May 1, 2002, the U.S. Bureau of Census redefined urbanized areas nationwide based on revised urbanized area criteria and using 2000 census data. As a result of this redefinition process, the Petersburg, Colonial Heights, Hopewell and Richmond urbanized areas were merged form a newly defined Richmond Urbanized Area with a 2000 population of 818,836. This section will compare roadway mileage and vehicle miles traveled (VMT) for urban areas similar to Richmond/Tri-Cities area. Data compiled in this section is derived from the Federal Highway Administration (FHWA) s Highway Statistics Series This report summarizes transportation data for over 400 federal-aid urbanized areas, defined as an area with over 500,000 or more residents that, at a minimum, encompasses the land area delineated as the urbanized area by the Bureau of the Census, but may be enlarged to reflect other areas and facilities important to the urbanized area. The information was also categorized by roadway functional classification (Interstate, Other Freeway / Expressway, Other Principal Arterials, Minor Arterials, Collectors, and Local Streets). The Highway Statistics Series reports urban areas in order of like population size. For the purposes of this study, the Richmond/Tri-Cities area will be compared to ten other urban areas of similar population as categorized by the Highway Statistics Series. 7.1 Roadway Mileage The Richmond/Tri-Cities area is reported to have 2,963 total miles of roadway. It compares to the other ten cities with similar populations as the fifth highest total miles of roadways with Birmingham, Alabama (4,596 miles) having the most miles of the ten comparables and Honolulu, HI (1,068 miles) with the least roadway miles. Roadway miles as reported in the Highway Statistics Series are reported in Table 4. Future versions of the CMS will include similar comparisons and will compare to the data below as a baseline. 23
32 Table 4 Comparison of Roadway Miles in Peer Urban Areas 7.2 Vehicle Miles Traveled The Highway Statistics Series also identifies daily vehicle miles traveled (VMT) for the Federal-Aid urbanized areas. As discussed previously in this report, VMT reflects the number of vehicles on roadway network multiplied by the mileage of the roadway network. This section will focus on comparing the ten peer urbanized areas to the Richmond/Tri-Cities Urbanized Area. Future versions of the CMS will included similar comparisons and will compare to the data below as a baseline. Figures 5 and 6 display total VMT and VMT per roadway functional class as reported in the Highway Statistics Series. The VMT reported in Figure 4 does not apply because it only includes only those major roadways that are part of the CMS network, while Figures 5 and 6 present VMT for the whole urban area. 24
33 Figure 5 Total VMT in Peer Urban Areas Daily Vehicle-Miles of Travel All Roadways in Urbanized Area 30,000 25,000 Thousands of Miles 20,000 15,000 10,000 5,000 - Jacksonville, FL Salt Lake City, UT Louisville, KY Tulsa, OK Honolulu, HI Richmond, VA Birmingham, AL Rochester, NY El Paso, TX Omaha, NE Charlotte, NC Figure 6 VMT by Roadway Type in Peer Urban Areas Daily Vehicle-Miles of Travel By Roadway Type 12,000 10,000 Thousands of Miles 8,000 6,000 4,000 2,000 - Jacksonville, FL Salt Lake City, UT Louisville, KY Tulsa, OK Honolulu, HI Richmond, VA Birmingham, AL Rochester, NY El Paso, TX Omaha, NE Charlotte, NC Interstate & Freeways Arterial Collector & Local 25
34 8. Identification and Evaluation of Proposed Strategies The process of the CMS should identify any possible alternatives to projects which would increase SOV capacity proposed for construction of the CMS network and determine the effectiveness of proposed projects in eliminating congestion. In this urban area, the congestion management strategies will contribute to the reduction of the congestion identified by the CMS. Since strategies are specific to certain road types, the reorganization of roads in the CMS network by specific functional categories will assist in the determination of potential strategies. Furthermore, the process will evaluate the effectiveness of the proposed strategies based on the performance measures identified for the Tri-Cities area. It is required that the CMS provide an analysis of reasonable alternatives to any project proposed on the CMS network that will result in a significant increase in single occupancy vehicle (SOV) capacity. The CMS must demonstrate that there are no reasonable alternatives that can fully satisfy the need for additional capacity other than the proposed SOV alternative. The Federal Highway Administration identifies five broad categories of strategies for consideration by the CMS. Strategies identified under these categories will be used by the MPO in evaluating alternatives for implementation. The five categories are identified below. Transportation Demand Management Traffic Operational Improvement Public Transportation and Non-Traditional Modes Intelligent Transportation System Technology (ITS) Additional System Capacity During the MPO s Transportation Technical Committee (TTC) meeting on March 3, 2003, seven categories of CMS strategies were reviewed for their feasibility in the Tri-Cities area. Six of the seven potential strategies are applicable to the area, as described below. The seventh category, Bike/Pedestrian Strategies, is not considered applicable to the Tri-Cities urban area for congestion management due to the lack of appropriate infrastructure and densities to support substantial commuting via pedestrian or bicycle. A. Arterials and Local Streets Design 1. Super Street Arterials (Improving arterial with access management, channelization, Single Point Urban Intersections, railroad grade separations, Bus turnout bays, Remove parking) 26
35 2. Intersection Improvements (Turn lane/bay improvements, Improve geometry, Traffic Calming Improves ability to walk and bike, Improved geometric design for trucks) 3. One-way/Reversible Streets (Streets that are modified from two-way to one-way (integrate one-way pairs), Modify road capacity during peak hours to increase number of lanes in peak direction by flipping non-peak direction to peak direction) 4. Access Management (Driveway consolidation, Driveway spacing/design, Left-turn restrictions, Eliminate on-street parking, Intersection/signal spacing, Frontage roads, turn lanes; modify roadway (geometry, medians, sight distance) B. Arterials and Local Streets Operations 1. Signal Improvements (Update equipment, Optimize /Integration, Remove unwarranted signals, Signal maintenance) 2. Arterial Surveillance (Cameras to detect congestion/ accidents/breakdowns, Improve operations data (learn that deliveries are congesting peak traffic/remove parking meters/id problem areas) 3. Turn Prohibitions (Limit conflicting movements in peak hours, Make pedestrian crossings safer, Remove slowing vehicles from through flow) 4. Improve Traffic Control (Regulatory signs/warning signs /Informational signs limit driver confusion/traffic flows improve) 5. Freight Movement (Regulate on-street deliveries and peak hour pick up, Understand land uses that impact traffic) C. Freeways 1. Incident Management Systems (Breakdowns, Accidents; Response, Clearance time) 2. Highway Information Systems (ITS Advise drivers of alternate routes) 3. High Occupancy Vehicle (HOV) lanes (2+ or 3+ vehicles / Buses / carpool vans on exclusive lane) Benefit for HOV users, but could reduce capacity for SOV drivers 4. Park n- Ride (Useful for commuters, Express and some local buses, Other transit) D. Transit PAT service currently 1. System Service Expansion (More express and local service routes, Increased ridership, Expand route lengths and coverage) 2. Improved Routing (Focus routes and service to existing needs) 3. Fare Structures (Modify fees to make cheaper or more effective) 27
36 4. Rail Service (Discussions of commuter and light rail service to/from Richmond) E. Intelligent Transportation Systems 1. Regional Multimodal Traveler Information/Traveler Assistance (Websites/cams before leave for commute, Notification on roadways, Dynamic ridesharing, Transportation Management Centers) 2. Electronic Toll Collection (Toll roads, Bridges, Congestion pricing) 3. Railroad Grade Crossing Warning System (Provide warning for train crews of obstructions on the rails, Vehicle Proximity Alerting System for large vehicles Transit buses/haz waste haulers/school buses - of approaching train) F. Transportation Demand Management This fits into many of the categories above. The success of TDM may depend on the availability of alternatives. TDM can also be implemented as a short-term approach to reducing congestion. 1. Site-Specific (Employer support includes parking privileges, Financial incentives, Car/Vanpool programs, Telecommuting, On-site services) 2. Alternative Hours of Travel (Staggered hours, Flextime, Compressed work week) 3. Assistance Programs (Guaranteed rides, Subsidies, Marketing TDM programs) In addition, any other strategies agreed upon by the MPO as having the potential to relieve congestion in the Tri-Cities area will be evaluated. Those will be considered on a case-by-case basis. Appendix C includes those proposed projects in the current Transportation Improvement Program (August 2002) that are located on the CMS network. The chart identifies whether or not each project proposes to increase SOV capacity. Those projects that propose an increase in SOV capacity must be analyzed to determine if alternative strategies may prove more feasible in relieving congestion. 28
37 9. Implementation of Strategies Once the strategies chosen as alternatives for relieving congestion have been evaluated, they will be presented to the MPO. The congestion relief benefits of each as well as a cost analysis will be prepared for each strategy. 9.1 Schedule of Implementation From these projects, the MPO will choose those projects that should be included in the Transportation Improvement Program (TIP). The TIP includes an implementation schedule for all projects and expected sources of funding. Figure 7 (same as Figure 1) is a general schedule for the operation and maintenance of the CMS. The CMS process occurs on an annual basis as TIP projects are selected. The formal CMS Operations Plan is prepared every three years and reports the status of the process and approach. Figure 7 Unified Work Program and CMS Schedule Prepare preliminary draft of TIP Update database with new data from VDOT s air quality monitoring Identify alternative strategies for projects on CMS network as needed Receive final Six Year Plan from VDOT Evaluate alternative strategies and propose final strategies for inclusion in TIP MPO approve final TIP Update CMS network as needed J F M A M J J A S O N D Review potential Strategies and Performance Measures in CMS J F M A M J J A S O N D 29
38 9.2 Strategies for Congested Segments Certain strategies are applicable to specific roadway types. The following discussion is categorized by arterial, freeway and rural segments. In addition, this section will address other strategies that can be used alone or in conjunction with each other to improve congested conditions on roadways on the CMS network. Since the 2025 congested segments listed in Table 3 include a worst-case list of segments, the following discussion will focus on these segments Congested Arterial Streets As described previously in this report, fifteen arterial segments are potentially congested in These segments include the following: Route 1 (E Hundred Rd) from Route 904 to Route 746 (CMS Segment # 2) Route 1 (Boydton Plank) from.28 miles south of Rte 142 to Rte 142 (CMS Segment #4) Route 1 (Washington St) from Route 226 to Route 319 (CMS Segment #7) Route 36 (Oaklawn Blvd) from ECL of Petersburg to Lee Ave (CMS Segment #10) Route 1 (Boulevard) from Washington Ave to Dupuy Ave (CMS Segment #15) Route 1 (Boulevard) from Lynchburg Ave to E Westover Ave (CMS Segment #17) Route 1 (Boulevard) from E Ellerslie Rd to Sherwood Ave (CMS Segment #22) Route 144 (Temple Ave) from Boulevard to Conduit Rd (CMS Segments #24 & 25) Route 10 (Randolph Rd) from WCL Hopewell to N 6th Ave (CMS Segment #27) Route 10 (Randolph Rd) from Main St to Winston Ch. Dr (CMS Segment # 29 & 30) Route 36 (Oaklawn Blvd) from Jefferson Pk Rd to Cedar Level Rd (CMS Segments #32 & 33) Route 1 (W Washington St) from N Market St to Guarantee St (CMS Segment # 59) In addition to the arterial segments, three rural segments are potentially congested in These segments include the following: Route 1 (Boydton Plank) from Rte 460 to.28 MS Route 142 (CMS Segment #101 & 102) Route 1 (Washington St) from Rte 319 to WCL Petersburg (CMS Segment #103) The rural segments can utilize some strategies that have been proposed for arterial segments. Therefore they have been listed within this arterial strategies section. 30
39 The following strategies can be applied to improve the design and geometry of the arterial segments. These strategies range from specific spot improvements to re-signing and marking to major reconstruction along the corridor. These strategies are in addition to traditional roadway improvements and widening. These types of projects are viable alternatives in many cases that provide additional SOV capacity. The summary below lists potential strategies specific to arterial segments and presents costs and implementation timeframes for the strategies. Table 5 Strategies to Improve Arterial Design Arterial Design Strategies Super Street Arterials Intersection Improvements One Way/ Reversible Streets Access Management Benefit Widening roadway and reducing number of access points (grade separate intersecting streets). Could increase capacity 50%, and decrease delay significantly. Can have substantial benefits due to the reduction in traffic conflicts, queuing and improvement of traffic flow High volumes and vehicle conflicts may lead to consideration of one-way streets. Works best where one predominant flow is apparent. Can increase capacity or improve multi-modal potential. Could improve pedestrian safety, however traffic speeds may increase. Major benefit occurs by decreasing accidents. Reduces conflicts and decreases slower vehicles entering and exiting roadway. Implementation Costs and Time Estimates The costs per mile are estimated at $3-4 million/mile. The design and construction of such a facility will be expansive and timeconsuming. May involve land acquisition and access modifications. Costs are relatively modest and vary depending on improvement. Implementation time can be very short for small projects (add turn lane or change control devices). Could be relatively low cost ($500- $2,000/block), but should be studied to see if one-way or reversible flow will improve flow. Should consider parallel streets in vicinity. Transition back to two-way should be considered at end of one-way section. Care should be taken using reversible lanes. Politically charged issue. Difficult to control private access. Can be moderate cost, but may require purchase of property. Source: A Toolbox for Alleviating Traffic Congestion and Enhancing Mobility, ITE
40 The following strategies can be applied to improve the operations of the arterial segments. These strategies range from improved traffic control to full arterial surveillance. Table 6 Strategies to Improve Arterial Operations Arterial Operations Strategies Signal Improvements Arterial Surveillance Turn Prohibitions Improved Signage Benefit Signal coordination will provide for orderly traffic movement, provide reasonable timing for pedestrian and side-street crossing, increase capacity of intersection and reduce accidents By some estimates over 60% of congestion is non-reoccurring. Thus a key to reducing congestion, is to handle incidents as quickly as possible. Adding raised medians limits conflicting movements. Direct turning vehicles to turn bays / lanes so they don t slow through traffic. Safer pedestrian crossings. Reduces driver confusion and traffic flows improve. Implementation Costs and Time Estimates One of the most cost-effective tools. For example, Texas integrated a statewide signal synchronization program and concluded that after 26 projects and $1.7 mil in expenditures there was a 19.4%reduction in delay, an 8.8% reduction in the number of stops and a 13.3% reduction in fuel usage. Such improvements can be integrated in a relatively short period of time. Major costs associated with intersection control devices and operations costs. Requires coordinated effort. May take time to design, implement and coordinate systems. Relatively low cost (Continuous median strip to control left turns estimated at $2,000/block) and easy to implement. May limit access to businesses (economic impacts) and cause political conflict. Modest costs, varying on the complexity and number installed Source: A Toolbox for Alleviating Traffic Congestion and Enhancing Mobility, ITE
41 9.2.2 Congested Freeway Segments As described previously in this report, sixteen freeway segments are potentially congested in These segments include the following: I-95 from NCL of Colonial Heights to Route 618 (CMS Segments #69 & 70) I-85 from NB Route 1 to SCL Petersburg (CMS Segment #75) I-95 from Warwick Swamp to S of Route 301 (CMS Segment #76) I-95 from Route 626 to SCL Petersburg (CMS Segment #78) I-295 from Route 460 to 1 st SCL of Hopewell (CMS Segment #80) I-95 from NCL of Petersburg to NCL of Colonial Heights (CMS Segments #83 & 84) I-85 from SCL of Petersburg to I-95 (CMS Segments #89, 90 & 91) I-95 from I-85 NB to NCL Petersburg (CMS Segments #96-100) The following strategies can be applied to improve congested freeway segments. These strategies are in addition to traditional roadway improvements and widening. These types of projects are viable alternatives in many cases that provide additional SOV capacity. The summary below lists potential strategies specific to freeway segments and presents costs and implementation timeframes for the strategies. Table 7 Strategies to Improve Freeway Operations Freeway Strategies Incident Management Systems Highway Information Systems HOV Park-n-Ride Lots Benefit Major benefit is to reduce delay caused by breakdowns and accidents. By some estimates, over 60% of congestion is nonreoccurring. Thus a key to reducing congestion, is to handle incidents as quickly as possible. Gives driver on the road information to avoid and thereby minimize congestion. Benefits for drivers that carpool or use transit. Useful for commuters and transit. Increases densities for service and carpoolers. Implementation Costs and Time Estimates Some examples include motorcycle patrols with very substantial benefits for moderate to substantial costs. Video detection provides very substantial benefits for very substantial costs. Public education can have substantial benefits for minor costs. Quick to moderate timetable for implementation. Can be high costs for equipment. A substantial amount of time is needed to plan and implement this system. Requires modification of existing freeway lanes. Could result in a loss of capacity in multi-use lanes. May take time to stripe or redesign road. Modest costs, depending on size and extent. Tri-Cities area has recently introduced park-n-ride lots. Source: A Toolbox for Alleviating Traffic Congestion and Enhancing Mobility, ITE
42 9.2.3 General Congestion Management Strategies There are other strategies that do not necessarily focus on a specific roadway type, but instead provide mobility options and decrease congested conditions. These strategies include Transit, Intelligent Transportation Systems (ITS) and Transportation Demand Management (TDM) strategies. The following tables reflect strategies, benefits and costs/implementation timeframes of these congestion management strategies. Transit Strategies The PAT service that currently runs in the Tri-Cities urban area may be improved to meet modified demand, introduce new service or modify fare structures. For instance, GRTC service has now been extended into the Tri-Cities area due to a demand for service into Richmond. Table 8 Strategies to Improve Transit Operations Transit Strategies System Service Expansion (introduce rail, local bus, express bus) Improved Routing Fare Structures New Modes Park-n-Ride Lots Benefit Improve connections where projected demand exists. Increase mobility opportunities for poor, disabled and elderly. Focuses routes and service to existing demand. Makes system more efficient. Modifies fees to make service more affordable or more effective. May introduce more attractive service. Useful for commuters and transit. Increases densities for service and carpoolers. Implementation Costs and Time Estimates Costs depend on the type of improvement. An expansion of existing service where demand exists can be lower cost and short term. Creation of a new mode can be extremely expensive and require years of implementation. Low cost because it uses existing equipment. Short time table. Low costs to implement. Wrong rates could reduce ridership. Short implementation time. High costs to develop routes, cover capital costs and operate system. Modest costs, depending on size and extent. Tri-Cities area has recently introduced park-n-ride lots. Source: A Toolbox for Alleviating Traffic Congestion and Enhancing Mobility, ITE
43 Intelligent Transportation System (ITS) Strategies Various ITS strategies are being considered in the Tri-Cities area. These strategies help provide driver guidance, time and synchronize signals, and indicate roadway congestion to a control center. Table 9 Strategies to Improve ITS Operations ITS Strategies Regional Multi-Modal Traveler Information/Assistance Benefit Websites to allow drivers to check roadway conditions before getting on the roadway. Also allows dynamic ridesharing. Transportation Management Centers (TMC) allow surveillance of roadways. Implementation Costs and Time Estimates Costs depend on the type of system. Web-based services can be relatively cheap and easy, while TMCs require a lot of equipment and coordination. Electronic Toll Collection Makes toll system more efficient. Higher capital costs. Incident Management System Railroad Grade Crossing System Reduces time to respond to accidents and breakdowns. Leads reduction in lane blockage and rubbernecking. Provides warning for train crews of obstruction on the tracks. Vehicle Proximity Alert System Large trucks/buses alerted of approaching train. Moderate to long time- table. Costs range depending on the coverage and service times (some focus on peak hour only). Can be relatively quick to implement depending on availability of equipment. Moderate to high costs to implement. Moderate implementation time. Source: A Toolbox for Alleviating Traffic Congestion and Enhancing Mobility, ITE
44 Transportation Demand Management (TDM) Strategies Various TDM strategies attempt to reduce the amount of vehicles on the roadway during peak travel periods by encouraging ride-sharing and the use of mass transit, as well as traveling during off-peak hours. TDM strategies are most effective in large agencies or organizations, however successful regional programs have been developed that match commuters that originate from the same residential areas to like employment centers. Table 10 TDM Strategies TDM Strategies Site-Specific Alternative hours of Travel (Flex-time) Assistance Programs (Help to make other TDM more successful) Benefit Reduce costs to individual commuters, lower energy consumption, reduce congestion, lower capital costs for employers and improve air quality. Alone will probably not have large impact on congestion. These programs can be coordinated with the Ridefinders program being used by the Richmond MPO. Removes vehicles from roadway network during the most congested times. May also reduce congestion at entrances to employment centers. Many employers show decrease in sick time and overtime costs after instituting program. Guaranteed rides, van-lease programs employer recognition or subsidies, strong marketing of the TDM strategies all help the TDM be more successful. Implementation Costs and Time Estimates Relatively cheap and easy to implement but that does not guarantee success. Success depends on employer support and employee willingness to participate. Low cost. Short time table. May have problems implementing where unions are involved. Low to moderate costs to implement. Short implementation time. Source: A Toolbox for Alleviating Traffic Congestion and Enhancing Mobility, ITE
45 9.3 Programs to Improve Mobility and Decrease Congestion There are various Transportation Initiatives that have been proposed for the Tri-Cities/ Richmond urban area. Representative projects are listed below. These projects are intended to improve mobility while not focusing on roadway capacity enhancements. Reports on these projects are included in Appendix D ITS Activities in the Region Several programs are currently underway to improve mobility and decrease congestion. In addition to TIP projects that were discussed in Section 9.1 and listed in Appendix C, various other projects are currently underway. VDOT is currently working on a variety of ITS projects. The description below is a outline of ITS activities provided by VDOT. The ITS program began in 1996 with a Federally sponsored study that investigated the use of technology within the Richmond/Tri-Cities region. The study recommended the development of a regional 24-hour operations center to manage freeway traffic. This concept was accelerated due to major bridge reconstruction projects on I-95. VDOT s Richmond District Smart Traffic Center (STC) became a 24 hour/7 day operation on March 5, The STC has become the focal point for all ITS activities in Central Virginia. It serves as a hub for information related to activities that affect traffic on the interstate highways. The STC operates and maintains electronic signs, radios, video cameras, and detectors to monitor freeways and alert travelers to abnormal traffic conditions. Normal traffic patterns throughout Central Virginia require VDOT to approach the Richmond and Tri-Cities regions collectively from a traffic management standpoint. In many cases, a major accident in one region forces VDOT to divert traffic in neighboring jurisdictions. Since many local and city streets are not under VDOT control, the appropriate jurisdictions must be contacted immediately so they may institute their preplanned strategies. Improved incident coordination is a continuing goal for STC personnel. In the long run, these low-tech activities may play the largest role in reducing accident related delays in the region. ITS elements in the Tri-Cities region will focus initially on the interstate highways. Within the past year, a new variable message sign has been installed on I-85 northbound in Dinwiddie County. Also, a new video camera has been installed at the I-95/Temple Ave. interchange in Colonial Heights. In the next year, VDOT hopes to install a traffic monitoring station at the I-295/I-95 junction in Prince George County. This station will provide the STC real-time data to monitor traffic flow at this key regional diversion point. In addition to its technology duties, the STC provides many other transportation services in the Richmond/Tri-Cities region. By working with the Virginia State Police and local police departments, STC staff is able to dispatch VDOT crews to assist with emergency 37
46 situations like high water, roadway debris, and accident cleanup. The STC helps with traffic management during major weather events like snow or hurricanes as well as during special events such as NASCAR races. Staff also keeps media outlets informed of abnormal traffic conditions. Finally, the STC coordinates VDOT Richmond District response to Amber Alert situations. VDOT works with the Crater Planning District Commission as well as the Richmond Regional PDC to plan and implement ITS strategies. As proven in other U.S. metropolitan areas, the benefits of transportation technologies are maximized when approached from a regional perspective. The operation and maintenance of the Richmond/Tri-Cities Smart Traffic Center (and all associated roadway assets) receive funding through VDOT's maintenance budget. New field equipment is currently funded through the VDOT Six Year Improvement Program (SYIP from Federal NHS funds). The development of the STC itself and the control room hardware/software was also funded through the SYIP. Future ITS improvements will probably be funded in a similar fashion. Since VDOT s maintenance budget funds operations and maintenance cost, VDOT has limited expansion of ITS systems to those assets VDOT can afford to maintain. VDOT is basically looking to complete a regional architecture for each VDOT District around the state. Three to four Districts are completed and Richmond was originally slated to be completed this year. VDOT has been using Federal SPR funds to complete the studies. Richmond Regional ITS Architecture will be delayed due to funding shortages Job Access and Reverse Commute Program The TIP reports that Section 3037 of the Transportation Equity Act for the 21 st Century (TEA-21) provides competitive grants to existing fixed-based transit operators such as PAT for new job related transportation services. Individuals whose family income is at or below 150 percent of the poverty line qualify for these transportation services. A Job Access Transportation Program Committee for the Crater Region has been formed. The membership of this Committee includes representatives from the State employment agency, the local workforce investment board, PAT, a community college and CPDC staff. PAT has filed a letter of intent to apply for Section 3037 funding for the next Job Access and Reverse Commute Program grant cycle. It is anticipated PAT will apply for additional funding for subsequent years under this program. The Job Access and Reverse Commute Plan for the Crater Region is being updated. It is anticipated that PAT will implement phased projects under this program in selected portions of the urbanized and rural areas of the Crater Planning District. Proposed multi-year capital and operating projects under the Section 3037 program are listed in this document. 38
47 Section 3037 of the Transportation Equity Act for the 21 st Century (TEA-21) provides competitive grants to existing fixed-based transit operators such as PAT for new job related transportation services. Individuals whose family income is at or below 150 percent of the poverty line qualify for these transportation services. 39
48 10. Evaluation of the Effectiveness of Implemented Strategies After CMS strategies have been implemented, continued monitoring of the transportation network is necessary to determine the effectiveness of the strategies. It will be necessary to review the CMS network database, a process explained in Section 6 - Data Collection and System Monitoring. The efforts of the MPO to relieve congestion in the region can be monitored using the SHiPs database and other tools described throughout this report. It is through this process that the MPO will be able to determine if the congestion relief strategies it has recommended are truly making a positive impact on the region s transportation system. By monitoring the results of CMS activities, the MPO will be prepared to make necessary adjustments to the components of the CMS when the system is reviewed each year. Data collection efforts may need to be revised or expanded in order to meet the needs of decision-makers. As new congestion relief strategies are realized, they should be added to the list of strategies in the CMS to provide more alternatives for evaluation. The CMS is a working document that should change to meet the current needs of the Tri-Cities area. The update of the CMS database, noting the changes deemed necessary, and the inclusion of the identified and projected traffic congestion as documented in this report will be tracked. Every three years the Tri-Cities MPO will provide the CMS Operations Plan, documenting CMS efforts and their effectiveness and discussing the status of congestion management activities. Any background data developed in the evaluation of projects and alternatives will also be included along with the annual update of the CMS. 40
49 Appendices Appendix A: Vehicle Occupancy Survey Results Appendix B: 1997 & 2003 CMS Screening Results Appendix C: Transportation Improvement Plan (TIP) Appendix D: Tri-Cities Area Summary of Congestion Management Initiatives 41
50 APPENDIX A: Vehicle Occupancy Survey Results A - 1
51 A - 2
52 A - 3
53 A - 4
54 A - 5
55 APPENDIX B: 1997 and 2003 CMS Operations Plan Screening Results B - 1

56 Source: Tri-Cities 1997 CMS Operations Plan B - 2

57 Source: Tri-Cities 1997 CMS Operations Plan B - 3
 Freeways B - 4")
58 2003 CMS Screening Results (Based on VDOT 2003 ShiPs Data) Freeways B - 4


59 Rural Two-Lane Rural Multi-Lane Arterials B - 5
 B")
60 Arterials (continued) B - 6
TRI-CITIES AREA YEAR 2031 TRANSPORTATION PLAN. June 2008 TRI-CITIES AREA METROPOLITAN PLANNING ORGANIZATION
 TRI-CITIES AREA YEAR 2031 TRANSPORTATION PLAN June 2008 TRI-CITIES AREA METROPOLITAN PLANNING ORGANIZATION 1964 WAKEFIELD STREET PETERSBURG, VIRGINIA 23805 www.craterpdc.state.va.us The contents of this
FLORIDA DEPARTMENT OF TRANSPORTATION PROCEDURE DEVELOPMENT OF THE
 FLORIDA DEPARTMENT OF TRANSPORTATION PROCEDURE DEVELOPMENT OF THE FLORIDA INTRASTATE HIGHWAY SYSTEM Topic No.: 525-030-250-f Office: Systems Planning Effective Date: May 16, 2002 DEVELOPMENT OF THE FLORIDA
Congestion Management Process (CMP)
") Congestion Management Process (CMP) Introduction The Congestion Management Process (CMP) is a systematic, data-driven, and regionally accepted approach that aims to improve the performance of the transportation
Congestion Management Process (CMP) Introduction The Congestion Management Process (CMP) is a systematic, data-driven, and regionally accepted approach that aims to improve the performance of the transportation
Appendix O Congestion Management Program REGIONAL TRANSPORTATION PLAN/SUSTAINABLE COMMUNITIES STRATEGY
 Appendix O Congestion Management Program REGIONAL TRANSPORTATION PLAN/SUSTAINABLE COMMUNITIES STRATEGY 2014 REGIONAL CONGESTION MANAGEMENT PROGRAM 2014 RTP/SCS APPENDIX O SAN JOAQUIN COUNCIL OF GOVERNMENTS
Proposed Comprehensive Update to the State of Rhode Island s Congestion Management Process
 Proposed Comprehensive Update to the State of Rhode Island s Statewide Planning Program January 2018 Summary Outline of of Action Steps 1. Develop Objectives for Congestion Management What is the desired
GUIDE FOR THE PREPARATION OF TRAFFIC IMPACT STUDIES
 GUIDE FOR THE PREPARATION OF TRAFFIC IMPACT STUDIES Adopted by Town Council on November 25, 2008 Prepared By: HNTB Engineering Department Planning Department TABLE OF CONTENTS I. INTRODUCTION... 1 II.
MOTOR MPO CONGESTION MANAGEMENT PROCESS (CMP)
") MOTOR MPO CONGESTION MANAGEMENT PROCESS (CMP) Background: Metropolitan Planning Organizations that have been designated as a Transportation Management Area (TMA) are required to develop a Congestion Management
MOTOR MPO CONGESTION MANAGEMENT PROCESS (CMP) Background: Metropolitan Planning Organizations that have been designated as a Transportation Management Area (TMA) are required to develop a Congestion Management
Congestion Management Process 2013 Update
 OVERVIEW OF THE DALLAS-FORT WORTH CONGESTION MANAGEMENT PROCESS Traffic Congestion In The Dallas-Fort Worth Region With the Dallas-Fort Worth (DFW) urban area as its center, the North Central Texas region
10.0 Congestion Management Process
 Livability 2040 Regional Transportation Plan 10-1 10.0 Congestion Management Process 10.1 CMP Summary The identification and evaluation of projects for the Livability 2040 Regional Transportation Plan
Chapter 3 - Goals, Objectives, & Strategies
 Chapter 3 - This chapter presents goals, objectives, and strategies that have been developed as part of the Richmond Area MPO 2026 Long-Range Transportation Plan (LRTP) update. Strategies have been developed
Regional Performance Measures Annual Progress Report TPO Board - 2/4/2016 Presentation by: Chris Wichman, Senior Planner
 2015 TPO Board - 2/4/2016 Presentation by: Chris Wichman, Senior Planner Overview History and definition of performance-based planning & programming Review of 2015 TPO Board Action Requested 2 History
Congestion Management Process 2013 Update
 Congestion Management Process 2013 Update TRAVEL DEMAND MANAGEMENT AND TRANSPORTATION SYSTEM MANAGEMENT AND OPERATIONS STRATEGIES AND PROJECTS TDM and TSM&O Strategies Commuter Transportation Options Associated
APPENDIX B. Public Works and Development Engineering Services Division Guidelines for Traffic Impact Studies
 APPENDIX B Public Works and Development Engineering Services Division Guidelines for Traffic Impact Studies Revised December 7, 2010 via Resolution # 100991 Reformatted March 18, 2011 TABLE OF CONTENTS
Corpus Christi Metropolitan Transportation Plan Fiscal Year Introduction:
 Introduction: Traffic congestion in the Corpus Christi Metropolitan area is not as much a function of population growth as the function of the increase in single occupant trips. Using census data, the
Appendix D Functional Classification Criteria and Characteristics, and MnDOT Access Guidance
 Appendix D Functional Classification Criteria and Characteristics, and MnDOT Access Guidance Functional classification identifies the role a highway or street plays in the transportation system. Some highways
Appendix O Level of Service Standard and Measurements
 July 8, 2016 Appendix O. Appendix O Standard and Measurements Definition Level of service (LOS) is a mechanism used to determine how well a transportation facility is operating from a traveler s perspective.
Congestion Management Process Update
 report Congestion Management Process Update prepared for Houston-Galveston Area Council prepared by Cambridge Systematics, Inc. 10415 Morado Circle, Building II, Suite 340 Austin, TX 78759 with Alliance
6.0 CONGESTION HOT SPOT PROBLEM AND IMPROVEMENT TRAVEL DEMAND MODEL ANALYSIS
 6.0 CONGESTION HOT SPOT PROBLEM AND IMPROVEMENT TRAVEL DEMAND MODEL ANALYSIS 6.1 MODEL RUN SUMMARY NOTEBOOK The Model Run Summary Notebook (under separate cover) provides documentation of the multiple
Appendix D: Functional Classification Criteria and Characteristics, and MnDOT Access Guidance
 APPENDICES Appendix D: Functional Classification Criteria and Characteristics, and MnDOT Access Guidance D.1 Functional classification identifies the role a highway or street plays in the transportation
Transform 66 Multimodal Project: Prioritization Process and Evaluation Criteria Approved March 3, 2016
 Transform 66 Multimodal Project: Prioritization Process and Evaluation Criteria Approved March 3, 2016 The Memorandum of Agreement (MOA) for the Transform 66: Inside the Beltway Project directs NVTC to
PROJECT SUBMISSION FORM
 PROJECT SUBMISSION FORM Basic Project Information CEID 1182 1. Submitting Agency: MDOT/State Highway Administration 2. Secondary Agency: 3. Agency Project ID: 4. Project Type: Interstate Primary Secondary
MONITORING IMPLEMENTATION AND PERFORMANCE
 12 MONITORING IMPLEMENTATION AND PERFORMANCE The FAST Act continues the legislation authorized under MAP-21, which created a data-driven, performance-based multimodal program to address the many challenges
Final Congestion Management Process
 Final Congestion Management Process 2015 Prepared by Tulare County Association of Governments 210 N. Church St., Suite B Visalia, California 93291 1. Introduction: What Is Congestion? Congestion can generally
8: Transportation Demand &
 GPATS Long-Range Transportation Plan 8: Transportation Demand & Emerging Technologies INTRODUCTION The transportation systems of cities, states, and nations are undergoing a period of transformation. As
Transportation Problems and Issues Excerpts from WWW Links
 Transportation Problems and Issues Excerpts from WWW Links Reference Bok, D. (2018). Transportation policy and planning. https://www.hks.harvard.edu/courses/transportation-policy-and-planning Transportation
Updating Virginia s Statewide Functional Classification System. Briefing to MPOs, PDCs, and Local Governments
 Updating Virginia s Statewide Functional Classification System Briefing to MPOs, PDCs, and Local Governments October 15 & 19, 2012 Functional Class 101 Shelton s FC Game Research Phase Today s Review New
CITY OF JACKSONVILLE 2030 MOBILITY PLAN STUDY UPDATE GOALS, OBJECTIVES, AND PERFORMANCE MEASURES PREPARED FOR: CITY OF JACKSONVILLE
 CITY OF JACKSONVILLE 2030 MOBILITY PLAN STUDY UPDATE GOALS, OBJECTIVES, AND PERFORMANCE MEASURES 3.20.2017 PREPARED FOR: CITY OF JACKSONVILLE 55 Railroad Row White River Junction, VT 05001 802.295.4999
SECTION II CONTROLLED ACCESS FACILITIES
 SECTION II CONTROLLED ACCESS FACILITIES SYSTEM IDENTIFICATION A critical component of the Dallas-Fort Worth (DFW) Metropolitan Transportation System is the regional freeway and tollway systems, which are
CONGESTION MANAGEMENT PROCESS (CMP) WEST MEMPHIS MPO
 WEST MEMPHIS MPO") CONGESTION MANAGEMENT PROCESS (CMP) WEST MEMPHIS MPO INTRODUCTION This policy document of the West Memphis Metropolitan Planning Organization (MPO) provides the framework to carryout the CMP in the West
CONGESTION MANAGEMENT PROCESS (CMP) WEST MEMPHIS MPO INTRODUCTION This policy document of the West Memphis Metropolitan Planning Organization (MPO) provides the framework to carryout the CMP in the West
Section 11: Transportation Strategies Toolbox
 Section 11: Transportation Strategies Toolbox A transportation strategies toolbox was developed to provide a systematic approach to identify potential strategies that address corridor transportation needs.
4.9 TRANSPORTATION AND CIRCULATION
 4.9 TRANSPORTATION AND CIRCULATION 4.9 TRANSPORTATION AND CIRCULATION This section describes the current transportation setting for and generally assesses the impacts of future dairy development on the
DIVISION I TRAFFIC IMPACT STUDY GUIDELINES ENGINEERING STANDARDS
 CITY OF ALBANY DEPARTMENT OF PUBLIC WORKS DIVISION I TRAFFIC IMPACT STUDY GUIDELINES ENGINEERING STANDARDS Prepared By PUBLIC WORKS DEPARTMENT ALBANY, OREGON 97321 Telephone: (541) 917-7676 TABLE OF CONTENTS
MOBILITY AND ALTERNATIVES ANALYSIS
 6 MOBILITY AND ALTERNATIVES ANALYSIS BACK OF SECTION DIVIDER 6.0 Mobility and Alternatives Analysis Travel demand analysis provides a framework for the identification of transportation facilities and services
2030 Transportation Policy Plan SUMMARY PRESENTATION. Land Use Advisory Committee November 15, 2012
 2030 Transportation Policy Plan SUMMARY PRESENTATION Land Use Advisory Committee November 15, 2012 Today s Topics Transportation Policy Plan (TPP) Requirements and Background Current TPP Policies, Issues
Traffic Impact Study Guidelines. City of Guelph
 Traffic Impact Study Guidelines City of Guelph April 2016 Engineering and Capital Infrastructure Services Infrastructure, Development & Enterprise 1 Carden Street Guelph, Ontario Canada N1H 3A1 Page 1
Dated: January 2015 TRANSPORTATION IMPACT STUDY GUIDELINES
 Dated: January 2015 TRANSPORTATION IMPACT STUDY GUIDELINES TABLE OF CONTENTS 1.0 Introduction.. 2 1.1 Transportation Impact Study...... 2 1.2 Need and Justification... 2 1.3 Purpose of Guidelines... 2
ACTIVE TRANSPORTATION ADVISORY COMMITTEE. Memphis MPO March 30, 2015
 ACTIVE TRANSPORTATION ADVISORY COMMITTEE Memphis MPO March 30, 2015 Agenda Welcome & Introductions Announcements and Briefings Livability 2040: Regional Transportation Plan Congestion Management Process
Traffic Impact Study Requirements
 [TYPE THE COMPANY NAME] Traffic Impact Study Requirements County of San Mateo Department of Public Works Roadway Services 9/1/2013 I. Introduction The County of San Mateo (County), Department of Public
TRAFFIC & TRANSPORTATION COMMISSION AGENDA REPORT
 TRAFFIC & TRANSPORTATION COMMISSION AGENDA REPORT AGENDA ITEM #4 T/T MTG: 092616 DATE: SEPTEMBER 26, 2016 TO: TRAFFIC & TRANSPORTATION COMMISSION FROM: BENJAMIN CHAN, P.E, T.E., DEPUTY PUBLIC WORKS DIRECTOR
Recommended Roadway Plan Section 3 Existing Facilities & System Performance
 Recommended Roadway Plan Section 3 Existing Facilities & System Performance RECOMMENDED ROADWAY PLAN SECTION 3 Existing Facilities and System Performance 3.1 Introduction An important prerequisite to transportation
Grottoes. Transportation Plan. Transportation Planning Division. Virginia Department of Transportation
 2020 Transportation Plan Developed by the Transportation Planning Division of the Virginia Department of Transportation in cooperation with the U.S. Department of Transportation, Federal Highway Administration
RESOLUTION NO
 RESOLUTION NO. 2018-12 RESOLUTION OF THE SOUTHEASTERN WISCONSIN REGIONAL PLANNING COMMISSION AMENDING THE TRANSPORTATION IMPROVEMENT PROGRAM FOR SOUTHEASTERN WISCONSIN: 2017-2020 WHEREAS, the Southeastern
ATTACHMENT A. Detailed Study Scope. I-66 (Inside) Multi-modal Study Scope
 Multi-modal Study Scope") ATTACHMENT A Detailed Study Scope I-66 (Inside) Multi-modal Study Scope EXECUTIVE SUMMARY The Virginia Department of Transportation (VDOT) seeks consultant assistance in identifying and evaluating a range
ATTACHMENT A Detailed Study Scope I-66 (Inside) Multi-modal Study Scope EXECUTIVE SUMMARY The Virginia Department of Transportation (VDOT) seeks consultant assistance in identifying and evaluating a range
Chapter Five: Transportation
 Chapter Five: Transportation Purpose and Intent Transportation Goals and Policies Land Use Assumptions Airway Heights Transportation System Facilities and Services Pedestrian Transportation Public Transportation
Association for Commuter Transportation Recommendations to USDOT on MAP-21 Performance Measures
 Association for Commuter Transportation 1341 G Street, NW, 10th Floor Washington, DC 20005 Tel: 202.719.5331 www.actweb.org Association for Commuter Transportation Recommendations to USDOT on MAP-21 Performance
APPENDIX H: TRAVEL DEMAND MODEL VALIDATION AND ANALYSIS
 APPENDIX H: TRAVEL DEMAND MODEL VALIDATION AND ANALYSIS Travel demand models (TDM) simulate current travel conditions and forecast future travel patterns and conditions based on planned system improvements
VDOT and DRPT MPO and PDC Winter Meeting Amy Inman Planning & Mobility Programs Administrator Virginia Department of Rail and Public Transportation
 VDOT and DRPT MPO and PDC Winter Meeting Amy Inman Planning & Mobility Programs Administrator Virginia Department of Rail and Public Transportation www.drpt.virginia.gov 1 DRPT Customers 54 Transit Systems
Appendix L Greenhouse Gas 4-part Strategy
 Appendix L Greenhouse Gas 4-part Strategy Supplementary information regarding options for further reducing greenhouse gas emissions in the Puget Sound region State and Federal Greenhouse Gas Emissions
Database and Travel Demand Model
 Database and Travel Demand Model 7 The CMP legislation requires every CMA, in consultation with the regional transportation planning agency (the Metropolitan Transportation Commission (MTC) in the Bay
MARC Congestion Management Process Policy
 MARC Congestion Management Process Policy Adopted by the MARC Board of Directors on May 24, 2011 Background Traffic congestion can be generally defined as a condition where the volume of users on a transportation
2 Purpose and Need. 2.1 Study Area. I-81 Corridor Improvement Study Tier 1 Draft Environmental Impact Statement
 2 Purpose and Need 2.1 Study Area Interstate 81 (I-81) is relied upon for local and regional travel and interstate travel in the eastern United States. It extends 855 miles from Tennessee to New York at
9. TRAVEL FORECAST MODEL DEVELOPMENT
 9. TRAVEL FORECAST MODEL DEVELOPMENT To examine the existing transportation system and accurately predict impacts of future growth, a travel demand model is necessary. A travel demand model is a computer
Unified Corridor Investment Study Performance Dashboard
 Unified Corridor Investment Study Performance Dashboard October 2018 Project Description Three parallel routes - Highway 1, Soquel/Freedom and the Santa Cruz Branch Rail Line - link the communities along
CHAPTER 6 PERFORMANCE PLANNING. Performance-Based Planning and Programming
 (Geoff Livingston/Flickr) CHAPTER 6 PERFORMANCE PLANNING The TPB has championed improvements in the ways the region s transportation system is managed and operated. This chapter describes the purpose of
Chapter #9 TRAVEL DEMAND MODEL
 Chapter #9 TRAVEL DEMAND MODEL TABLE OF CONTENTS 9.0 Travel Demand Model...9-1 9.1 Introduction...9-1 9.2 Overview...9-1 9.2.1 Study Area...9-1 9.2.2 Travel Demand Modeling Process...9-3 9.3 The Memphis
Contents. Introduction 1
 Contents Introduction 1 Pg. 01 Traffic congestion impacts how easy - or not - it is to get around. While traffic will grow as more people and jobs move to the Alamo Area, we can and should try to manage
CHAPTER 2: MODELING METHODOLOGY
 CHAPTER 2: MODELING METHODOLOGY 2.1 PROCESS OVERVIEW The methodology used to forecast future conditions consisted of traditional traffic engineering practices and tools with enhancements to more accurately
SECTION III - REGIONAL ARTERIAL SYSTEM. The Regional Arterial System is a subcomponent of a broader regional thoroughfare system.
 SECTION III - REGIONAL ARTERIAL SYSTEM SYSTEM IDENTIFICATION The Regional Arterial System is a subcomponent of a broader regional thoroughfare system. The NCTCOG Regional Thoroughfare Plan (RTP) recognizes
TRANSPORTATION RELATIONSHIP TO OTHER ELEMENTS OF THE PLAN AND COUNTY REGULATIONS VISION FOR TRANSPORTATION PLANNING ROAD NETWORK SECTION 7
 TRANSPORTATION Like many growing western counties, Douglas County focuses on one of the most integral elements in land-use planning: transportation. The primary purpose of a transportation network is to
Technical Briefing Report
 Technical Briefing Report March 2007 CONGESTION MANAGEMENT PROCESS (CMP) The Congestion Management Process (CMP) seeks a management solution to a growing traffic problem by targeting resources to operational
Under recently updated FHWA guidelines, the LRTP must be updated every four (4) years. The most recent LRTP is the 2035 Plan, adopted in early 2009.
 years. The most recent LRTP is the 2035 Plan, adopted in early 2009.") PLANS, POLICIES AND PROCESSES OF THE MPO The Winston-Salem Urban Area MPO is responsible for creating and maintaining many documents essential to the on-going transportation planning effort. These documents
PLANS, POLICIES AND PROCESSES OF THE MPO The Winston-Salem Urban Area MPO is responsible for creating and maintaining many documents essential to the on-going transportation planning effort. These documents
City of Menifee. Public Works Department. Traffic Impact Analysis Guidelines
 Public Works Department Traffic Impact Analysis Guidelines Revised: August 2015 TABLE OF CONTENTS INTRODUCTION... 3 PURPOSE... 3 EXEMPTIONS... 3 SCOPING... 4 METHODOLOGY... 5 STUDY AREA... 6 STUDY SCENARIOS...
CHAPTER 2. VISION, GOALS AND MTP FRAMEWORK
 CHAPTER 2. VISION, GOALS AND MTP FRAMEWORK MTP VISION In order to create a framework for the 2040 Metropolitan Transportation Plan (MTP), a vision statement was drafted by the Vision/Goals Committee and
EXAMPLES OF COMPREHENSIVE PLAN POLICIES HOW TO ESTIMATE THE BENEFITS OF THE CTR PROGRAM
 TABLE OF CONTENTS INTRODUCTION... I BACKGROUND OF THE COMMUTE TRIP REDUCTION EFFICIENCY ACT... II MAKING THE CONNECTION BETWEEN COMMUTE TRIP REDUCTION AND THE GROWTH MANAGEMENT ACT... IV CTR PLANNING AND
Pasco County MPO: Congestion Management Process PROCEDURES HANDBOOK
 : Congestion Management Process PROCEDURES HANDBOOK Final: March 2016 TABLE OF CONTENTS CONGESTION MANAGEMENT PROCEDURES HANDBOOK OVERVIEW... i Chapter 1: INTRODUCTION... 1-1 Causes of Congestion... 1-2
The Policies section will also provide guidance and short range policies in order to accomplish the goals and objectives.
 4 Goals & Objectives INTRODUCTION The 2015-2040 MTP preserves and promotes the quality of life and economic prosperity of the MAB by providing a transportation system consistent with the regional goals.
Updated Traffic Impact Analysis Regulations Administrative Guidelines
 Updated Traffic Impact Analysis Regulations Administrative Guidelines 24VAC30-155 January 2012 Land Development Section Transportation and Mobility Planning Division Virginia Department of Transportation
GUIDING PRINCIPLES MEMORANDUM
 M E T R O P O L I TAN TRA NS P O RTATI O N PLAN GUIDING PRINCIPLES MEMORANDUM El Paso Metropolitan Planning Organization INTRODUCTION The guiding principles for development of the El Paso MPO s Destino
Updating Virginia s Statewide Functional. Brad Shelton, VDOT Chris Detmer, VDOT Ben Mannell, VDOT
 Updating Virginia s Statewide Functional Classification System Brad Shelton, VDOT Chris Detmer, VDOT Ben Mannell, VDOT July 18, 2013 What is Functional Classification Use of Functional Classification Today
Houston Galveston Area Council Congestion Management Process
 Houston Galveston Area Council Congestion Management Process APPENDIX G of the 2035 Regional Transportation Plan Update Prepared for: Houston-Galveston Area Council Transportation Department 3555 Timmons
Performance Dashboard
 Unified Corridor Investment Study Performance Dashboard Step 2 Analysis Results DRAFT Revised 11/08/18 October 2018 Project Description Three parallel routes - Highway 1, Soquel/Freedom and the Santa Cruz
CHAPTER 8 TRANSPORTATION ELEMENT
 CHAPTER 8 TRANSPORTATION ELEMENT Section 8.01 Purpose: The purpose of this Chapter (element) is to establish the desired and projected transportation system within Niceville and to plan for future motorized
EIGHT PLANNING FACTORS
 EIGHT PLANNING FACTORS Under the provisions of SAFETEA-LU, all Metropolitan Planning Organizations (MPOs) are required to consider eight (8) broad planning factors in the development of multi-modal transportation
ARROWS RANSPORTATION LAN
 ARROWS RANSPORTATION LAN Developed by the Transportation Planning Division Of the Virginia Department of Transportation In Cooperation With The U.S. Department Of Transportation, Federal Highway Administration
Updated Traffic Impact Analysis Regulations Administrative Guidelines
 Updated Traffic Impact Analysis Regulations Administrative Guidelines 24VAC30-155 April 2013 Land Development Section Transportation and Mobility Planning Division Virginia Department of Transportation
CHAPTER 1: INTRODUCTION/ GOALS AND OBJECTIVES
 CHAPTER 1: INTRODUCTION/ GOALS AND OBJECTIVES 1.1: INTRODUCTION ABOUT THE FREDERICKSBURG AREA METROPOLITAN PLANNING ORGANIZATION (FAMPO) Established in 1992, the Fredericksburg Area Metropolitan Planning
HB2 Implementation Policy Guide
 report HB2 Implementation Policy Guide prepared for Commonwealth Transportation Board date August 1, 2015 6.0 Appendix A: Safety Measures Table 6.1 Safety Factor Measures Summary ID Measure Name Weight
Performance Dashboard
 Unified Corridor Investment Study Performance Dashboard Step 2 Analysis Results DRAFT Revised 10/15/18 October 2018 Project Description Three parallel routes - Highway 1, Soquel/Freedom and the Santa Cruz
The TIS is to be signed and sealed by a Florida Registered Professional Engineer.
 CHAPTER 900. SECTION 901. DEVELOPMENT STANDARDS INFRASTRUCTURE STANDARDS 901.5. Transportation Impact Study A. Intent and Purpose The intent and purpose of the Traffic Impact Study (TIS) is to identify
City of Berkeley. Guidelines for Development of Traffic Impact Reports
 Office of Transportation (OOT) City of Berkeley Guidelines for Development of Traffic Impact Reports Office of Transportation, City of Berkeley 1 1. Overview These guidelines provide a framework to help
Technical Memorandum MULTIMODAL NEEDS. Prepared for: Oklahoma Department of Transportation. Prepared by:
 Technical Memorandum MULTIMODAL NEEDS Prepared for: Oklahoma Department of Transportation Prepared by: May 2015 Technical Memorandum The Technical Memos were written to document early research for the
Appendix E. Congestion Management Process. Congestion Management Process
 November 2017 Appendix E Congestion Management Process Maintenance of a Congestion Management Process (CMP) is a requirement for all Metropolitan Planning Organizations (MPOs) in Transportation Management
TRANSPORTATION PROJECT REPORT DRAFT CONCEPTUAL ACCESS MODIFICATION PROPOSAL OCTOBER 2002
 TRANSPORTATION INTERSTATE 87 INTERCHANGE 11A TOWN OF MALTA SARATOGA COUNTY, NY DRAFT CONCEPTUAL ACCESS MODIFICATION PROPOSAL OCTOBER 2002 PROJECT REPORT NEW YORK STATE DEPARTMENT OF TRANSPORTATION JOSEPH
Technical Report 4: Congestion Management Process. Final Adopted Plan January 2016
 Long Range Transportation Plan Technical Report : Congestion Management Process Final Adopted Plan January South Orange Avenue, Suite, Orlando, FL -- www.metroplanorlando.com MetroPlan Orlando @metroplan_orl
Congestion Management Process in the US A Federal Requirement
 Congestion Management Process in the US A Federal Requirement ITS Argentina November 6, 2013 U.S. Department of Transportation Federal Highway Administration Outline of Seminar Discussion of Congestion
Alternatives Evaluation Methodology
 Alternatives Evaluation Methodology www.vision54 56.com B 1 Phase 2 Alternatives Evaluation Methodology PASCO COUNTY METROPOLITAN PLANNING ORGANIZATION 8731 Citizens Drive New Port Richey, FL 34654 Ph
KAW CONNECTS EXECUTIVE SUMMARY
 Executive Summary Page E-1 Introduction KAW CONNECTS EXECUTIVE SUMMARY The Kansas Department of Transportation (KDOT) and the Kansas Turnpike Authority (KTA) have both recognized the need to plan for the
The Role of Transportation Systems Management & Operations in Supporting Livability and Sustainability
 The Role of Transportation Systems Management & Operations in Supporting Livability and Sustainability Michael Grant, ICF International February 7, 2012 NTOC Webinar Highlights of FHWA/FTA Primer Background:
3. STATION SPACING AND SITING GUIDELINES
 3. STATION SPACING AND SITING GUIDELINES The station spacing and siting guidelines are summarized in Table 3-1. Table 3-1 also includes benchmark information for local transit service and express bus as
Evaluation of Alternatives
 Chapter 9.0 Evaluation of Alternatives Chapter 9.0 provides a summary evaluation of the No Build Alternative and the Preferred Alternative. The evaluation contained within this chapter is an assessment
APPENDIX D. Glossary D-1
 APPENDIX D Glossary D-1 Glossary of Transportation Planning Terms ANNUAL AVERAGE DAILY TRAFFIC (AADT): The total number of vehicles passing a given location on a roadway over the course of one year, divided
State Strategies to Reduce Traffic Congestion. National Conference of State Legislatures November, 2007
 State Strategies to Reduce Traffic Congestion National Conference of State Legislatures November, 2007 More People More Freight 40 million more people in last 15 years Highway travel increase 1990-2003,
Functional Classification Comprehensive Guide. Prepared by
 Functional Classification Comprehensive Guide Prepared by June 6, 2014 INTRODUCTION PURPOSE OF DOCUMENT The intent of this document is to provide a comprehensive guide to Virginia Department of Transportation
TRAFFIC STUDY GUIDELINES
 TRAFFIC STUDY GUIDELINES December 2013 The scope of the traffic impact analysis (TIA) should follow these guidelines and the requirements of VMC 11.80.130 and VMC 11.70, transportation concurrency (attached
Performance Measures Workshop, May 18, 2017
 Measuring What Matters: Above and Beyond Requirements Performance Measures Workshop, May 18, 2017 Presentation Overview Background - origin and evolution of the Regional Outcomes Framework. Regional Outcomes
Summary of transportation-related goals and objectives from existing regional plans
 SMTC 2050 Long Range Transportation Plan Appendix A: Summary of transportation-related goals and objectives from existing regional plans SMTC 2050 Long Range Transportation Plan Summary of transportation-related
Peninsula Widening. Project Description. Overview of Project Status. Estimated Total Project Cost $4.7 - $7.3 Billion
 Peninsula Widening SYSTEM: Interstate FROM: I-664 (Hampton Roads) TO: I-95 (Richmond) DESCRIPTION OF WORK: Provide for increased capacity, improve safety standards and minimize roadway geometric and structural
VTrans2040 Multimodal Transportation Plan Corridors of Statewide Significance Needs Assessment Western Mountain Corridor (L)
") VTrans2040 Multimodal Transportation Plan Corridors of Statewide Significance Needs Assessment Western Mountain Corridor (L) 77 Table of Contents I. Corridor Overview Land Use and Demographics Corridor
VTrans2040 Multimodal Transportation Plan Corridors of Statewide Significance Needs Assessment Western Mountain Corridor (L) 77 Table of Contents I. Corridor Overview Land Use and Demographics Corridor
AIR QUALITY AND CLIMATE CHANGE EVALUATION GUIDANCE
 AIR QUALITY AND CLIMATE CHANGE EVALUATION GUIDANCE The following guidance provides additional details regarding the process followed by PSRC to evaluate projects for potential air quality benefits. As
CHAPTER 8. Congestion Management
 CHAPTER 8 Congestion Management CHAPTER 8: Congestion Management The CMP is a management system and process conducted to improve traffic operations and safety through operational improvements and strategies