Memphis and Shelby County. Metropolitan Planning Organization (MPO) Travel Demand Model. Tennessee-Kentucky Model User Group Meeting
|
|
|
- Amberlynn Clarke
- 6 years ago
- Views:
Transcription
1 Memphis and Shelby County Metropolitan Planning Organization (MPO) Travel Demand Model Tennessee-Kentucky Model User Group Meeting October 26, 2006
2 Model Development Team Kimley-Horn and Associates, Inc. Cambridge Systematics HNTB NuStats
3 Model History in Memphis Originally Developed in Late 60s Last Major Model Update was in 1995 Existing Model Parameters Model Boundary Demographic Variables Submodels 1998 Household Travel Survey
4 Review Process Client Review Steering Committee Peer Review Committee
5 Documentation and Meetings 12 Documents 2 Face-to-Face Peer Review Meetings 2 Peer Review Conference Calls 3 Steering Committee Meetings 2 Expert Panel Meetings for Land Use and Demographics Update Meetings with Engineering and Technical Committee monthly
6 New Travel Demand Model Decision to Change Platform GIS Based Program (TransCad) Flexibility in Model Applications Ease of Database Manipulation Reporting Features and Tools Consistency with State and other MPOs
7 Land Use Coverage Traffic Analysis Zones
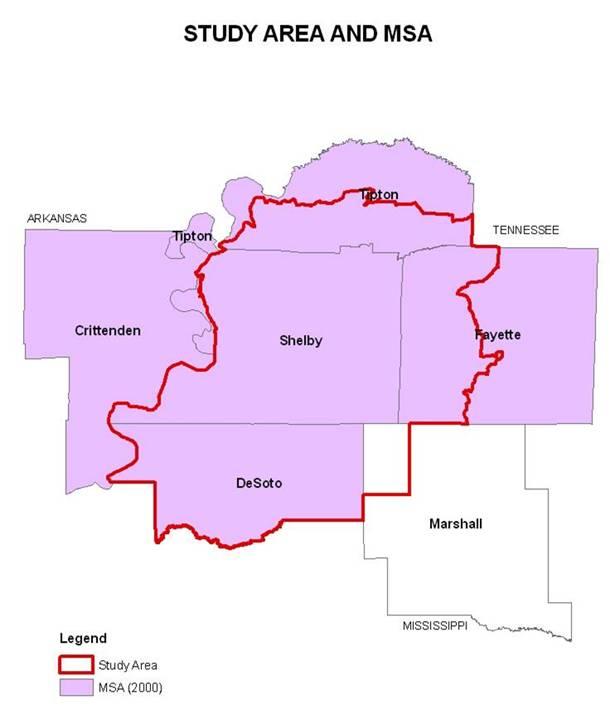
8 Development of TAZ Structure Expansion of Prior Zonal Coverage In the North (Tipton County) In the East (Fayette County) In the South (DeSoto and Marshall Counties) Census TIGER Line Files Geographic Features Transportation Facilities

9 Model Area Boundary
10 Traffic Analysis Zones
11 Development of TAZ Structure Special Generators Census Boundaries Tracts (Suburban/Rural) Block Groups (Urban/Suburban) Blocks (Urban) Centroid Connectors and the Network TAZs in Previous Model: 800 (app) TAZs in Current Model: 1,237
12 Development of Baseline Data Population and Household Variables Used Data from Census 2000 (SF1, SF3) Matched Census Geography to TAZs Employment Variables Used 2000 At-Place Employment Data Reconciled using BLS Grouped into Generalized Industry Categories (NAICS)
13 Development of Baseline Data 2004 Estimation Consultation with Planning Staff Comparison with Available Data (E.G., Building Permits)
14 Typical Model Processes (How the model works) 4-Step Travel Demand Modeling Process Trip Generation (How Many Trips?) Trip Distribution (Where Do You Want to Go?) Mode Choice (How Do You Want to Get There?) Trip Assignment (Which Route?) Data Requirements Base, Future, and Interim Year Models
15 Household Survey Key Features MPO Region Shelby County and Part of Fayette County, TN Part of DeSoto County, MS Memphis MSA (Census 2000 Figures) Ranked 44 Out of All the Other MSAs in Country by Population Population = 1,135,614 :: Households = 424,202 Type of Survey Travel Diaries with Detailed Activities Description One Day, 24-Hour Travel Record for Every HH Member Computer-Aided Interviewing (CATI) Procedures Conducted in 1998 (September-November)

16 Survey Sample # Households = 2,526 # Persons = 6,438 # Trips = 198,519
17
18 Trip Generation Trip Generation Submodels Internal Person Trip Productions and Attractions (P s and A s) External/Internal Vehicle Trips Special Generators Vehicle Availability Model
19 Trip Generation Trip Purposes 9 Internal Trip Purposes Journey to Work Home Based School Home Based University Home Based Shopping Home Based Social-Recreational Home Based Pick-up and Drop-off Home Based Other Non-Home Based Work Non-Home Based Non-Work
20 Vehicle Availability Models Models Multinomial Logit (MNL) Model Ordered Response Logit Model (ORL) Model Inputs Tested HH Characteristics Accessibility, Socio- Demographics (# Persons, # Workers, Income Level Dummies) Validation Validated Census Data Selected Model with Best Performance
21 Multinomial Logit (MNL) Model All Households (HHs) 0 Vehicle HHs Probability 1 Vehicle HHs Prob(n th alt) = Utility Equations: n e max i= 0 U n e U U i n 2 Vehicle HHs = b n0 + nv j= 1 b nj X 3+ Vehicle HHs nj
22 Vehicle Availability Model Coefficients of ordered response logit model Variable 0/1+ 1/2+ 2/3+ Constant Person HH Person HH Worker Workers Workers 1.76 LMed Income HMed Income High Income % Emp w/in 15 min
23 Trip Generation Application Results Trip Purpose Productions Attractions % Diff JTW 783, ,159-10% HBSc 343, ,993 9% HBU 56,147 46,202-18% HBSh 223, ,395 4% HBSR 238, ,492 7% HBPD 207, ,188-3% HBO 612, ,710-1% NHBW 138, ,692 3% NHBNW 512, ,675 12% Total 3,115,313 3,138,506-1%
24 External Trip Generation External-External Trips from Statewide Models External-Internal Trip Generation: E j = AT j D j B where: E j = Number of EI Trips Generated in Internal Zone j T j = Total Internal Trip Attractions Generated in Internal Zone j D j = Distance from Zone j to the Nearest External Station A, B = Model Parameters
25 External Station Classification Expressway Arterial Near Expressway Arterial Not Near Expressway Collector/Local
26 Trip Generation Special Generators Memphis International Airport Graceland Federal Express (Airport Hub)
27
28 Time of Day Model Figure 1. Percent of Trips by Time and Purpose Journey-to-Work Home-Based School/University Home-Based Other Non Home-Based All Trip Purposes Time Period Percent of Trips
29 Time of Day Model Percent of Trips by Purpose Time Period Journey-to- Work HBSchool/ HBUniversity Other Home- Based Purposes Non-Home- Based All Purposes 0:00-1: :00-2: :00-3: :00-4: :00-5: :00-6: :00-7: :00-8: :00-9: :00-10: :00-11: :00-12: :00-13: :00-14: :00-15: :00-16: :00-17: :00-18: :00-19: :00-20: :00-21: :00-22: :00-23: :00-24: Total 100.0% 100.0% 100.0% 100.0% 100.0%
30 Time of Day Model Time of Day Directional Trip Factors (Post-Mode Choice) Trip Purpose Direction AM Peak Midday Peak PM Peak Off-Peak 1 JTW % From Home % To Home HBSchool % From Home % To Home HBUniv % From Home % To Home HBShop % From Home % To Home HBPUDO % From Home % To Home HBSR % From Home % To Home HBO % From Home % To Home NHBW N/A NHBNW N/A
31 Time of Day Model Time of Day External Trip Factors Facility Type Direction AM Peak 1 Interstate 2 Other Principal Arterial Midday Peak PM Peak Off-Peak % of Daily % Inbound % Outbound % of Daily % Inbound % Outbound /8/9 Minor Arterial Collector/ Local % of Daily % Inbound % Outbound % of Daily % Inbound % Outbound
32 Trip Distribution Trip Distribution Model Components Intrazonal Travel Times Terminal Times Primary Destination Choice Intermediate Travel Times
33 Trip Distribution Primary Destination Choice Gravity Model T ij A F = P j ij i n ( A F ) j = 1 j ij Destination Choice Model P i = exp( U j exp( U i ) j )
34 Logit Destination Choice Model Utility of Choosing Destination Zone j = B 1 (impedance ij ) + B 2 ln (size variable) + B 3 (prod or attr zone dummy variable 1) + + B n (prod or attr zone dummy variable n-2)
35 Destination Choice Model for JTW Trips Variable Parameter Estimate Mode Choice Logsum Production-Attraction Dummies Production and Attraction Ends in CBD Production End is Urban Zone and Attraction End is in CBD Production End is Suburban/Rural and Attraction End is in CBD Attraction End Dummies Attraction End is an Urban Zone Attraction End is a Suburban Zone Attraction End is a Rural Zone Production-Attraction Highway Distance Power Series Distance Square of Distance Cube of Distance (Base) Multiplier for Size Variables Size Variables (Coefficients Shown Are Exponents of Estimates) Service Retail Industrial/Manufacturing Wholesale Office Government (Base) Attraction Zone Area in Square Miles
36 Destination Choice Model for NHBW Trips Variable Parameter Estimate Mode Choice Logsum 0.32 Attraction End Dummies Attraction End is a CBD/Urban Zone Attraction End is a Suburban Zone Production-Attraction Highway Distance Power Series Distance Square of Distance Cube of Distance Natural Log (Non-Home Based Work Modeled Attractions) 0.71
37 Journey to Work Stops Model Number of Stops Variable Constant Home-to-work chain vehicle household vehicle household vehicle household Presence of kids in household
38 Avg. Travel Time Comparison Purpose Model (min) Observed (min) JTW HBO HBPUDO HBSc HBSh HBSR HBU NHBW NHBNW
39 Mode Choice Multinomial Logit Model (Like Destination Choice Model) On-Board Transit and Household Survey Travel Modes Included
40 Mode Choice Modes included: Transit with Auto Access (Includes Bus and Trolley) Bus with Walk Access Trolley with Walk Access Non-Motorized (Including Walk/Wheelchair and Bicycle) Shared-Ride Drive Alone Spare Mode for Future Use
41 Survey Data Set Summary Mode JTW HBSc HBU HBSh HBPD HBSR HBO NHBW NHBNW All Bus - Auto Bus - Walk 1, ,531 Trolley - Auto Trolley - Walk Walk ,155 Bicycle School Bus Shared Ride 793 1, , ,792 8,024 Drive Alone 3, , ,676 All 5,749 2, ,503 1,397 1,283 4, ,135 20,960
42 Mode Choice On-Board Transit Survey Results Vehicle Ownership 100% 80% 60% 60% 40% 20% 0% 25% 11% 3% 1% None One Two Three Four or more
43 Mode Choice On-Board Transit Employment Status Survey Results Employed, Full time 42.6% Employed, Part tim e 18.4% Unemployed, Looking 16.2% Student 15.2% Retired 3.3% Unemployed, Not Looking 2.4% Homemaker 1.9% 0% 10% 20% 30% 40% 50% 60% 70% 80% 90% 100%
44 Mode Choice On-Board Transit Income Level Survey Results Less than $6,000 $6,000 - $18,000 34% 31.8% $18,001 - $30,000 18% $30,001 - $42, % $42,001 - $60,000 $60,001 - $90,000 More than $90, % 1.3% 0.5% 0% 10% 20% 30% 40% 50% 60% 70% 80% 90% 100%
45 Mode Choice On-Board Transit Age Survey Results 100% 80% 60% 40% 20% 0% 35.6% 19.5% 19.0% 15.6% 7.8% 0.9% 1.7% Under or older
46 Mode Choice On-Board Transit Ethnicity Survey Results 100% 88.9% 80% 60% 40% 20% 0% Black/American American 8.2% 1.2% 0.7% 0.6% 0.4% White Other Native American Hispanic Asian American
47 Freight Model Trip Gen Quick Response Freight (QRF) Manual Generator (Unit) Agriculture, Mining, and Construction Manufacturing, Transportation, Communications, Utilities, and Wholesale Trade Commercial Vehicle Trip Destinations (or Origins) per Unit per Day Four-Tire Trucks Single Unit Trucks Combination Trucks Retail Trade Office and Services Total Trucks Households
48 Freight Model (cont.) Trip Distribution - Gravity Model Calibrated to Classification Counts
49 Roadway Network Development Used network provided by MPO (with some cleaning) Developed data collection tool in TransCAD to enter in network attribute data Collected street data for all streets in network (through TRIMS and windshield data)

50 Network Collection Tool Allowed for data entry in the field by a two person team Could copy and paste data from one link to another Helped to minimize coding errors


51 TRIMS Image Data
52 Roadway Network Development Coordinated with TAZ development to ensure appropriate level of detail for both Developed centroid connectors in coordination with local staff Centroid connectors indicated auto/non-auto access Aerial photography and measurement data used to clean interchanges in network
53 Roadway Network Development One TransCAD file contained all years of development baseline, existing plus committed, long range plan, etc., by year Network contained link-dating that indicated when a particular section will open (or close) Changes in network carried over to all potential scenarios and years
54 Roadway Network Quality Control TransCAD tools such as Check Line Layer Connectivity were used Trip path tests and test loadings also were used to identify network issues Plots with network attributes (lanes, speeds, median type, etc.) were submitted for review Checks against available aerial photography
55 Capacity Equations Based on HCM and TDOT Data Doesn t use standard lookup tables completely based on attributes Live update lanes on a link, capacity updates Calculated hourly and daily capacity Calculated LOS A through LOS E
56 Capacity Equations The general form of the equation was: SF = c * N * fw * fhv * Fp * FE * fd * FSD* FCLT * FPark * (v/c)i Where the variables were: SF = Maximum service flow for desired level-of-service c = Capacity under ideal conditions (vehicles per hr per lane) N = Number of lanes fw = Factor due to lane and shoulder width fhv = Factor due to percent heavy vehicles Fp = Factor due to driver population FE = Factor due to driving environment fd = Factor due to directional distribution FSD = Factor due to signal density FCLT = Factor for continuous left-turn lane (for undivided sections) FPark = Factor for on-street parking (v/c)i = Rate of service flow for levels-of-service A through E
57 Capacity Equations
58 Lookup Tables No hardcoding of values Separates interface development from model development More efficient model adjustments/calibration Subsequent model updates don t necessarily need new code Data is more transparent and accessible

59 Lookup Tables
60 Network Development Highway Network Network
61 Network Development Highway Network Screenlines and Cutlines

62 Network Development Highway Network Area Types
63 Network Development Highway Network Code Facility Type Centerline-miles Daily Counts TOD Counts Class Counts Supplementary Counts 1 Rural Interstate Rural Principal Arterial Rural Freeway Ramp 11 6 Rural Minor Arterial Rural Major Collector Rural Minor Collector Rural Local Access Urban Interstate Urban Freeways/Expressways Urban Freeway Ramp Urban Principal Arterial Urban Minor Arterial Urban Collector Urban Local Access Total Rural Roads Total Urban Roads Total - All Roads

64 Network Development Transit Network way routes

65 Network Development Transit Network

66 Network Development Transit Network

67 4 Park and Ride Lots
68 Assignment Roadway and Transit Networks Level of Detail Data Collection Effort Quality Control All or Nothing Preload Heavy Commercial Vehicles External-External Trips Equilibrium Multi-Class Assignment Pathfinder Transit Assignment
69 Highway Assignment Validation Targets Table 1. Percent Difference Targets for VMT by Functional Classification Facility Type Target Freeways 8-12% Principal Arterials 18-22% Minor Arterials 27% Collectors 33% Table 2. Percent Difference Volume Targets by Functional Classification Facility Type Target (+/-) Freeway 7% Major Arterial 10% Minor Arterial 15% Collector 25% Local 25% Table 3. Percent Difference Volume Targets by Daily Volume Groupings (totaled over entire group) Volume Group Target (+/-) <1, % 1,000-2, % 2,500-5,000 50% 5,000-10,000 25% 10,000-25,000 20% 25,000-50,000 15% >50,000 10%
70 Highway Assignment Validation Targets Table 4. Percent of Links within a Specified Percent of Count by Facility Type Facility Type Target within Count Range Compared to Counts Freeway 75% 20% Freeway 50% 10% Major Arterial Major Arterial Minor Arterial Minor Arterial 75% 30% 50% 15% 75% 40% 50% 20% Note: Table 4 can be read as 75% of the freeway links need to be within 20% of counts, 50% of the freeway links need to be within 10% of counts.

71 Highway Assignment Global Results
72 Highway Assignment Global Results Screenlines and Cutlines
73 Highway Assignment Calibration/Trouble Shooting Globally Low Modeled Volumes versus Observed Volumes Assignment Bias Toward Interstate versus Non-Interstate Facilities (Particularly Pronounced in Urban Area)
74 Future Year Model Demographics Area Type Signals Highway and Transit Network


75 What s New About this Forecasting Process? Employed a Rigorous Analytical Model Integrated this Economic Model with the Benefits of Local Planning Knowledge Review by Expert Panel Review by Local Planners
76

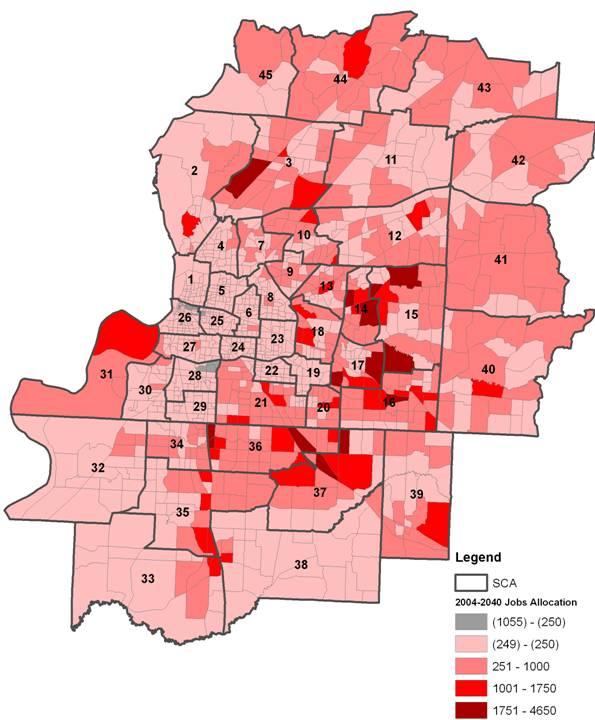
77 45 Sub-County Areas (SCAs)
78 Memphis Forecasting Sequence NATIONAL FORECAST Integration of federal data REGIONAL FORECAST Industry linkages to U.S. SCA FORECASTS Allocation of regional forecasts To 45 sub-county areas (SCAs) Expert Panel Review/Revision TAZ FORECASTS Allocation of SCA forecasts to 1,237 traffic analysis zones (TAZs) Local Planners Review/Revision
79 Study Area Forecast Households Jobs
80 Forecast by Counties Shelby County Jobs Households
81 Forecast by Counties DeSoto County Jobs Households
82 Study Area Portion of Other Counties Portion of Fayette County Portion of Tipton County Jobs Households 0 Jobs Households
83 Study Area Portion of Other Counties Portion of Marshall County Jobs Households
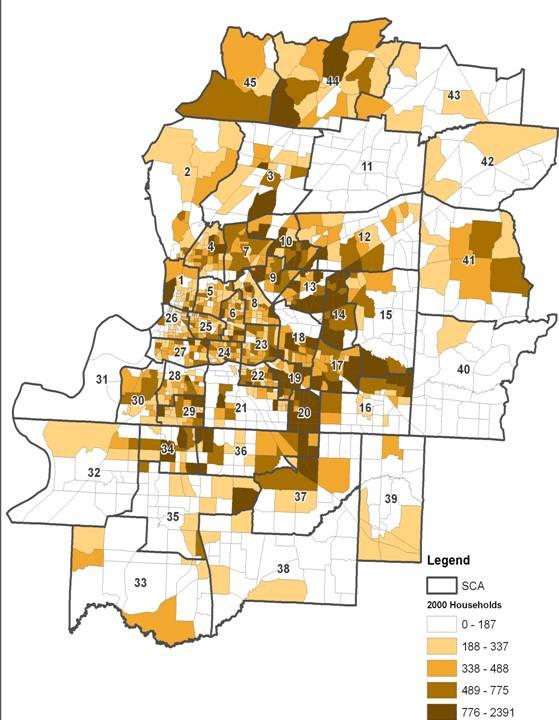
84 Households
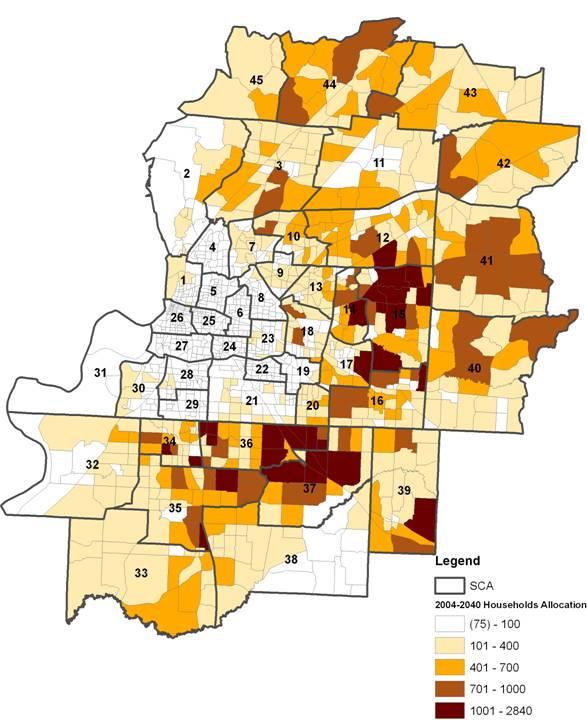
85 Households
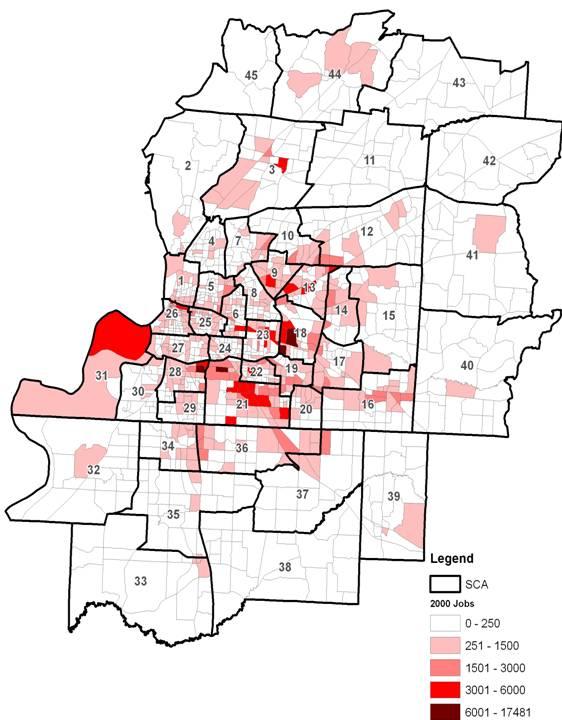
86 Employment
87 Employment
88 MSA Forecast Results 2,000,000 Regional Population Forecast 1,000,000 Regional Employment Forecast 1,800, ,000 1,600, ,000 1,400, ,000 1,200, ,000 1,000, , , , , , , , , , Between 2004 and % Gain in Population 56% Gain in Total Employment
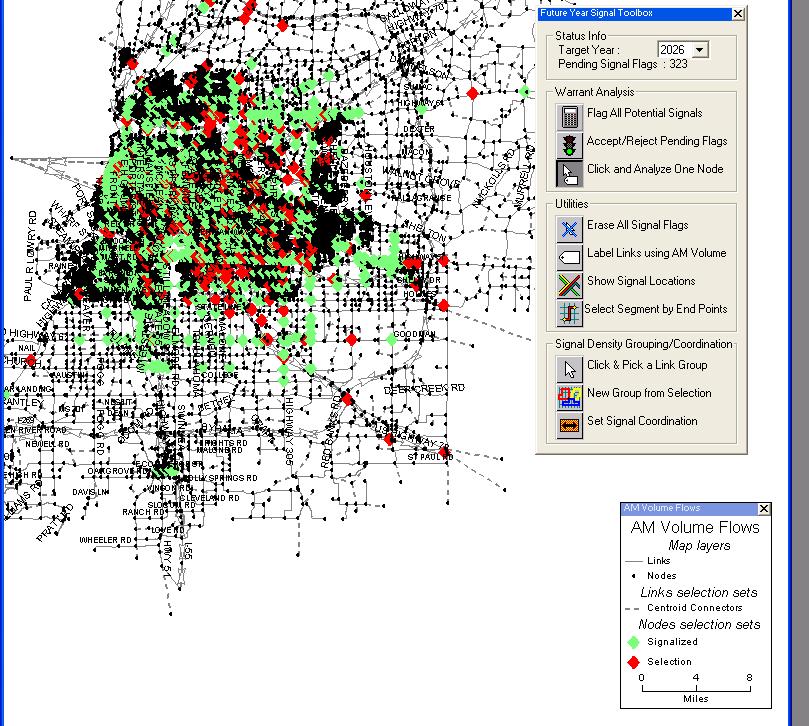
89 Future Year Signal Identification Capacity equations used intersection penalties, signal density, and signal coordination If you use signals, you have to forecast them.. somehow Basic warrant analysis flagged potential new signals User then used tool to accept/reject pending flags
 Corridors are grouped into sections for capacity equations (Signal density and signal")
90 Future Year Signal Identification Flags potential signals using basic warrant analysis on AM peak (using TDOT standards) Corridors are grouped into sections for capacity equations (Signal density and signal coordination)
91
92 Area Type Model Forecasted by 6 Categories CBD, CBD Fringe, Urban, Suburban, Rural and OBD (Outlying Business District) Forecasting Methodology No downgrade is possible New CBD zone must be adjacent to existing CBD zones New urban zone must be adjacent to the existing urban cluster New urban cluster will be created if the area is >10 square miles Existing or new OBD zones will become urban if they become adjacent to any urban zone No neighboring constraints on OBD, suburban, and rural zones Unique Algorithmic Features The forecasting process is conducted inside out, similar to an urban sprawl process, to avoid invalid neighbors If one zone can upgrade to more types, they are evaluated in priority order, so all possibilities will be considered CBD,CBD-fringe and urban zones are evaluated by recursively finding the fringe zones and finalize it step by step All future area types are decided based on final decisions already made e.g., not dependent on the particular evaluation order
93 Memphis Model Demo Introduction Installation Scenario Management Model Run Control Export Results Future Year Network Structure and Project Management Query Project Modify/Redefine Existing Project Add/Delete project Future Year Signal Forecasting Forecasting Signal Locations Signal Density Signal Coordination Reports Highway Transit Maps Highway Transit
94 Questions?
95 Contacts Mark Dunzo Phone: Kenny Monroe Phone: Zhiyong Guo Phone: Pramoda Gode Phone:
96 Presentation Copies Presentation Available At: _secure/tn_ky_usersgroup Username: Memphismodel Password: presentation
Chapter #9 TRAVEL DEMAND MODEL
 Chapter #9 TRAVEL DEMAND MODEL TABLE OF CONTENTS 9.0 Travel Demand Model...9-1 9.1 Introduction...9-1 9.2 Overview...9-1 9.2.1 Study Area...9-1 9.2.2 Travel Demand Modeling Process...9-3 9.3 The Memphis
9. TRAVEL FORECAST MODEL DEVELOPMENT
 9. TRAVEL FORECAST MODEL DEVELOPMENT To examine the existing transportation system and accurately predict impacts of future growth, a travel demand model is necessary. A travel demand model is a computer
Standardization of Travel Demand Models
 Standardization of Travel Demand Models TNMUG Meeting November 14, 2013 The North Carolina Experience Leta F. Huntsinger, Ph.D., P.E. and Rhett Fussell, P.E. Background } North Carolina Profile } 18 MPOs,
Transportation Model Report
 1. Introduction The traffic impacts of the future developments in the IL130/High Cross Road corridor for different scenarios were analyzed using a Travel Demand Model (TDM). A four step modeling process
APPENDIX H: TRAVEL DEMAND MODEL VALIDATION AND ANALYSIS
 APPENDIX H: TRAVEL DEMAND MODEL VALIDATION AND ANALYSIS Travel demand models (TDM) simulate current travel conditions and forecast future travel patterns and conditions based on planned system improvements
Mid-South Regional Travel Surveys & Model Update
 Mid-South Regional Travel Surveys & Model Update October 16, 2014 Presented to the Mid-South Travel Survey and Model Update Steering Committee By: Thomas Rossi and Anurag Komanduri, Cambridge Systematics
CHAPTER 9 TRAVEL DEMAND MODEL SUMMARY
 CHAPTER 9 TRAVEL DEMAND MODEL SUMMARY This chapter describes the OKI / MVRPC regional travel demand model, used to support traffic and transit forecasts for the NSTI study. This model is based on version
Section 1.0 INTRODUCTION. Section 2.0 MODEL ARCHITECTURE RECOMMENDATIONS, PHASE I, TIER I - PASSENGER CAR AND TRUCK..
 TABLE OF CONTENTS Section 1.0 INTRODUCTION Section 2.0 MODEL ARCHITECTURE RECOMMENDATIONS, PHASE I, TIER I - PASSENGER CAR AND TRUCK.. Section 2.1 General Software and Forecast Year Recommendations. Section
MINIMUM TRAVEL DEMAND MODEL CALIBRATION and VALIDATION GUIDELINES FOR STATE OF TENNESSEE UPDATED 2012
 MINIMUM TRAVEL DEMAND MODEL CALIBRATION and VALIDATION GUIDELINES FOR STATE OF TENNESSEE UPDATED 2012 By: Dr. Fred Wegmann Dr. Jerry Everett Center for Transportation Research University of Tennessee Knoxville,
Database and Travel Demand Model
 Database and Travel Demand Model 7 The CMP legislation requires every CMA, in consultation with the regional transportation planning agency (the Metropolitan Transportation Commission (MTC) in the Bay
The Updated Whatcom Model Project Final Report. Prepared for: The Whatcom Council of Governments. February 28, 2014.
 The Updated Whatcom Model 2014 Project Final Report Prepared for: The Whatcom Council of Governments February 28, 2014 Prepared by: Caliper Corporation 1172 Beacon St Newton, MA 02461. 617 527 4700 www.caliper.com
report final Decennial Model Update Executive Summary Contra Costa Transportation Authority Cambridge Systematics, Inc.
 final report prepared for Contra Costa Transportation Authority prepared by with Dowling Associates Caliper Corporation June 2003 Table of Contents 1.0 Introduction... ES-1 2.0 Data Development... ES-5
Model Characteristics
 1 General Model Design Highway Network/Traffic Analysis Zones (TAZs) Development of Synthetic Trip Tables Validation Procedures & Results Model Application (2003 & 2030) Review 2 Model Characteristics
TM-1 District One Regional Model ( ) Executive Summary. February 2016
 Executive Summary. February 2016") TM-1 District One Regional Model (2010-2040) Executive Summary February 2016 This report: TM-1 Introduction to the D1RPM and Validation Report provides an overall reviews of the model and contains summary
TM-1 District One Regional Model (2010-2040) Executive Summary February 2016 This report: TM-1 Introduction to the D1RPM and Validation Report provides an overall reviews of the model and contains summary
CHAPTER 7. TRAVEL PATTERNS AND TRAVEL FORECASTING
 CHAPTER 7. TRAVEL PATTERNS AND TRAVEL FORECASTING TRAVEL PATTERNS Northwest Arkansas has experienced unprecedented growth in population and employment in the past 25 years. The economic vitality and diversity
Memphis MPO Model Update
 report Memphis MPO Model Update Model Estimation and Validation Report prepared for Memphis MPO prepared by Cambridge Systematics, Inc. 115 South LaSalle Street, Suite 2200 Chicago, IL 60603 date June
Travel Demand Modeling At NCTCOG
 Travel Demand Modeling At NCTCOG Arash Mirzaei North Central Texas Council Of Governments For University of Texas at Arlington ITE Student Chapter March 9, 2005 Agenda Background DFW Regional Model Structure
2010 REGIONAL TRANSPORTATION MODEL UPDATE
 2010 REGIONAL TRANSPORTATION MODEL UPDATE Final Report April, 2016 Prepared by the Pioneer Valley Planning Commission The analysis in this report was completed after the adoption of the Regional Transportation
Refined Statewide California Transportation Model. Progress Report November 2009
 Refined Statewide California Transportation Model Progress Report November 2009 Study area - the State of California. Forecast trips made on a typical fall / spring weekday i.e. when schools are in session.
APPENDIX D. Glossary D-1
 APPENDIX D Glossary D-1 Glossary of Transportation Planning Terms ANNUAL AVERAGE DAILY TRAFFIC (AADT): The total number of vehicles passing a given location on a roadway over the course of one year, divided
APPENDIX TRAVEL DEMAND MODELING OVERVIEW MAJOR FEATURES OF THE MODEL
 APPENDIX A TRAVEL DEMAND MODELING OVERVIEW The model set that the Central Transportation Planning Staff (CTPS), the Boston Region Metropolitan Planning Organization s (MPO) technical staff, uses for forecasting
MOBILITY AND ALTERNATIVES ANALYSIS
 6 MOBILITY AND ALTERNATIVES ANALYSIS BACK OF SECTION DIVIDER 6.0 Mobility and Alternatives Analysis Travel demand analysis provides a framework for the identification of transportation facilities and services
draft report DRAFT Model Documentation Dane County Travel Demand Model Wisconsin Department of Transportation Cambridge Systematics, Inc.
 Dane County Travel Demand Model draft report prepared for Wisconsin Department of Transportation prepared by Cambridge Systematics, Inc. January, 2014 www.camsys.com report DRAFT Model Documentation Dane
technical report KATS Travel Model Update Technical Documentation Kalamazoo Area Transportation Study Cambridge Systematics, Inc.
 Technical Documentation technical report prepared for Kalamazoo Area Transportation Study prepared by Cambridge Systematics, Inc. with Dunbar Transportation Consulting June 29, 2015 www.camsys.com report
6.0 CONGESTION HOT SPOT PROBLEM AND IMPROVEMENT TRAVEL DEMAND MODEL ANALYSIS
 6.0 CONGESTION HOT SPOT PROBLEM AND IMPROVEMENT TRAVEL DEMAND MODEL ANALYSIS 6.1 MODEL RUN SUMMARY NOTEBOOK The Model Run Summary Notebook (under separate cover) provides documentation of the multiple
D1 REGIONAL PLANNING MODEL (D1RPM V1.0.3)
") MODEL ADVANCEMENT COMMITTEE (MAC) MEETING APRIL 6, 2017 D1 REGIONAL PLANNING MODEL (D1RPM V1.0.3) Polk 12 County Area (previously individual models) 5,662 zones Manatee Hardee Okeechobee 2010 base year
MODEL ADVANCEMENT COMMITTEE (MAC) MEETING APRIL 6, 2017 D1 REGIONAL PLANNING MODEL (D1RPM V1.0.3) Polk 12 County Area (previously individual models) 5,662 zones Manatee Hardee Okeechobee 2010 base year
November 16, Metropolitan Washington Council of Governments National Capital Region Transportation Planning Board. Review of FTA Summit Software
 Metropolitan Washington Council of Governments National Capital Region Transportation Planning Board Review of FTA Summit Software November 16, 2007 8300 Boone Blvd, Suite 700 Vienna, VA 22182 (703) 847-3071
Contents i Contents Page 1 A New Transportation Plan Community Involvement Goals and Objectives... 11
 Contents i Contents 1 A New Transportation Plan... 1 Why develop a new plan?... 1 What area does the LRTP focus on?... 2 Why is this LRTP important?... 3 Meeting Requirements for Transportation Planning...
City of Tacoma TRANSPORTATION MASTER PLAN DRAFT
 City of Tacoma TRANSPORTATION MASTER PLAN 140 APPENDICES Appendix A Model Documentation MEMORANDUM Date: November 26, 2014 To: City of Tacoma, Department of Public Works From: Chris Breiland, Fehr & Peers
CLARKSVILLE/MONTGOMERY COUNTY TRAVEL DEMAND MODEL MODEL DEVELOPMENT REPORT
 CLARKSVILLE/MONTGOMERY COUNTY TRAVEL DEMAND MODEL MODEL DEVELOPMENT REPORT JULY 2009 CLARKSVILLE / MONTGOMERY COUNTY TRAVEL DEMAND MODEL MODEL DEVELOPMENT REPORT July 2009 Alliance Transportation Group,
Maryland Statewide Transportation Model (MSTM)
") Maryland State Highway Administration (MD SHA) Maryland Statewide Transportation Model (MSTM) TRB Meeting Federal Surface Transportation Requirements in Statewide and Metropolitan Transportation Planning:
Maryland State Highway Administration (MD SHA) Maryland Statewide Transportation Model (MSTM) TRB Meeting Federal Surface Transportation Requirements in Statewide and Metropolitan Transportation Planning:
Chapter 8 Travel Demand Forecasting & Modeling
 Chapter 8 Travel Demand Forecasting & Modeling The Travel Demand Forecasting and Modeling process for the Jackson MPO was developed in cooperation between the Region 2 Planning Commission (R2PC) and the
Modeling Truck Movements: A Comparison between the Quick Response Freight Manual (QRFM) and Tour-Based Approaches
 and Tour-Based Approaches") International Journal of Engineering Science Invention ISSN (Online): 2319 6734, ISSN (Print): 2319 6726 Volume 5 Issue 11 November 2016 PP. 45-51 Modeling Truck Movements: A Comparison between the Quick
International Journal of Engineering Science Invention ISSN (Online): 2319 6734, ISSN (Print): 2319 6726 Volume 5 Issue 11 November 2016 PP. 45-51 Modeling Truck Movements: A Comparison between the Quick
Process to Identify High Priority Corridors for Access Management Near Large Urban Areas in Iowa Using Spatial Data
 Process to Identify High Priority Corridors for Access Management Near Large Urban Areas in Iowa Using Spatial Data David J. Plazak and Reginald R. Souleyrette Center for Transportation Research and Education
Updating Virginia s Statewide Functional. Brad Shelton, VDOT Chris Detmer, VDOT Ben Mannell, VDOT
 Updating Virginia s Statewide Functional Classification System Brad Shelton, VDOT Chris Detmer, VDOT Ben Mannell, VDOT July 18, 2013 What is Functional Classification Use of Functional Classification Today
Appendix D: Functional Classification Criteria and Characteristics, and MnDOT Access Guidance
 APPENDICES Appendix D: Functional Classification Criteria and Characteristics, and MnDOT Access Guidance D.1 Functional classification identifies the role a highway or street plays in the transportation
A Time Series Approach to Forecast Highway Peak Period Spreading and Its Application in Travel Demand Modeling
 A Time Series Approach to Forecast Highway Peak Period Spreading and Its Application in Travel Demand Modeling Sabya Mishra (University of Memphis) Timothy F. Welch (Georgia Institute of Technology) Subrat
Recommended Roadway Plan Section 3 Existing Facilities & System Performance
 Recommended Roadway Plan Section 3 Existing Facilities & System Performance RECOMMENDED ROADWAY PLAN SECTION 3 Existing Facilities and System Performance 3.1 Introduction An important prerequisite to transportation
Transportation Modeling Forum. June 13, 2012
 Transportation Modeling Forum June 13, 2012 Forum Agenda Activity-Based Model Overview Comparing the ABM with Four-Step Model ABM Structure, Components and Flow 2 Activity-Based Model Overview Clint Daniels
MEMORANDUM. To: Andrew Brennan, MBTA April 29, 2005
 2 MEMORANDUM To: Andrew Brennan, MBTA April 29, 2005 From: Re: Scott Peterson, CTPS Silver Line Phase III Modeling Methodology I. INTRODUCTION The Silver Line is a bus rapid transit (BRT) project that
Kentucky Statewide Travel Model (KYSTM) Rob Bostrom Wilbur Smith Associates Combined Kentucky-Tennessee Model Users Group Meeting Bowling Green, KY
 Rob Bostrom Wilbur Smith Associates Combined Kentucky-Tennessee Model Users Group Meeting Bowling Green, KY") Kentucky Statewide Travel Model (KYSTM) Rob Bostrom Wilbur Smith Associates Combined Kentucky-Tennessee Model Users Group Meeting Bowling Green, KY October 26, 2006 Presentation Overview Overview of statewide
Kentucky Statewide Travel Model (KYSTM) Rob Bostrom Wilbur Smith Associates Combined Kentucky-Tennessee Model Users Group Meeting Bowling Green, KY October 26, 2006 Presentation Overview Overview of statewide
Appendix D Functional Classification Criteria and Characteristics, and MnDOT Access Guidance
 Appendix D Functional Classification Criteria and Characteristics, and MnDOT Access Guidance Functional classification identifies the role a highway or street plays in the transportation system. Some highways
Context. Case Study: Albany, New York. Overview
 Case Study: Albany, New York Overview The Capital District, a four-county region surrounding Albany, New York, has experienced dramatic growth in vehicle-miles of travel (VMT) in recent years, which has
SERPM8.0 TRAVEL DEMAND MODEL UPDATE DATA AVAILABILITY AND NEEDS
 SERPM8.0 TRAVEL DEMAND MODEL UPDATE DATA AVAILABILITY AND NEEDS UPDATED JANUARY 18 2017 UPDATES IN RED DATA ITEM DESCRIPTION/COMMENTS AGENCY/DETAILS/TIMING DATA STATUS A1 A2 Geographies for development
Draft Update Presented to the Grand Forks East Grand Forks MPO TAC
 GRAND FORKS EAST GRAND FORKS 2015 TRAVEL DEMAND MODEL UPDATE DRAFT REPORT Draft Update Presented to the Grand Forks East Grand Forks MPO TAC August 9 th 2017 Diomo Motuba, PhD Advanced Traffic Analysis
California Statewide Interregional Integrated Modeling (SIIM) Framework. California STDM. HBA Specto Incorporated ULTRANS, UC Davis
 Framework. California STDM. HBA Specto Incorporated ULTRANS, UC Davis") California Statewide Interregional Integrated Modeling (SIIM) Framework California STDM HBA Specto Incorporated ULTRANS, UC Davis SIIM Advisory Group Meeting June 2010 model-wide economic / demographic
California Statewide Interregional Integrated Modeling (SIIM) Framework California STDM HBA Specto Incorporated ULTRANS, UC Davis SIIM Advisory Group Meeting June 2010 model-wide economic / demographic
SHOALS AREA Long Range Transportation Plan. Prepared for: Northwest Alabama Council of Local Governments. Prepared by: Skipper Consulting, Inc.
 SHOALS AREA 2030 Long Range Transportation Plan Prepared for: Northwest Alabama Council of Local Governments Prepared by: Skipper Consulting, Inc. December 2005 SHOALS AREA 2030 Long Range Transportation
Appendix G: Travel Demand Model Documentation
 Appendix G: Travel Demand Model Documentation Skagit Council of Governments TRAVEL DEMAND MODEL DOCUMENTATION August 2015 Prepared by: 11730 118 th Avenue NE, Suite 600 Kirkland, WA 98034-7120 Phone: 425-821-3665
III. CONSENT AGENDA 1:40 *A. Approve October 1, 2013 Meeting Minutes
 TRANSPORTATION MODEL ADVISORY COMMITTEE January 14, 2014 1:30 p.m. 3:00 p.m. Community Planning Association 700 NE 2nd Street, 2nd Floor Large Conference Room, Meridian NOTICE: This packet contains only
HCM 6th Edition Planning and Preliminary Engineering Applications Guide (PPEAG) to the HCM Bringing Back-of-the-Envelope Back.
 to the HCM Bringing Back-of-the-Envelope Back.") HCM 6th Edition Planning and Preliminary Engineering Applications Guide (PPEAG) to the HCM Bringing Back-of-the-Envelope Back April, 2017 Potential Use of the HCM in Planning The HCM is commonly used to
HCM 6th Edition Planning and Preliminary Engineering Applications Guide (PPEAG) to the HCM Bringing Back-of-the-Envelope Back April, 2017 Potential Use of the HCM in Planning The HCM is commonly used to
GENESEE COUNTY URBAN TRAVEL DEMAND MODEL IMPROVMENTS
 GENESEE COUNTY URBAN TRAVEL DEMAND MODEL IMPROVMENTS Model Development and Validation Report Prepared for the Genesee County Metropolitan Planning Commission January 2009 Revised May 2009 Prepared by Bernardin,
A Comparison of CEMDAP Activity-Based Model With DFWRTM 4-Step Model
 A Comparison of CEMDAP Activity-Based Model With DFWRTM 4-Step Model Arash Mirzaei P.E. NCTCOG - Arlington, Texas and Naveen Eluru UT Austin - Austin, Texas for 11 th TRB National Transportation Planning
CHAPTER 2: MODELING METHODOLOGY
 CHAPTER 2: MODELING METHODOLOGY 2.1 PROCESS OVERVIEW The methodology used to forecast future conditions consisted of traditional traffic engineering practices and tools with enhancements to more accurately
Wisconsin Statewide Model
 Wisconsin Statewide Model Outline of a Proposed Approach presented by Kimon Proussaloglou Cambridge Systematics, Inc. January 12, 2004 Project Team Wisconsin DOT Doug Dalton, Project Manager Don Uelmen,
Model Construction and Calibration Technical Documentation Draft
 430 IACC Building Fargo, ND 58105 Tel 701-231-8058 Fax 701-231-1945 www.ugpti.org www.atacenter.org Model Construction and Calibration Technical Documentation Draft January, 2004 Prepared for: Bismarck/Mandan
VEHICLES MILES TRAVELED (VMT) TRAFFIC IMPACT METRIC
 TRAFFIC IMPACT METRIC") VEHICLES MILES TRAVELED (VMT) TRAFFIC IMPACT METRIC A project-specific quantified analysis of the MGA Campus has been undertaken to compare BAU to the project including the project s VMT reduction program
VEHICLES MILES TRAVELED (VMT) TRAFFIC IMPACT METRIC A project-specific quantified analysis of the MGA Campus has been undertaken to compare BAU to the project including the project s VMT reduction program
CHAPTER 2 - TRAVEL DEMAND MODEL DEVELOPMENT
 CHAPTER 2 - TRAVEL DEMAND MODEL DEVELOPMENT 2.1 EXISTING TRAVEL DEMAND MODEL In order to accurately project future year traffic volumes within this regional study area, it was first necessary to construct
Performance Based Transportation Project Assessment. Utilizing Travel Demand Model Data and Dynamic Economic Modeling
 Performance Based Transportation Project Assessment Utilizing Travel Demand Model Data and Dynamic Economic Modeling Colin Belle, Metropolitan Planner Region 1 Planning Council (R1PC), Rockford Illinois
SHIFT ODME Model & Utilities. Prepared For: Institute for Trade and Transportation Studies
 SHIFT ODME Model & Utilities Prepared For: Institute for Trade and Transportation Studies Developed January 2016 Updated February 2017 Table of Contents Section 1 Introduction... 1-1 1.1 Purpose of Model...
Travel Demand Model Questions
 Travel Demand Model Questions Are we using the right kind of tools to address the scenarios we are trying to analyze? Are we missing tools? Are we working at the appropriate level of spatial, temporal
Memphis Urban Area Metropolitan Planning Organization (MPO) Regional Freight Plan
 Regional Freight Plan") Memphis Urban Area Metropolitan Planning Organization (MPO) August 2017 Agenda Work Plan Overview Executive Summary Stakeholder Outreach and Surveys Freight Zones Regional Transportation Networks Technological
Memphis Urban Area Metropolitan Planning Organization (MPO) August 2017 Agenda Work Plan Overview Executive Summary Stakeholder Outreach and Surveys Freight Zones Regional Transportation Networks Technological
ACTIVE TRANSPORTATION ADVISORY COMMITTEE. Memphis MPO March 30, 2015
 ACTIVE TRANSPORTATION ADVISORY COMMITTEE Memphis MPO March 30, 2015 Agenda Welcome & Introductions Announcements and Briefings Livability 2040: Regional Transportation Plan Congestion Management Process
Corpus Christi Metropolitan Transportation Plan Fiscal Year Introduction:
 Introduction: Traffic congestion in the Corpus Christi Metropolitan area is not as much a function of population growth as the function of the increase in single occupant trips. Using census data, the
DRCOG s Land Use and Travel Demand Models. Presentation to the Institute of Transportation Engineers Colorado/Wyoming Section 12 December 2014
 DRCOG s Land Use and Travel Demand Models Presentation to the Institute of Transportation Engineers Colorado/Wyoming Section 12 December 2014 The Dirty Secret Essentially, all models are wrong, but some
Jeff Gulden, PE, TE, JP Goates, MCMP, and Reid Ewing, Ph.D. Page 1 MIXED-USE DEVELOPMENT TRIP GENERATION MODEL
 Jeff Gulden, PE, TE, JP Goates, MCMP, and Reid Ewing, Ph.D. Page 1 MIXED-USE DEVELOPMENT TRIP GENERATION MODEL Original submission date: August 1, 2012 Revised submission date: November 13, 2012 Number
Mobility 2025 Update: The Metropolitan Transportation Plan
 Mobility 2025 Update: The Metropolitan Transportation Plan May, 2001 North Central Texas Council of Governments Transportation Department MOBILITY 2025 UPDATE FINANCIAL SUMMARY Metropolitan Transportation
GUIDE FOR THE PREPARATION OF TRAFFIC IMPACT STUDIES
 GUIDE FOR THE PREPARATION OF TRAFFIC IMPACT STUDIES Adopted by Town Council on November 25, 2008 Prepared By: HNTB Engineering Department Planning Department TABLE OF CONTENTS I. INTRODUCTION... 1 II.
Traffic Data Collection Programs for PM 2.5 Non-Attainment Areas
 Traffic Data Collection Programs for PM 2.5 Non-Attainment Areas Jack Stickel Alaska Department of Transportation and Public Facilities NATMEC 23 June, 2010 Traffic Data to Address Air Quality and Climate
CTA Blue Line Forest Park Branch Feasibility/Vision Study: Transit Ridership Forecasting Analysis Technical Memorandum Submitted By
 Feasibility/Vision Study: Technical Memorandum Submitted By WSP Parsons Brinckerhoff 30 N. LaSalle Street, Suite 4200 Chicago, IL 60602 December 2016 TABLE OF CONTENTS 1.0 INTRODUCTION... 1 1.1 Organization
ALBION FLATS DEVELOPMENT EXISTING TRAFFIC CONDITIONS AND POTENTIAL IMPACTS
 EXISTING TRAFFIC CONDITIONS AND POTENTIAL IMPACTS FINAL REPORT SEPTEMBER 2010 TABLE OF CONTENTS 1.0 INTRODUCTION 1 2.0 EXISTING TRAFFIC CONDITIONS 2 3.0 FUTURE TRAFFIC CONDITIONS 3 4.0 POTENTIAL IMPACTS
NATMEC June 30, 2014 Anita Vandervalk, PE, PMP
 NATMEC June 30, 2014 Anita Vandervalk, PE, PMP Agenda 1. Florida s MPM Program 2. Research Efforts and Progress 3. Source Book 4. Transitioning to Real Time Data 5. Next Steps Importance of Mobility Providing
10.0 Congestion Management Process
 Livability 2040 Regional Transportation Plan 10-1 10.0 Congestion Management Process 10.1 CMP Summary The identification and evaluation of projects for the Livability 2040 Regional Transportation Plan
Functional Classification Comprehensive Guide. Prepared by
 Functional Classification Comprehensive Guide Prepared by June 6, 2014 INTRODUCTION PURPOSE OF DOCUMENT The intent of this document is to provide a comprehensive guide to Virginia Department of Transportation
Webinar Series for Comprehensive Plan Updates. Transportation Overview
 Webinar Series for Comprehensive Plan Updates Transportation Overview Presented by Michael Larson and Mark Filipi August 18, 2016 2040 Transportation Policy Plan Adopted January 14 th, 2015 Multimodal
Updating Virginia s Statewide Functional Classification System. Briefing to MPOs, PDCs, and Local Governments
 Updating Virginia s Statewide Functional Classification System Briefing to MPOs, PDCs, and Local Governments October 15 & 19, 2012 Functional Class 101 Shelton s FC Game Research Phase Today s Review New
Effectively Using the QRFM to Model Truck Trips in Medium-Sized Urban Communities
 Effectively Using the QRFM to Model Truck Trips in Medium-Sized Urban Communities By Dr. Michael Anderson and Mary Catherine Dondapati Department of Civil and Environmental Engineering The University of
Congestion Management Process (CMP)
") Congestion Management Process (CMP) Introduction The Congestion Management Process (CMP) is a systematic, data-driven, and regionally accepted approach that aims to improve the performance of the transportation
Congestion Management Process (CMP) Introduction The Congestion Management Process (CMP) is a systematic, data-driven, and regionally accepted approach that aims to improve the performance of the transportation
VEHICLE PARTICULATE EMISSIONS ANALYSIS
 VEHICLE PARTICULATE EMISSIONS ANALYSIS Prepared for ARIZONA DEPARTMENT OF TRANSPORTATION TRANSPORTATION PLANNING DIVISION MPOs/COGs AIR QUALITY POLICY AND LOCAL PROGRAMS SECTION AND YUMA METROPOLITAN PLANNING
Livability 2050 Regional Transportation Plan Update. RTPAC #1 January 18, 2018
 Livability 2050 Regional Transportation Plan Update RTPAC #1 January 18, 2018 INTRODUCTIONS What does your involvement look like? As a member of the committee, you can help by: o Providing direction for
Air Quality Conformity Determination Statement for the Poughkeepsie Ozone Non attainment Area
 Air Quality Conformity Determination Statement for the Poughkeepsie Ozone Non attainment Area Fall 2011 New York Metropolitan Transportation Council (NYMTC) 199 Water Street, 22 nd Floor New York, NY 10038
Traffic Data Quality Analysis. James Sturrock, PE, PTOE, FHWA Resource Center Operations Team
 Traffic Analysis James Sturrock, PE, PTOE, FHWA Resource Center Operations Team Source Material Traffic Measurement http://ntl.bts.gov/lib/jpodocs/repts_te/14058.htm Seven DEADLY Misconceptions about Information
Freight Transportation Planning and Modeling Spring 2012
 Freight Model Validation Techniques Abstract Several reviews of validation techniques for statewide passenger and freight models have been published over the past several years. In this paper I synthesize
All Roads Do Not End at the State Line: Methodologies for Enabling Geodata Sharing Across Boundaries
 All Roads Do Not End at the State Line: Methodologies for Enabling Geodata Sharing Across Boundaries presented to 22 nd Geospatial Information Systems for Transportation Symposium presented by Julie Chizmas,
Regional Evaluation Decision tool for Smart Growth
 Regional Evaluation Decision tool for Smart Growth Maren Outwater, Robert Cervero, Jerry Walters, Colin Smith, Christopher Gray, Rich Kuzmyak Objectives This project is one of the SHRP 2 Capacity projects
What is the Dakota County Principal Arterial Study?
 What is the Dakota County Principal Arterial Study? The Dakota County is underway and will address future designations of certain highways as Principal Arterials. What Are Principal Arterials? Principal
IOWA DEPARTMENT OF TRANSPORTATION. Request for Proposal
 IOWA DEPARTMENT OF TRANSPORTATION Request for Proposal for PHASE II DEVELOPMENT OF A STATEWIDE TRAVEL DEMAND MODEL for THE STATE OF IOWA Table of Contents I. GENERAL... 3 A. Introduction... 3 B. Project
Mid-South Regional Travel Surveys & Model Update
 Mid-South Regional Travel Surveys & Model Update May 9, 2014 Presented to the Mid-South Travel Survey and Model Update Steering Committee By: Thomas Rossi, Anurag Komanduri, and Brent Selby, Cambridge
Appendix D. Tier 2 Final Environmental Assessment I-66 Transportation Technical Report
 Tier 2 Final Environmental Assessment I-66 Transportation Technical Report Appendix D Travel Demand Model & Post Processing Methodology & Assumptions Technical Memorandum FINAL AUGUST 2016 TECHNICAL MEMORANDUM
TRB WEBINAR PROGRAM Planning and Preliminary Engineering Applications Guide to the Highway Capacity Manual: Contents
 TRANSPORTATION RESEARCH BOARD TRB WEBINAR PROGRAM Planning and Preliminary Engineering Applications Guide to the Highway Capacity Manual: Contents Tuesday, May 30, 2017 2:00-3:30 PM ET The Transportation
Tennessee Model Users Group. Organizational Meeting December 2, 2004
 Tennessee Model Users Group Organizational Meeting December 2, 2004 Introduction Steve Allen Transportation Manager 2 Traffic Planning & Statistics Office Planning Division TDOT Education Associate of
P4.0 Highway Quantitative Scoring Workgroup Recommendations
 P4.0 Highway Quantitative Scoring Workgroup Recommendations May 18, 2015 Highway Project Scoring Overview Insert Table of Eligibility Statewide Mobility Regional Impact Division Needs Eligible Projects:
Fargo Moorhead MPO 2010 Regional Travel Demand Model Update Technical Report-DRAFT. June 2013
 430 IACC Building Fargo, ND 58105 Tel 701-231-8058 Fax 701-231-1945 www.ugpti.org www.atacenter.org Fargo Moorhead MPO 2010 Regional Travel Demand Model Update Technical Report-DRAFT June 2013 Prepared
Innovative Assignment Process for a Statewide Model
 Innovative Assignment Process for a Statewide Model William G. Allen, Jr., PE TRB Innovations in Travel Modeling Conference Atlanta June 2018 1 New Statewide Travel Model for Kansas Conventional four-step
Travel Demand Forecasting User Guide
 Travel Demand Forecasting User Guide A Supplement to the Regional Transitway Guidelines Metropolitan Council February 2012 This document supplements the Project Development, Leadership, and Oversight discussion
Using the Federal Transit Administration (FTA) Simplified Trips-on-Project Software (STOPS) for Transit Demand Estimation
 Simplified Trips-on-Project Software (STOPS) for Transit Demand Estimation") Using the Federal Transit Administration (FTA) Simplified Trips-on-Project Software (STOPS) for Transit Demand Estimation presented to 2014 ITE Mid-Colonial District and Mid-Atlantic Section Annual Meeting
Using the Federal Transit Administration (FTA) Simplified Trips-on-Project Software (STOPS) for Transit Demand Estimation presented to 2014 ITE Mid-Colonial District and Mid-Atlantic Section Annual Meeting
SHIFT Model Training: Scenario 3A
 SHIFT Model Training: Scenario 3A ITTS Freight in the Southeast Conference 2017 Liza Amar February 15 th 2017 Overview SHIFT Model Scope Model Scenario Examples Coding the Scenario Running the Model Evaluating
AMPO Annual Conference Session: Performance (Part 1) October 18, 2017 Savannah, GA
 October 18, 2017 Savannah, GA") AMPO Annual Conference Session: Performance (Part 1) October 18, 2017 Savannah, GA Introduction: North Jersey Transportation Planning Authority NJTPA Congestion Management Process Study Goals Analysis
AMPO Annual Conference Session: Performance (Part 1) October 18, 2017 Savannah, GA Introduction: North Jersey Transportation Planning Authority NJTPA Congestion Management Process Study Goals Analysis
Statewide Travel Demand Model Update
 Statewide Travel Demand Model Update Request for Proposal Iowa Department of Transportation Introduction The Iowa Department of Transportation s (Iowa DOT) Office of Systems Planning is interested in entering
Special Events Travel Surveys and Model Development
 Special Events Travel Surveys and Model Development Authors: Arun Kuppam (Corresponding Author), Rachel Copperman, Jason Lemp, Thomas Rossi, Cambridge Systematics, Inc., 9015 Mountain Ridge Drive, Suite
Technical Memorandum. 720 SW Washington Suite 500 Portland, OR dksassociates.com. DATE: July 12, 2017
 Technical Memorandum DATE: July 12, 2017 TO: Kay Bork City of Veneta Bill Johnston, AICP Oregon Department of Transportation Christina McDaniel-Wilson, PE Oregon Department of Transportation Keith Blair,