Waste Management and Asset Service Improvement in Pematangsiantar
|
|
|
- Jeremy Conley
- 6 years ago
- Views:
Transcription
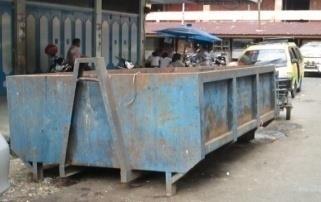
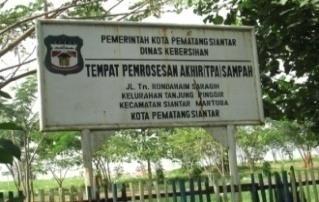
1 Waste Management and Asset Service Improvement in Pematangsiantar Sarintan Efratani Damanik Lecturer of Graduate Programs of Simalungun University DOI: /IJARBSS/v5-i6/1686 URL: Abstract. Technical analysis of operational waste management assets includes containers, collection and transport, whereas the financial research and analysis of the feasibility of using Net Present Value, Internal Rate of Return, Benefit/Cost Ratio, and Payback Period. Waste management in Pematangsiantar still resting on final approach (get-together waste transport) with a low level of service. This research aims to examine waste management system. From the analysis, it was found that a waste management with a sorting method in the polling stations based on services zone priority gradually increasing from , can improve the coverage of existing garbage service average 11.34%, coverage of existing TPS services an average of 1.74%, and the scope of service of existing garbage transport trucks average 16,23%. Asset investment costs in 2011, assuming the value of depreciation or depreciation of assets used TPS until age 20 where the cost of equipment, operating costs and maintenance costs are assumed to rise ± 10% each year. Keywords: Waste, Asset Service, Pematangsiantar, Management, PP TPS. 1. Background According to the Department of Sanitary Pematangsiantar, the waste management is still based on final approach; the garbage is collected, transported, and disposed of in landfills (TPA), with the coverage about 20% of the total area of Pematangsiantar. Waste management is handled by Division of Sanitary, Parks and Cemeteries, Department of Sanitary Pematangsiantar, while the waste management activities carried out by the Health Services Section. The asset of waste management is 27 units of 3m 3 capacity concrete polling station (TPS), 18 units of 3m 3 capacity knock down, and 9 units of 6m 3 capacity containers. Waste transported by using 27 vehicles; 18 units of dump trucks and 9 units of 6m 3 capacity armroll trucks. For final processing, there are two polling stations, namely TPS Tanjungpinggir1 of 2.5 ha (already used about 90%) and TPS Tanjungpinggir2 of 5 ha, (not yet operating). The waste disposal method in the TPA by means of open dumping [3,5,7,9]. The waste management budget in 2013 only 0.76% of the total budget, while the revenue from waste retribution only 99,24% of the total budget of waste management. 378
2 In improving waste management, a service strategy is required to increase the capacity of waste handling. For that is necessary to study a waste management system with a sorting method at the polling stations in order to improve the coverage of the asset until 2015 both technically operational and financial aspects [6,8,10]. 2. Methodology This study is a descriptive study. The location is the area of waste management services Tanjungpinggir. The data collected are qualitative and quantitative, which includes the characteristics of the region, administration, population, socioeconomic, waste piles, waste composition, local services, asset management and financing of waste management [1,3,5,7,9]. The data were analyzed descriptively, which describes the condition of the existing technical, operational and financing of waste management assets. Primary data and secondary data were then compared with the standard NSPM in order to obtain a general overview of waste management in Pematangsiantar. The analysis of technical operation and feasibility using the investment criteria of Net Present Value, Internal Rate of Return, Benefit/Cost Ratio, and Payback Period [2,4,6,8,10]. 3. Findings and Discussion 3.1 Technical Operations of Waste Management Asset Waste piles The average of household waste density is 0,49 kg/person/day. The average of piles that generated is equal to /person/day or the equivalent of 2.50 kg/person/day (table 1). A total of one day pile generated in Pematangsiantar in 2011 with a population of is about 434,35 m 3 /day [4,6,8]. According to SNI (1995), a waste pile to a small town with a population of < 100,000 of 2.5 1/person/day, equivalent to 0.7 kg/person/day, and the city with the population between 100, ,000 of /person/day, equivalent to 0.8 kg/person/day. While the waste pile in Pematangsiantar with the population > 2 million of /person/day, equivalent to 0.45 kg/person/day [2,6,10] Composition Most compositions are leftovers and foliage 80,73%, plastic 8,52%, paper 6,00%, fabric 0,20%, metal 0,25%, glasses 0.30% and the other of 4.96%. Compared to Astari (2010), in Wonocolo, Surabaya, there are similar composition, which is largely dominated by wet waste in the form of leftovers and foliage 80,73%, plastic 8,52%, paper 6,10% and another 5.25% (metal, glasses, wood, cloth, rubber, etc.) [1,3,5,7]. 379
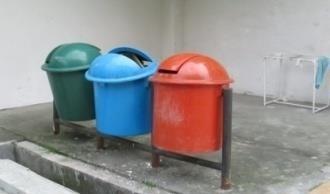
3 Container Based on the SNI (2002), there are some requirements of material, such as not easily damaged and water-resistant, economical and easy to obtain and emptied. While the characteristics of individual and communal waste container are: 1. Box-shaped, cylinder, container, bin (barrel), and is covered. 2. Light, easily moved and easily emptied. 3. Various metals, plastics, fiberglass (GRP), wood, bamboo, rattan. At this moment there is no separation between the organic and anorganic waste container. Most of the public waste container is plastic bags, trash bin, bamboo baskets, sacks and brick container. For communal containers, in some locations such as main streets and in residential areas, a polling station (TPS) is built of concrete and container. Communal containers generally do not have a cover so it is easily disturbed by animals and trash strewn around the TPS, causing odors and disrupt the aesthetic environment Waste collection 1) Residential waste The method of residential waste collection: a) Indirect individual: The officers went to the source of the waste using a flotation device such as a motor and trash carts. b) Indirect communal: This pattern applies to crowded residential areas, narrow alleys and cannot be passed by collection vehicles. c) Direct individual: Conducted door to door using a dump truck in a residential area along the transport path. 2) Nonresidential waste For office/school areas, trash collected by the clerk to be taken to the nearest polling station, while for hospitals and supermarkets/malls, garbage collection is done specifically on the provided containers. The waste collection in the market area carried out by market cleaners, whereas for sweeping, particularly directed at the main streets, sidewalks, parks and other public places. Waste is collected at the nearest polling station and then transported to the TPA Transportation Waste transportation is using two types of vehicles, dump-truck and armroll-truck. Dump truck 27 units (67% 3-7 years old, and 26% between 8-20 years old); and armroll truck 12 units (50% 3-5 years old and 50% between 9-14 years). According to the provisions of the Department of Public Works (2009), technical life-use of litter vehicles is 7 years. Due to this condition, the requirement for dump truck replacement year of units, year of unit, year of units, year of units, and 4 units in year of While armroll truck replacement in year of units, year of units, and 3 units in year of
4 Waste hauling only 2 trips per day due to the distance to the TPA. Based on the provisions of the Department of Public Works (2009), the minimum trip of dump truck per day is 3 with a maximum crew of 3, whereas armroll truck is 1 [3,5,7]. The trip carriage can still be improved, but there is no clerk who recorded the time of arrival and return at TPA sites and the lack of weighbridge to determine the weight of waste transported and the amount of garbage that has piled up in the TPA [2,4,6] Waste Management Assets Budgetting Compared to regional budget of Pematangsiantar 2013, waste management budget in 2013 was very low at ± 076% of the total budget. Then, if the revenue of retribution compared to waste management budget in the 2013, 99,91% comes from the regional budget and 0,09% from retribution. According to the Department of Housing and Infrastructure (2003), budgeting of waste management should receive equal priority with the management of other public services (ranging from 10% local government, regional budget), budgetary resources from the public waste management costs by 70% and 30% of government. The budget of waste management and realization of revenue should be increased as not in accordance with established standards [2,4,6] Level of Existing Waste Service If the total volume compared with the pile transported to the TPA, the existing service level of waste management in 2011 is at 35,24% [1,2,3]. Referring to the Minimum Service Standards (of SPM) Division of Public Works and Spatial Planning in 2014, the target of waste management in urban areas is 70%. This means that the service level provided by the government is very low, and there are 64,76% waste transportation unserved [2,4,6] Level of Existing Assets Service Level of Existing TPS Service If the total capacity of the existing TPS compared to the projection of handling piles, the TPS existing service levels in 2011 of 35,24%, 25,31% in 2012, 23,14% in 2013, 22,25% in 2014, and continually dropped to 59,67% in 2015, with 25,07 % of average annual decline (Table 3). An asset additions program is required to improve service levels to overcome this reduction [4,6,8] Level of Existing Trucks Service If the total capacity of trucks compared to the projections of handling piles per day, the service level of existing trucks in 2011 of 74.53%, 67,78% in ,95% in 2013, 59,67% in 2014, continued to fall to 59,95% in 2015, with an average annual decline of 51,89% (Table 4). Program asset additions of vehicles are required to improve service levels [1,2,3]. 381
5 3.5. Waste Management with Sorting method Regional Technical Implementation Unit (UPTD) Cipta Karya Pematangsiantar divides the waste management service area into five zones (Figure 6). Sorting method was implemented through annual priorities based on service area [2,4]. To determine the sorting of waste management in the TPS, it is necessary to determine the amount of waste can be reduced and residual piles discarded to TPA per service zone by multiplying the percentage composition of the waste with waste management recovery factor (Tables 5 and 6). The level of waste management services with sorting in the TPS can be illustrated as in Figure Based on the illustration, the gradual separation in the TPS per year per zone will increase the services in 2011 about 22,64% with sorting only in zone I 1,70% in 2012 with sorting in zone I and III; 1,75% in 2013 with sorting in zone I, II and III; 3,12% in 2014 with sorting in zone I, II, III and IV; and an increase of 1.65% in 2015 with sorting in zone I, II, III, IV and V, with the average increase of 6.69% (Table 7) Level of Existing Assets Service with Sorting method in TPS Level of Existing TPS Service With a gradual sorting method per service zone, there will be a decrease of service level in 2011 about 12,64 % by sorting only the first zone 31,38% in 2012 with sorting in zone I and III 16,22% in 2013 with sorting in zone I, II and III, 2,75% in 2014 with sorting in zone I, II, III and IV; and 11,34% in 2015 with sorting in zone I, II, III, IV and V, with the average decrease of 1,74% (Table 8) Level of Existing Truck Services Based on the remaining piles are disposed to TPA, sorting and gradual improvement of existing transport service, there will be service improvement in 2011 amounted to 6,78% by sorting only in first zone; 46,40% in 2012 with sorting in zone I and III; 14,04% in 2013 with sorting in zone I, II and III; 6,99% in 2014 with sorting in zone I, II, III and IV; and 12.95% in 2015 with sorting in zone I, II, III, IV and V, with the average improvement of 12.03% (Table 9) Waste Service Improvement with Sorting method in TPS Based on the projected level of waste management services through gradual sorting in the TPS per service zone until 2015, there will be service improvement in 2011 amounted to 8,29%, 15,74% in 2012, 24,87% in 2013, 3.12% in 2014, and 1.65% in 2015, with the average improvement of 6.69% (Table 10) Existing Assets Improvement with Sorting method in TPS Existing TPS Service Improvement Based on the projection of waste management service per zone until 2015, there will be improvement of existing TPS service or lowering the decline level of existing services of TPS in 2011 amounted to 12,60%, 31,38 in 2012, 4.00% in 2013, 2,75% in 2014, and 1,74% in 2015, with the average improvement of 8.29% (Table 11). 382
6 Existing Truck Services Improvement Based on the projection of waste management service per zone until 2015, there will be improvement of existing truck services in 2011 amounted to 6.78%, 9.58% in 2012, 16.18% in 2013, 14.64% in 2014, and 25,47% in 2015, with the average improvement of 8,26% (Table 11) Feasibility Analysis Feasibility analysis using the following assumptions: 1) The polling station is required as temporary dump; 2) It takes at least 1 container in each polling station as a trash container that cannot be reduced/residual waste; 3) The armroll truck is required as a waste carrier vehicle; 4) It requires 2 freelance workers in each polling station for sorting organic materials from wet waste and dry waste such as plastic, paper, metal, bottles/glass, fabric, rubber/leather, and others; and collecting residual waste into containers; 5) Pematangsiantar government is not managing the waste sorting results, junk food scraps and leaves are sold to compost companies, and trash such as plastic, paper, metal, sold to the stalls or factories who received recycled material waste; 6) Waste that cannot be reduced or the resulting residue is managed and disposed of in the landfill; 7) The cost of the initial asset investments made in 2011, assuming the value of depreciation or depreciation of assets as follows: a) TPS, time use for 20 years. b) Containers, disposable time for 7 years. c) Armroll Truck, disposable time for 7 years. d) The cost of equipment, operating costs and maintenance costs are assumed to rise ± 5% every year. e) Sales of sorting results (recycled product) are considered no increase each year and are in the same condition with market demand. f) Analysis of the feasibility took a sample calculation in zone I. 4. Conclusions 4.1. If the waste management is not done, then: 1) The level of existing TPS services averagely decreased 14,99% per year, from 35,24% in 2011 into 19,38% in ) The level of existing truck services averagely decreased 22,70% per year, from 74,59% in 2011 into 51,89% in Through a waste management system with gradual sorting at TPS based on priorities per zone per year of service, then: 1) The level of existing TPS service averagely decreased 8,36% per year, from 8,76% in 2011 into 20,05% in
7 2) The level of existing truck services averagely increased 18,75% per year, from 97,10% in 2011 into 44,84 in ) Can improve service coverage or lowering the rate of decline in existing TPS services by 8,36% per year, which is 27.48% in 2011, 0,88% in 2012, 13,22% in 2013, 0,20% in 2014, and 0,41% in 2015, compared to no waste management. 4) Can improve the existing garbage truck coverage services by 11,42% per year, which is 22,51% in 2011, 21,19% in 2012, 24,20 in 2013, 0,65% in 2014, and 11.43% in 2015, compared to no waste management. 5. References [1] Dinas Kebersihan Kota Pematangsiantar. Rencana Strategis Dinas Kebersihan Kota Pematangsiantar Pematangsiantar. 2011b. [2] Pemerintah Republik Indonesia. Undang-Undang Republik Indonesia Nomor 18 Tahun 2008 tentang Pengelolaan Sampah. Jakarta [3] Badan Standarisasi Nasional. SNI tentang Tata Cara Teknik Operasional Pengelolaan Sampah Perkotaan. Jakarta [4] Tchobanoglous, G., Theisen, H., Vigil, S. Integrated Solid Waste Management Issues. Mc. Graw-Hill International Edition [5] Badan Standarisasi Nasional. SNI tentang Spesifikasi Tumpukan Sampah Untuk Kota Kecil dan Sedang di Indonesia. Jakarta [6] Badan Perencanaan Pembangunan Daerah dan Badan Pusat Statistik Kota Pematangsiantar. Produk Domestik Regional Bruto Kota Pematangsiantar dan Kecamatan Menurut Lapangan Usaha Tahun Pematangsiantar [7] Astari, S. Kajian Model Pengelolaan Sampah Berbasis Masyarakat, (Studi Kasus di Kecamatan Wonocolo Kota Surabaya), Tesis Magister, Institut Teknologi Sepuluh Nopember Surabaya. Surabaya [8] Departemen Pekerjaan Umum. Pedoman Operasional dan Pemeliharaan Prasarana dan Sarana Persampahan. Jakarta [9] Departemen Permukiman dan Prasarana Wilayah. Pedoman Pengelolaan Persampahan Perkotaan Bagi Pelaksana. Jakarta [10] Departemen Pekerjaan Umum. Peraturan Menteri Pekerjaan Umum Nomor 14/PRT/M/2010 tentang Standar Pelayanan Minimal Bidang Pekerjaan Umum dan Penataan Ruang Jakarta
8 Table 1: Piles Measurement Volume No Population (m 3 ) Piles Density Piles (m 3 /person/day) (kg/m 3 ) (kg/person/day) , ,50 Average 0, ,50 Table 2: Projection Level of Waste Services No Year Projection Growth (%) ,35 4, ,73 4, ,1 4, ,48 4, ,86 4,38 Table 3: Level of Existing TPS Services Projection No Year (m 3 /day) Total Load (m 3 ) Service Level (%) , , , , , , ,38 385
9 Table 4: Level of Existing Truck Services No Year Projection (m 3 /day) Capacity (m 3 /day) Service Level (%) , , , , , , ,89 Table 5: Level of Waste Management Services based on the Zone with Sorting method in TPS Year No Service Zone Zone I Siantar West Piles (m 3 /day) 178,21 205,42 206,77 209,22 268,31 Service Level (%) 21,36 21,36 21,36 21,36 21,36 Piles management (m 3 /day) 38,07 43,88 44,17 44,69 57,32 Piles Management Level (%) 15,42 15,42 15,42 15,42 15,42 Reduction (%) 80,73 80,73 80,73 80,73 80,73 Piles reduction (m 3 /day) 30,73 35,42 35,66 36,08 46,27 Residual (m 3 /day) 7,34 8,46 8,51 8,61 11,05 2 Zone II North Siantar 162,62 200,81 201,43 211,1 218,47 Piles (m 3 /day) 21,36 21,36 21,36 21,36 21,36 Service Level (%) 34,74 42,89 43,03 45,09 46,67 Piles management (m 3 /day) 15,41 15,41 15,41 15,41 15,41 Piles Management Level (%) 80,73 80,73 80,73 80,73 80,73 Reduction (%) 28,05 34,63 34,74 36,4 37,68 386
10 Piles reduction (m 3 /day) 6,69 8,26 8,29 8,69 8,99 Residual (m 3 /day) 90,14 92,88 93,01 93,26 94,32 3 Zone III East Siantar 21,36 21,36 21,36 21,36 21,36 Piles (m 3 /day) 19,25 19,84 19,87 19,93 20,15 Service Level (%) 14,45 14,45 14,45 14,45 14,45 Piles management (m 3 /day) 80,73 80,73 80,73 80,73 80,73 Piles Management Level (%) 15,54 16,02 16,04 16,09 16,27 Reduction (%) 3,71 3,82 3,83 3,84 3,88 Piles reduction (m 3 /day) 40 55,26 55,61 68,16 79,92 Residual (m 3 /day) 21,36 21,36 21,36 21,36 21,36 4 Zone IV South Siantar 8,54 11,8 11,89 14,56 17,07 Piles (m 3 /day) 13,52 13,52 13,52 13,52 13,52 Service Level (%) 80,73 80,73 80,73 80,73 80,73 Piles management (m 3 /day) 6,89 9,53 9,6 11,75 13,78 Piles Management Level (%) 1,65 2,27 2,29 2,81 3,29 Reduction (%) 28,53 33,28 35,63 42,71 61,10 Piles reduction (m 3 /day) 21,36 21,36 21,36 21,36 21,36 Residual (m 3 /day) 6,09 7,1 7,61 9,12 13,05 5 Zone V Siantar Martoba 13,45 13,45 13,45 13,45 13,45 Piles (m 3 /day) 80,73 80,73 80,73 80,73 80,73 Service Level (%) 4,92 5,73 6,14 7,36 10,53 387
11 Piles management (m 3 /day) 1,17 1,37 1,47 1,76 2,51 Piles Management Level (%) 4,12 4,12 4,12 4,12 4,12 Reduction (%) 80,73 80,73 80,73 80,73 80,73 Piles reduction (m 3 /day) 126,94 129,16 131,42 133,72 136,06 Residual (m 3 /day) 30,30 30,83 31,37 31,92 32,48 Table 6: Projection of Waste Management based on Service Zone Year No Service Zone Zone I Siantar West Piles (m 3 /day) 178,21 205,42 206,77 209,22 268,31 Service Level (%) 14,35 18,73 23,10 27,48 31,86 Piles Management (m 3 /day) 25,57 38,47 47,76 57,49 85,48 Piles Management Level (%) 4,95 7,51 8,57 12,36 31,39 2 Zone II North Siantar Piles (m 3 /day) 162,62 200,81 201,43 211,10 218,47 Service Level (%) 14,35 18,73 23,10 27,48 31,86 Piles management (m 3 /day) 23,33 37,61 46,53 58,01 69,60 Piles Management Level (%) 4,05 7,23 8,19 9,53 10,46 3 Zone III East Siantar Piles (m 3 /day) 90,14 92,88 93,01 93,26 94,32 Service Level (%) 14,35 18,73 23,10 27,48 31,86 Piles management (m 3 /day) 12,93 17,40 21,49 25,63 30,05 388
12 Piles Management Level (%) 4,24 6,08 9,06 14,30 17,71 4 Zone IV South Siantar Piles (m 3 /day) 40,00 55,26 55,61 68,16 79,92 Service Level (%) 14,35 18,73 23,10 27,48 31,86 Piles management (m 3 /day) 5,74 10,34 12,84 18,73 25,46 Piles Management Level (%) 2,75 2,29 3,09 2,81 2,66 5 Zone V Siantar Martoba Piles (m 3 /day) 28,53 33,28 35,69 42,71 61,10 Service Level (%) 14,35 18,73 23,10 27,48 31,86 Piles management (m 3 /day) 4,09 6,23 8,24 1,17 1,95 Piles Management Level (%) 1,43 6,05 6,12 3,87 2,20 1,43 6,05 6,12 3,87 2,20 Table 7: Level of Waste Management with Sorting method in TPS Year No Service Zone Zone I Sorting 15,63 15,63 15,63 15,63 15,63 Zone II, III, IV and V Projection of Service Level 11,21 14,40 17,60 20,79 23,98 Service Level 26,83 30,02 33,22 36,41 39,61 2 Zone I and III Sorting 29,54 29,54 29,54 29,54 Zone II, IV and V Projection of Service Level 9,38 11,47 13,55 15,63 389
13 Service Level 38,92 41,01 43,09 45,17 3 Zone I, II, and III Sorting 43,93 43,93 43,93 Zone IV and V Projection of Service Level 5,13 6,06 6,99 Service Level 49,06 49,99 50,92 4 Zone I, II, III, and IV Sorting 51,45 51,45 Zone II, III, IV and V Projection of Service Level 2,14 2,47 Service Level 53,59 53,92 5 Zone I, II, III, IV and V Sorting 55,57 Service Level 55,57 Table 8: Level of Existing TPS Service with Sorting method in TPS Year No Service Zone Zone I Sorting 38,07 43,88 44,17 44,69 57,32 Zone II, III, IV and V Projection of Service Level 333,68 402,81 373,04 367,81 526,16 Service Level 8,76 9,18 8,45 8,23 9,18 2 Zone I and III Sorting 298,30 299,78 302,48 362,63 390
14 Zone II, IV and V Projection of Service Level 13,60 13,46 13,22 9,20 Service Level 40,56 40,36 40,00 33,37 3 Zone I, II, and III Sorting 501,21 513,58 580,79 Zone IV and V Projection of Service Level 4,82 4,59 3,59 Service Level 24,14 23,56 20,83 4 Zone I, II, III, and IV Sorting 581,74 661,02 Zone II, III, IV and V Projection of Service Level 3,58 2,77 Service Level 20,80 18,31 5 Zone I, II, III, IV and V Sorting 603,48 Service Level 20,05 44,87 Table 9: Level of Existing Trucks Services with Sorting method in TPS Year No Service Zone Zone I Sorting 499,50 587,65 592,51 624,45 722,12 Zone II, III, IV and V Projection of Service Level 333,68 402,81 373,04 367,81 526,16 391
15 Service Level 97,10 80,43 86,85 88,09 61,58 2 Zone I and III Sorting 298,30 299,78 302,48 362,63 Zone II, IV and V Projection of Service Level 110,05 136,86 161,03 212,54 Service Level 33,97 42,24 49,70 65,60 3 Zone I, II, and III Sorting 501,21 513,58 581,10 Zone IV and V Projection of Service Level 91,24 110,87 141,02 Service Level 18,20 21,59 24,27 4 Zone I, II, III, and IV Sorting 581,74 661,02 Zone II, III, IV and V Projection of Service Level 42,71 61,10 Service Level 98,40 70,34 5 Zone I, II, III, IV and V Sorting 722,12 Total of Residual and Piles Management 722,12 Trucks Service Level (%) 44,87 Table 10: Waste Service Improvement with Sorting method in TPS Year No Service Zone Zone I 392
16 Sorting 22,64 23,17 29,10 41,21 53,73 Projection of Service Level 14,35 18,73 23,10 27,48 31,86 Service Improvement 8,29 4,44 6,00 13,73 21,87 2 Zone I, and III Sorting 38,92 41,01 43,09 45,17 Projection of Service Level 18,73 23,10 27,48 31,86 Service Improvement 20,19 17,91 15,61 13,31 3 Zone I, II, and III Sorting 16,13 15,86 14,94 Projection of Service Level 23,10 27,48 31,86 Service Improvement Zone I, II, III, and IV Sorting 18,98 17,88 Projection of Service Level 27,48 31,86 Service Improvement Zone I, II, III, IV and V Sorting 21,36 Projection of Service Level 31,86 Service Improvement Table 11: Existing TPS Service Improvement with Sorting method in TPS Year No Service Zone Zone I Sorting 8,76 9,18 8,45 8,23 9,18 393
17 Projection of Service Level 35,24 25,31 24,14 22,28 19,38 Service Improvement Zone I, and III Sorting 40,56 40,36 40,00 33,37 Projection of Service Level 25,31 24,14 22,28 19,38 Service Improvement 15,25 16,22 17,72 13,99 3 Zone I, II, and III Sorting 21,14 23,56 20,83 Projection of Service Level 24,14 22,28 19,38 Service Improvement ,28 1,45 4 Zone I, II, III, and IV Sorting 20,80 18,30 Projection of Service Level 22,28 19,38 Service Improvement Zone I, II, III, IV and V Sorting 20,05 Projection of Service Level 19,38 Service Improvement 0,67 Table 12: Existing Trucks Service Improvement With Sorting method in TPS Year No Service Zone Zone I Sorting 97,10 80,40 86,85 88,09 61,58 Projection of Service Level 74,59 67,78 61,95 59,67 51,89 394


18 Service Improvement 22,51 12,62 24,90 28,42 9,69 2 Zone I and III Sorting 33,97 42,40 49,70 65,60 Projection of Service Level 67,78 61,95 59,67 51,89 Service Improvement ,71 3 Zone I, II, and III Sorting 18,20 21,59 24,27 Projection of Service Level 61,95 59,67 51,89 Service Improvement Zone I, II, III, and IV Sorting 98,40 70,34 Projection of Service Level 59,67 51,89 Service Improvement 38,73 18,45 5 Zone I, II, III, IV and V Sorting 44,87 Projection of Service Level 51,89 Service Improvement Figure 1 Potential and Problems of Waste 395

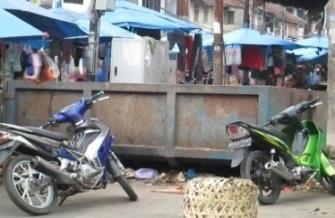
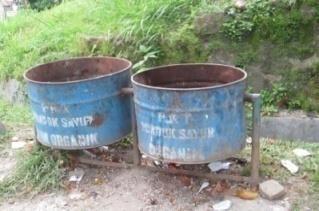
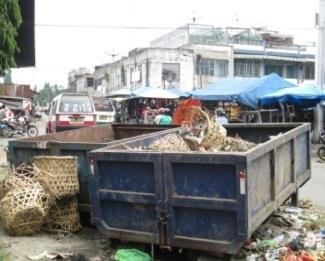
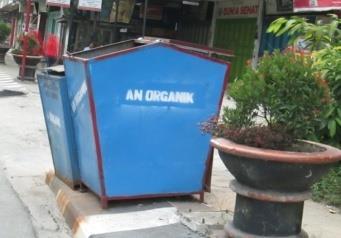
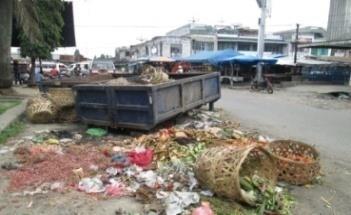
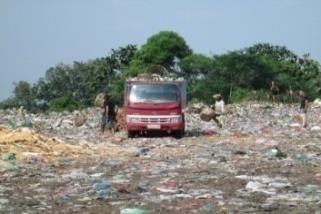
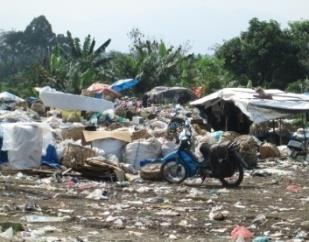
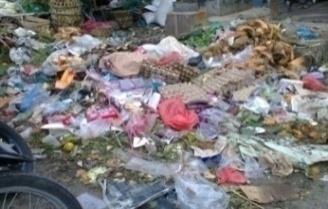
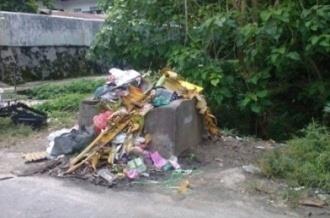
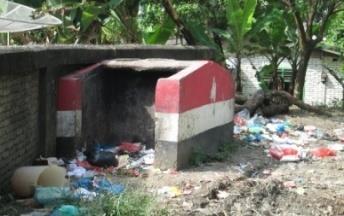
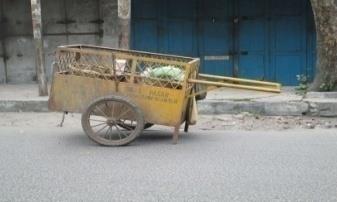
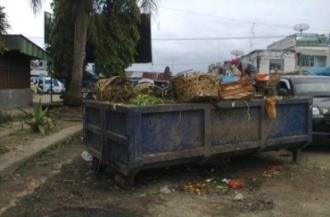
19 Figure 2. Map of the City Administration Pematangsiantar Figure 3 Figure rubbish in TPS Location Figure 4 Sample Image Trash housing complex Figure 5 Sample Image Trash location Parluasan market Pematangsiantar Figure 6 Sample Image Trash location Horas market Pematangsiantar 396
Potential reduction of non-residential solid waste in Sukomanunggal district West Surabaya
 IOP Conference Series: Earth and Environmental Science PAPER OPEN ACCESS Potential reduction of non-residential solid waste in Sukomanunggal district West Surabaya To cite this article: I D A A Warmadewanthi
Priority of Water Supply Service for Community in Gresik City, East Java Province Meidyas Riska Wahyuni 1, Eko Budi Santoso 2, Haryo Sulistyarso 3
 Priority of Service for Community in Gresik City, East Java Province Meidyas Riska Wahyuni 1, Eko Budi Santoso 2, Haryo Sulistyarso 3 1 Master Programme of Urban Development Management, Sepuluh Nopember
Current Status of Solid Waste Transport in Mejayan District of Madiun
 2017, TextRoad Publication ISSN: 2090-4274 Journal of Applied Environmental and Biological Sciences www.textroad.com Current Status of Solid Waste Transport in Mejayan District of Madiun Achmad Kadariswan
SOLID WASTE MANAGEMENT IN SURABAYA. Solid Waste Management Seminar Kitakyushu, September 19-20, 2002
 SOLID WASTE MANAGEMENT IN SURABAYA Solid Waste Management Seminar Kitakyushu, September 19-20, 2002 1. General Figures of Surabaya Surabaya is the second largest city in Indonesia. The area is about 290
Government Policy Strategy in Waste Management on Trade and Reservation Center in Manado City
 IOSR Journal Of Humanities And Social Science (IOSR-JHSS) Volume 23, Issue 2, Ver. 1 (February. 2018) PP 19-23 e-issn: 2279-0837, p-issn: 2279-0845. www.iosrjournals.org Government Policy Strategy in Waste
Mitigation Strategy on Reduction of Greenhouse Gas Emission for the City of Jayapura
 J. Appl. Environ. Biol. Sci., 7(3)1-6, 2017 2017, TextRoad Publication ISSN: 2090-4274 Journal of Applied Environmental and Biological Sciences www.textroad.com Mitigation Strategy on Reduction of Greenhouse
Proceeding of 9 th International Seminar on Industrial Engineering and Management ISSN : X
 DETERMINING THE ROUTE FOR SOLID WASTE TRANSPORTATION FROM TPS TO SPA USING VRP NEAREST NEIGHBOR FOR 10m 3 VEHICLE ON SERVICE AREA SOUTHERN BANDUNG AND EASTERN BANDUNG Wahyukaton 1, Anni Rochaeni 2, Sunarya
Best Practice Summary Padang City, Indonesia. Aspect of Governance: Thematic Area 3: Inclusive urban public services
 Best Practice Summary Padang City, Indonesia Country: Local Government: Type: Best Practice Title: Indonesia Padang City Municipality Waste Collection and Transportation Service of Padang City Aspect of
Utilization of Information Technology for Non Domestic Waste Management in Semarang City
 Utilization of Information Technology for Non Domestic Waste Management in Semarang City Muhammad Ali 1,*,Sudharto P Hadi 1, and Maman Soemantri 2 1 Doctoral Program of Environmental Science, School of
Verry Rainy Christ Warouw, Soemarno, Luthfi Rayes, Budi Prasetyo. Faculty of Agriculture, University of Brawijaya
 Quest Journals Journal of Research in Agriculture and Animal Science Volume 2 ~ Issue 10 (2014) pp: 20-27 ISSN(Online) : 2321-9459 www.questjournals.org Research Paper Effects of Surrounding Community
CHAPTER 1 INTRODUCTION
 1 CHAPTER 1 INTRODUCTION 1.1 Introduction Solid waste problem is quite a continuing important urban issue. Along with the rapid urban growth, the amount of solid waste is growing exponentially, and needs
THE POTENTIAL OF TRANSIT ORIENTED DEVELOPMENT CONCEPT IN REGIONAL CENTER: CASE STUDY IN MALIOBORO DISTRICT, YOGYAKARTA SPECIAL REGION, INDONESIA
 THE POTENTIAL OF TRANSIT ORIENTED DEVELOPMENT CONCEPT IN REGIONAL CENTER: CASE STUDY IN MALIOBORO DISTRICT, YOGYAKARTA SPECIAL REGION, INDONESIA Arissa Sukardi 1*, Suparwoko 1 1 Department of Architecture,
Thermal comfort and settlements quality for eco-settlement based management in Yogyakarta
 Thermal comfort and settlements quality for eco-settlement based management in Yogyakarta Djaka Marwasta 1,*, and Muhamad Nurhidayat 1 1 Department of Environmental Geography, Faculty of Geografi, Universitas
Technology for Waste Management/Infrastructure Chiang Mai (Thailand)
") Technology for Waste Management/Infrastructure Chiang Mai (Thailand) 1.1 Introduction Chiang Mai province has long been suffered from solid waste management problem due to increasing population as well
Technology for Waste Management/Infrastructure Chiang Mai (Thailand) 1.1 Introduction Chiang Mai province has long been suffered from solid waste management problem due to increasing population as well
ACHIEVING WATER SENSITIVE CITY CONCEPT THROUGH MUSRENBANG MECHANISM IN SURABAYA CITY, INDONESIA
 ISSN: 2186-2982 (P), 2186-2990 (O), Japan, DOI: https://doi.org/10.21660/2018.49.3649 Special Issue on Science, Engineering & Environment ACHIEVING WATER SENSITIVE CITY CONCEPT THROUGH MUSRENBANG MECHANISM
Effectiveness of waste management in Mataram City
 IOP Conference Series: Earth and Environmental Science PAPER OPEN ACCESS Effectiveness of waste management in Mataram City To cite this article: B H Widayanti et al 2017 IOP Conf. Ser.: Earth Environ.
Waste Management Strategy in Urban Areas to Achieve the Service Target (A Case Study on Waste Management in Mojokerto, Indonesia)
") JOURNAL OF APPLIED SCIENCES RESEARCH ISSN: 1819-544X Published BY AENSI Publication EISSN: 1816-157X http://www.aensiweb.com/jasr 2016 January; 12(1): pages 18-22 Open Access Journal Waste Management Strategy
JOURNAL OF APPLIED SCIENCES RESEARCH ISSN: 1819-544X Published BY AENSI Publication EISSN: 1816-157X http://www.aensiweb.com/jasr 2016 January; 12(1): pages 18-22 Open Access Journal Waste Management Strategy
The Optimization of Microbus-Based Public Transportation Facilities in Jayapura City. E. M. Bosawer, 2 S. H. Aly, 3 M I. Ramli
 The Optimization of Microbus-Based Public Transportation Facilities in Jayapura City 1 E. M. Bosawer, 2 S. H. Aly, 3 M I. Ramli 1 Public Works and Spatial Planning Office, Papua (Email: erna.bosawer@gmail.com)
Regulatory Framework for Poultry Slaughterhouses: Case Studies in Debotabek Area, Indonesia
 Jurnal Ilmu Produksi dan Teknologi Hasil Peternakan ISSN 2303-2227 Vol. 05 No. 1 Januari 2017 Hlm: 15-22 Regulatory Framework for Poultry Slaughterhouses: Case Studies in Debotabek Area, Indonesia A. Apriantini
Investigation on Municipal Solid Waste Characteristics from Commercial Sources and Their Recycling Potential in Padang City, Indonesia
 IOP Conference Series: Materials Science and Engineering PAPER OPEN ACCESS Investigation on Municipal Solid Waste Characteristics from Commercial Sources and Their Recycling Potential in Padang City, Indonesia
KEY FACTORS FOR REGIONAL URBAN ECO-DRAINAGE EVALUATION
 KEY FACTORS FOR REGIONAL URBAN ECO-DRAINAGE EVALUATION 1 SIH ANDAYANI, 2 BAMBANG. E.YUWONO 1,2 Department of Civil Engineering Faculty of Civil Engineering and Planning Trisakti University E-mail: sandajani23@gmail.com,
Fisherman Settlement and Housing Innovation based on Bioclimatic Design in Surabaya
 M. A. Schnabel (ed.), Back to the Future: The Next 50 Years, (51 st International Conference of the Architectural Science Association (ANZAScA)), 2017, Architectural Science Association (ANZAScA), pp.
Evaluation of Municipal Solid Waste Management in Jember District
 The 5th Sustainable Future for Human Security (SustaiN 2014) Evaluation of Municipal Solid in Jember District Khoiron * Public Health Faculty, Universitu of Jember, Jl. Kalimantan 37 Jember, 68121, Indonesia
Samugyo Ibnu Redjo Profesor and Lecturer at Government Science Faculty of Social and Political Science Padjadjaran University
 The Government Organizational Determinants on Solid Waste Management in Bandung City, Indonesia Herson Simbolon PhD Student at Government Science Faculty of Social and Political Science Padjadjaran University
The analysis of land use weights on road traces selection
 The analysis of land use weights on road traces selection Indrayani 1,2,*, Erika Buchari 3, Dinar D. A. Putranto 3, and Edward Saleh 4 1 Doctoral Student of Environmental Science of Sriwijaya University,
The study of residential life support environment system to initiate policy on sustainable simple housing
 IOP Conference Series: Materials Science and Engineering PAPER OPEN ACCESS The study of residential life support environment system to initiate policy on sustainable simple housing To cite this article:
Value Chain Development as Alternative Method For Mapping Waste Management Muhammad Saiful Hakim 1, Imam Baihaqi 2, Aang Kunaifi 3
 Journal of Innovation in Business and Economics Vol. 01 No. 01 June 2017 Page 11-18 P-ISSN: 2580-9431 http://ejournal.umm.ac.id/index.php/jibe Value Chain Development as Alternative Method For Mapping
REUSE AND RECYCLING AS A SOLUTION TO URBAN SOLID WASTE PROBLEMS IN INDONESIA. Enri Damanhuri and Tri Padmi
 REUSE AND RECYCLING AS A SOLUTION TO URBAN SOLID WASTE PROBLEMS IN INDONESIA Enri Damanhuri and Tri Padmi Department of Environmental Engineering - Institut Teknologi Bandung (DEE-ITB) Jalan Ganesa 10,
TITLE I SWA CODE DEFINITION OF TERMS
 TITLE I Chapter 1.01 SWA CODE DEFINITION OF TERMS 1.01.010 Definitions. Unless the context otherwise requires, the definitions set forth in this chapter shall govern the interpretation of this code. Administrative
Gampong Jawa Landfill of Banda Aceh: A Case Study of Dumpsite Rehabilitation to a Sustainable Landfill
 Gampong Jawa Landfill of Banda Aceh: A Case Study of Dumpsite Rehabilitation to a Sustainable Landfill Mirzayanto 1*, Yulian Gressando 2* 1 Dinas Kebersihan dan Keindahan Kota (DK3) Banda Aceh, Province
IN-ELASTIC PERFORMANCE OF 2D-TWO BAY ORDINARY CONCENTRICALLY BRACED STEEL FRAME
 IN-ELASTIC PERFORMANCE OF 2D-TWO BAY ORDINARY CONCENTRICALLY BRACED STEEL FRAME P.PUDJISURYADI 1*, and TAVIO 2 1 Ph.D student-department of Civil Engineering, Sepuluh Nopember Institute of Technology,
2010 Residential Waste Stream Composition Study Results. Seattle Public Utilities and Neighborhoods Committee March 8, 2011
 2010 Residential Waste Stream Composition Study Results Seattle Public Utilities and Neighborhoods Committee March 8, 2011 Presentation Overview Overview of Seattle waste stream Waste Composition Study
The capacity building of disaster management in Bojonegoro regency
 Journal of Physics: Conference Series PAPER OPEN ACCESS The capacity building of disaster management in Bojonegoro regency To cite this article: P Isbandono et al 2018 J. Phys.: Conf. Ser. 953 012162 View
WASTE. Waste Generation has Increased Since Our Great Grandparent s Day
 WASTE Waste Generation has Increased Since Our Great Grandparent s Day OBJECTIVES: BACKGROUND INFORMATION: Students will begin to understand that our society has experienced cultural changes which affect
The role of waste bank partnership in efforts to decrease waste volume in urban: A case study at a waste bank in Kalibaru, Cilodong, Depok City
 IOP Conference Series: Earth and Environmental Science PAPER OPEN ACCESS The role of waste bank partnership in efforts to decrease waste volume in urban: A case study at a waste bank in Kalibaru, Cilodong,
The Study of Residential Life Support Environment System to Initiate Policy on Sustainable Simple Housing
 The Study of Residential Life Support Environment System to Initiate Policy on Sustainable Simple Housing Nelson M. Siahaan 1,*, Agus S. Harahap 2, Esther Nababan 3 and Ernestasia Siahaan 4 1 Department
New concept for the collection and management of wastes collected from households in greater Cairo. Aiman A. Rsheed and Rashwan T.N.
 New concept for the collection and management of wastes collected from households in greater Cairo. Aiman A. Rsheed and Rashwan T.N. Al Mashhour UNESCO-Africa Engineering Week with Africa Engineering Conference
Civil Engineering Dimension, Vol. 20, No. 1, March 2018, ISSN print / ISSN X online
 Civil Engineering Dimension, Vol. 20, No. 1, March 2018, 35-40 ISSN 1410-9530 print / ISSN 1979-570X online DOI: 10.9744/CED.20.1.35-40 Performance of an Existing Reinforced Concrete Building Designed
Solid Waste Management of Balikpapan. By City Government of Balikpapan
 Solid Waste Management of Balikpapan By City Government of Balikpapan Presentation Outline 1. Introduction to Balikpapan 2. Solid Waste Management Portrait 3. Recent and Future Strategy 4. Composting in
Tree risk identification, assessment and mitigation in Universitas Indonesia s urban forest
 IOP Conference Series: Earth and Environmental Science PAPER OPEN ACCESS Tree risk identification, assessment and mitigation in Universitas Indonesia s urban forest To cite this article: E Pradipta et
HUMAN RESOURCE COMPETENCE DEVELOPMENT MODEL IN BANDUNG CITY TOURISM AS AN ATTEMPT TO IMPROVE THE COMPETITIVENESS OF TOURISM SECTOR 1
 ASEAN Journal on Hospitality and Tourism, Vol 14, pp. 114-124 Printed in Indonesia. All right reserved. HUMAN RESOURCE COMPETENCE DEVELOPMENT MODEL IN BANDUNG CITY TOURISM AS AN ATTEMPT TO IMPROVE THE
The Effect of Coal Powder Addition to Asphalt Concrete - Wearing Course (AC-WC) Mixture to Increase Road Surface Hardness Quality
 Mixture to Increase Road Surface Hardness Quality") IOP Conference Series: Materials Science and Engineering PAPER OPEN ACCESS The Effect of Coal Powder Addition to Asphalt Concrete - Wearing Course (AC-WC) Mixture to Increase Road Surface Hardness Quality
IOP Conference Series: Materials Science and Engineering PAPER OPEN ACCESS The Effect of Coal Powder Addition to Asphalt Concrete - Wearing Course (AC-WC) Mixture to Increase Road Surface Hardness Quality
Sustinere Journal of Environment and Sustainability
 Sustinere Journal of Environment and Sustainability Volume 1 Issue 2 (2017) 74 83 Print ISSN: 2549-1245 Online ISSN: 2549-1253 Website: https://sustinerejes.com E-mail: sustinere.jes@iain-surakarta.ac.id
Department of Environmental Engineering, Faculty of Engineering, Universitas Andalas, Kampus Limau Manis Padang, Indonesia 2
 IMPROVEMENT OF MUNICIPAL SOLID WASTE MANAGEMENT USING LIFE CYCLE ASSESSMENT APPROACH FOR REDUCING HOUSEHOLD HAZARDOUS WASTE CONTAMINATION TO ENVIRONMENT IN INDONESIA: A CASE STUDY OF PADANG CITY Slamet
Preliminary Research on
 Preliminary Research on 2 November, 2017 Maryono, Yukie Ochi, Satria Utama, M. Luthfi, Intan Hapsari, Nugroho Budi S, Fujino Junichi, We are here Semarang City 1 Semarang in 100RC program 100RC is initiated
Adoption of decentralised waste management systems in Zanzibar
 Adoption of decentralised waste management systems in Zanzibar Centre for Science and Environment New Delhi, India EXISTING WASTE MANAGEMENT PRACTICES IN ZANZIBAR Zanzibar municipality is divided into
The Three R's Adapted from Municipal Solid Waste Management: Source Reduction Teacher' Guide
 The Three R's Adapted from Municipal Solid Waste Management: Source Reduction Teacher' Guide Overview Students distinguish between trash, garbage, and litter. They first pick up the litter on the school
https://doi.org/ /matecconf/
 Development of audit technology approach for performance improvement of faecal sludge treatment plant (IPLT) (Case study: IPLT Bawang in Tangerang City and IPLT Pecuk in Indramayu District) Rydha Riyana
Copyright Waste4Change All Right Reserved. Waste4Change Your Responsible Waste Management Solution
 Copyright Waste4Change All Right Reserved Waste4Change Your Responsible Waste Management Solution Copyright Waste4Change All Right Reserved Who Is Waste4Change? PT Wasteforchange Alam Indonesia A social-enterprise
Evaluation of Environmental Sanitation Hygiene Program in Prevention of Diarrhea Incidence in The Working Area of Kolaka District Health Office
 Evaluation of Environmental Sanitation Hygiene in Prevention of Diarrhea Incidence in The Working Area of Kolaka District Health Office Mung Rahadi 1 *, Lilis Sulistyorini 2, Satya Haksama 3 Environmental
Time And Cost Comparison Of Conventional And Alternative Plate Hollow Slab, Halfslab And Metaldeck
 Time And Cost Comparison Of Conventional And Alternative Plate Hollow Slab, Halfslab And Metaldeck Trijeti, Farid Dwi Atmawan, Muhamad Aswanto Abstract: With the development and fabrication of construction
Solid Waste Management in Dipayal Silghadi Municipality
 Solid Waste Management in Nepalese Municipalities 19 Solid Waste Management in Dipayal Silghadi Municipality His Majesty's Government Ministry of Local Development Solid Waste Management and Resource Mobilisation
Implementation of zero waste concept in waste management of Banda Aceh City
 Journal of Physics: Conference Series PAPER OPEN ACCESS Implementation of zero waste concept in waste management of Banda Aceh City To cite this article: M Nizar et al 2018 J. Phys.: Conf. Ser. 1116 052045
The Analysis of Administrative Law to the Government Policy about Tax Exemption of Waqf Land Certification
 The Analysis of Administrative Law to the Government Policy about Tax Exemption of Waqf Land Certification Islamiyati 1,R. Bondan Agung Kardono 1, and Aditya Wirawan 2* 1 Doctoral Program of Law Science,
Landfills Leachates Quality and Quantity in Tidal Area in Banjarmasin Landfills, Indonesia
 Resources and Environment 2016, 6(2): 23-27 DOI: 10.5923/j.re.20160602.01 Landfills Leachates Quality and Quantity in Tidal Area in Banjarmasin Landfills, Indonesia Irfa i 1,*, Bagyo Yanuwiadi 2, Suyadi
Waste Statistics 2017
 Waste Statistics 2017 Released Date: October 2015 Contents INTRODUCTION... 3 WASTE IN ABU DHABI EMIRATE... 4 NON-HAZARDOUS WASTE... 5 SOLID WASTE GENERATION... 5 SOLID WASTE DISPOSAL... 8 MUNICIPAL SOLID
Analysis of Thermal Comfort SNI In Green Open Space Siring Tendean Banjarmasin-Indonesia
 Analysis of Thermal Comfort SNI 03-6572 In Green Open Space Siring Tendean Banjarmasin-Indonesia Akbar Rahman, Shoichi Kojima Abstract Save energy in building environment becomes a popular concept for
Eurasia: Economics & Business, 2(8), February 2018 DOI
, February 2018 DOI") UDC 331 STRATEGIC PLANNING OF HUMAN RESOURCES DEVELOPMENT: A STUDY OF HUMAN RESOURCE DEVELOPMENT INDUSTRY AT EDUCATION AND TRAINING CENTER OF THE MINISTRY OF INDUSTRY (INDONESIA) Adrianto Adiar*, Saleh
UDC 331 STRATEGIC PLANNING OF HUMAN RESOURCES DEVELOPMENT: A STUDY OF HUMAN RESOURCE DEVELOPMENT INDUSTRY AT EDUCATION AND TRAINING CENTER OF THE MINISTRY OF INDUSTRY (INDONESIA) Adrianto Adiar*, Saleh
Carver County Residential Organics Project. Co-mingling Organics With Yard Waste
 Carver County Residential Organics Project Co-mingling Organics With Yard Waste Organics Management Solid Waste Coordinating Board Region Livestock Feed Manufacturing - 60,000 tons Livestock Feeding -
Second Meeting of the Regional 3R Forum in Asia Kuala Lumpur, Malaysia Solid Waste Management in Lao PDR. 6 October, 2010
 Second Meeting of the Regional 3R Forum in Asia Kuala Lumpur, Malaysia 4-64 6 October, 2010 Solid Waste Management in Lao PDR Presented by: Dr. Bounleuam SISOULATH, Chairman of Council of Sciences and
The Effect of Alternative Energy Utilization from Landfill on Methane Emission Reduction
 ISSN 2413-5453 Volume 2 (2015) 30-36 New, Renewable Energy and Energy Conservation Conference and Exhibition (The 3rd Indonesia EBTKE-ConEx, 2014) The Effect of Alternative Energy Utilization from Landfill
Solid Waste Management in Kalaiya Municipality
 Solid Waste Management in Nepalese Municipalities 29 Solid Waste Management in Kalaiya Municipality His Majesty's Government Ministry of Local Development Solid Waste Management and Resource Mobilisation
PERSPECTIVE OF SOLID WASTE COLLECTION IN THE CITY OF KIGALI
 AFRICA ENGINEERING CONFERENCE (AEC) 2017 PERSPECTIVE OF SOLID WASTE COLLECTION IN THE CITY OF KIGALI BY TWAGIRA Elias (PhD), Pr. Eng. BARISANGA Fabrice (MSc.) Pr. Eng NDAYISABA Cyprien (Msc). Environment
SUNYA - Towards Zero Waste Initiative of Coimbatore City Municipal Corporation
 SUNYA - Towards Zero Waste Initiative of Coimbatore City Municipal Corporation Rajasthan Mayors Conference, Udaipur, April 27, 2016 Amar Deep Singh, CUTS SUNYA PROJECT Ward 23 has been selected as Model
Community-Based Waste Management For Green And Clean Surabaya
 American Journal of Engineering Research (AJER) e-issn: 2320-0847 p-issn : 2320-0936 Volume-7, Issue-7, pp-305-309 www.ajer.org Research Paper Open Access Community-Based Waste Management For Green And
Factors Affecting Local Government Business Organization Change in Indonesia: Case Study in West Java
 Review of Integrative Business and Economics Research, Vol. 6, no. 2, pp.268-273, April 2017 268 Factors Affecting Local Government Business Organization Change in Indonesia: Case Study in West Java Sam
Technologies for Waste Management/Infrastructure Agra (India)
") Technologies for Waste Management/Infrastructure Agra (India) 1. SOLID WASTE MANAGEMENT A typical waste management system in Agra is similar to any other medium city in India and has following major steps:
Technologies for Waste Management/Infrastructure Agra (India) 1. SOLID WASTE MANAGEMENT A typical waste management system in Agra is similar to any other medium city in India and has following major steps:
Evironmental Management at the Household, the case of Bekasi City
 E3S Web of Conferences 73, 716 (218) https://doi.org/1.151/e3sconf/21873716 ICENIS 218 Evironmental Management at the Household, the case of Bekasi City Ayu Arni Sarah 1, Hayati Sari Hasibuan 2,*, and
Priority Scale of Waste Management Policies that Support Environmental Hygiene in City of Ternate
 International Journal of Ecosystem 2015, 5(1): 9-21 DOI: 10.5923/j.ije.20150501.02 Priority Scale of Waste Management Policies that Support Environmental Hygiene in City of Ternate Anthonius F. Raffel
Design of Integrated Sanitation Facilities in Bojonegoro
 J. Appl. Environ. Biol. Sci., 8(2)31-36, 2018 2018, TextRoad Publication ISSN: 2090-4274 Journal of Applied Environmental and Biological Sciences www.textroad.com Design of Integrated Sanitation Facilities
2017 Iowa Statewide Waste Characterization Study
 2017 Iowa Statewide Waste Characterization Study Agenda 1. Purpose of waste characterization studies 2. Background of 2017 Iowa Statewide study 3. Waste sort process 4. Results 5. Resulting initiatives
UNIT II. Part A (2 Marks) 1. What are the 4 R s in waste hierarchy? [N/D-16] Reduction,Resuse,Recovery,Recycling
![UNIT II. Part A (2 Marks) 1. What are the 4 R s in waste hierarchy? [N/D-16] Reduction,Resuse,Recovery,Recycling](/thumbs/89/99635483.jpg "UNIT II. Part A (2 Marks) 1. What are the 4 R s in waste hierarchy? [N/D-16] Reduction,Resuse,Recovery,Recycling") UNIT II Part A (2 Marks) 1. What are the 4 R s in waste hierarchy? [N/D-16] Reduction,Resuse,Recovery,Recycling 2. List the various advantages of waste segregation? [N/D-16] To reduce the volume of waste
UNIT II Part A (2 Marks) 1. What are the 4 R s in waste hierarchy? [N/D-16] Reduction,Resuse,Recovery,Recycling 2. List the various advantages of waste segregation? [N/D-16] To reduce the volume of waste
Nicosia Municipality Waste Management Practices and Policies. Nicosia 23 October 2016
 Nicosia Municipality Waste Management Practices and Policies Nicosia 23 October 2016 1 Michael Lagos Municipal Health Inspector Head of Nicosia Municipality Cleaning and Health Department 2 Task of the
A Case Study on Generation and Composition of Solid Waste in Ward no. 53 of Belagavi city
 A Case Study on Generation and Composition of Solid Waste in Ward no. 53 of Belagavi city Amar S. Byakodi Assistant Professor, Dept. of Civil Engineering, Angadi Institute of Technology and Management,
The toilet sanitation management to meet healthy house standards
 IOP Conference Series: Earth and Environmental Science PAPER OPEN ACCESS The toilet sanitation management to meet healthy house standards To cite this article: Anung B Studyanto et al 2018 IOP Conf. Ser.:
Reduce, Reuse, Recycle. Lesson Plan: NRES G1-1
 Reduce, Reuse, Recycle Lesson Plan: NRES G1-1 1 Anticipated Problems 1. What do reduce, reuse, and recycle mean? 2. Why is reducing, reusing, and recycling important? 2 Terms recycling reducing reusing
THE OVERVIEW OF WASTE MANAGEMENT ISSUES RELATED TO BANDUNG CITY S SMART CITY CONCEPT".
 THE OVERVIEW OF WASTE MANAGEMENT ISSUES RELATED TO BANDUNG CITY S SMART CITY CONCEPT". 7.63 % economic growth 55% SMEs 6 Million Tourist Annually coming to bandung ENVIRONMENTAL ISSUES Land Use problem
Waste. Solid Waste Management
 Solid Waste Management Environmental Engineering Zerihun Alemayehu (AAiT-CED) Waste Solid waste: Any material that is thrown away or discarded as useless and unwanted. municipal solid waste (MSW): Solid
Refuse derived fuel potential in DKI Jakarta
 IOP Conference Series: Earth and Environmental Science PAPER OPEN ACCESS Refuse derived fuel potential in DKI Jakarta To cite this article: H Widyatmoko 2018 IOP Conf. Ser.: Earth Environ. Sci. 106 012099
Chapter - VII SUMMARY AND CONCLUSION
 Chapter - VII SUMMARY AND CONCLUSION Waste management is a critical problem for the local self governments. The unscientific method of dumping waste in open space creates several environmental as well
WASTE MINIMIZATION AS SOLUTION OF MUNICIPAL SOLID WASTE PROBLEM IN INDONESIA. by: Dr. Enri Damanhuri
 WASTE MINIMIZATION AS SOLUTION OF MUNICIPAL SOLID WASTE PROBLEM IN INDONESIA by: Dr. Enri Damanhuri Department of Environmental Engineering, Institut Teknologi Bandung Jl. Ganesa 10 Bandung 40132, Indonesia
Saskatoon Talks Trash: Curbside. Pop-Up Conversations Feedback Summary
 Saskatoon Talks Trash: Curbside Pop-Up Conversations Feedback Summary Prepared by Lura Consulting for the City of Saskatoon April 20 th, 2018 Pop-Up Conversation Feedback Summary Pop-Up engagement was
Summary of Key Results
 Attachment 1 Summary of Key Results The 2016 Waste Characterization Study involved an extensive year-long process that produced a precise estimate of waste quantity and waste composition. Methods used
Solid Waste Management in Bharatpur Municipality
 Solid Waste Management in Nepalese Municipalities 6 Solid Waste Management in Bharatpur Municipality His Majesty's Government Ministry of Local Development Solid Waste Management and Resource Mobilisation
Principles and concepts in designing tropical-shore settlement in estuary ecosystem, case study: Weriagar District, Bintuni Bay
 IOP Conference Series: Earth and Environmental Science PAPER OPEN ACCESS Principles and concepts in designing tropical-shore settlement in estuary ecosystem, case study: Weriagar District, Bintuni Bay
The Tensile Strength of Hooked Brick
 The Tensile Strength of Hooked Brick Marwahyudi, S. Pd, M.T 1 Interior Design Program, Faculty of Design, Sahid Surakarta University Jl Adi Sucipto 4, Surakarta, Central Java, Indonesia 57144 Abstract
Ch Solid and Hazardous Waste
 Ch. 22 - Solid and Hazardous Waste Love Canal Tragedy 1492-1953 Hooker Chemicals and Plastics dumped chemical wastes into the Love Canal The company filled the canal and sold it to the Niagara Falls school
B. The approximate number of persons expected to attend the dance;
 D. The licensee is responsible for maintaining order at the incidental dancing business. In the event the licensee fails to maintain order, the Council may undertake necessary measures to ensure proper
2015 King County Waste Characterization and Customer Survey Report
 2015 King County Waste Characterization and Customer Survey Report King County Waste Monitoring Program FINAL Table of Contents Executive Summary... 1 1. Project Purpose and Background... 5 King County
Department of Civil Engineering, Khulna University of Engineering & Technology (KUET), Bangladesh,
, Bangladesh,") SCENARIO OF EXISTING SOLID WASTE MANAGEMENT PRACTICES AND INTEGRATED SOLID WASTE MANAGEMENT MODEL FOR DEVELOPING COUNTRY WITH REFERENCE TO JHENAIDAH MUNICIPALITY, BANGLADESH Md. Ashik Ahmed 1 and Shuvra
SCENARIO OF EXISTING SOLID WASTE MANAGEMENT PRACTICES AND INTEGRATED SOLID WASTE MANAGEMENT MODEL FOR DEVELOPING COUNTRY WITH REFERENCE TO JHENAIDAH MUNICIPALITY, BANGLADESH Md. Ashik Ahmed 1 and Shuvra
Procedia - Social and Behavioral Sciences 227 ( 2016 ) Retno Widjajanti a * Central Java, Indonesia
 Retno Widjajanti a * Central Java, Indonesia") Available online at www.sciencedirect.com ScienceDirect Procedia - Social and Behavioral Sciences 227 ( 2016 ) 186 193 CITIES 2015 International Conference, Intelligent Planning Towards Smart Cities, CITIES
Available online at www.sciencedirect.com ScienceDirect Procedia - Social and Behavioral Sciences 227 ( 2016 ) 186 193 CITIES 2015 International Conference, Intelligent Planning Towards Smart Cities, CITIES
TITLE 17 REFUSE AND TRASH DISPOSAL 1 REFUSE
 17-1 TITLE 17 REFUSE AND TRASH DISPOSAL 1 CHAPTER 1. REFUSE. CHAPTER 1 REFUSE SECTION 17-101. Definitions. 17-102. Administration. 17-103. Regulations governing residential service. 17-104. Regulations
McMaster University Waste Audit Report
 McMaster University Waste Audit Report Introduction On April 5, 2006 WSI (Waste Services) as requested by Mc Master University conducted a one-day waste audit. The purpose of this audit was to identify
EVALUATION OF ENVIRONMENTAL AND SOCIO- CULTURAL DIMENSIONS OF SUSTAINABILITY ECO- AIRPORT INTERNATIONAL AIRPORT SULTAN HASANUDDIN
 Man In India, 95 (3) : 703-713 Serials Publications EVALUATION OF ENVIRONMENTAL AND SOCIO- CULTURAL DIMENSIONS OF SUSTAINABILITY ECO- AIRPORT INTERNATIONAL AIRPORT SULTAN HASANUDDIN Natsir Abduh and Gufran
Guidance on Debris Management for Recovery: Lessons Learned
 Guidance on Debris Management for Recovery: Lessons Learned 1. General The main priority is to focus on those recovery and collection activities that will be the quickest to implement, with the least amount
Solid Waste Management in Itahari Municipality
 Solid Waste Management in Nepalese Municipalities 26 Solid Waste Management in Itahari Municipality His Majesty's Government Ministry of Local Development Solid Waste Management and Resource Mobilisation
THE ROLE OF SOCIAL CAPITAL AND PARTICIPATION ON THE TECHNICAL EFFECTIVENESS OF IRRIGATION MANAGEMENT: A CASE STUDY OF NALAN DISTRICT IRRIGATION AREA
 DOI https://doi.org/10.18551/rjoas.2018-03.12 THE ROLE OF SOCIAL CAPITAL AND PARTICIPATION ON THE TECHNICAL EFFECTIVENESS OF IRRIGATION MANAGEMENT: A CASE STUDY OF NALAN DISTRICT IRRIGATION AREA Listiani
THREE (3)-YEAR UPDATE For SOLID WASTE MANAGEMENT PLAN CLAY COUNTY PLANNING AREA JULY 1, JUNE 30, 2019
-YEAR UPDATE For SOLID WASTE MANAGEMENT PLAN CLAY COUNTY PLANNING AREA JULY 1, JUNE 30, 2019") THREE (3)-YEAR UPDATE For SOLID WASTE MANAGEMENT PLAN CLAY COUNTY PLANNING AREA JULY 1, 2009 - JUNE 30, 2019 JEFFREY R. BISHOP, P.E. Engineering Planning Finance Post Office Box 2259 Asheville, North Carolina
THREE (3)-YEAR UPDATE For SOLID WASTE MANAGEMENT PLAN CLAY COUNTY PLANNING AREA JULY 1, 2009 - JUNE 30, 2019 JEFFREY R. BISHOP, P.E. Engineering Planning Finance Post Office Box 2259 Asheville, North Carolina
Optimum concrete compression strength using bio-enzyme
 Optimum concrete compression strength using bio-enzyme Tony Hartono Bagio 1,*, Makno Basoeki 2, Julistyana Tistogondo 1, and Sofyan Ali Pradana 1 1 Narotama University, Surabaya, Indonesia 2 Engineer of