Impacts of Transportation Infrastructure on the U.S. Cotton Industry
|
|
|
- Francine Henderson
- 6 years ago
- Views:
Transcription

1 Impacts of Transportation Infrastructure on the U.S. Cotton Industry Parr Rosson, Flynn Adcock, Rafael Costa and John Robinson 1 CNAS May 2011 Prepared under Cooperative Agreement No A-5017 between the Agricultural Marketing Service/USDA and Texas AgriLife Research. This Project is supported by USDA-NIFA Grant No , Center for North American Studies. 1 Rosson is Professor/Extension Economist and Director, Center for North American Studies; Adcock is International Program Coordinator and Assistant Director, Center for North American Studies; Costa is Graduate Research Assistant, Center for North American Studies; and Robinson is Professor/Extension Economist, Texas AgriLife Extension Service. For more information, Please call or prosson@tamu.edu. All are located in the Department of Agricultural Economics, Texas A&M University, College Station, Texas
2 Introduction Impacts of Transportation Infrastructure on the U.S. Cotton Industry The U.S. transportation system, including roads, air, rail, waterways and ports is under constant use and strain. At a recent conference at the University of Virginia it was concluded Before the onset of the recession, bottlenecks in all transport modes had begun to compromise both the quality of people s lives and America s global competitiveness. Today, the transportation system s deficiencies will almost certainly impede the pace of economic recovery, (Miller Center of Public Affairs). The U.S. cotton industry operates within these constraints and its competitiveness is linked directly to the efficiency of U.S. and global systems and transportation infrastructure. Overview The United States is the world s third largest cotton producer and the largest exporter, supplying 17 percent of the global cotton production since 2000 and accounting for 38 percent of the world export market (USDA). U.S. cotton production is concentrated in the Southern Plains, Southeast, Delta, and Western regions of the United States with Texas producing 45.3 percent of all U.S. cotton in Georgia, Arkansas, California, North Carolina and Mississippi each were responsible for producing between five and 12 percent of U.S. cotton production (NASS). The principal markets for U.S. cotton are China, Turkey, Mexico, Indonesia, Pakistan, Thailand and, more recently, Vietnam. In the last two decades, the U.S. cotton sector has faced a number of challenges as the domestic mill demand has declined and U.S. exports have increased. During the 1990s, for example, domestic mill demand accounted for about fifty percent of available cotton supplies. Due to the decrease in domestic textile production caused by competition from imported textile and apparel products, U.S. mill use dropped to 30 percent for and has averaged less than 20 percent annually since then. The resulting cotton surplus forced the industry to look for alternative markets. Significant changes in the global market for cotton and cotton-based products, particularly an increase in the global export demand, have provided overseas markets for U.S. cotton. As a result, U.S. cotton exports rose to 17.7 million bales in 2005/06, more than triple levels of a decade earlier, before settling at about 13 million bales in recent years. The emergence of China as the world largest cotton importer has resulted in a strong, but somewhat variable market for U.S. cotton. Currently, about 31 percent of all global cotton exports go to China (USDA). The United States is responsible for about 40 percent of China s total cotton imports, representing 26 percent of U.S. cotton production. The global demand for cotton is expected to grow in the future. According to USDA, world cotton mill use reached a record million bales in 2006/07, and nearly matched that at million bales in 2007/08 (USDA). While world use dropped to million bales in 2008/09 due to the global economic downturn, cotton use has recovered to average about 117 million bales for the past two years. China and India have experienced the greatest gains in cotton use since The continuing increase in world demand for cotton is a good sign for the U.S. cotton industry as it offsets the decline in the domestic mill demand. The United States 1
3 continues to be the largest supplier of cotton to the world market and is forecast to account for 41 percent of world trade in 2010/2011. Because the U.S. cotton industry is highly dependent on foreign markets, it is important for the industry to keep U.S. cotton competitive with foreign suppliers such as India and Uzbekistan. Transportation is one of the major factors that affect the competitive position of U.S. cotton, allowing the delivery of cotton to international markets in a timely, cost effective manner. The increase in U.S. cotton exports has clearly resulted in a shift in trade patterns and logistical requirements. In particular, increasing cotton demand in China and other Asian countries has increased cotton shipments to congested U.S. west coast ports (Fraire et al.). This problem was exacerbated during 2008 as Atlantic and Gulf ports became increasingly inaccessible for containerized cotton exports. Outgoing grain and oilseed exports required a greater number of containers and berths at ports. Delta and Southeast cotton shipments to China were increasingly shipped via the West Coast instead of Savannah, which resulted for the first time in a declining futures market basis for Delta/SE cotton relative to Texas cotton. While port congestion has eased since that time due to the global economic downturn, adequate transportation infrastructure that guarantees cotton shipments in a timely, efficient manner will provide a greater level of competitiveness for U.S. cotton exports in the future. Consequently, the primary objective of this study is to evaluate U.S transportation infrastructure serving the cotton industry. Furthermore, this study will analyze the potential impacts of transportation infrastructure improvements on the U.S. cotton industry, focusing on requirements in Texas, Arkansas and Louisiana. These states were chosen because they are contiguous and, when taken together, account for about half of U.S. cotton production. While production is high in this region, only about one-quarter of U.S. cotton exports are shipped via Texas and Louisiana ports. This is in contrast to the western cotton states of California, Arizona and New Mexico that account for less than ten percent of cotton production. About one-half of U.S. cotton exports, however, are shipped through western seaports. Further, the proximity of Texas, Arkansas, and Louisiana to Mexico merits analysis because of Mexico s prominence as a major market. Finally, improvements and expansion of the Panama Canal are analyzed to assess the impacts on cotton shipping patterns in the United States and globally. Many of the logistical and infrastructure issues affecting the cotton industry in recent years have related to major producing states. The task of accumulating cotton in this production area for shipment to the Texas-Mexico border, Gulf ports, and western U.S. ports is of major importance to the overall competitiveness of the U.S. cotton industry. Inefficiencies with this process, however, emphasize the need for additional study. Global container fleet capacity is forecast to increase from 13.2 million twenty-foot equivalent units (TEU) in 2010 to 16.8 million TEU in 2013, placing additional demand on U.S. ports and transportation system infrastructure (ACP 2010). The demand for containers for the export of corn, wheat, oilseeds, and distiller s dry grain (DDG) increased from 306,000 TEU in 2003 to 804,000 TEU in While this represents a relatively small share of total containers available for U.S. cargo, much of the increased demand occurred at the ports of Savannah and Norfolk. Part of the reason for this was the significant increase in freight rates for bulk cargo during this time period. The situation resulted in a shortage of containers on the East Coast and 2
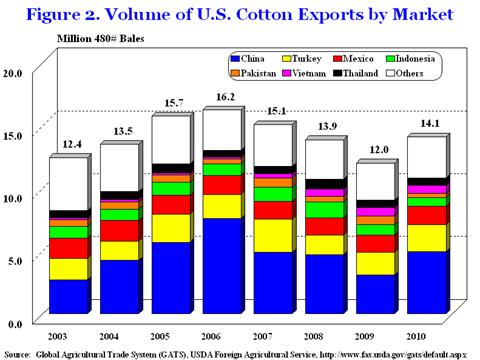
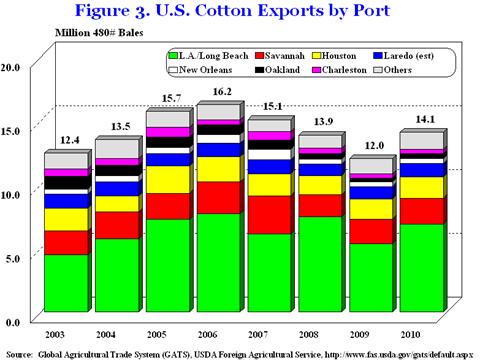
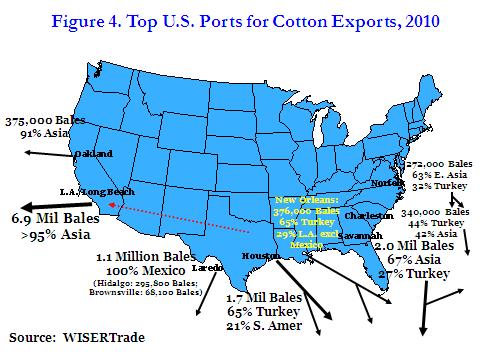
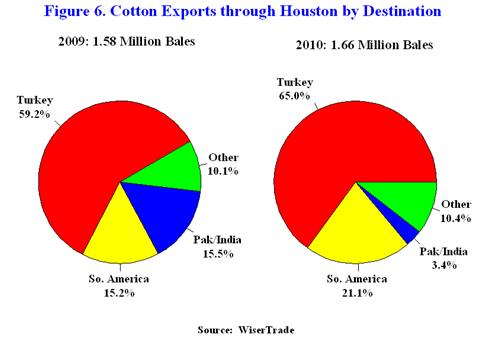
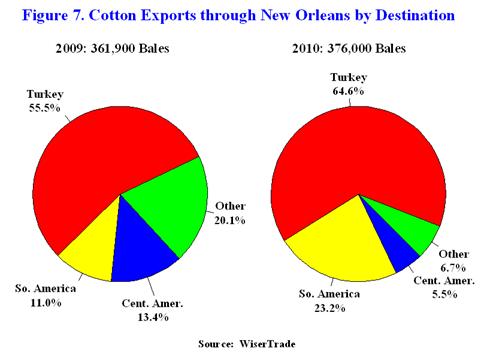
4 led to the increased shipments of cotton to the West Coast for export. Although congestion and container shortages were mitigated somewhat by the recent economic recession, global cargo shipments have recovered and are expected to again strain the U.S. port system. Trends in U.S. Cotton Exports U.S. cotton exports grew 128 percent to 16.2 million bales from 2000 to 2006 before beginning a downward trend (figure 1). Following this steady drop, cotton exports stood at 12.0 million bales in 2009 for a three-year drop of 26 percent. However, 2010 U.S. cotton exports were 17.5 percent over 2009 and slightly more than in A return to higher cotton exports will place additional strain on the transportation system. The largest export market for U.S. cotton is China, which imported 4.9 million bales of U.S. cotton during 2010, down from 7.6 million bales in While China has been the largest market for U.S. cotton exports since 2003, it was only the eighth leading market during 2000 and tenth in 2001 (figure 2). Following China are Turkey, at 2.1 million bales during 2010, Mexico (1.4 million bales), Indonesia (704,000 bales), Vietnam (628,000 bales), Thailand (618,000 bales) and Taiwan (469,000 bales). With the exception of Vietnam, which did not register in the top ten until 2007, the others have all been consistently been in the top seven or eight export markets for U.S. cotton. As some markets have grown in importance, others have decreased. Examples of declining markets for U.S. cotton include Japan, Hong Kong, and the EU. India and Pakistan are stronger markets during some years and less important in others. India received 532,000 bales of U.S. cotton in 2003 before averaging 211,000 bales during , while Pakistan received more than 700,000 bales in both 2007 and 2009 but less than 430,000 bales in 2008 and While the importance of export markets for U.S. cotton has changed over the years, the importance of U.S. ports has stayed relatively constant. Los Angeles, Savannah, Long Beach, Houston, and Laredo have occupied the top five ports for the export of U.S. cotton for the 2003 to 2010 time period, and usually in that order (figure 3). What has changed is the relative importance of Los Angeles/Long Beach (LA/LB). In 2003, LA/LB accounted for 36 percent of all U.S. cotton exports. While high, it has not been below forty percent since and reached a high of 54 percent (7.4 million bales) in Savannah remains the number two port for U.S. cotton exports, reaching 3.0 million bales in 2007 before falling to below 2.0 million bales in 2008 and Savannah narrowly surpassed two million bales in The exports of cotton through Houston reached a peak of 2.2 million bales in 2005, before declining to an average of 1.6 million bales for the past three years. Exports through Laredo remain fairly constant with a range of 900,000 bales to 1.1 million bales annually for the 2003 to 2010 period. While not currently at its peak, it does illustrate an extremely stable relationship between the United States and Mexico in the cotton market. U.S. cotton exports have varied by port. For example during 2010, 65 percent of the 1.7 million bales exported from Houston were destined for Turkey (figure 4). This compares to 53 percent for 2003 (figure 5). Turkey has more than doubled as a market for cotton exports from New Orleans as 65 percent of port cotton exports, or 244,000 bales, during During 2003, only 28 percent of cotton exported through New Orleans went to Turkey. 3
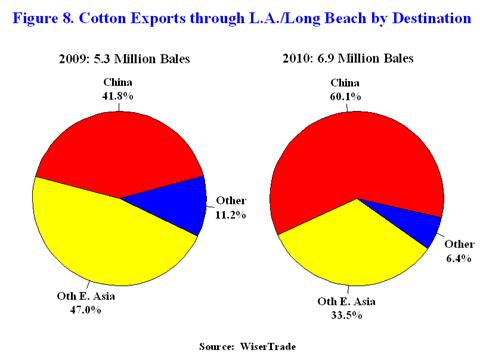
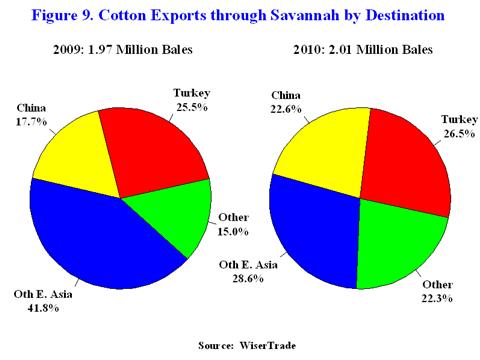
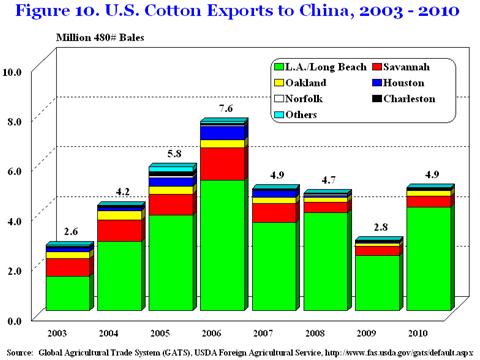
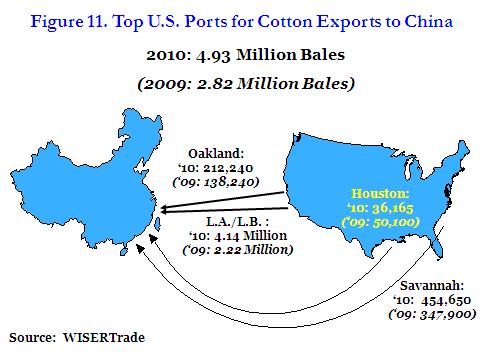
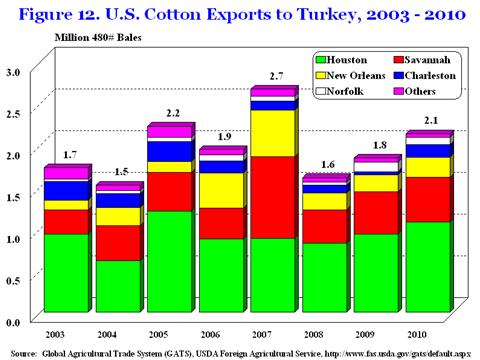
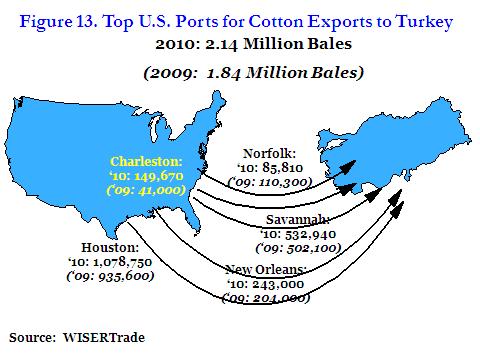
5 On the West Coast, China and other East Asian 2 markets have always been the main markets from LA/LB cotton exports. Still, there has been some shifting as China increased from 31 percent of the cotton exports from LA/LB in 2003 to 53 percent in 2008 before falling to 42 percent in During 2010, China accounted for 60 percent of LA/LB cotton exports. Savannah has also experienced changes in destinations for cotton exports. In 2003, 38 percent of cotton exports via Savannah went to China, 33 percent to other East Asia, and 15 percent to Turkey. By 2010, only 23 percent was shipped to China and other East Asia was 29 percent while Turkey grew to 27 percent. A more pronounced view appears when examining concentration by market regions. The top three market regions for cotton exports through Houston were Turkey, South America, and Pakistan/India and accounted for about 90 percent of cotton exports through Houston during , up from an average of 77 percent in (figure 6). For New Orleans, this concentration increased from an average of 52 percent in to 87 percent , while LA/LB increased from 86 percent to 91 percent for the same time period for its two largest cotton export market regions (figures 7 and 8). Only Savannah has maintained a relatively stable concentration for top market regions at 81 percent for the time period (figure 9). Export Markets by U.S. Port China has been the leading market for U.S. cotton since 2003 and imported 4.9 million bales during 2010, down significantly from 7.6 million bales in 2006 but up from 2.8 million bales in 2009 (figure 10). LA/LB has been and remains the leading route for these exports, accounting for 4.1 million bales in 2010, down from 5.2 million bales in 2006 but nearly double that of 2009 (figure 11). Due to proximity to the Southeastern U.S. cotton producing region, Savannah has enjoyed prominence as a point of departure for cotton bound for China. In 2006, exports reached 1.3 million bales. More recently, these exports fell to 347,900 bales in 2009 before increasing to 454,650 bales in Oakland is the other major port accounting for cotton exports to China with 138,240 bales in 2009 and 212,240 bales in Oakland surpassed Houston as the third most important port for exports to China during Turkey is currently the second leading export market for U.S. cotton, importing 2.1 million bales during 2010, down from a peak of 2.7 million bales in 2007 but up from 1.6 million bales in 2008 and 1.8 million bales in 2009 (figure 12). While this represents a decrease of 22 percent from 2007, it is far less than the 35 percent decline in U.S. cotton exports to China from its 2006 record high. Further, both destinations have rebounded from recent lows in 2008 and Houston has been and remains the leading port for exporting cotton to Turkey, accounting for 938,000 bales in 2009 and 1.1 million bales in 2010 (figure 13). Savannah is the second leading port for cotton exports to Turkey with over 500,000 bales in both 2009 and 2010 with New Orleans next at more than 200,000 bales. During the peak year of 2007, Savannah actually shipped the most cotton to Turkey, however, that was the only time that Houston was not in the leading position. 2 East Asia includes Bangladesh, Hong Kong, Indonesia, Malaysia, Philippines, Singapore, South Korea, Taiwan, and Vietnam. 4
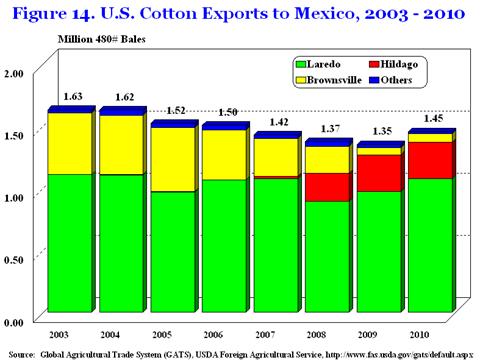
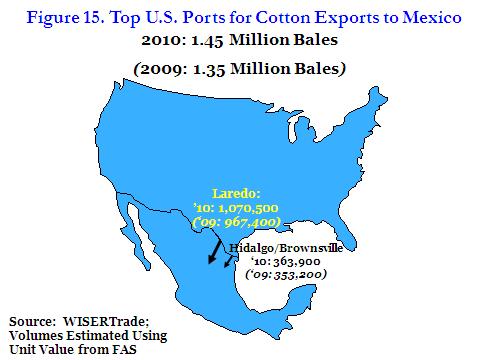
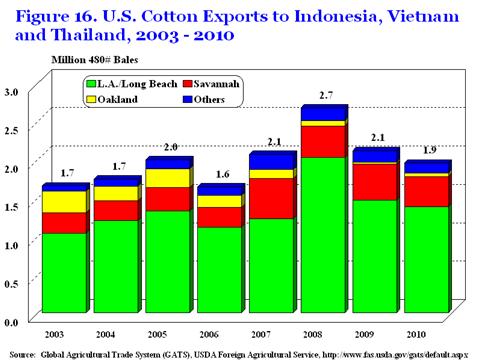
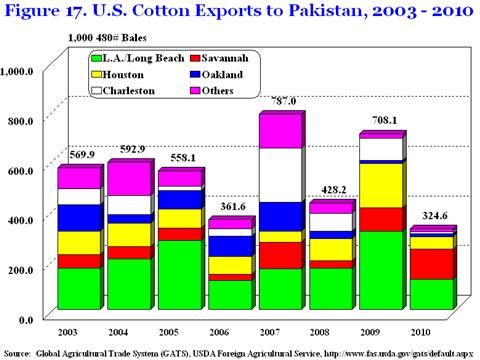
6 The Case of Mexico The large majority of cotton exports to Mexico cross at land ports of entry. With so much cotton production in Texas and a fully-implemented North America Free Trade Agreement (NAFTA), Texas represents an important source of cotton for Mexico. These shipments have experienced a gradual decline each year since from 2003 through 2009, decreasing from 1.63 million bales to 1.35 million bales (figure 14). In 2010, cotton exports to Mexico were up slightly compared to 1.45 million bales. Laredo is the leading port for U.S. cotton exports to Mexico and accounted for nearly three-quarters of exports in both 2009 and 2010 (figure 15). The only significant change came in the Lower Rio Grande Valley where Hidalgo, which shipped minimal volumes of cotton to Mexico as recently as 2007, accounted for 296,000 bales (22 percent) exported in 2009 and Brownsville had previously been second, but newer infrastructure and less congestion led shippers to use Hidalgo more for cotton exports. Most Mexican cotton is produced in the western states of Chihuahua, 870,000 bales in 2008, and Baja California (379,000 bales), with some production in Coahuila (257,000 bales). These three states account for 90 percent of Mexican cotton production. Whether cotton is produced in Mexico or imported from the United States, the destination in Mexico are the mills in the states of Mexico, Hidalgo, and Morelos, all near Mexico City. Mexico produces only about half of its mill use, so cotton imports, 98 percent of which come from the United States, are important. During conversations with personnel based at six Mexican cotton mills, it was found that all U.S. cotton is shipped via truck and that border crossings are seen as a bottleneck. This may be the best mode of transportation as trains are too slow for the delivery requirements of most mills. The reasons for the bottleneck at the border are familiar and include the need for three transportation companies including drayage firms, two customs agents, and two agricultural departments for inspection of cotton cargo. The need to use all these entities requires time and imports incur additional costs. Several possible solutions were mentioned. First, allow the same transportation company to handle the entire transaction, reduce the need for a second customs agent, and harmonize phytosanitary requirements. This suggestion sounds simple, but there are public and private sector interests which would be resistant to these changes. Second, load containers on flat rail cars and then transfer to truck once past the border. Finally, skip the land borders and ship to Veracruz. Other Major Markets Southeast Asian countries of Indonesia, Vietnam, and Thailand have emerged as important markets for U.S. cotton. Taken together, these three countries imported over two million bales of U.S. cotton annually from 2007 to 2009, reaching a peak of 2.7 million bales in 2008 (figure 16). Exports to these countries dropped to 1.9 million bales in LA/LB is the largest port involved in shipping cotton to the Southeast Asian region, accounting for about 70 percent in 2009 and 2010 while Savannah is second. U.S. cotton exports to Pakistan are also important, but somewhat erratic. For instance, Pakistan imported 787,000 bales of U.S. cotton during 2007, but exports dropped to 46 percent 5
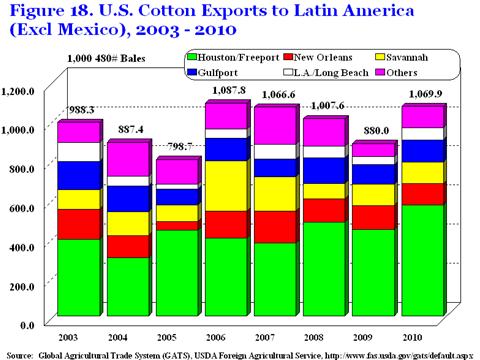
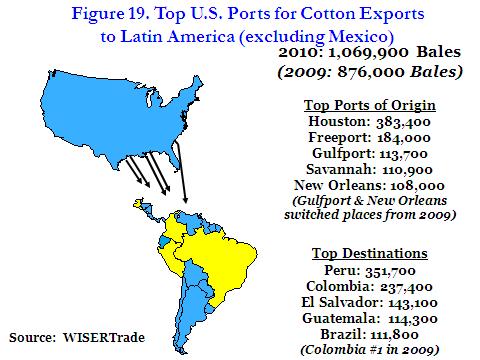
7 in 2008, increased 65 percent in 2009, and then dropped again to 54 percent in 2010 (figure 17). As a result of the 2010 decline, Pakistan fell below Taiwan for the first time since 2006, below South Korea for the first time since 2005, and below Bangladesh and Peru for the first time since 2001 and 2000, respectively. The main port involved in exporting to Pakistan is LA/LB. Houston, Savannah, Charleston, and Oakland have each occupied the second spot during at least one year between 2003 and Of particular interest to ports in Texas and Louisiana are the Latin American markets other than Mexico, which combines all countries in Central America, South America, and the Caribbean. As a group, these countries accounted for over one million bales of U.S. cotton exports from before dropping to 876,000 bales during 2009 (figure 18). Exports returned to 1.1 million bales in Houston and Freeport combined to account for more than one-half of exports to other Latin America with Gulfport next in importance during Savannah and New Orleans also ship significant volumes to other Latin America depending on the year. The top individual destinations for U.S. cotton in 2009 and 2010 were Peru, which averaged 288,000 bales, and Colombia, which averaged 241,000 bales (figure 19). El Salvador and Guatemala each imported over 100,000 bales of U.S. cotton in both 2009 and The Panama Canal Expansion One of the major factors affecting the efficiency, distribution and competitiveness of U.S. cotton will be expansion of the Panama Canal. With sea freight the fastest growing mode of transportation, the number and size of vessels that are able to pass through the Canal will increase after the expansion is completed in This expansion is necessary not only to accommodate growing commerce, but also because post-panamax vessels are forecast to account for nearly 25 percent of cargo vessel capacity by 2012 and already account for 35 percent of all vessels carrying cargo worldwide (ACP, December 2007). The new Panama Canal lock system will be equipped to handle vessels up to 12,600 twenty-foot equivalent units (TEU) for containers, compared to a present maximum vessel size of 4,400 TEU. The Canal expansion should relieve U.S. West Coast congestion on routes to Asia and increase potential to increase cotton shipments from the U.S. Gulf and South Atlantic ports to China and other Asian destinations. The Journal of Commerce estimates that Gulf port container volume could increase by 20 percent due to Panama Canal expansion. In addition, U.S. ports have experienced a 156% increase in post-panamax vessel calls over the past five years, increasing the demand for service of larger vessels (U.S. Department of Transportation). While yet to be verified empirically, it is expected that significant additional volume of U.S. cotton will be shipped via Gulf Coast and East Coast ports to China and the Far East after This in large part, however, will depend on the expansion of these ports to handle post- Panamax vessels. While East Coast ports such as Savannah, Charleston and Norfolk are in position to benefit initially from the expansion of post-panamax vessel trade, the amount of additional cargo that may be handled is uncertain until improvements are made in capacity and water depth (U.S. Army Corps of Engineers). Ports along the southern Gulf are positioned to gain longer-term as port facilities are expanded. LA/LB and Oakland can be expected to 6
8 continue as a major port in the post-panamax era well into the future, but at some point may reach capacity limitations and be forced to expand. Analysis of U.S. Cotton Export System This analysis uses the results for a cost minimizing mathematical programming model that was developed by agricultural economists at Texas A&M University to represent the U.S. cotton transportation and logistic system. The model s framework minimizes the total cost of shipping, handling, and storing cotton that originates at 673 gins and flows to 443 warehouses across the U.S. over four quarterly periods. The model allows routing cotton shipments from originating gins to warehouses, possibly through reconsolidation warehouses in Memphis or Atlanta, and then on to either sixteen U.S. ports, eleven domestic mill regions, or four major intermodal facilities (and thence by rail to major West Coast, Gulf and East Coast ports). Boxcar shipments are allowed between two Mid-south origins (Memphis and Monroe, LA) and Laredo, TX. Only the results for Arkansas, Louisiana and Texas are reported in this study. For the Delta region, the model also allows non-memphis warehouses to ship cotton to Memphis warehouses to reflect the possibility of Mid-South reconsolidation and Intercontinental Exchange (ICE) cotton certification. Another transshipment warehouse was located in Atlanta to reflect the emerging pattern of warehouse-to-warehouse shipments from as far west as Texas to be pre-staged in Atlanta. Cotton shipments in the model are driven by the pull effect of constraints that require historical amounts of cotton to be delivered to the final demand points (i.e., ports and mills). Secondary export data were compiled by WISERTrade to characterize cotton demand at U.S. ports for Census data were used to allocate 2008 U.S. mill use to the eleven sub-state regions (mostly in the southeastern U.S.). The model then ships and stores cotton every quarter to satisfy the imposed demands while minimizing specified costs. Road mileages for trucking between originating gins, warehouses, intermodal facilities, ports, and mill locations were calculated using standard mapping software. Railroad mileages between intermodal or boxcar origins and port destinations were obtained from relevant railroad industry websites. Trucking cost base rates and fuel surcharges were developed based on information collected from various industry sources. These data were used to estimate statistical relationships between trucking mileage and cost. The resulting regression parameters were used to derive point estimates of trucking costs for the specific distance matrix elements for all ginwarehouse, warehouse-intermodal, warehouse-port, and warehouse-mill combinations. Shipping costs from intermodal points to ports were calculated using rail mileage multiplied by the average representative railroad rates obtained from the Surface Transportation Board, railroad industry representatives, and cotton shippers. The Least Cost shipping model sources cotton from actual gin points, routing flows to nearby warehouses. The focus of this analysis is on the cotton flows within Arkansas, Louisiana, and Texas. Table 1 shows the number of warehouse and gin points modeled in the study area. From there cotton is either stored, shipped to intermediate (i.e., intermodal facilities) or domestic destinations (mills or U.S. ports of exit). Table 2 shows the decimal share of flow from origins in the study area to various destinations. Flows from Texas largely flow to the Port of Houston, 7
9 the Mexican border, or Southern California. Table 2 identifies these destinations, although the results are somewhat skewed by a large supply remaining in carryover storage for the year modeled. The flows from Arkansas also reflect considerable carryover storage given the proximity to Memphis warehousing. Louisiana and Arkansas origins both ship to domestic U.S. textile mills in the Southeast. Table 1. Cotton Origin Points for Arkansas, Louisiana and Texas Warehouses Cotton Gins Arkansas Louisiana Texas Regional Totals Table 2. Least Cost Model Predicted Destinations of Arkansas, Louisiana, and Texas Cotton Flows U.S. Mills TX/LA Gulf Coast West Coast Mexican Border Other Arkansas 11.7% 88.3% Louisiana 43.0% 57.0% Texas 13.6% 20.1% 2.5% 15.9% 48.0% Spatial Equilibrium Model for Export Flows The international cotton model employed in this analysis includes 416 excess supply regions and 25 excess demand regions. The excess cotton supply regions include 410 U.S. regions (warehouses) and 6 foreign regions (Australia, Brazil, India, Sub-Sahara Africa, Uzbekistan, and other exporting countries). Included among the excess cotton demand regions are 11 U.S. regions (domestic mills) and 14 foreign demand regions (Bangladesh, China, EU-27, Hong Kong, Indonesia, Japan, Mexico, Pakistan, South Korea, Taiwan, Thailand, Turkey, Vietnam, and other importing countries). In the U.S. portion of the model is an extensive transportation network that connects excess supply regions with excess demand regions and ports via truck (truck chassis and flatbed) and rail. Excess supply regions are linked to excess demand regions within the U.S. via truck. There are 15 U.S. ports which are linked to the excess supply regions either by truck direct shipments or truck to 5 intermodal (rail loading) sites. These 15 U.S. ports are then linked to the excess demand regions via vessels except Mexico which are land border port crossings ports thus shipments are terrestrial. A representative port in each of the foreign excess supply regions is also linked by maritime costs to each of the foreign excess demand regions. The data used for the spatial model are composed of estimation of domestic and foreign excess demand and supply equations; cotton handling and storage costs; and railroad, truck, ship costs. The excess demand and supply equations were estimated for each location by using 8
10 supply and demand elasticities and production/consumption quantities. In the U.S. part of the model, the excess supply regions are warehouses which are optimal solution to the least cost shipping model developed by Fraire et al. Cotton received at those warehouses are supplied and carried through the subsequent crop year with estimated storage charges. Furthermore, based on the transportation costs/rates (truck and rail) estimates from Fraire et al, each U.S. excess supply region is connected to U.S. excess demand regions (mills), U.S./Mexico border crossing sites and ports. The estimates of ocean freight rates from U.S. ports to different foreign excess demand regions were estimated based on the difference between the cotton export price (FOB) and the import price (CIF). Due to the lack of data by port, in the first instance, all U.S. ports were assumed to have a similar freight rate. Subsequently, the ocean freight rates were adjusted to the equivalent historic flow patterns for each port. Results Model validation was performed by comparing historic flows patterns with flows associated with the base model. Data from WISERTrade on U.S. export flows and compared to model-generated flows. Table 3 presents historic flows compared to the solution of the base model. The base model projected flows were within the ranges observed at all ports during the years of 2007 to Accordingly, the model was judged adequate for purposes of carrying out study objectives. Table 3. Comparison between Exports by Port Model Estimates and Observed Data (Exports in 1, lbs. Bales) Port Year Base Difference* Average Model Savannah 2, , , , , % Norfolk % New Orleans % Houston, TX 1, , , , , % Laredo-El Paso 1, , % L.A.-Long Beach 6, , , , , % Oakland % Charleston % Hidalgo-Brownsville % Gulfport % Mobile % Others Total US 15, , , , , % * Relative to the 3 year average. 9
11 Baseline Model Results The baseline model indicates that LA/LB is the dominant port of export with 6.38 million bales (table 3). The variance from historical cotton shipments is among the smallest, 1.4 percent. Savannah is the second most important port with 2.29 million and a variance of 2.8 percent. Houston and Laredo were third and fourth, respectively, with variance from 1.2 percent for Houston to 6.4 percent for Laredo. New Orleans was the fifth most important port, exporting a projected 538,000 bales with a variance of 0.1 percent. The remaining ports each shipped less than 400,000 bales and had variances ranging from 0.3 percent for Norfolk to 142 percent for Mobile. This latter port, however, has historically handled only minor shipments, so this large variance is not considered a major enough issue to warrant further analysis. Results for Panama Canal Expansion The first scenario to be analyzed was a reduction of 10 percent in ocean freight rates as a result of Panama Canal expansion (PCE) for vessels originating from the U.S. Gulf and South Atlantic ports to Asian and Pacific countries. The second scenario analyzed a 28 percent reduction in ocean freight rates for the same origins and destinations. Effects on Flow Patterns and Exports Decreasing the ocean freight rate from U.S. Gulf and Atlantic ports (Savannah, Norfolk, New Orleans, Houston, Charleston, Gulfport, and Mobile) to Asian and Pacific importing countries (China, Indonesia, Thailand, Bangladesh, Pakistan, Honk Kong, Japan, South Korea, Taiwan) due to PCE is expected to increase cotton exports via the Panama Canal. U.S. Gulf and Atlantic ports are expected to increase their share of total U.S. cotton exports. Pacific Coast ports, however, are expected to experience a reduction in exports. A 10 percent reduction in ocean freight rates for the routes that travel via the Panama Canal is estimated to increase U.S. cotton exports via the Gulf and Atlantic ports except Gulfport, Mississippi, and Mobile, Alabama (table 4). The absolute change in exports was the largest for the port of Savannah, Georgia, followed by the port of Houston, Texas. The increase from 2,294 to 3,965 thousand bales (72.8 percent increase) in exports positioned the port of Savannah as the leading cotton exporting port passing the LA/LB ports (down to 3,837 from 6,375 thousand bales). The total absolute change for the U.S. Gulf and Atlantic ports was equivalent to a positive 2,617 thousand bales, which in relative value this is equal to a 51.1 percent increase. Furthermore, the share of U.S. cotton exports through the Panama Canal increased from 38 percent (5,119 thousand bales) to 58 percent (7,737 thousand bales) after the expansion. West Coast ports decreased shipments considerably by reducing total exports approximately 2,538 thousand bales. The route via the intermodal option (rail to West Coast ports) reduces its share of total U.S. cotton exports by 20 percentage points (from 51 percent to 31 percent). The largest decrease in exports occurs in the LA/LB ports, going from 6,375 to 3,837 thousand bales, in relative terms, this is equivalent to a decline of approximately 40 percent. 10
12 Table 4. Estimated Change in U.S. Cotton Flows Resulting from Reducing Ocean Freight Rates by 10 Percent due to the Panama Canal Expansion (1, lbs. bales) Port Base Model 10% Reduction Absolute Change Change (%) Savannah 2, , , Houston 1, , New Orleans Charleston Norfolk Gulfport Mobile Total U.S. Gulf and Atlantic 5, , , Los Angeles/Long Beach 6, , , Oakland Total West Coast 6, , , Laredo-El Paso 1, , Hidalgo-Brownsville Total U.S.-Mexico Border Ports 1, , Total U.S. Ports 13, , As expected, cotton flow patterns resulting from the analysis of scenario two (28 percent ocean freight rate reduction) are similar to scenario one in direction, but larger in magnitude. The ports of Savannah and Houston increased cotton exports to 4,566 and 2,621 thousand bales, respectively (table 5). An important point is that the port of Houston becomes the nation s second largest cotton exporter. The ports of New Orleans, Charleston, and Norfolk more than doubled their exports with increases up to 185 percent for Charleston. Total exports from the Gulf and Atlantic ports rose to 9,990 thousand bales from 5,120 thousand bales for the base model (an increase of percent). Such increases in exports via the Gulf and Atlantic ports indicate that the PCE could increase the canal s share in total U.S. cotton exports to 74 percent from 38 percent in the base model. West Coast ports undergo an extreme decline in exports, going from 6,762 thousand bales to 2,147 thousand bales. Another key observation is that the intermodal option reduces its share of total U.S. cotton exports. Only 15 percent of total U.S. cotton exports are shipped via the West Coast ports. The largest factor for such reduction is the decrease in exports via the LA/LB ports, down to 1,762 thousand bales which places LA/LB as the third most important port for the U.S. cotton exports. Although cotton flows are altered with lower ocean freights for the Atlantic and Gulf ports, total U.S. cotton exports are only modestly impacted. For the 10 percent freight rate reduction scenario, the increase in total U.S. cotton exports was equal to 76.9 thousand bales which is equivalent to a 0.6 percent increase (table 4). In the second scenario, a 28 percent reduction in ocean freight rates increases total U.S. cotton exports. Although still a modest 11
13 increase in relative terms (1.9 percent), total U.S. cotton exports rose to 13,493 thousand bales, up by thousand bales (table 5). Table 5. Estimated Change in U.S. Cotton Flows Resulting from Reducing Ocean Freight Rates by 28 Percent due to the Panama Canal Expansion (1, lbs. bales) Port Base Model 28% Reduction Absolute Change Change (%) Savannah 2, , , Houston 1, , , New Orleans , Charleston Norfolk Gulfport Mobile Total U.S. Gulf and Atlantic 5, , , L.A.-Long Beach 6, , , Oakland Total West Coast 6, , , Laredo-El Paso 1, , Hidalgo-Brownsville Total U.S.-Mexico Border Ports 1, , Total U.S. Ports 13, , U.S. Producer Prices and Revenues As the PCE occurs, there would be an anticipated reduction in ocean freight rates which corresponds to a decrease in transportation costs linking the U.S. producers (warehouse level) to importers in the Asian and Pacific importing countries. This increases price and production in U.S. regions that ship via the Panama Canal. For example, in scenario one, U.S. cottonproducing regions that ship via the Panama Canal experience an increase in price that ranges from $0.89/bale (Arizona) to $7.03/bale (South Carolina) (table 6). Most of the U.S. cotton production regions experienced an increase in price. However, in California and Oklahoma, prices decrease as the Panama Canal expansion occurs. Prices decreased modestly for those U.S. regions since exports are diverted to Asian and Pacific importing countries via the West Coast ports. As noted in Table 6, the state with the largest gain in revenue due to the PCE was Texas. The increase in producer revenues for that state was equal to $20.76 million. Taking into account the relatively small change in price that occurs in Texas ($2.63/bale) when compared to the other states, the main reason for such increase in producer revenue is the an expansion of cotton production 3. Georgia and Tennessee had significant gains in producer revenues as well with $15.27 million and $13.40 million, respectively. The gain for Georgia is relevant to discuss since the port of Savannah is located in that state and local cotton producers were the beneficiaries of 3 According to NASS (2010c), cotton production for the state of Texas was approximately 6.3 million bales for the 2008/09 market year, which represented 40 percent of U.S. production. 12
14 this expansion. Although the impacts were relatively small, as expected, the states that depend heavily on West Coast ports experienced a decline in producer revenues (Oklahoma and California). Table 6. Estimated Annual Increase in U.S. Cotton Producer Revenues and Warehouse Price Resulting from Reduction in Ocean Freight Rates due to Panama Canal Expansion 10% reduction 28% reduction Revenue Change Price Revenue Change Price State Million Dollars $/Bale Million Dollars $/Bale Texas $20.76 $2.63 $81.45 $10.43 Georgia $15.27 $6.92 $44.36 $19.95 Tennessee $13.40 $5.97 $42.22 $18.59 Arkansas $9.59 $5.67 $29.20 $17.13 Mississippi $7.07 $5.95 $21.36 $17.81 North Carolina $6.86 $6.25 $22.93 $20.68 Missouri $4.37 $5.45 $12.99 $16.08 South Carolina $3.57 $7.03 $11.07 $21.63 Louisiana $3.09 $6.28 $8.79 $17.74 Alabama $2.76 $5.10 $8.42 $15.45 Virginia $1.23 $5.77 $4.44 $20.72 Florida $0.54 $6.76 $1.57 $19.60 Arizona $0.40 $0.89 $1.12 $2.51 New Mexico $0.25 $4.78 $0.81 $15.31 Kansas $0.05 $5.44 $0.14 $16.02 Oklahoma $0.11 $0.41 $3.02 $10.70 California $0.84 $0.59 $2.73 $1.91 U.S. Total $88.25 $4.70 $ $15.20 In scenario two, the 28 percent reduction in ocean freight rates from Gulf and Atlantic ports to Asian and Pacific markets is estimated to increase annual producer revenues for all cotton producing states except California. The state with the largest gain is Texas, with an increase in producer revenue equal to $81.45 million. As discussed earlier, Texas is a special case since most of the gain in revenue is due to increased cotton production (up 68,000 bales) and not higher prices. Other states underwent a larger increase in price, but there was less impact on producer revenues. For example, with respect to prices, cotton producers in South Carolina and Virginia were the greatest beneficiaries of higher prices attributed to the Panama Canal expansion, with increases of $21.63/bale and $20.72/bale, respectively. However, because production in those two states is relatively small compared to the others, producer revenues were less when compared to Texas and Georgia. 13
15 Cotton producers in Oklahoma accrue gains in producer revenues rather than losses. This occurs because a portion of Oklahoma cotton shipments were routed via the port of Houston rather than the intermodal route. Revenue losses to producers in California were estimated at $1.91 million which is relatively small when compared to the gains by other states. In both scenarios, the producer revenue for U.S. cotton increased as the PCE takes place. A 10 percent reduction in ocean freight rates from Gulf and Atlantic ports to Asian and Pacific importing countries is projected to increase annual cotton producer revenues by approximately $88.25 million (table 6). In relative terms, the total increase in producer revenue for the U.S. is equal to 2.1 percent. For scenario two, the 28 percent rate reduction causes a greater positive impact on the producer revenue for the U.S. The revenue gains to cotton producers are larger when the savings in cost due to the Panama Canal expansion is fully considered. Hence, the total increase in U.S. cotton producer revenue is equal to $ million, which, in relative terms, is equivalent to an increase of 6.9 percent. U.S. Cotton Competitiveness in the World Market The impact of the PCE on the competitiveness of exporting countries is evaluated with the focus on exports, prices, and revenue. Table 7 presents the results of the scenarios that were analyzed. Both scenarios indicate that India, Brazil, Sub-Sahara Africa, Uzbekistan and the Rest of the World Exporters all experience lower exports, prices, and revenues attributed to PCE. Among these countries/regions, the Rest of the World Exporters were the most affected by the PCE. Individual and large cotton exporting competitors, such as Brazil and India, lose competitiveness in global cotton trade and losses occur within the national industries. For example, in scenario two, exports, price, and producer revenue in Brazil are estimated to decrease by thousand bales, $1.91/bale, and $9.91 million, respectively. However, in both scenarios, these losses in exports, prices, and revenues are very modest in relative terms. Brazilian exports, price, and revenue are reduced by 0.6, 0.7, and 1.4 percent, respectively. Meanwhile, with the exception to the Rest of the World Exporters, the losses to other exporting countries are lower than those of Brazil. Due to the Panama canal expansion and its potential reduction in ocean freight rates for the Gulf and Atlantic ports to Asian and Pacific markets, the U.S. gains competitiveness through increases in exports, prices, and producer revenue (table 7). For scenarios one and two, the increase in exports is equal to and thousand bales, respectively. Cotton price and producer revenues also increase in both scenarios. There are greater impacts from scenario two due to the larger reduction in ocean freight rates. With a 28 percent reduction in ocean freight rates, the cotton price and producer revenue increase to $15.20/bale and $ million, respectively. 14
16 Table 7. Estimated Effects of Panama Canal Expansion on Cotton Exports, Prices, and Revenue for Selected Countries Exports (1, lbs. bales) 10% reduction 28% reduction United States India Brazil Sub-Sahara Africa Uzbekistan Rest of the World Prices ($/bale) 10% reduction 28% reduction United States $4.70 $15.20 India -$0.60 -$1.91 Brazil -$0.60 -$1.91 Sub-Sahara Africa -$0.60 -$1.91 Uzbekistan -$0.60 -$1.91 Rest of the World -$0.60 -$1.91 Revenues (million $) 10% reduction 28% reduction United States $88.25 $ India -$3.12 -$9.91 Brazil -$3.09 -$9.83 Sub-Sahara Africa -$2.61 -$8.31 Uzbekistan -$1.94 -$6.19 Rest of the World -$4.91 -$15.62 U.S. Industry Suggestions for Mitigating Bottlenecks In an attempt to identify additional methods to relieve future bottlenecks to U.S. cotton exports, industry input was gathered. Discussions with major cotton merchandisers and warehouse managers in the Mid-south and Southern Plains provides somewhat conflicting reports related to improving cotton flow through warehouses. The latter has been routinely identified as a bottleneck in accessing timely supplies of cotton to fill cotton shipping orders. Cotton shipping orders typically involve the selection of individual bales required by the buyer or another shipper. U.S. cotton bales are identified and sold on an individual basis because the quality traits of any particular bale may differ from other bales. Therefore, filling shipping orders can be relatively slow when compared to treating cotton as a homogeneous commodity. There are various ideas on how to improve this process, but merchandisers and warehouses are reluctant to sacrifice the ability of the U.S. marketing system to sell/deliver bales by individual quality characteristics. Selling bales on an individual basis is seen as a comparative advantage of the Unite States over its foreign competitors. At this point and for the foreseeable future, that advantage is seen to trump the disadvantage of slow bale identification and movement to fill shipping orders. 15
17 Another suggestion centered on the desire by some in the cotton shipping industry to increase the number of bales per load. Currently, truckloads of cotton are constrained to 88 bales within a container, or 90 bales on a flatbed truck. Most truckloads from warehouses to ports involve 88-bale loads that are transferred to containers at the port. One suggestion from industry was to use 96-bale high cube containers, allowing 96-bale truckloads to transport cotton to port, thus reducing the number of truckloads for a given supply. This alternative scenario assumes that cotton truck shipments could obtain a waiver from state regulatory agencies related to weight limits. The precedent for this is may be supported waivers received by grain trucks during the grain harvest. In the Waiver Scenario, one third of the flat bed vans would be allowed to ship 96 bales per load. These changes would be implemented as follows: 1) only shipments form warehouses to ports are affected; 2) shipments from warehouses to ports are made via three modes boxcars, flatbed vans, and truck chassis; 3) only one-third of the flatbed vans are allowed to use the waiver while no boxcars or truck chassis shipments may use this waiver; and 4) the cost of flatbed van shipments is estimated based on adjusting for 96 bales for flatbed vans instead of 88. The Waiver Scenario was solved and compared to the Baseline Scenario. By allowing for larger truckloads, holding the aggregate supply constant, the overall number of truckloads was reduced. This resulted 9, bale truckloads, replaced by 8, bale loads. The aggregate national shipping/handling/storage cost declined by 0.08% from $749.2 million to $748.6 million for a total reduction of $600,000. The truck portion of this cost reduction is $354,789, or 0.8% of the truck costs, while the other $250,000 in cost reduction is results from other costs savings related to fewer truckloads. These are minimal cost savings which may be partially eroded since the analysis does not take into account the availability of larger containers. Summary and Implications The transportation system in the United States is under constant use and strain. This system of roads, rail, ports and waterways is also of crucial importance to the efficiency and competitiveness of the U.S. cotton industry. As global cotton mill use expands, greater demands than ever before will be placed on this system. Constraints and improvements in U.S. transportation will ultimately influence cotton exports, shipping patterns and world trade. The purpose of this study was to assess U.S. transportation infrastructure and the potential impacts of improvements on the U.S. cotton industry. The United States is forecast to export million bales of cotton in 2011, representing about 87 percent of the cotton crop. China was the largest market for U.S. cotton in 2010, accounting for 35 percent of all U.S. cotton exports. Turkey, Mexico, Indonesia and Vietnam accounted for 34 percent of U.S. cotton exports. Los Angeles/Long Beach, Savannah, Houston and Laredo are the major ports through which the majority of U.S. cotton was exported. Results of our spatial equilibrium analysis indicates that under most normal cotton shipping scenarios, the port of LA/LB retains its dominance, especially for exports to Asia. Savannah, Houston and Laredo also continue as major export ports. Laredo retains its importance as the primary port for cotton exported to Mexico. New Orleans, Charleston and 16
18 Norfolk remain key suppliers of cotton to Europe and the Middle East. Oakland continues as an important port for Asian markets, while Hidalgo, Texas remains important for exports to Mexico. The completion of the Panama Canal expansion (PCE) in 2014 has major implications for altered shipping patterns throughout the United States. These results assume a 28 percent reduction in ocean transportation rates for cotton shipments to Asian markets attributed to the PCE. The United States generally gains from the PCE in several ways. First, total cotton exports are estimated to increase by 247,000 bales, or about two percent. Important regional shifts in trade do occur, however. Exports from India are estimated to decline, as do exports from Brazil and Uzbekistan. Along with these export declines are estimated drops in price and producer revenues for these countries, ranging from $6.0 million in Uzbekistan to $10 million in Brazil and India. U.S. prices are estimated to increase by $0.03/pound, while revenues rise by $291 million. Due to lower ocean transportation costs from Gulf and South Atlantic ports, these ports are estimated to double their share of U.S. cotton exports. Houston is estimated to become the nation s second largest cotton exporting port after Savannah, expanding cotton volume by twothirds to 2.6 million bales. Exports from the port of Savannah are estimated to double to 4.6 million bales. New Orleans, Charleston and Norfolk are all estimated to increase their volumes of cotton exports from 1.0 million bales to 3.6 million bales. Exports from Texas land-based ports of Laredo and Hidalgo are mixed, with overall export volume down nine percent to 1.4 million bales. Laredo is estimated to gain about 11 percent in export volume to 1.2 million bales, while exports from Hidalgo would decline 40 percent to 185,000 bales. Gains for the Gulf, South Atlantic and Texas ports come at the expense of the West Coast ports. Cotton exports from LA/LB are estimated to decline 72 percent to 1.8 million bales, while export volumes from Oakland are down marginally to 385,000 bales. References Costa, R.F. and C.P. Rosson, III. The Impacts of Improving Transportation Infrastructure in Brazil on the World Soybean Market. 49 th Annual Transportation Research Forum, Fort Worth, TX, March Costa, R., C.P. Rosson, J.R.C. Robinson, S.W. Fuller. The Impacts of the Panama Canal Expansion on World Cotton Trade, work in progress, Enke, S. Equilibrium Among Spatially Separated Markets: Solution by Electric Analogue. Econometrica 19: Fraire, F., P. Lai, J. Robinson, S. Fuller and J. Park. "Least-Cost Shipping and Storage of West Texas Cotton." Transportation Research Forum Annual Meeting, Ft. Worth, Texas
19 Fuller, S.W., L. Fellin, and K. Eriksen. Panama Canal: How Critical to U.S. Grain Exports. Agribusiness: An International Journal 16(4): Fuller, S.W., T.H. Yu, L. Fellin, A. Lalor, and R. Krajewski. Effects of Improving Transportation Infrastructure on Competitiveness in World Grain Markets. Journal of International Food & Agribusiness Marketing 13(4): Horton, T. Mallory Alexander International: More Than A Warehouse. Cotton Farming. Available online at: Accessed on May 27, Institute for Water Resources, US Army Corps of Engineers. The Implications of for Panama Canal Expansion to U.S. Ports and Coastal Navigation Economic Analysis, IWR White Paper, December Panama Canal Authority (ACP). The Panama Canal Expansion and Its Impacts on World Trade, Power Point Presentation by Manianela Dengo, October 4, Research and Innovation Technology Administration, Bureau of Transportation Services, US Department of Transportation, American s Container Ports: Freight Hubs That Connect Our Nation to Global Markets, Washington, DC: June Robinson, J.R.C., J.L. Park, and S. Fuller. Cotton Transportation and Logistics: A Dynamic System. Transportation Research Forum Annual Meeting, Ft. Worth, Texas Salin, Delmy. Impact of the Panama Canal Expansion of the U.S. Intermodal System, Agricultural Marketing Service, USDA, Washington, DC: January Samuelson, P.A. Spatial Price Equilibrium and Linear Programming. American Economic Review 42(1): Takayama, T. and G.G. Judge. Spatial and Temporal Price and Allocation Models. Amsterdam, North Holland Publishing Co University of Virginia, Miller Center for Public Affairs. Well Within Reach: American New Transportation Agenda, David R. Goode National Policy Conference, Introduction, Charlottesville, VA, October USDA, Foreign Agriculture Service (FAS/USDA). Global Agricultural Trade System (GATS). Washington D.C. Available at last accessed December USDA, Foreign Agriculture Service (FAS/USDA). Production, Supply, and Demand (PS&D) online database. Washington D.C. Available at last accessed December USDA, National Agricultural Statistics Service (NASS/USDA. Washington D.C. Available at last accessed May USDA. Cotton Backgrounder, Outlook Report CWS-07B-01, ERS, USDA, March WISERTrade: Port HS Database. Available at last accessed December

20 Figures Figure 1. U.S. Cotton Exports, Figure 2. Volume of U.S. Cotton Exports by Market 21 Figure 3. U.S. Cotton Exports by Port 21 Figure 4. Top U.S. Ports for Cotton Exports, Figure 5. Top U.S. Ports for Cotton Exports, Figure 6. Cotton Exports through Houston by Destination 23 Figure 7. Cotton Exports through New Orleans by Destination 23 Figure 8. Cotton Exports through L.A./Long Beach by Destination 24 Figure 9. Cotton Exports through Savannah by Destination 24 Figure 10. U.S. Cotton Exports to China, Figure 11. Top U.S. Ports for Cotton Exports to China 25 Figure 12. U.S. Cotton Exports to Turkey, Figure 13. Top U.S. Ports for Cotton Exports to Turkey 26 Figure 14. U.S. Cotton Exports to Mexico, Figure 15. Top U.S. Ports for Cotton Exports to Mexico 27 Figure 16. U.S. Cotton Exports to Indonesia, Vietnam and Thailand, Figure 17. U.S. Cotton Exports to Pakistan, Figure 18. U.S. Cotton Exports to Latin America (Excl Mexico), Figure 19. Top U.S. Ports for Cotton Exports to Latin America (Excl Mexico) 29 19
21 20
22 21
23 22
24 23
25 24
26 25
27 26
28 27
29 28
Agricultural Trade Flows through Texas Ports: Recent Trends and Outlook
 Agricultural Trade Flows through Texas Ports: Recent Trends and Outlook Texas Roundup APHIS CBP TDA August 18, 2016 College Station, TX Flynn Adcock, International Program Coordinator Luis A. Ribera, Associate
Texas Ports and Texas Exports
 Texas Ports and Texas Exports Testimony of Ginger Goodin, P.E. Senior Research Engineer and Director, Transportation Policy Research Center Texas A&M Transportation Institute to Senate Select Committee
Cotton and Wool Outlook
 Economic Research Service Situation and Outlook Report CWS-18g July 16, 2018 Next release is August 14, 2018 Cotton and Wool Outlook Leslie A. Meyer Record Global Cotton Mill Use in 2018/19; Growth Varies
Cotton and Wool Outlook
 Economic Research Service Situation and Outlook Report CWS-18f June 14, 2018 Next release is July 16, 2018 Cotton and Wool Outlook Leslie A. Meyer World Cotton Ending Stocks in 2018/19 Projected Lowest
August 16 th, DDGS/cash corn value stands at 106 percent of its two-year average. INSIDE THIS ISSUE. General Comments:
 INSIDE THIS ISSUE 1. General Comments 2. DDGS Reference Prices 3. Ocean Freight Markets 3. Latest Export Figures (Calendar and Crop Year) 6. FOB US Gulf DDGS & Corn Prices 7. Council News DDGS/cash corn
U.S. Rice Market Faces Larger Supplies and Lower Prices in 2018/19; Global Trade Projected Another Record High
 U.S. Rice Market Faces Larger Supplies and Lower Prices in 218/19; Global Trade Projected Another Record High 218 Rice Outlook Conference December 5-7, 218 Nathan Childs Economic Research Service USDA
Cotton and Wool Outlook
 Economic Research Service Situation and Outlook Report CWS-18h August 14, 2018 Next release is September 14, 2018 Cotton and Wool Outlook Leslie A. Meyer U.S. Cotton Product Trade Rising in 2018 The latest
Rice Outlook and Baseline Projections. University of Arkansas Webinar Series February 13, 2015 Nathan Childs, Economic Research Service, USDA
 Rice Outlook and Baseline Projections University of Arkansas Webinar Series February 13, 2015 Nathan Childs, Economic Research Service, USDA THE GLOBAL RICE MARKET PART 1 The 2014/15 Global Rice Market:
Cotton and Wool Outlook
 Economic Research Service Situation and Outlook Report CWS-18j October 15, 2018 Next release is December 13, 2018 Cotton and Wool Outlook Leslie A. Meyer China Leads 2018/19 World Cotton Stocks Decline
Developing New Exporters. AAPA Maritime Economic Development Workshop June 3 rd, 2014
 Developing New Exporters AAPA Maritime Economic Development Workshop June 3 rd, 2014 What is the Value of Exports through the Ports of LA, LB & LAX Airport? $ 127 Billion in 2013 ( + 4.63 % ) This is an
SOYBEANS: LARGE SUPPLIES CONFIRMED, BUT WHAT ABOUT 2005 PRODUCTION?
 SOYBEANS: LARGE SUPPLIES CONFIRMED, BUT WHAT ABOUT 2005 PRODUCTION? JANUARY 2005 Darrel Good 2005 NO. 2 Summary USDA s January reports confirmed a record large 2004 U.S. crop, prospects for large year-ending
Cotton and Wool Outlook
 Economic Research Service Situation and Outlook Report CWS-18c March 12, 2018 Next release is April 12, 2018 Cotton and Wool Outlook Leslie A. Meyer lmeyer@ers.usda.gov Record 2017 U.S. Net Textile and
AGRICULTURAL MARKETING SERVICE COTTON DIVISION, MARKET NEWS BRANCH 4841 SUMMER AVENUE, MEMPHIS, TENNESSEE Telephone
 L J4 UNITED STATES DEPARTMENT OF AGRICULTURE IUS30AI AGRICULTURAL MARKETING SERVICE COTTON DIVISION, MARKET NEWS BRANCH 4841 SUMMER AVENUE, MEMPHIS, TENNESSEE 38122 I i Telephone 901-521-2931 Weekly Cotton
Cotton and Wool Outlook
 Economic Research Service Situation and Outlook CWS-17g Release Date July 14, 2017 Cotton and Wool Outlook Leslie Meyer lmeyer@ers.usda.gov Global Growth of Cotton Mill Use Varies by Country Cotton and
Cotton and Wool Outlook
 Economic Research Service Situation and Outlook CWS-17j Release Date October 16, 2017 Cotton and Wool Outlook Leslie Meyer lmeyer@ers.usda.gov Cotton Stocks Outside of China Rising in 2017/18 Cotton and
THE DYNAMICS OF THE US CONTAINER MARKET AND IMPLICATIONS FOR THE US PORT INDUSTRY
 THE DYNAMICS OF THE US CONTAINER MARKET AND IMPLICATIONS FOR THE US PORT INDUSTRY A PRESENTATION TO: CHANGING TRADE PATTERNS JANUARY 24, 2013 MARTIN ASSOCIATES 941 Wheatland Avenue, Suite 203 Lancaster,
U.S. Rice Growers Face Higher Prices and Tighter Supplies in 2017/18
 U.S. Rice Growers Face Higher Prices and Tighter Supplies in 217/18 217 Rice Outlook Conference December 12, 217 Nathan Childs Economic Research Service USDA Approved by the World Agricultural Outlook
SOYBEANS: SMALLER STOCKS, MORE ACRES, AND EARLY WEATHER WORRIES
 SOYBEANS: SMALLER STOCKS, MORE ACRES, AND EARLY WEATHER WORRIES APRIL 2000 Darrel Good Summary March 1, 2000 stocks of soybeans were estimated at 1.397 billion bushels, 60 million less than on the same
AMERICAN ASSOCIATION OF PORT AUTHORITES JUNE 5, 2012 MARTIN ASSOCIATES PREPARED FOR:
 THE DYNAMICS OF THE US CONTAINER MARKET AND SHIFTING TRADE PATTERNS IMPLICATIONS FOR FUTURE INVESTMENT TO PROMOTE US EXPORT ACTIVITY AND ECONOMIC GROWTH PREPARED FOR: AMERICAN ASSOCIATION OF PORT AUTHORITES
CORN: DECLINING WORLD GRAIN STOCKS OFFERS POTENTIAL FOR HIGHER PRICES
 CORN: DECLINING WORLD GRAIN STOCKS OFFERS POTENTIAL FOR HIGHER PRICES OCTOBER 2000 Darrel Good Summary The 2000 U.S. corn crop is now estimated at 10.192 billion bushels, 755 million (8 percent) larger
U.S. Rice Market Faces Tighter Supplies and Higher Prices in 2017/18
 U.S. Rice Market Faces Tighter Supplies and Higher Prices in 217/18 University of Arkansas Webinar Series October 26, 217 Nathan Childs Economic Research Service USDA Approved by the World Agricultural
SOYBEANS: SURPLUS GROWS, ACREAGE TO DECLINE
 SOYBEANS: SURPLUS GROWS, ACREAGE TO DECLINE JANUARY 2007 Darrel Good 2007 NO. 2 Summary The 2006 U.S. soybean crop was a record 3.188 billion bushels, but was 16 million smaller than the November 2006
SOYBEANS: WORLD PRODUCTION CONTINUES TO EXPAND
 SOYBEANS: WORLD PRODUCTION CONTINUES TO EXPAND OCTOBER 2001 Darrel Good 2001-No. 7 Summary The USDA s October Crop Production report forecast the 2001 U.S. soybean crop at 2.907 billion bushels. That forecast
INTERNATIONAL CENTER FOR AGRICULTURAL COMPETITIVENESS Policy Modeling Group
 INTERNATIONAL CENTER FOR AGRICULTURAL COMPETITIVENESS Policy Modeling Group Darren Hudson, Director Jaime Malaga, Associate Director Bing Liu, Research Scientist GLOBAL COTTON OUTLOOK 216/17 226/27 International
U.S. Agricultural Trade: Trends, Composition, Direction, and Policy
 U.S. Agricultural Trade: Trends, Composition, Direction, and Policy Charles E. Hanrahan Senior Specialist in Agricultural Policy Carol Canada Information Research Specialist Beverly A. Banks Acquisitions
SOYBEANS: LARGE U.S. CROP, WHAT ABOUT SOUTH AMERICA? October 2005 Darrel Good 2005 No. 8
 SOYBEANS: LARGE U.S. CROP, WHAT ABOUT SOUTH AMERICA? October 2005 Darrel Good 2005 No. 8 Summary USDA reports provided two fundamental surprises for the market over the past three weeks. First, the September
Grain Price SOYBEANS: SMALLER U.S. CROP, WILL SOUTH AMERICA FILL THE GAP? OCTOBER 2002 Darrel Good 2002 NO. 8. Summary
 UNIVERSITY OF ILLINOIS EXTENSION Grain Price OUTLOOK A joint publication of the Department of Agricultural Economics, College of Agriculture, Purdue University, West Lafayette, Indiana, and the Department
CORN: FIVE CONSECUTIVE LARGE CROPS?
 CORN: FIVE CONSECUTIVE LARGE CROPS? JULY 2000 Darrel Good Summary The USDA s June Acreage Report revealed that U.S. producers had planted nearly 79.6 million acres of corn in 2000, up from 77.4 million
SOYBEANS: HIGHEST PRICES IN OVER SEVEN YEARS. January 2004 Darrel Good 2004 NO. 2
 SOYBEANS: HIGHEST PRICES IN OVER SEVEN YEARS January 2004 Darrel Good 2004 NO. 2 Summary At 2.418 billion bushels, the 2003 U.S. soybean crop was 34 million bushels smaller than the USDA s November forecast
U.S. Cotton Distribution Patterns,
 United States Agriculture Economic Research Service U.S. Cotton Distribution Patterns, Statistical Bulletin Number 769 1986/87 Edward H. Glade, Jr. Mae Dean Johnson SALES INFORMATION Additional copies
The World Cotton Situation * Terry Townsend, Executive Director Armelle Gruere, Statistician. Projections to 2020
 INTERNATIONAL COTTON ADVISORY COMMITTEE 1629 K Street NW, Suite 72, Washington, DC 26 USA Telephone (22) 463-666 Fax (22) 463-695 e-mail secretariat@icac.org The World Cotton Situation * Terry Townsend,
Intermodalism -- Metropolitan Chicago's Built-In Economic Advantage
 May 1, 2015 Intermodalism -- Metropolitan Chicago's Built-In Economic Advantage CMAP's regional economic indicators microsite features key measures of metropolitan Chicago's economy and, where applicable,
THE TRANSPORTATION OF IMPORTED CONTAINERIZED GOODS
 THE TRANSPORTATION OF IMPORTED CONTAINERIZED GOODS Introduction The supply chains for many consumer goods have become global and rely extensively on fast, reliable and flexible transportation as a key
SOYBEANS: DECLINING EXPORTS, LARGE STOCKS
 SOYBEANS: DECLINING EXPORTS, LARGE STOCKS JANUARY 2006 Darrel Good 2006 NO. 2 Summary At 3.086 billion bushels, the 2005 U.S. soybean crop was 43 million larger than the November forecast and only 38 million
U.S Department of Agriculture. Agricultural Outlook Forum February 22 & 23, 2001 NEW DEVELOPMENTS IN FOREIGN COTTON PRODUCTION AND CONSUMPTION
 U.S Department of Agriculture Agricultural Outlook Forum 2001 February 22 & 23, 2001 NEW DEVELOPMENTS IN FOREIGN COTTON PRODUCTION AND CONSUMPTION Terry Townsend Executive Director International Cotton
Transportation Research Forum
 Transportation Research Forum Feasibility of an Intermodal Terminal in Rural Texas to Enhance Marketing and Transportation Efficiency Author(s): Stephen Fuller, John Robinson, Francisco Fraire, and Sharada
Cotton and Wool Outlook
 Economic Research Service Situation and Outlook CWS-15f Release Date June 12, 2015 Cotton and Wool Outlook Leslie Meyer lmeyer@ers.usda.gov Stephen MacDonald stephenm@ers.usda.gov Global Cotton Ending
Issues Affecting Exports of DDGS in
 Researching and promoting the value of distillers grains for the fuel and beverage alcohol industries since 1945 Issues Affecting Exports of DDGS in 2014-2015 Alvaro A. Cordero Manager of Global Trade
CORN: MARKET TO REFLECT U.S. AND CHINESE CROP PROSPECTS
 CORN: MARKET TO REFLECT U.S. AND CHINESE CROP PROSPECTS JULY 2001 Darrel Good 2001 - No. 6 Summary The USDA s June Acreage and Grain Stocks reports provided some modest fundamental support for the corn
ACP2005:World Trade Outlook 6 Countries
 _ ACP2005:World Trade Outlook 6 Countries GLOBAL MACROECONOMIC SCENARIOS AND WORLD TRADE STATISTICS AND FORECAST FOR THE PANAMA CANAL AUTHORITY Contract SAA-146531 World Sea Trade Outlook World Sea Trade
May 10, USDA World Supply and Demand Estimates
 May 10, 2018 - USDA World Supply and Demand Estimates Corn Market Reaction: July 2018 corn futures closed down ¾ cent at $4.02 with a trading range for the day of $4.00 to $4.07. December 2018 corn futures
Economic Impacts of Increased U.S. Imports of Fresh Produce from Mexico by 2020 CNAS Issue Brief September 2013
 Economic Impacts of Increased U.S. Imports of Fresh Produce from Mexico by 2020 CNAS Issue Brief 2013-04 September 2013 Produce imports from Mexico are a major source of economic activity in the Lower
SOYBEANS: FOCUS ON SOUTH AMERICAN AND U.S. SUPPLY AND CHINESE DEMAND
 SOYBEANS: FOCUS ON SOUTH AMERICAN AND U.S. SUPPLY AND CHINESE DEMAND APRIL 2002 Darrel Good 2002-NO.4 Summary Soybean prices during the first half of the 2001-02 marketing year were well below the prices
June 9, USDA World Supply and Demand Estimates
 June 9, 2017 - USDA World Supply and Demand Estimates Corn Market Reaction: July 2017 corn futures closed up 2 cents at $3.87 ¾ with a trading range for the day of $3.80 ¾ to $3.89 ½. December 2017 corn
Global market trends and grain flows
 Global market trends and grain flows GTA Advisory & Compliance Workshop Melbourne 28/7/14 A global perspective Prices driven offshore price discovery starts offshore Understanding broad trends critical
Effects of the Panama Canal Expansion on Texas Ports and Highway Corridors. executive summary
 executive summary prepared for Texas Department of Transportation Government and Business Enterprises Division prepared by October 2006 www.camsys.com Executive Summary Key Findings The proposed expansion
The Emergence of. Florida s Seaports and Inland Ports. Florida League of Cities - International Relations Committee November 17, 2011
 The Emergence of Florida s Seaports and Inland Ports Florida League of Cities - International Relations Committee November 17, 2011 History of the Global Supply Chain 2 Supply Chain, Circa 1950 Regional
THE EVOLVING PANAMA CANAL ROUTE FOR CHEMICALS
 1 THE EVOLVING PANAMA CANAL ROUTE FOR CHEMICALS Peter Tirschwell Senior Director for Editorial Content Maritime & Trade, IHS Markit 2 New era under way for the Panama Canal Ten-year, roughly $5.4 billion
The Supply Chain Partner You Can Depend On!
 The Supply Chain Partner You Can Depend On! GoDependable.com About Dependable Our Enterprise provides customized solutions for every aspect of your supply chain logistics needs. Dependable Supply Chain
The Impact of the Panama Canal Expansion
 The Impact of the Panama Canal Expansion Reinventing Supply Chains Atlanta, Georgia Don Anderson, VP Bill Loftis, Senior Principal - Tompkins International August 26-28, 2013 2013 Supply Chain Leadership
The ever changing supply chain strategy. Tom Scorsune January 20, 2012
 The ever changing supply chain strategy Tom Scorsune January 20, 2012 Domestic production Circa 1950 Domestic Production Regional Distribution Production Distribution 2 Domestic production Circa 1970 New
January 12, USDA World Supply and Demand Estimates
 January 12, 2017 - USDA World Supply and Demand Estimates Corn This month s U.S. corn outlook is for lower production, reduced feed and residual use, increased corn used to produce ethanol, and smaller
Port planning in Latin America and the evolution of container traffic with Asia-Pacific
 1 Edition No. 277, Issue 9/2009 Port planning in Latin America and the evolution of container traffic with Asia-Pacific This edition of the FAL Bulletin addresses port planning in Latin America and delivers
Goods Movement Challenges. Opportunities. Solutions. Hasan Ikhrata Director of Planning & Policy Southern California Association of Governments
 Goods Movement Challenges. Opportunities. Solutions Hasan Ikhrata Director of Planning & Policy Southern California Association of Governments The Regional Planning Agency for Southern California 15 th
CORN: PRODUCTION EXCEEDS EXPECTATIONS
 CORN: PRODUCTION EXCEEDS EXPECTATIONS OCTOBER 2001 Darrel Good 2001 NO. 7 Summary The USDA's October Crop Production report forecast the 2001 U.S. corn crop at 9.43 billion bushels. The crop is about 540
SOYBEANS: LARGE U.S. CROP, WHAT ABOUT SOUTH AMERICA?
 SOYBEANS: LARGE U.S. CROP, WHAT ABOUT SOUTH AMERICA? OCTOBER 2004 Darrel Good 2004 B NO. 8 Summary The USDA now forecasts the 2004 U.S. soybean crop at 3.107 billion bushels, 271 million larger than the
Economic Perspective PACIFIC RIM TRADE
 Economic Perspective PACIFIC RIM TRADE Presented by Lee Harrington Vice Chairman LAEDC and WTCA LA Long Beach China Conference April 25, 2006 TOP 5 SOUTHERN CALIFORNIA TRADE PARTNERS 1995 Japan $37.2 China
The University of Georgia
 The University of Georgia Center for Agribusiness and Economic Development College of Agricultural and Environmental Sciences Export Price Comparisons between Georgia and Latin American Countries Prepared
INTERNATIONAL CENTER FOR AGRICULTURAL COMPETITIVENESS Policy Modeling Group
 INTERNATIONAL CENTER FOR AGRICULTURAL COMPETITIVENESS Policy Modeling Group Darren Hudson, Director Jaime Malaga, Associate Director Bing Liu, Post-Doctorate Research Associate Samantha Yates, Publication
CORN: USDA REPORTS FAIL TO CONFIRM SMALLER SUPPLIES
 CORN: USDA REPORTS FAIL TO CONFIRM SMALLER SUPPLIES JANUARY 2001 Darrel Good No. 1 Summary Corn prices managed a significant rally from late September to late December 2000, partially on anticipation of
Cotton and Wool Outlook
 CWS-07i Oct. 15, 2007 Cotton and Wool Outlook Leslie Meyer, Stephen MacDonald, and Robert Skinner Foreign Cotton Mill Use Rises Faster Than Production Contents Domestic Outlook Intl. Outlook Contacts &
Table 1. U.S. Agricultural Exports as a Share of Production, 1992
 Export markets are important to U.S. agriculture, absorbing a substantial portion of total production of many important commodities. During the last two decades there have been periods of expansion and
THE NEW PANAMA CANAL IN A GLOBAL CONTEXT
 San Jose State University SJSU ScholarWorks Faculty Publications School of Management 6-11-2015 THE NEW PANAMA CANAL IN A GLOBAL CONTEXT Herman L. Boschken San Jose State University, herman.boschken@sjsu.edu
Planning for Container Growth Along the Houston Ship Channel and other Texas Seaports. TxDOT Project
 Planning for Container Growth Along the Houston Ship Channel and other Texas Seaports TxDOT Project 0-5068 Robert Harrison Center for Transportation Research February 3, 2007 Project Scope Analyze current
GROWING AGRICULTURAL EXPORTS: VIRGINIA S AGGRESSIVE TRADE AGENDA
 GROWING AGRICULTURAL EXPORTS: VIRGINIA S AGGRESSIVE TRADE AGENDA SOUTHERN LEGISLATIVE CONFERENCE CHARLES GREEN VIRGINIA DEPARTMENT OF AGRICULTURE & CONSUMER SERVICES JULY 30, 2012 Who, What, When, Where
Analyst: Meilin C. Pierce Spring Recommendation: Hold Target Stock Price (12/31/2016): $120
: $120") Recommendation: Hold Target Stock Price (12/31/2016): $120 1. Reasons for the Recommendation My recommendation is to hold Union Pacific Corporation (UNP) because my forecast shows that the stock is currently
Recommendation: Hold Target Stock Price (12/31/2016): $120 1. Reasons for the Recommendation My recommendation is to hold Union Pacific Corporation (UNP) because my forecast shows that the stock is currently
Final Report. Improving Intermodal Connectivity in Rural Areas to Enhance Transportation Efficiency: A Case Study
 Improving the Quality of Life by Enhancing Mobility University Transportation Center for Mobility DOT Grant No. DTRT06-G-0044 Improving Intermodal Connectivity in Rural Areas to Enhance Transportation
US and Canadian Port Competitiveness
 for Asia-Pacific Import Traffic, Davies Transportation Consulting Inc. 1 METRANS National Urban Freight Conference Long Beach, CA October 12, 2011 This paper extends research presented in a recent paper
Cotton and Wool Outlook
 Cotton and Wool Outlook CWS-12a Mar. 12, 2012 Leslie Meyer lmeyer@ers.usda.gov Stephen MacDonald stephenm@ers.usda.gov James Kiawu jkiawu@ers.usda.gov U.S. Net Textile and Apparel Imports Decline in 2011
International Trade of U.S. Hardwood Lumber and Logs,
 ~ Memphis, Tennessee ~ Telephone: 901-767-9126 ~ Fax: 901-767-7534 ~ Website: www.hmr.com VOLUME XCII, NUMBER 27 HMR July 4, 2014 International Trade of U.S. Hardwood Lumber and Logs, 1990-2013 By: William
State of Wisconsin/ CFIRE /Department of Transportation RESEARCH PROGRESS REPORT FOR THE QUARTER ENDING: December 31, 2009
 State of Wisconsin/ CFIRE /Department of Transportation RESEARCH PROGRESS REPORT FOR THE QUARTER ENDING: December 31, 2009 Program: SPR-0010(36) FFY99 Part: II Research and Development Project Title: Understanding
Cotton and Wool Outlook
 Cotton and Wool Outlook CWS-12g Sept. 13, 2012 Leslie Meyer lmeyer@ers.usda.gov Stephen MacDonald stephenm@ers.usda.gov James Kiawu jkiawu@ers.usda.gov World Cotton Consumption To Rebound Slightly in 2012/13
THE NEW PANAMA CANAL IN A GLOBAL CONTEXT
 San Jose State University From the SelectedWorks of Herman L. Boschken June 11, 2015 THE NEW PANAMA CANAL IN A GLOBAL CONTEXT Herman L. Boschken, San Jose State University Available at: https://works.bepress.com/herman_boschken/12/
United States Department of Agriculture Cotton Outlook Friday, February 24,
 United States Department of Agriculture Cotton Outlook Friday, February 24, 2017 www.usda.gov/oce/forum Agricultural Outlook Forum 2017 Presented Friday, February 24, 2017 THE WORLD AND UNITED STATES COTTON
Canpotex Growing Relationships
 August 2013 Canpotex Growing Relationships www.canpotex.com Company Mission A premier marketing and logistics company that exports Saskatchewan potash to markets outside Canada and the United States Canpotex
January 12, USDA World Supply and Demand Estimates
 January 12, 2018 - USDA World Supply and Demand Estimates Corn Market Reaction: March 2018 corn futures closed down 2 ½ cents at $3.46 ¼ with a trading range for the day of $3.45 ½ to $3.50. December 2018
Container Shipping. Outlook and Issues for US East Coast Shippers and Ports. Tina Liu Country Manager, China. October 15, 2015 TPM Shenzhen
 Container Shipping Outlook and Issues for US East Coast Shippers and Ports October 15, 2015 TPM Shenzhen Tina Liu Country Manager, China Agenda Container volume growth Mega-alliances Mega-ships Port diversification
Global and U.S. Rice Markets Face Tighter Supplies in 2015/16
 Global and U.S. Rice Markets Face Tighter Supplies in 2015/16 University of Arkansas Webinar Series November 19, 2015 Nathan Childs, Economic Research Service, USDA 11.20.15 PART 1 THE 2015/16 GLOBAL RICE
INTERNATIONAL GRAINS COUNCIL
 INTERNATIONAL GRAINS COUNCIL GRAIN MARKET REPORT www.igc.int GMR No. 420 2 April 2012 WORLD ESTIMATES million tons 08/09 09/10 10/11 11/12 12/13 est forecast proj 23.02 02.04 02.04 WHEAT Production 685
Railroads and Grain. Association of American Railroads June Summary
 s and Grain Association of American s June 2017 Summary s are critical to grain transportation. In 2016, U.S. Class I railroads originated 1.54 million carloads of grain (5.6 percent of total carloads)
2014 International Report
 Executive Summary 2013 total agricultural exports $4,116,162,451 up 1.9% from 2012 Compound annual growth 2009 to 2013 9.6% per year Florida ranked 8 th in agricultural exports among the states Top 10
Challenges with Evaluating Container Port Projects and the Corps of Engineers
 Challenges with Evaluating Container Port Projects and the Corps of Engineers Smart Rivers Conference 14 September 2011 Kevin Knight Economist Institute for Water Resources U.S. Corps of Engineers 1 Trends
CORN: BETTER DEMAND, PRODUCTION CONCERNS
 CORN: BETTER DEMAND, PRODUCTION CONCERNS April 2000 Darrel Good Summary The USDA s March Grain Stocks report, released on March 31, confirmed a high rate of domestic corn use during the second quarter
December 12, USDA World Supply and Demand Estimates
 December 12, 2017 - USDA World Supply and Demand Estimates Corn Market Reaction: March 2018 corn futures closed down 1 ¼ cents at $3.47 ¾ with a trading range for the day of $3.47 ½ to $3.53. December
UNDERSTANDING THE GLOBAL IMPACT OF INCREASED WATERWAY COMMERCE. Bruce Lambert Executive Director, Institute for Trade and Transportation Studies
 UNDERSTANDING THE GLOBAL IMPACT OF INCREASED WATERWAY COMMERCE Bruce Lambert Executive Director, Institute for Trade and Transportation Studies Does Waterway Commerce: Improve system efficiency Encourage
Ports and Waterways: Lifeline for U.S. Agriculture
 Ports and Waterways: Lifeline for U.S. Agriculture Ag Transportation Summit Steven L. Stockton, PE Director of Civil Works US Army Corps of Engineers 30 July 2013 US Army Corps of Engineers America s Future
CURRENT SITUATION AND MEDIUM-TERM OUTLOOK FOR TROPICAL FRUITS
 CURRENT SITUATION AND MEDIUM-TERM OUTLOOK FOR TROPICAL FRUITS Prepared by the Sugar and Beverages Group Raw Materials, Tropical and Horticultural Products Service Commodities and Trade Division Food and
Port Activity and Competitiveness Tracker
 Comprehensive Regional Goods Movement Plan and Implementation Strategy Port Activity and Competitiveness Tracker Presented to I-710 Corridor Advisory Committee Gill Hicks Cambridge Systematics, Inc. May
HOW IMPORTANT IS THE EXPANSION OF THE PANAMA CANAL TO THE PORT OF NEW ORLEANS
 HOW IMPORTANT IS THE EXPANSION OF THE PANAMA CANAL TO THE PORT OF NEW ORLEANS Bruce Lambert Executive Director, ITTS WARNING PANAMA CANAL EXPANSION Is it needed? Does Louisiana Benefit from the Canal now?
Domesti*c Shipments of U.S. Cotton, Season
 Bulletin 855 May 1977 Domesti*c Shipments of U.S. Cotton, 1975-76 Season By Joseph L. Ghetti, Agricultural Economi Commodity Economics Division, ERS, USDA, Stoneville, Mississippi. 011ie A. Cleveland,
Conceptual Framework for Analyzing the MTS within the Intermodal System
 Conceptual Framework for Analyzing the MTS within the Intermodal System Dr. Mike Hilliard Center for Transportation Analysis Oak Ridge National Laboratory Dr. Ned Mitchell U.S. Army Engineer Research and
Failure to Act. Of current Investment Trends in. Airports, Inland Waterways, and Marine Ports. Infrastructure EXECUTIVE SUMMARY
 Failure to Act The economic impact Of current Investment Trends in Airports, Inland Waterways, and Marine Ports Infrastructure EXECUTIVE SUMMARY EXECUTIVE SUMMARY Air and waterborne transportation infrastructure
Nathan Childs. Electronic Outlook Report from the Economic Research Service. Abstract
 United States Department of Agriculture Electronic Outlook Report from the Economic Research Service www.ers.usda.gov RCS-2005 November 2005 Rice Situation and Outlook Yearbook Nathan Childs Abstract Total
Attracting Distribution Center and Related Logistics Investment to Florida to Anchor Traffic through Florida Ports
 Attracting Distribution Center and Related Logistics Investment to Florida to Anchor Traffic through Florida Ports Florida Seaport Transportation and Economic Development Council Meeting February, 208
PANAMA CANAL BUSINESS FORUM
 PRESENTATION TO: PANAMA CANAL BUSINESS FORUM IMPACT OF THE PANAMA CANAL AND MARKET OPPORTUNITY FOR TEXAS Presentation By: Dr. Alexander Metcalf JANUARY 18, 2016 Transportation Economics & Management Systems,
Weekly Cotton Market Review
 Mp_cn812 Weekly Cotton Market Review Cotton and Tobacco Program Cotton Market News Division 3275 Appling Road Memphis, TN 38133 901.384.301 Vol. 99 No. 17 November 24, 2017 Inside this Issue Market Overview
THE WORLD COTTON MARKET SITUATION
 THE WORLD COTTON MARKET SITUATION Prepared by Carlos Valderrama and presented by M. Rafiq Chaudhry International Cotton Advisory Committee Washington, DC Southern/Eastern African Cotton Forum Pretoria,
SOYBEANS: AN EARLY WEATHER MARKET
 SOYBEANS: AN EARLY WEATHER MARKET January 2000 Darrel Good Summary 1999 U.S. Crop Estimate Revised Lower Soybean prices have made a modest rally from the mid-december lows, fueled by areas of dry weather
Appalachia s Coastal Port Partners, Gateways to Global Commerce
 Appalachia s Coastal Port Partners, Gateways to Global Commerce Jim Walker Director of Navigation Policy and Legislation American Association of Port Authorities November 13, 2013 American Association
Rice price relationships are becoming distorted again this year. The relatively thin rice market compared to other agricultural commodities and concen
 Rice Rice price relationships are becoming distorted again this year. The relatively thin rice market compared to other agricultural commodities and concentration of trade in Asia are factors that are