Using Archived Stop-Level Transit Geo-Location Data for Improved Operations and Performance Monitoring
|
|
|
- Frederick Sharp
- 6 years ago
- Views:
Transcription
1 Using Archived Stop-Level Transit Geo-Location Data for Improved Operations and Performance Monitoring Robert L. Bertini Portland State University September 26, 2003

2 Objectives Trends in transit technology AVL and APC BDS system and data archiving Preliminary route level analysis Other examples Conclusions and future research


3 Automatic vehicle location (AVL) Determination of vehicle location Global positioning systems (GPS) Signposts Ground-based radio Dead-reckoning U.S. transit agencies 128 operational 172 planned

4 Automatic passenger counters (APC) Count boarding and alighting passengers Infrared beams U.S. transit agencies 60 operational 124 planned
5 AVL/APC in the Bay Area AC Transit Central Contra Costa Livermore/Amador Napa County Transit Santa Clara VTA Santa Cruz Sonoma County Transit Western Contra Costa San Francisco MUNI SamTrans TOTAL AVL 800 in [131 by 2005] [600] 80 [86] 54 [62] 0 [37] [362] 1804 [2518] APC [100] [135] 0 [36] 196 [467] Source: APTS Deployment in the United States Year 2002 Update, USDOT, 2003.
6 Archiving AVL/APC Data AVL not designed with archived data in mind. Most AVL systems do not deliver data for offline planning analysis. Transit agencies didn t insist on it. APCs designed with archiving in mind. APCs often only in 10-15% of fleet. TriMet system driven by APC pays for itself in saved reporting costs Source: TCRP H-28, Uses of Archived AVL-APC Data to Improve Transit Performance and Management.
7 About TriMet Serves 1.2 M population 575 mi M annual bus trips 206,600 daily bus boardings 95 bus routes 655 buses 8100 bus stops Also LRT, Paratransit
8 Performance measurement Measuring system performance is the first step toward efficient and proactive management. Increasing attention to transit performance Transit Capacity and Quality of Service Manual Quantitative/qualitative Passenger point of view Linked to agency operating decisions NCHRP Performance Based Planning Manual Accessibility Mobility Economic Development Improve reliability Reduce variability of system performance Delay Travel time Attract more riders Reduce operations costs Increase productivity Link to service standards

9 In the past Data collection more difficult Low temporal and spatial resolution Many people to collect little data Focus on limited, general, aggregate measures for external reporting Natural air conditioning


10 Today Unlimited coverage and continuous duration Design, extract and test specific measures Actual system performance Data management/processing challenges Need for generating relevant measures
11 TriMet s Bus Dispatch System Navstar GPS Satellites Radio System Doors Lift APC (Automatic Passenger Counter) Overhead Signs Odometer Signal Priority Emitters GPS Antenna On- Board Computer Radio Radio Antenna Control Head Memory Card Garage PC s


12 TriMet s Bus Dispatch System PCMIA Card Control Head Schedule deviation
13 Real Time Elements Navstar GPS Satellites Radio System Doors Lift APC (Automatic Passenger Counter) Overhead Signs Odometer Signal Priority Emitters GPS Antenna On- Board Computer Radio Radio Antenna Control Head Memory Card Garage PC s


14 Real Time Elements Schedule Data On-board Computer GPS Location Radio/Cellular Communications 90 sec Updates Dispatch and Control Arrival Prediction
15 Archived Elements Navstar GPS Satellites Radio System Doors Lift APC (Automatic Passenger Counter) Overhead Signs Odometer Signal Priority Emitters GPS Antenna On- Board Computer Radio Radio Antenna Control Head Memory Card Garage PC s

16 Archived Elements Schedule Data On-board Computer GPS Location APC/ Lift PCMIA Card Event Data [Operator] Pass up Overload Traffic Delay Train/Bridge Delay Fare Evasion Graffiti/Vandalism Stop Data [Automatic]

17 Event Data: Fare Evasion

18 Archived Elements Schedule Data On-board Computer GPS Location APC/ Lift PCMIA Card Event Data [Operator] Stop Data [Automatic] Scheduled Unscheduled
19 Stop Data REWRITTEN ARRIVE TIME (IF DOOR OPENS) ARRIVE TIME 15 METERS 30 METERS TIME LINE LEAVE TIME DOOR OPEN DWELL TIME DOOR CLOSE STOP LOCATION

20 Stop Data Route No. Service Date Leave Time Stop Time Arrive Time Badge Direction Trip No. Location ID Dwell Door Lift Ons Offs Est. Load Max Speed Pattern Distance 14 01NOV2001 8:53:32 8:49:15 8:53: NOV2001 8:55:00 8:51:41 8:54: NOV2001 8:56:22 8:52:00 8:55: X Coor. Y Coor. Route Number Vehicle Number Service Date Actual Leave Time Scheduled Stop Time Actual Arrive Time Operator ID Direction Trip Number Bus Stop Location Dwell Time Door Opened Lift Usage Ons & Offs (APCs) Passenger Load Maximum Speed on Previous Link Distance Longitude Latitude

21 TriMet s Bus Dispatch System


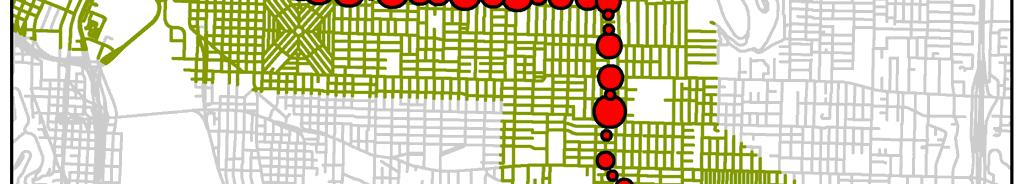
22 Stop Data: Passenger Movement

23 Route 14 Case Study
24 Route 14 Case Study 7.9 miles long 105 scheduled trips per weekday 64 scheduled stops min scheduled trip time (mean 43.3, SD 2.7 min) 3-55 min headways (mean 11.4 min) Focus on two weeks April 1-12, 2002 [>1000 runs] Morning inbound from SE 94th/Foster to NW 4th/Hoyt Crossing Hawthorne Bridge
25 April 1 A.M. Inbound Trips 7 6 Distance (miles) :00 6:00 7:00 8:00 9:00 10:00 11:00 12:00 13:0
26 April 1 A.M. Inbound Trips 7 6 Distance (miles) :00 6:00 7:00 8:00 9:00 10:00 11:00 12:00 13:0
27 April 1 A.M. Inbound Trips 7 6 Distance (miles) :00 6:00 7:00 8:00 9:00 10:00 11:00 12:00 13:0
28 April 1 A.M. Inbound Trips 7 6 Distance (miles) :00 6:00 7:00 8:00 9:00 10:00 11:00 12:00 13:0
29 April 1: Two Inbound Trips Distance (miles) Time 0.0 8:30 8:45 9:00 9:15 9:30
30 April 1: Two Inbound Trips 7.0 One late, one early arrival 6.0 Distance (miles) Trip 1290 Badge 996 (28 yrs exp) Median 1.2 min late Trip 1295 Badge 2606 (4 yrs exp) Median 0.9 min late Two late departures 0.0 Time 8:30 8:45 9:00 9:15 9:30
31 April 1: Impact of Pax Load Distance (miles) Trip 1290 Load Passenger Load Time 0.0 8:30 8:45 9:00 9:15 9:30 5 0
32 On-time Performance 5,000 4,500 4,000 3,500 All "stops" n = 66,012 Median = 0.6 min Late 100% 90% 80% 70% Frequency 3,000 2,500 2,000 60% 50% 40% 1,500 1, % Early 30% 20% 10% % Late/Early (minutes)
33 On-time Performance 5,000 4,500 4,000 3,500 3,000 2,500 2,000 1,500 1, Frequency TriMet Service Standard [-1 min +5 min] 85% On-time 11% Early 4% Late 100% 90% 80% 70% 60% 50% 40% 30% 20% 10% 0% Late/Early (minutes)
34 OTP vs. Time of Day 30 Early/Late (minutes) :00 7:00 9:00 11:00 13:00 15:00 Time 17:00 19:00 21:00 23:00
35 TriMet Operator Experience n = 3,249 Mean = 9.8 years 100% 90% 80% Frequency % 60% 50% 40% 30% % 10% %
36 TriMet Operator OTP April 1-12, 2002 Route 14 Inbound 94 Operators 65,848 stops Median Late/Early Operator -3
37 TriMet Operator OTP April 1-12, 2002 Route 14 Inbound 94 Operators 65,848 stops Median Early/Late Late Early -2-3 Years Experience

38 Stop Level Performance 0:30 0:25 April 1, 2002 Stop No Scheduled Headway 0:20 0:15 0:10 Hawthorne/ 22nd Ave Mean Headway 11:02 min St. Dev. 7:10 0:05 0:00 0:00 0:05 0:10 0:15 0:20 0:25 0:30 Actual Headway
39 Stop Level Performance 50 Cumulative Bus Arrival Number Scheduled Actual April 1, 2002 Stop No Hawthorne/SE 22nd Ave Mean Headway 11:02 min St. Dev. 7:10 5:00 6:00 7:00 8:00 9:00 10:00 11:00 12:00 Time
40 Route 14: Trip Time Model T = T T 0 N N N d a b 0 + an d + bn = average nonstop trip time = number of dwells = passengers alighting = passengers boarding a + cn b
41 Dwell Time 7, % 6,000 5,000 4,000 3,000 2,000 1, Frequency Nonzero Dwells n = 34,456 Mean = 13.3 s SD = 20.3 s Lift use = 232 times 90% 80% 70% 60% 50% 40% 30% 20% 10% 0% Dwell (sec)
42 Dwell Time vs. Passenger Movement On + Off 4% None 7% Dwell Time (sec) Off 28% On 61% Passenger Movement
43 Boardings Frequency 12,000 10,000 8,000 6,000 4,000 n = 37,441 Mean = 1.33 SD = 2.45 Max = % 90% 80% 70% 60% 50% 40% 30% 2, % 10% 0% Boardings
44 Alightings 16,000 14,000 12,000 n = 36,978 Mean = 1.31 SD = 2.62 Max = % 90% 80% 70% 10,000 8,000 6,000 4,000 2, Frequency 60% 50% 40% 30% 20% 10% 0% Alightings
45 Dwell Time Model Dwell Time = N n = 24,995 [non - zero, no lift, APC = "G", no layover] Boarding Only : Dwell = n = 15, N 4.27N Alighting Only : Dwell = N n = 7,021 b a b a
46 Nonstop Trip Time 2,000 1,800 1,600 n = 30,036 links NSTT= x (sec) 1,400 Travel Time (sec) 1,200 1, Link Distance (miles)
47 Trip Time Model T = N N N d a b 21.2N N = number of dwells = passengers alighting = passengers boarding d a N b
48 Run Times: April 1-12, 1 12, Run Time (min) n=856 trips Mean on=40/trip Mean off=40/trip Mean no. of dwells=35/trip 6:00 8:00 10:00 12:00 14:00 16:00 18:00 20:00 22:00 0:00 Arrive Time
49 Run Times: April 1-12, 1 12, n=856 trips Mean=41.5 min SD=5.1 min 100% 90% 80% 70% Frequency 60% 50% 40% 30% 20% 10% 0% Run Time (minutes)
50 Run Time vs. Operator Experience Mean Run Time n=856 trips 83 operators Run time/experience relationship (95% confidence) Hire Date
51 Actual vs. Predicted Run Time n=856 Actual Predicted Predicted Run Time Mean SD Veh-hrs 41.5 min 5.1 min min 7.4 min Actual Run Time
52 Stop Consolidation Analysis Route 14 length feet, 64 stops Mean stop spacing 670 feet Consolidate stops to 1000 foot spacing eliminate 10 stops Reduce trip time 21.2 sec per stop, save 3.5 min per inbound run 105 inbound trips per day 6.1 hours savings ($60/hr +/-) Add ~9 trips using existing resources Improve mean headway min Does it affect demand?

53 Boarding Area Improvement Analysis Streamlining program to reduce dwell time Curb extensions Nearside farside conversion Smart cards Mean boarding time estimated 2.87 sec Reduce boarding time by 1 sec at top ten locations Total of 1800 passengers boarded at these locations Save 30 min/day
54 Other Applications

55 Other Applications 1 census tract 0.25-mi buffers 38% of population

56 Transit Signal Priority

57 Transit Signal Priority Reduce run time and schedule variability 180 intersections complete, 100 more in 2003 Emitter turned on if bus is >90 sec late Remains on until <30 sec late Green extension/red truncation

58 Transit Signal Priority
59 Express Buses as Freeway Probes

60 Buses as Probes on Arterials
61 Buses as Probes on Arterials
62 Buses as Probes on Arterials
63 Buses as Probes on Arterials

64 Buses as Probes on Arterials
65 Buses as Probes on Arterials
66 Buses as Probes on Arterials tt veh = 1.23 tt pseudo V veh = 0.84 V pseudo
67 Buses as Probes on Arterials Buses as Probes on Arterials Eastman Pkwy. Birdsdale Ave. Towle Ave. Walters Rd. Main Ave. Hood Ave. Cleveland Ave. Hogan Ave. TriMet Route 9 Probe Vehicle Run Signalized Intersection Bus Stop Legend
68 Buses as Probes on Arterials EASTBOUND WESTBOUND -6% Savings 9% Savings 2% Savings 22% Savings 27% Savings 14% Savings EB Probe EB Bus EB Hypothetical WB Probe WB Bus WB Hypothetical Before (sec) After (sec)
69 Discussion Other uses for the BDS data? Conclusions? Save all of your data! Ask for archiving capabilities


70 Acknowledgements Steve Callas, TriMet Ahmed El-Geneidy, James Strathman, Thomas Kimpel, Kenneth Dueker, Center for Urban Studies Sutti Tantiyanugulchai, Civil & Environmental Engineering National Science Foundation Oregon Department of Transportation City of Portland Federal Transit Administration

71 More information Web: TriMet data readily available.
Generating Transit Performance Measures with Archived Data
 Transportation Research Record 1841 19 Paper No. 3-4393 Generating Transit Performance Measures with Archived Data Robert L. Bertini and Ahmed El-Geneidy Measuring the performance of a transit system is
Toward Validation of Freeway Loop Detector Speed Measurements Using Transit Probe Data
 Toward Validation of Freeway Loop Detector Speed Measurements Using Transit Probe Data Ahmed M. El-Geneidy and Robert L. Bertini Abstract Inductive loop detectors are used throughout the world to report
Data processing. In this project, researchers Henry Liu of the Department of Civil Engineering and
 Data mining of transit vehicle location, passenger count, and fare collection databases for intelligent transportation applications Supporting efficient transit service by maximizing the use of available
Beyond Generating Transit Performance Measures: Visualizations and Statistical Analysis Using Historical Data
 Beyond Generating Transit Performance Measures: Visualizations and Statistical Analysis Using Historical Data Mathew Berkow Nohad A. Toulan School of Urban Studies and Planning Portland State University
Tri-Met s Experience With Automatic Passenger Counter and Automatic Vehicle Location Systems
 Tri-Met s Experience With Automatic Passenger Counter and Automatic Vehicle Location Systems James G. Strathman September 2002 Center for Urban Studies School of Urban Studies and Planning Portland State
Rail APC Validation and Sampling for NTD and Internal Reporting at TriMet. James G. Strathman Thomas J. Kimpel
 Rail APC Validation and Sampling for NTD and Internal Reporting at TriMet James G. Strathman Thomas J. Kimpel Center for Urban Studies College of Urban and Public Affairs Portland State University P.O.
Understanding the Demand for Bus Transit Service: A New Approach
 Understanding the Demand for Bus Transit Service: A New Approach Ahmed M. El-Geneidy Portland State University, Center for Urban Studies Email: elgeneid@pdx.edu Thomas J. Kimpel Portland State University,
AUTOMATED DATA COLLECTION TECHNIQUES
 AUTOMATED DATA COLLECTION TECHNIQUES Outline 1. Farebox Data 2. Operations Data Needs and Availability 3. Automatic Passenger Counter Systems (APC) 4. Automated Vehicle Location Systems (AVL) 5. Trip Time
Data-Driven Support Tools for Transit Data Analysis, Scheduling and Planning
 Data-Driven Support Tools for Transit Data Analysis, Scheduling and Planning Final Report Prepared by: Chen-Fu Liao Department of Civil Engineering Minnesota Traffic Observatory University of Minnesota
Service Reliability Impacts of Computer-Aided Dispatching and Automatic Vehicle Location Technology: A Tri-Met Case Study
 Portland State University PDXScholar Center for Urban Studies Publications and Reports Center for Urban Studies 12-1999 Service Reliability Impacts of Computer-Aided Dispatching and Automatic Vehicle Location
Improving Scheduling Through Performance Monitoring Using AVL/APC Data. Thomas J. Kimpel James G. Strathman
 Improving Scheduling Through Performance Monitoring Using AVL/APC Data Thomas J. Kimpel James G. Strathman Center for Urban Studies College of Urban and Public Affairs Portland State University Portland,
Evaluation of Transit Operations: Data Applications of Tri-Met s Automated Bus Dispatching System
 Portland State University PDXScholar Center for Urban Studies Publications and Reports Center for Urban Studies 4-2001 Evaluation of Transit Operations: Data Applications of Tri-Met s Automated Bus Dispatching
Analysis of Transit Signal Priority Using Archived TriMet Bus Dispatch System Data. Final Report
 Analysis of Transit Signal Priority Using Archived TriMet Bus Dispatch System Data Final Report Thomas J. Kimpel Center for Urban Studies, Portland State University P.O. Box 751, Portland, OR 97207-0751
Highway Performance Measures for a Multimodal Corridor
 Highway Performance Measures for a Multimodal Corridor James Strathman Center for Urban Studies Portland State University P.O. Box 751 Portland, OR 97207-0751 Phone: 503-725-4069 Fax: 503-725-8480 Email:
Bus Transit Operations Control: Review and an Experiment Involving Tri-Met s Automated Bus Dispatching System
 Portland State University PDXScholar Center for Urban Studies Publications and Reports Center for Urban Studies 5-2000 Bus Transit Operations Control: Review and an Experiment Involving Tri-Met s Automated
Cleveland HealthLine Bus Rapid Transit
 Cleveland HealthLine Bus Rapid Transit Greater Cleveland Regional Transit Authority Kenneth G. Sislak, Associate Vice President; Manager of Transit/Rail Planning Agenda What is the Euclid Corridor HealthLine
CTA Transit Operations & Technology Management Divisions
 CTA Transit Operations & Technology Management Divisions AVL - Bus Tracker Planning Update and Business Case February 14, 2007 Pilot Project Background Key System Components: 1. Data Communication Methods
REVISED WITH UPDATED GRAPHICS & FORMATTING
 Fixed-Route Service Planning Guidelines & Evaluation Policy Adopted by Gold Coast Transit Board of Directors February 5, 2014 REVISED WITH UPDATED GRAPHICS & FORMATTING Table of Contents 1. Introduction
A Sophisticated Transit Signal Priority System How it Works
 A Sophisticated Transit Signal Priority System How it Works Ron Stewart, P. Eng. Associate Director IBI Group, 230 Richmond Street West, 5 th Floor Toronto, ON M5V 1V5 Canada Phone: 416-596-1930 Fax: 416-596-0644
Management of Bus Operations and Technology
 Management of Bus Operations and Technology Nigel H.M. Wilson June 10 th,2008 OUTLINE Applications of Automated Data Collection Systems Scheduling Connection Protection Service Quality Monitoring Travel
State of the Practice - How Public Transportation is addressed in Traffic Impact Studies ITE Transit and Traffic Impact Studies Committee
 State of the Practice - How Public Transportation is addressed in Traffic Impact Studies ITE Transit and Traffic Impact Studies Committee Purpose of Report Relevant Literature Survey Results Current and
VIA Long Range Plan Glossary
 VIA Long Range Plan Glossary Accessibility. Accessibility is the ability to reach opportunities (economic, social, etc.) within a certain geographical area. Americans with Disabilities Act (ADA). Passed
Exploring the Impacts of Transit Priority Measures Using Automatic Vehicle Monitoring (AVM) Data
 Data") Exploring the Impacts of Transit Priority Measures Using Automatic Vehicle Monitoring (AVM) Data Graham CURRIE, Kelvin Chun Keong GOH, Majid SARVI Department of Civil Engineering, Monash University, VIC
Exploring the Impacts of Transit Priority Measures Using Automatic Vehicle Monitoring (AVM) Data Graham CURRIE, Kelvin Chun Keong GOH, Majid SARVI Department of Civil Engineering, Monash University, VIC
Automatic Passenger Counter Evaluation: Implications for National Transit Database Reporting. Thomas J. Kimpel James G. Strathman
 Automatic Passenger Counter Evaluation: Implications for National Transit Database Reporting Thomas J. Kimpel James G. Strathman Center for Urban Studies College of Urban and Public Affairs Portland State
Jason Podany Transit/GIS Planner Metro Transit
 Leveraging GIS to Systematically Evaluate Transit Service Design for Title VI November 2009 Jason Podany Transit/GIS Planner Metro Transit Who are we? Provide regional bus, train, carpool, vanpool, walking
intelligent transportation systems, evaluation, traffic management, archived data.
 Chapter X USING ADVANCED TRAFFIC MANAGEMENT SYSTEM DATA TO EVALUATE INTELLIGENT TRANSPORTATION SYSTEM INVESTMENTS Robert L. Bertini and Ahmed M. El-Geneidy Portland State University Abstract: Key words:
Performance Monitoring and Measures
 Chapter XIII CHAPTER XIII Performance Monitoring and Measures Chapter XIII presents performance monitoring and measures appropriate for the City of Edmond. A monitoring program is important in terms of
On Time Performance. PRESENTATION TO THE BOARD OF DIRECTORS Sept 24, Presented by Kenneth Mc Donald - COO Sonali Bose - CFO
 On Time Performance PRESENTATION TO THE BOARD OF DIRECTORS Sept 24, 2007 Presented by Kenneth Mc Donald - COO Sonali Bose - CFO Purpose To respond to the Board s request on the range of resources and timeline
Strategic Plan Progress Report Goal 2 Focus. November 2015 San Francisco, California
 Strategic Plan Progress Report Goal 2 Focus November 2015 San Francisco, California 1 Goal 2 focus Make transit, walking, bicycling, taxi, ridesharing and carsharing the preferred means of travel Objective
Management and Integration of Data and Modeling at Santa Clara County Congestion Management Agency
 Management and Integration of Data and Modeling at Santa Clara County Congestion Management Agency VTA Modeling and GIS Group Peter Chen ITE SF Bay Area Annual Modeling Workshop April 29, 2015 Outlines
Using Data Mining Techniques on APC Data to Develop Effective Bus Scheduling Plans
 Using Data Mining Techniques on APC Data to Develop Effective Bus Scheduling Plans Jayakrishna PATNAIK Department of Industrial and Manufacturing Engineering, NJIT Steven CHIEN Department of Civil and
Chapter 10. Intelligent Transportation Systems. Ohio Kentucky Indiana Regional Council of Governments Regional Transportation Plan
 Chapter 10 Intelligent Transportation Systems Ohio Kentucky Indiana Regional Council of Governments 2030 Regional Transportation Plan Chapter 10 Intelligent Transportation Systems INTRODUCTION Intelligent
MTA Bus Time Implementation & New Applications
 MTA Bus Time Implementation & New Applications Michael Glikin Senior Director Bus Schedules Operations Planning MTA New York City Transit Alla Reddy Senior Director System Data & Research Operations Planning
Calculation of Transit Performance Measures Using Smartcard Data
 Calculation of Transit Performance Measures Calculation of Transit Performance Measures Using Smartcard Data Martin Trépanier, Catherine Morency, and Bruno Agard Ecole Polytechnique de Montréal Abstract
Service Routes and Community Transit Hubs: Right Sizing Transit NATIONAL CONFERENCE ON RURAL PUBLIC AND INTERCITY TRANSPORTATION OCTOBER 2-5, 2016
 Service Routes and Community Transit Hubs: Right Sizing Transit NATIONAL CONFERENCE ON RURAL PUBLIC AND INTERCITY TRANSPORTATION OCTOBER 2-5, 2016 Competing with the Auto It is tough to match the convenience
U-4704 CHAPEL HILL CARRBORO SIGNAL SYSTEM
 U-4704 CHAPEL HILL CARRBORO SIGNAL SYSTEM FINAL TRANSIT SIGNAL PRIORITY ASSESSMENT TECHNICAL MEMORANDUM Prepared by: In Association with Sabra, Wang & Associates, Inc. May 22, 2008 Copyright 2008, Kimley-Horn
Transitory Optimism. Changes in Passenger Perception Following Bus Service Improvement over Time. Ehab I. Diab and Ahmed M.
 Transitory Optimism Changes in Passenger Perception Following Bus Service Improvement over Time Ehab I. Diab and Ahmed M. El-Geneidy Passengers perception and satisfaction have long been seen and used
Improving Arterial Performance Measurement Using Traffic Signal System Data
 Portland State University PDXScholar Civil and Environmental Engineering Faculty Publications and Presentations Civil and Environmental Engineering 7-2007 Improving Arterial Performance Measurement Using
D Line Rapid Bus Project Planning Update City of Richfield Transportation Commission November 1, 2017
 D Line Rapid Bus Project Planning Update City of Richfield Transportation Commission November 1, 2017 Katie Roth, Manager Scott Janowiak, Planner BRT/Small Starts Project Office 1 D Line: Scope Substantially
What Non-Riders Want. Presented by: Joey M. Goldman, Principal CTA Fall Conference, Oakland. November 17, 2016
 What Non-Riders Want Presented by: Joey M. Goldman, Principal CTA Fall Conference, Oakland November 17, 2016 I thank God every day that my children don t have to ride the bus. Parent of a high school student
AN ARTERIAL-BASED TRANSIT SIGNAL PRIORITY CONTROL SYSTEM
 Paper ID: 18-03122 2018 TRB Annual Meeting AN ARTERIAL-BASED TRANSIT SIGNAL PRIORITY CONTROL SYSTEM Hyeonmi Kim, Yao Cheng, and Gang-Len Chang Department of Civil & Environmental Engineering University
Pierce Transit / DKS. 10 Years of TSP Evolution and Lessons Learned
 10 Years of Evolution and Lessons Learned PIERCE TRANSIT Bullet Heart of the Puget Sound Service area: 292 square miles Annual ridership: 15.4 million 263 buses providing local and regional services to
REGIONAL COLLABORATION: A MODEL FOR SUCCESSFUL ITS IMPLEMENTATION IN PORTLAND, OREGON
 REGIONAL COLLABORATION: A MODEL FOR SUCCESSFUL ITS IMPLEMENTATION IN PORTLAND, OREGON Max Coffman Portland State University, P.O. Box 751, Portland, OR 97207 USA Phone: 503-725-4285 Fax: 503-725-5950 E-mail:
Strategic Plan Progress Report Goal 2 Focus. April 2016 San Francisco, California
 Strategic Plan Progress Report Goal 2 Focus April 2016 San Francisco, California 1 Goal 2 focus Make transit, walking, bicycling, taxi, ridesharing and carsharing the preferred means of travel Objective
Miami-Dade Transit. Alice N. Bravo, P.E. Director. Miami-Dade Transit 1
 Miami-Dade Transit Alice N. Bravo, P.E. Director Miami-Dade Transit 1 Miami-Dade Transit MDT is the largest transit agency in the State of Florida, and one of the largest departments within Miami-Dade
Automated Vehicle Announcement System (AVAS) Timepoints Viewer Automated Vehicle Location (AVL) Viewer Beta CTA Bus Stops and Signs Viewer
 Timepoints Viewer Automated Vehicle Location (AVL) Viewer Beta CTA Bus Stops and Signs Viewer") Maps in Apps: ArcIMS at the Chicago Transit Authority Track: Transportation Author: Alex Kavanagh The department of Data Services at the Chicago Transit Authority uses ArcIMS and ASP (Active Server Pages)
Maps in Apps: ArcIMS at the Chicago Transit Authority Track: Transportation Author: Alex Kavanagh The department of Data Services at the Chicago Transit Authority uses ArcIMS and ASP (Active Server Pages)
DEPLOYING ADVANCED PUBLIC TRANSPORTATION SYSTEMS IN BIRMINGHAM
 DEPLOYING ADVANCED PUBLIC TRANSPORTATION SYSTEMS IN BIRMINGHAM By Steven L. Jones, Jr., Ph.D., Andrew J. Sullivan, P.E., Naveen Cheekoti, Yatin Joshi, and Hafshah K. Navarro Department of Civil and Environmental
report final Decennial Model Update Executive Summary Contra Costa Transportation Authority Cambridge Systematics, Inc.
 final report prepared for Contra Costa Transportation Authority prepared by with Dowling Associates Caliper Corporation June 2003 Table of Contents 1.0 Introduction... ES-1 2.0 Data Development... ES-5
Use of ITS Data in Transit Planning and Management at Metro Transit (Minneapolis / Saint Paul) John Levin Director of Strategic Initiatives
 John Levin Director of Strategic Initiatives") Use of ITS Data in Transit Planning and Management at Metro Transit (Minneapolis / Saint Paul) John Levin Director of Strategic Initiatives 2 Metro Transit at a Glance 15 th largest in U.S. 7 counties,
Use of ITS Data in Transit Planning and Management at Metro Transit (Minneapolis / Saint Paul) John Levin Director of Strategic Initiatives 2 Metro Transit at a Glance 15 th largest in U.S. 7 counties,
Chapter 5. Congestion Management Program. Chapter 5
 Chapter 5 Congestion Management Program Chapter 5 67 Chapter 5 Congestion Management Program Enacted in the early 1990s, California s Congestion Management Program (CMP) statutes encourage local jurisdictions
Multimodal Approach to Planning & Implementation of Transit Signal Priority within Montgomery County Maryland
 Multimodal Approach to Planning & Implementation of Transit Signal Priority within Montgomery County Maryland A Path to Successful Implementation James Allday Bunch - Sabra, Wang & Associates, Inc. ITE
You Have the Data, Now What?
 You Have the Data, Now What? Using the AVL Data to Improve On-Time Performance on Commuter Express Lines Joseph Raquel, Planning Director TransTrack User Group October 15, 2013 Foothill Transit Region
The I-80 Integrated Corridor Mobility (ICM) Project
 Project") The I-80 Integrated Corridor Mobility (ICM) Project ITE San Francisco Bay Area Section Presented by Randy Durrenberger February 21, 2013 Presentation Outline Introduction / Background Project Element Strategy
The I-80 Integrated Corridor Mobility (ICM) Project ITE San Francisco Bay Area Section Presented by Randy Durrenberger February 21, 2013 Presentation Outline Introduction / Background Project Element Strategy
Analysis of Bus Collision Incidents Using Transit ITS and other Archived Operations Data
 Portland State University PDXScholar TREC Final Reports Transportation Research and Education Center (TREC) 11-2010 Analysis of Bus Collision Incidents Using Transit ITS and other Archived Operations Data
Maximize Transportation System Capacity
 US 75 Integrated Corridor Management System Using Technology and Partnership to Using Technology and Partnership to Maximize Transportation System Capacity What is ICM? The integrated management of freeway,
Construction Related User Delay Costs The Case of the Crowchild Trail Bridge Rehabilitation in Calgary
 Construction Related User Delay Costs The Case of the Crowchild Trail Bridge Rehabilitation in Calgary Cory J. Wilson, B.Sc. Department of Civil Engineering, University of Calgary, 2500 University Dr.
SERVICE LEVEL BENCHMARK IN URBAN TRANSPORT By Megha Gupta, Urban Transport Planner, IUT
 SERVICE LEVEL BENCHMARK IN URBAN TRANSPORT By Megha Gupta, Urban Transport Planner, IUT 1 Present Scenario Indian Cities 1. Cities are Sprawling 2. Environmental Degradation 3. Declining PT & NMT 4. Low
Metro Transit Service Reliability Measures Assessment
 Metro Transit Service Reliability Measures Assessment Chen-Fu Liao Department of Civil, Environmental, and Geo- Engineering (CEGE) Senior Staff Meeting, 5/9/2017 Outline 1 Background & Objectives 2 Methodology
ADVANCED PUBLIC TRANSPORTATION SYSTEMS: DEPLOYMENT AND BENEFITS
 ADVANCED PUBLIC TRANSPORTATION SYSTEMS: DEPLOYMENT AND BENEFITS Javier, UNB Transportation Group (MScE) (Faculty Supervisor: Eric D. Hildebrand, Ph.D., P.Eng.) Introduction Intelligent Transportation Systems
Intelligent Transportation System in India
 UNESCP Expert Group Meeting on sian Highways 3 & 4 October 2016, angkok Intelligent Transportation System in India D P Gupta Director (Roads & Highways) sian Institute of Transport Development New Delhi,
INTELLIGENT TRANSPORTATION SYSTEMS APPENDIX
 INTELLIGENT TRANSPORTATION SYSTEMS APPENDIX Southern California Association of Governments ADOPTED APRIL 2012 INTELLIGENT TRANSPORTATION SYSTEMS Introduction 1 Existing System Description 1 Existing System
Demand Reduction Assumptions Used For Travel Demand Analysis of EIS Alternatives
 M E M O R A N D U M Demand Reduction Assumptions Used For Travel Demand Analysis of EIS Alternatives TO: FROM: Project Management Team Steve Perone/PTV America DATE: Revised: February 6, 2009 Background
Transportation Data Management and Analysis (TDMA)
") Transportation Data Management and Analysis (TDMA) An Introduction Southeast Florida FSUTMS Users Group June 13, 2014 Manish Jain TDMA An Introduction: Agenda Overview Select Datasets Data Processing Tools
Transportation Data Management and Analysis (TDMA) An Introduction Southeast Florida FSUTMS Users Group June 13, 2014 Manish Jain TDMA An Introduction: Agenda Overview Select Datasets Data Processing Tools
ABSTRACT CONNECTOR BUS SYSTEM. Name: Matthew Denton Crooks, Master of Science, May 2013
 ABSTRACT Title of Thesis: BUS ROUTE EVALUATION AND ROUTE REALINGMENT GUIDELINES FOR THE FAIRFAX CONNECTOR BUS SYSTEM Name: Matthew Denton Crooks, Master of Science, May 2013 Thesis Chair: Dr. Young-Jae
Improving Urban Mobility Through Urban Analytics Using Electronic Smart Card Data
 Improving Urban Mobility Through Urban Analytics Using Electronic Smart Card Data Mayuree Binjolkar, Daniel Dylewsky, Andrew Ju, Wenonah Zhang, Mark Hallenbeck Data Science for Social Good-2017,University
El Camino Real BRT Phasing Plan Initial Service Concept Development and Screening
 El Camino Real BRT Phasing Plan Initial Concept Development and Screening Prepared for: SamTrans November 2013 SF13-0692 332 Pine Street Floor 4 San Francisco, CA 94104 (415) 348-0300 Fax (415) 773-1790
Transit Signal Priority in the Denver Metro. Bart Przybyl, P.E., PTOE
 Transit Signal Priority in the Denver Metro Bart Przybyl, P.E., PTOE BACKGROUND DRCOG Denver Regional Council of Governments RTD Regional Transportation District (Transit Authority) 2007 DRCOG/RTD Transit
PDXScholar. Portland State University. Kristin A. Tufte Portland State University. Christopher M. Monsere Portland State University,
 Portland State University PDXScholar TREC Final Reports Transportation Research and Education Center (TREC) 9-2013 Multimodal Data at Signalized Intersections: Strategies for Archiving Existing and New
Re: Item 5a: Proposed Regional Means-Based Transit Fare Program Framework. Dear Chair Josefowitz and Programming and Allocations Committee Members:
 April 10, 2018 Programming and Allocations Committee Metropolitan Transportation Commission 375 Beale St, Suite 800 San Francisco, CA 94105 Re: Item 5a: Proposed Regional Means-Based Transit Fare Program
Maintenance Update to the Transit Element of the Treasure Valley Regional ITS Architecture
 Prepared for: Maintenance Update to the Transit Element of the Treasure Valley Regional ITS Architecture And And August 2009 Prepared by: Transit Update to the Treasure Valley Regional ITS Architecture
EVALUATING THE PERFORMANCE AND BENEFITS OF BUS PRIORITY, OPERATION AND CONTROL MEASURES
 Oshyani and Cats 0 0 EVALUATING THE PERFORMANCE AND BENEFITS OF BUS PRIORITY, OPERATION AND CONTROL MEASURES Masoud Fadaei Oshyani, Corresponding author Department of Transport Science Royal Institute
Spatial Technologies for Intelligent Transportation Systems and Public Transportation
 Spatial Technologies for Intelligent Transportation Systems and Public Transportation CalACT Conference September 13, 2007 Jonathon K. Corbridge, ESRI Terry Bills, ESRI 1 Technology and Public Transportation
Transit Applications and the EMTRAC System
 EMTRAC Systems STC, Inc. 1201 W. Randolph St. McLeansboro, IL 62859 Ph. (618) 648-2555 www.emtracsystems.com Transit Applications and the EMTRAC System It s 7:45 in the morning, and the number 10 bus is
APPLES TO APPLES: MEASURING THE PERFORMANCE OF TRANSIT AND ROADWAYS EQUIVALENTLY
 0 APPLES TO APPLES: MEASURING THE PERFORMANCE OF TRANSIT AND ROADWAYS EQUIVALENTLY Reuben M. Juster Faculty Research Assistant Center for Advanced Transportation Technology University of Maryland College
Camden County Travel Management Coordination Center Demonstration Project NJ
 Camden County Travel Management Coordination Center Demonstration Project NJ-26-7065 White Paper April 16, 2008 Alan M. Voorhees Transportation Center Introduction The Camden County Workforce Investment
1003 K Street NW, Suite 209 Washington, DC MEMORANDUM. Matthew Ridgway, Nat Bottigheimer, and Alex Rixey, Fehr & Peers
 1003 K Street NW, Suite 209 Washington, DC 20001 202.854.2750 MEMORANDUM Date: To: From: Subject: Eric Graye, M-NCPPC Matthew Ridgway, Nat Bottigheimer, and Alex Rixey, Fehr & Peers Performance Metrics
College Station, Texas
 I. Report No. 2. Government Accession No. 3. Recipient's Catalog No. TTJJITS RCE-95/02 4. Title and Subtitle Assessment of METRO Lift Automatic Vehicle Location System Technical Report Documentation Pa~e
S203: The Caltrans Performance Measurement System (PeMS) An Introduction to PeMS and a Demonstration of its Multimodal Tools
 An Introduction to PeMS and a Demonstration of its Multimodal Tools") S203: The Caltrans () An Introduction to and a Demonstration of its Multimodal Tools Presented By: Ellison Alegre, San Diego Association of Governments Jane Berner, Caltrans APA s 2012 National Planning
S203: The Caltrans () An Introduction to and a Demonstration of its Multimodal Tools Presented By: Ellison Alegre, San Diego Association of Governments Jane Berner, Caltrans APA s 2012 National Planning
Truck GPS Data for Freight Planning
 Truck GPS Data for Freight Planning presented to Florida Model Task Force, Orlando presented by Frank Tabatabaee Abdul Pinjari Jeff Short (ATRI) Florida DOT University of South Florida (USF) American Transportation
First-Mile/Last-Mile Solutions for Transit Access: A National Perspective on What Has and Hasn t Changed in 45 Years of Experience
 First-Mile/Last-Mile Solutions for Transit Access: A National Perspective on What Has and Hasn t Changed in 45 Years of Experience Roger Teal DemandTrans Solutions, Inc. April 29, 2017 roger.teal@demandtrans.com
Rail Service Criteria Update
 Customer Service and Operations Committee Board Information Item IV-B March 8, 2012 Rail Service Criteria Update Page 61 of 87 Washington Metropolitan Area Transit Authority Board Action/Information Summary
The VHM-HD automatically monitors and analyzes vehicle activity and includes:
 YASHU.COM Wireless J1939 Heavy Duty Vehicle Monitor for Fleet Management Applications Yashu s Wireless J-1939 Heavy Duty Truck Vehicle Health Monitor & Analyzer (VHM-HD ) for fleet management is a customer
Subject: Triennial TDA Performance Audit Final Report
 Agenda Item No. 7.b.1. To: Board of Directors Date: August 4, 2014 From: Laramie Bowron, Manager of Planning Reviewed by: Subject: Triennial TDA Performance Audit Final Report Summary of Issues: The Metropolitan
San Francisco Freeway Corridor Management Study (SF FCMS)
") Item 6 Enclosure B Plans and Programs Committee March 17, 2015 San Francisco Freeway Corridor Management Study (SF FCMS) Phase 1 Findings and Recommendations Agenda Item 6 SAN FRANCISCO COUNTY TRANSPORTATION
Item 6 Enclosure B Plans and Programs Committee March 17, 2015 San Francisco Freeway Corridor Management Study (SF FCMS) Phase 1 Findings and Recommendations Agenda Item 6 SAN FRANCISCO COUNTY TRANSPORTATION
Creating a Transit Supply Index. Andrew Keller Regional Transportation Authority and University of Illinois at Chicago
 Creating a Transit Supply Index Andrew Keller Regional Transportation Authority and University of Illinois at Chicago Presented at Transport Chicago Conference June 1, 2012 Introduction This master's project
Woodburn Interchange Project Transportation Technical Report
 Final Report Woodburn Interchange Project Transportation Technical Report Prepared for Oregon Department of Transportation April 212 Prepared by DKS Associates Contents Methodologies... 4 Volume Development...
TRANSIT SERVICE GUIDELINES
 CHATHAM AREA TRANSIT AUTHORITY FEBRUARY 2014 Table of Contents 1. PURPOSE... 3 2. CAT SERVICE GUIDELINES... 3 3. TRAVEL MARKETS... 4 4. TRANSIT COVERAGE... 4 5. TRANSIT ACCESS... 4 6. BUS STOP SPACING
Building the Regional Transit Strategy
 oregonmetro.gov/rtp 2018 Regional Transportation Plan Building the Regional Transit Strategy TriMet Board of Directors August 9, 2017 Regional Transportation Plan Sets the course for moving the region
Strategic Plan Progress Report SEPTEMBER 2013 SAN FRANCISCO, CALIFORNIA
 Strategic Plan Progress Report SEPTEMBER 2013 SAN FRANCISCO, CALIFORNIA Goal 1 Create a safer transportation experience for everyone Objective 1.1 Improve security for transportation system users. Objective
LYNX Flexible Services
 LYNX Flexible Services FPTA October 27, 2014 Andrea Ostrodka Director of Planning & Development Central Florida Regional Transportation Authority LYNX & Central Florida Service Area: Orange, Osceola and
Strategic Plan Progress Report Goal 2 Focus. March 2017 San Francisco, California
 Strategic Plan Progress Report Goal 2 Focus March 2017 San Francisco, California 1 Goal 2 focus Make transit, walking, bicycling, taxi, ridesharing and carsharing the preferred means of travel Objective
ADDENDUM NO. 2 REQUEST FOR QUALIFICATIONS NO ORIGIN & DESTINATION ON-BOARD TRANSIT SURVEY. November 12, 2013
 ADDENDUM NO. 2 REQUEST FOR QUALIFICATIONS NO. 14-076 2014 ORIGIN & DESTINATION ON-BOARD TRANSIT SURVEY November 12, 2013 The Regional Transportation Commission of Southern Nevada (RTC) herewith issues
Integrated Transport System & Land-Use Planning
 Integrated Transport System & Land-Use Planning Challenges in Accra Metropolitan Area and Solutions for Addressing Them SSATP Annual General Meeting 20 th -24 th February 2017 Marrakech, Morocco Presentation
Utilizing High-Resolution Archived Transit Data to Study Beforeand-After Travel-Speed and Travel-Time Conditions
 Portland State University PDXScholar Dissertations and Theses Dissertations and Theses Fall 12-7-2017 Utilizing High-Resolution Archived Transit Data to Study Beforeand-After Travel-Speed and Travel-Time
Different Payment Methods Impact on Transit Speed and Performance Shaker Rabban Transportation Economics CE 8214
 Different Payment Methods Impact on Transit Speed and Performance Shaker Rabban Transportation Economics CE 8214 Introduction Transit speed and reliability of a bus hinges on a number of factors. Reliability
APPENDIX B - GLOSSARY FEBRUARY 2017
 APPENDIX B - GLOSSARY FEBRUARY 2017 DENVERMOVES Transit Denver Moves: Transit - ii - APPENDIX B TRANSIT AND MOBILITY GLOSSARY Amenities, stop or station: Objects or facilities (such as a shelter, bench,
Performance Measures for Transportation Planning Part 1
 Performance Measures for Transportation Planning Part 1 Flint, MI July 12, 2011 Brian Betlyon FHWA Resource Center Overview Performance Measurement in Transportation Planning Module Outcomes Describe performance
Regional Transitway Guidelines
 This document is made available electronically by the Minnesota Legislative Reference Library as part of an ongoing digital archiving project. http://www.leg.state.mn.us/lrl/lrl.asp Regional Transitway
ITS IMPLEMENTATION PLAN REPORT
 Flint Mass Transportation Authority REPORT February 2005 TABLE OF CONTENTS 1. INTRODUCTION...1 2. GOALS AND OBJECTIVES...1 3. EXISTING CONDITIONS...1 4. NEEDS AND DEFICIENCIES...2 5. EVALUATION OF ITS