Rail Time Indicators A Review of Key Economic Trends Shaping Demand for Rail Transportation
|
|
|
- Dwain Underwood
- 6 years ago
- Views:
Transcription
1 Rail Time Indicators A Review of Key Economic Trends Shaping Demand for Rail Transportation Policy & Economics Department Association of American Railroads Washington, D.C. January 6, 2012
2 Rail Time Indicators is issued monthly by the Policy and Economics Department of the Association of American Railroads. It is free of charge. To get on the distribution list for Rail Time Indicators, send a request including your name and business affiliation, if any, to Beth Eagney at beagney@aar.org. If you have questions or comments about the content of Rail Time Indicators, please contact Dan Keen (dkeen@aar.org, ) or Shannon Stare (sstare@aar.org, ). Copyright 2012 by the Association of American Railroads. Reproduction or retransmittal of Rail Time Indicators within a company for internal use is allowed, as is reasonable redistribution outside a company (for example, passing it on to someone you think might be interested in it). Unless approved by the AAR, reproduction or retransmittal for commercial use is prohibited except for short excerpts or quotations. Uploading of Rail Time Indicators to a public web site is prohibited unless approved by the AAR. All media inquiries should be directed to Holly Arthur (harthur@aar.org, ). The last six editions of Rail Time Indicators are available on the AAR web site here. Rail traffic data in Rail Time Indicators are sometimes presented on a seasonally adjusted basis and sometimes on a non-seasonally adjusted basis. Because of the nature of the AAR s weekly rail traffic data and the nature of rail traffic (e.g., daily data are not available; some months have four weeks of data and some have five; holidays may be in one rail traffic month one year and in a different month the next; rail traffic varies by the day of the week; some commodity categories can exhibit wide swings in carloads from month to month for reasons unrelated to seasonal variations; the weather can have significant effects on traffic), the seasonal-adjustment process for rail traffic is not completely precise. Seasonally adjusted rail traffic data should be considered a complement to, rather than a replacement for, unadjusted rail traffic data. Information in Rail Time Indicators is obtained from sources believed to be reliable. However, the Association of American Railroads makes no representations as to the accuracy or completeness of such information and assumes no liability for errors or omissions.
3 SUMMARY OF MOST RECENT DATA Economic Indicator U.S. Freight Rail Traffic (p. 2) Canadian Freight Rail Traffic (p. 4) Gross Domestic Product (p. 19) Purchasing Managers Index (p. 20) Most Recent Data Not Seasonally Adjusted: Carloads in December 7.3% over December ; intermodal in December 9.4% over Dec.. Seasonally Adjusted: Carloads in December 1.8% over November ; intermodal in December 0.4% over. Not Seasonally Adjusted: Carloads in December 8.9% over Dec. ; intermodal in December 10.2% over Dec.. Seasonally Adjusted: Carloads in December 6.8% over November ; intermodal in December 1.7% over. 1.8% in Q3, according to the third preliminary estimate released on December 22. Revised downward from 2. (BEA s October estimate) to 2. (November estimate) to 1.8% (December estimate). to 53.9 in December from 52.7 in November. New orders to 57.6 in December from 56.7 in November. Non-Manufact. Index (p. 20) to 52.6 in December from 52.0 in November. Manufacturing Inventories and Sales (p. 21) Manufacturing sales flat, manufacturing inventories 0., and inventory-to-sales ratio 0.4% in November over October. Industrial Production (p. 22) Overall industrial output 0.2% in November from October ; manufacturing output 0.3% in November from October. Capacity Utilization (p. 23) to 77.8% in November from 78. in October. Employment (p. 25) 200,000 net new jobs created in December. Unemployment Rate (p. 25) Class I RR Employment (p. 26) to 8. in December from 8.7% in November. Lowest level since February. 132 in November from October to 160,119 employees. Consumer Confidence (p. 27) to 64.5 in December from 55.2 in November. Retail Sales (p. 28) 0.2% ($883 million) in November over October. Light Vehicle Sales (p. 29) to 13.5 million (annualized) in December from 13.6 million in November. Housing Starts (p. 30) 9.3% in November to 685,000 from 627,000 in October. Consumer Price Index (p. 32) Rail Freight Cars in Storage (p. 33) Flat in November compared with October and 3.4% for the year ending November. to 273,390 on January 1, 2012 (18. of the fleet), up 9,478 cars from December 1,. Rail Time Indicators January 6, 2012 Page 1 of 33
4 U.S. AND CANADIAN FREIGHT RAILROAD TRAFFIC What is it and why is it important? The Association of American Railroads (AAR) releases its Weekly Railroad Traffic report every Thursday morning. The report contains rail traffic data for the previous week. Weekly data are aggregated into monthly figures in Rail Time Indicators. Railroads reporting to the AAR collectively handle about 9 of total U.S. and Canadian freight rail traffic. AAR rail traffic data are reported as carloads or as intermodal units. Carload traffic is classified into one of 20 different commodity categories (see the table on page 6 for a list) and is carried in a variety of rail car types (e.g., tank cars, covered hoppers, gondolas, boxcars, etc.). A unit of rail intermodal traffic is either a shipping container (about 8 of U.S. rail intermodal traffic) or a truck trailer (about 1) carried on a railroad flat car. Intermodal is not included in carload figures. Commodity detail on the freight inside the container or trailer is not available. Freight railroading is a derived demand industry: demand for rail service occurs as a result of demand elsewhere in the economy for the products railroads haul. Thus, rail traffic is a useful gauge of broader economic activity, especially of the tangible economy. What are the latest numbers for U.S. railroads? A good beginning, some uncertainness in the middle, and a good ending that describes U.S. rail traffic in. Total carloads for the year were 15.2 million, up 2.2% over s 14.8 million and up 9.7% over s 13.8 million. Total U.S. rail intermodal volume in was 11.9 million containers and trailers, up 5.4% over s 11.3 million units and up 20.4% over s 9.9 million units. Unfortunately, there s still a ways to go before U.S. railroads recover all they lost in the recession. U.S. rail carload and intermodal traffic both peaked in 2006, and then bottomed out in. In, total carloads were 20.2% lower than in 2006, and intermodal volume was 19.6% lower. In, total carloads were 12.4% lower than in 2006 and intermodal volume was 3.2% lower. Put another way, in U.S. railroads had recovered about 38% of the carload traffic they had lost in the recession from the 2006 peak, and intermodal volume had come about 84% of the way back. The charts below illustrate how intermodal traffic has recovered much more than carload traffic. Rail cars are generally higher capacity today than in years past because of such factors as the use of lighter-weight aluminum instead of steel, which allow railroads to haul more productive weight (the cargo) and less non-productive weight (the car). In other words, a rail carload today is generally worth more, in terms of tons carried, than a carload 15 or 20 years ago. (Think of it as the opposite of the fact that a dollar today is worth less than a dollar 20 years ago, because of inflation.) The red line in the chart below left is an estimate of the number of -sized carloads that would have been required to move the freight that U.S. railroads hauled in each year U.S. Rail Carloads: Total All Commodities (Millions) Adjusted carloads originated* Actual carloads originated *Adjustment based on changes in average tons per car for commodity categories over time and should be considered approximate. Source: AAR Weekly Railroad Traffic U.S. Rail Intermodal Trailers and Containers (Millions) Source: AAR Weekly Railroad Traffic Rail Time Indicators January 6, 2012 Page 2 of 33
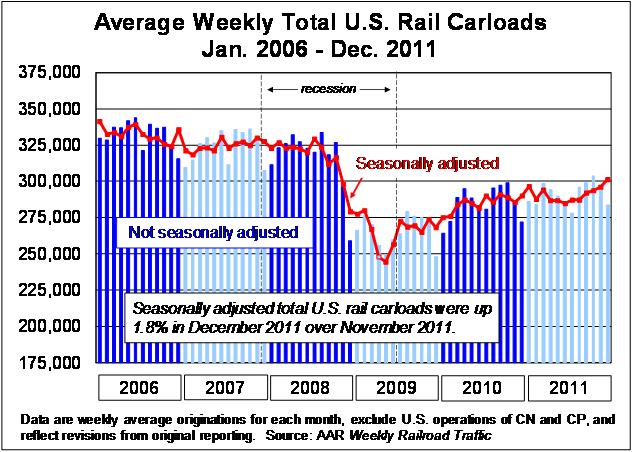
5 1 % Change in Total U.S. Rail Carloads From Previous Year 2 % Change in Total U.S. Intermodal Traffic From Previous Year Data exclude the U.S. operations of CN and CP and exclude intermodal traffic. Source: AAR Weekly Railroad Traffic Data exclude the U.S. operations of CN and CP. Source: AAR Weekly Railroad Traffic In, 14 of the 20 carload commodity categories tracked by the AAR saw increases on U.S. railroads compared with, indicating a broad recovery across industry sectors. For the second year in a row, the commodity with the largest year-over-year gain was metallic ores (up 67,631 carloads, or 20.). Other commodities seeing carload gains in over include motor vehicles and parts (up 61,187 carloads, or 9.7%); primary metal products (up 56,988 carloads, or 12.); chemicals (up 50,721 carloads, or 3.4%); and crushed stone, gravel, and sand (up 44,653 carloads, or 5.2%). The commodity with the biggest carload decline in from was grain (down 27,946 carloads, or 2.4% see page 12). The table on page 7 has commodity-level detail for U.S. railroads for,, and. In, coal accounted for 44. of non-intermodal U.S. carloads, down from 45.4% in and 48.1% in (which was a record high). In second place for was chemicals (10.2% of non-intermodal carloads); grain was third (7.4%). Containers accounted for 85. of U.S. rail intermodal movements in, a record high and up from 42. in 1989, 68.7% in 2000, and 85.1% in. U.S. railroads originated 1,134,580 carloads in December, an average of 283,645 per week and up 7.3% over December. That s the biggest year-over-year monthly increase since January, but the gain is somewhat overstated because December ended on December 31,, while December ended on January 1,. That means that the New Year s holiday (a very low traffic day) is not included in December but is included in December. Average Weekly U.S. Rail Carloads: All Commodities (not seasonally adjusted) 360, , , , , , , (peak year) Data are weekly average originations for each month, exclude the U.S. operations of CN and CP, and reflect revisions to original reporting. Source: AAR Weekly Railroad Traffic % Change in Total U.S. Rail Carloads From Same Month Previous Year: Jan Dec. December was up 7.3% over December and up 18.6% over December Data are based on originations, are not seasonally adjusted, exclude U.S. operations of CN and CP, and reflect revisions to original reporting. Source: AAR Weekly Railroad Traffic Rail Time Indicators January 6, 2012 Page 3 of 33
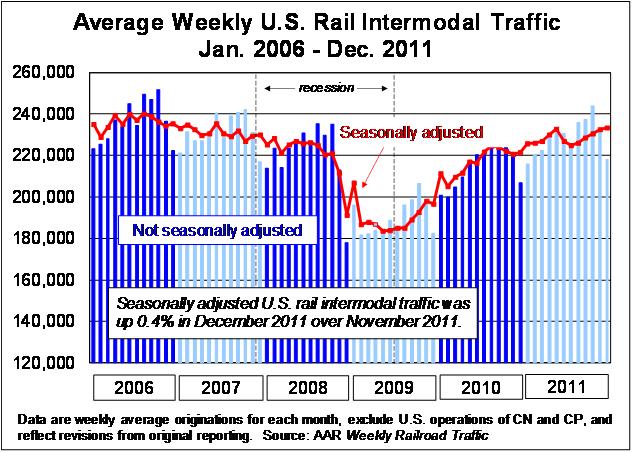
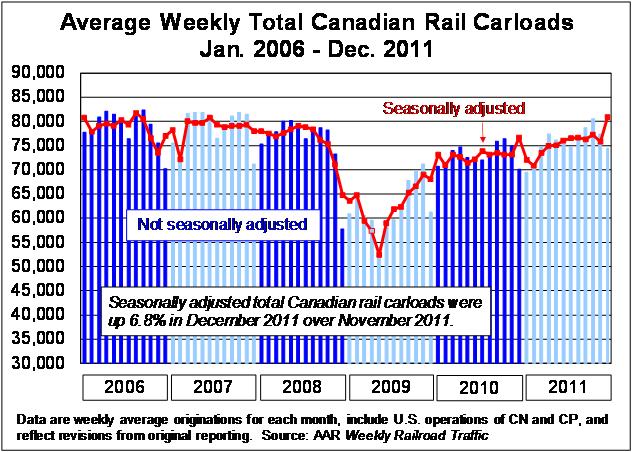
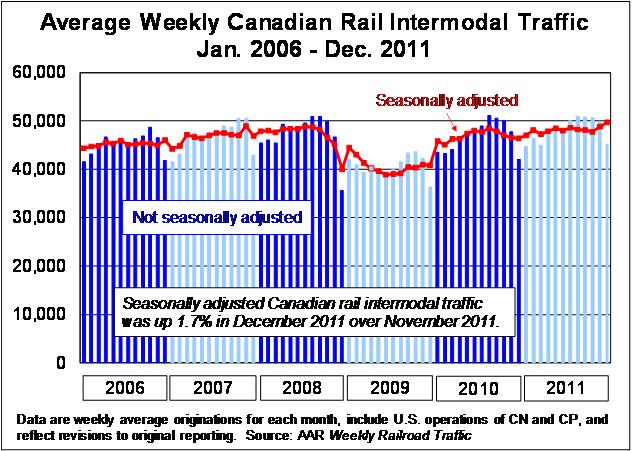
6 260, , , , , , , , , ,000 Average Weekly U.S. Rail Intermodal Traffic (not seasonally adjusted) 2006 (peak year) Data are weekly average originations for each month, exclude U.S. operations of CN and CP, and reflect revisions to original reporting. Source: AAR Weekly Railroad Traffic % Change in U.S. Rail Intermodal Traffic From Same Month Previous Year: Jan Dec December was up 9.4% over December and up 23.8% over December Data are based on originations, are not seasonally adjusted, exclude U.S. operations of CN and CP, and reflect revisions to original reporting. Source: AAR Weekly Railroad Traffic In December, 16 of the 20 carload commodity categories tracked by the AAR saw increases compared with December (see table at right). The table on page 6 has much more commodity-level detail for December for U.S. railroads. U.S. rail intermodal originations totaled 873,390 containers and trailers in December, an average of 218,348 per week up 9.4% over December and the second-highest monthly intermodal average for any December in history (behind December 2006 see chart above left). Because of the year-end holidays and other seasonal issues (often including nasty weather), December is always one of the lowest-volume months of the year for U.S. railroads, so seasonal adjustment can be especially helpful. Seasonally adjusted U.S. rail carloads were up 1.8% in December over November, their fourth-straight month-to-month increase. Seasonally adjusted U.S. rail intermodal traffic # of AAR Commodity Categories* With Year-Over-Year Gains For U.S. Railroads Month Jan Feb Mar Apr May Jun Jul Aug Sep Oct Nov Dec *Out of 20. Source: AAR was up 0.4% in December over November ; they ve risen for five straight months. (See the charts on page 17.) What are the latest numbers for Canadian railroads? Canadian rail traffic also improved in. Canadian railroads originated 3,927,217 carloads in up 3.4% over and up 20.9% over. Canadian carloads in were higher in 15 of the 20 commodity categories compared with. Canadian railroads also originated 2.5 million containers and trailers in, up 2.4% over, up 18.6% over, and the highest annual total ever for Canadian railroads. The top three highest-volume commodity categories for Canadian railroads in were metallic ores (16.9% of non-intermodal carloads), chemicals (14.7%), and grain (12.). Coal accounted for just 10.9% of Canadian non-intermodal carloads in, compared with 44. for U.S. railroads. Containers accounted for 96.8% of Canadian rail intermodal movements in. In, the biggest year-over-year gains on Canadian railroads were in chemicals (up 41,936 carloads, or 7.9%) and metallic ores (up 22,098 carloads, or 3.4%). The commodity with the biggest decline was grain (down 11,727 carloads, or 2.4%). The table on page 9 has more commodity detail for Canadian railroads in. On a non-seasonally adjusted basis, Canadian railroads originated an average of 74,461 carloads per week in December, up 8.9% over December. With an average of Rail Time Indicators January 6, 2012 Page 4 of 33
7 45,222 containers and trailers per week, Canadian intermodal traffic in December was up 10.2% over December. The table on page 8 has commodity detail for Canadian railroads in December. Seasonally adjusted Canadian rail carloads in December were up 6.8% over November, while seasonally adjusted intermodal volumes in December were up 1.7% over November. (See the charts on page 17.) Canadian Rail Carloads: Total All Commodities* (Millions) '96 '97 '98 '99 '00 '01 '02 '03 '04 '05 '06 '07 '08 '09 '10 ' Canadian Rail Intermodal Trailers and Containers (Millions) '96 '97 '98 '99 '00 '01 '02 '03 '04 '05 '06 '07 '08 '09 '10 '11 *CN and CP originations, including their U.S. operations. Source: AAR Weekly Railroad Traffic *CN and CP originations, including their U.S. operations. Source: AAR Weekly Railroad Traffic Avg. Weekly Canadian Rail Carloads: All Commodities (not seasonally adjusted) 90,000 85,000 80,000 75,000 70,000 65,000 60,000 55,000 50, (peak year) Data are weekly average originations for each month, include CN and CP (including their U.S. operations), and reflect revisions to original reporting. Source: AAR Weekly Railroad Traffic % Change in Total Canadian Rail Carloads From Same Month Previous Year: Jan Dec December was up 8.9% over December and up 22.2% over December Data are weekly average originations for each month, include CN and CP (including their U.S. operations), and reflect revisions to original reporting. Source: AAR Weekly Railroad Traffic Average Weekly Canadian Rail Intermodal Traffic (not seasonally adjusted) 54,000 50,000 46,000 42,000 38,000 34,000 (peak year) 2007 Data are based on originations, include CN and CP (including their U.S. operations), and reflect revisions to original reporting. Source: AAR Weekly Railroad Traffic % Change in Total Canadian Intermodal Traffic From Same Month Previous Year: Jan Dec December was up 10.2% over December and up 27.2% over December Data are weekly average originations for each month, include CN and CP (including their U.S. operations), and reflect revisions to original reporting. Source: AAR Weekly Railroad Traffic Rail Time Indicators January 6, 2012 Page 5 of 33
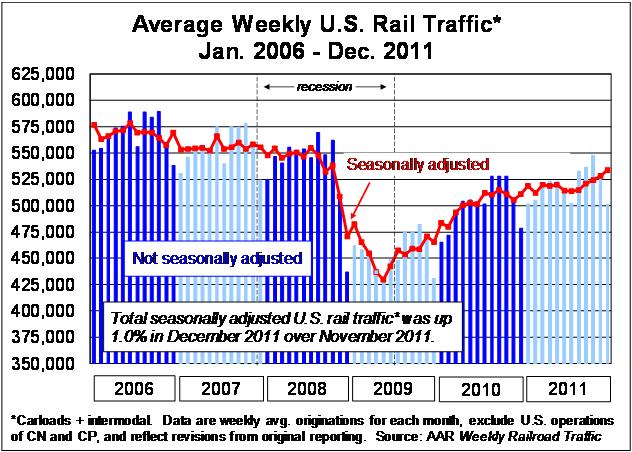
8 U.S. RAIL TRAFFIC: DECEMBER * (4 weeks ending December 31, ) Difference % Change Commodity Dec Dec Dec '11-'10 '11-'09 '11-'10 '11-'09 Agricultural & food products 149, , ,636-4,186 6, % 4.4% Grain 84,091 87,895 79,346-3,804 4, % 6. Farm products excl. grain 3,731 4,013 3, % Grain mill products (1) 37,655 37,860 38, , % Food products 24,438 24,333 22, , % 9.8% Chemicals and petroleum 145, , ,350 8,270 24, % Chemicals 114, , ,014 2,486 14, % 14.3% Petroleum & petr. products (2) 31,240 25,456 21,336 5,784 9, % 46.4% Coal 514, , ,086 27,938 68, % 15.3% Forest products 41,152 39,309 34,716 1,843 6, % 18. Primary forest products (3) 5,961 5,787 5, % Lumber & wood products 10,267 9,047 7,287 1,220 2, % Pulp & paper products 24,924 24,475 21, , % 14.1% Metallic ores and metals 103,127 90,784 69,441 12,343 33, % 48. Metallic ores (4) 31,714 26,014 16,388 5,700 15, % 93. Coke 13,347 12,721 11, , % 18. Primary metal products (5) 42,282 36,225 29,034 6,057 13, % 45.6% Iron & steel scrap 15,784 15,824 12, , % 24.2% Motor vehicles & parts 52,227 43,505 44,902 8,722 7, % Nonmetallic minerals & prod. 101,433 81,102 72,428 20,331 29, % 40. Crushed stone, gravel, sand 59,731 44,994 37,628 14,737 22, % 58.7% Nonmetallic minerals (6) 17,463 14,383 16,724 3, % 4.4% Stone, clay & glass prod. (7) 24,239 21,725 18,076 2,514 6, % 34.1% Other 26,994 24,695 24,368 2,299 2, % 10.8% Waste & nonferrous scrap (8) 12,079 10,354 12,097 1, % -0.1% All other carloads 14,915 14,341 12, , TOTAL ALL CARLOADS 1,134,580 1,057, ,927 77, , % 18.6% Trailers 130, , , , % 11. Containers 742, , ,477 74, , % 26.2% TOTAL ALL INTERMODAL 873, , ,536 75, , % 23.8% (1) - flour, animal feed, corn syrup, corn starch, soybean meal, DDGs, etc. (5) - primarily iron & steel; some aluminum, copper, etc. (2) - crude petroleum and all products of petroleum refining (6) - phosphate rock, rock salt, crude sulphur, clay, etc. (liquefied gases, asphalt, fuel oil, lubricating oil, jet fuel, etc.) (7) - cement, ground earths or minerals, gypsum, etc. (3) - wood raw materials such as pulpwood and wood chips (8) - scrap paper, construction debris, ashes, etc. (4) - overwhelmingly iron ore, but some aluminum ore, copper ore, etc. *Data are originations not seasonally adjusted. Includes BNSF, CSX, KCS, NS, UP, Birmingham Southern, Florida East Coast, Lake Superior & Ishpeming, and Paducah & Louisville. Excludes CN's and CP's U.S. operations. Source: AAR Weekly Railroad Traffic 625, , , , , , , , ,000 Average Weekly U.S. Rail Traffic: Total Carloads + Intermodal Units 2006 (peak year) 400,000 Data are weekly average originations for each month, are not seasonally adjusted, exclude U.S. operations of CN and CP, and reflect revisions to original reporting. Source: AAR % Change in U.S. Rail Carloads + Intermodal Units From Same Month Prev. Year: Jan Dec December was up 8.2% over December and up 20.8% over December Data are based on originations, are not seasonally adjusted, exclude U.S. operations of CN and CP, and reflect revisions to original reporting. Source: AAR Weekly Railroad Traffic Rail Time Indicators January 6, 2012 Page 6 of 33
9 U.S. RAIL TRAFFIC: ANNUAL TOTALS* Difference % Change % of Commodity '11-'10 '11-'09 '11-'10 '11-'09 Total Agricultural & food products 1,994,511 2,046,715 1,906,936-52,204 87, % 4.6% 13.2% Grain 1,123,463 1,151,409 1,037,827-27,946 85, % 8.3% 7.4% Farm products excl. grain 46,047 48,224 41,843-2,177 4, % Grain mill products (1) 494, , ,332-20,501 4, % 3.3% Food products 330, , ,934-1,580-6, % Chemicals and petroleum 1,917,638 1,830,106 1,667,588 87, , % % Chemicals 1,548,075 1,497,354 1,365,763 50, , % 13.3% 10.2% Petroleum & petr. products (2) 369, , ,825 36,811 67, % 22.4% 2.4% Coal 6,749,436 6,730,711 6,651,201 18,725 98, % Forest products 532, , ,862 17,936 39, % 3. Primary forest products (3) 77,601 83,931 79,753-6,330-2, % 0. Lumber & wood products 143, , ,972 11,479 24, % 20.4% 0.9% Pulp & paper products 312, , ,137 12,787 17, % 6.1% 2.1% Metallic ores and metals 1,345,633 1,205, , , , % 62.2% 8.9% Metallic ores (4) 396, , ,240 67, , % Coke 176, , , , % 22.7% 1.2% Primary metal products (5) 531, , ,582 56, , % 3. Iron & steel scrap 240, , ,634 15,383 55, % 30.2% 1.6% Motor vehicles & parts 692, , ,244 61, , % 28.6% 4.6% Nonmetallic minerals & prod. 1,531,565 1,466,184 1,332,387 65, , % 10.1% Crushed stone, gravel, sand 901, , ,172 44, , % % Nonmetallic minerals (6) 256, , ,783 2,786 13, % % Stone, clay & glass prod. (7) 374, , ,432 17,942 45, % 2. Other 391, , ,200-9,172-3, % -0.8% 2.6% Waste & nonferrous scrap (8) 167, , ,932-19,419-10, % -6.1% 1.1% All other carloads 223, , ,268 10,247 7, % 3.6% 1. TOTAL ALL CARLOADS 15,155,992 14,826,284 13,813, ,708 1,342, % 9.7% 100. Trailers 1,720,967 1,684,684 1,639,603 36,283 81, % Containers 10,171,464 9,598,467 8,236, ,997 1,935, TOTAL ALL INTERMODAL 11,892,431 11,283,151 9,875, ,280 2,016, % 20.4% 100. (1) - flour, animal feed, corn syrup, corn starch, soybean meal, DDGs, etc. (5) - primarily iron & steel; some aluminum, copper, etc. (2) - crude petroleum and all products of petroleum refining (6) - phosphate rock, rock salt, crude sulphur, clay, etc. (liquefied gases, asphalt, fuel oil, lubricating oil, jet fuel, etc.) (7) - cement, ground earths or minerals, gypsum, etc. (3) - w ood raw materials such as pulpw ood and wood chips (8) - scrap paper, construction debris, ashes, etc. (4) - overwhelmingly iron ore, but some aluminum ore, copper ore, etc. *Data are originations not seasonally adjusted. Includes BNSF, CSX, KCS, NS, UP, Birmingham Southern, Florida East Coast, Lake Superior & Ishpeming, and Paducah & Louisville. Excludes CN's and CP's U.S. operations. Source: AAR Weekly Railroad Traffic % Change in Total U.S. Rail Carloads From Same Quarter Previous Year: Q Q4-0.04% Data are based on originations, are not seasonally adjusted, exclude U.S. operations of CN and CP, and reflect revisions to original reporting. Source: AAR Weekly Railroad Traffic % Change in U.S. Intermodal Traffic From Same Quarter Previous Year: Q Q Data are based on originations, are not seasonally adjusted, exclude U.S. operations of CN and CP, and reflect revisions to original reporting. Source: AAR Weekly Railroad Traffic Rail Time Indicators January 6, 2012 Page 7 of 33
10 CANADIAN RAIL TRAFFIC: DECEMBER * (4 weeks ending December 31, ) Difference % Change Commodity Dec Dec Dec '11-'10 '11-'09 '11-'10 '11-'09 Agricultural & food products 66,051 60,187 53,412 5,864 12, % 23.7% Grain 36,782 33,201 31,637 3,581 5, % 16.3% Farm products excl. grain 14,562 12,500 9,480 2,062 5, % Grain mill products (1) 6,173 6,360 5, % 7.9% Food products 8,534 8,126 6, , % Chemicals and petroleum 62,892 60,306 49,948 2,586 12, % 25.9% Chemicals 41,934 43,001 33,871-1,067 8, % Petroleum & petr. products (2) 20,958 17,305 16,077 3,653 4, % 30.4% Coal 33,427 30,607 25,604 2,820 7, % 30.6% Forest products 28,328 27,887 23, , % 22.4% Primary forest products (3) 5,722 4,913 4, , % Lumber & wood products 9,204 8,073 5,792 1,131 3, % Pulp & paper products 13,402 14,901 12,816-1, % 4.6% Metallic ores and metals 63,713 58,701 59,481 5,012 4, % Metallic ores (4) 49,193 46,294 48,342 2, % 1.8% Coke 1,532 1,652 1, % 10.3% Primary metal products (5) 9,358 7,960 7,340 1,398 2, % 27. Iron & steel scrap 3,630 2,795 2, , % 50.6% Motor vehicles & parts 20,021 15,473 15,242 4,548 4, % 31.4% Nonmetallic minerals & prod. 17,589 14,931 12,717 2,658 4, % 38.3% Crushed stone, gravel, sand 7,233 5,320 3,801 1,913 3, % Nonmetallic minerals (6) 6,336 5,942 6, % 4.7% Stone, clay & glass prod. (7) 4,020 3,669 2, , % 40. Other 5,823 5,427 4, , % 37.7% Waste & nonferrous scrap (8) 2, ,231 1, % All other carloads 3,660 4,437 2, TOTAL ALL CARLOADS 297, , ,780 24,325 54, % 22.2% Trailers 5,991 4,876 5,273 1, % 13.6% Containers 174, , ,950 15,655 37, % 27.7% TOTAL ALL INTERMODAL 180, , ,223 16,770 38, % 27.2% (1) - flour, animal feed, corn syrup, corn starch, soybean meal, DDGs, etc. (5) - primarily iron & steel; some aluminum, copper, etc. (2) - crude petroleum and all products of petroleum refining (6) - phosphate rock, rock salt, crude sulphur, clay, etc. (liquefied gases, asphalt, fuel oil, lubricating oil, jet fuel, etc.) (7) - cement, ground earths or minerals, gypsum, etc. (3) - wood raw materials such as pulpwood and wood chips (8) - scrap paper, construction debris, ashes, etc. (4) - overwhelmingly iron ore, but some aluminum ore, copper ore, etc. *CN and CP, including their U.S. operations. Data are originations not seasonally adjusted. Source: AAR Weekly Railroad Traffic 140, , , , ,000 90,000 Average Weekly Canadian Rail Traffic: Total Carloads + Intermodal Units 2007 (peak year) Data are weekly average originations for each month, are not seasonally adjusted, include CN and CP (including their U.S. operations), and reflect revisions to original reporting. Source: AAR % Change in Canadian Carloads + Intermodal Units From Same Month Prev. Year: Jan Dec December was up 9.4% over December and up 24. over December Data are weekly average originations for each month, include CN and CP (including their U.S. operations), and reflect revisions to original reporting. Source: AAR Weekly Railroad Traffic Rail Time Indicators January 6, 2012 Page 8 of 33
11 CANADIAN RAIL TRAFFIC: ANNUAL TOTALS* Difference % Change % of Commodity '11-'10 '11-'09 '11-'10 '11-'09 Total Agricultural & food products 822, , , , % 20.9% Grain 470, , ,358-11,727-13, % -2.8% 12. Farm products excl. grain 158, , ,334 8,380 6, % 4.1% 4. Grain mill products (1) 82,849 83,165 78, , % % Food products 110, , ,173 3,332 10, % % Chemicals and petroleum 811, , ,844 52, , % 20.7% Chemicals 575, , ,172 41, , % 40.6% 14.7% Petroleum & petr. products (2) 235, , ,672 10,850 16, % 7.7% 6. Coal 429, , ,002 12,948 77, % 22.1% 10.9% Forest products 390, , ,873 15,512 37, % Primary forest products (3) 78,842 75,690 74,684 3,152 4, % 5.6% 2. Lumber & wood products 129, , ,424 14,727 28, % 27.9% 3.3% Pulp & paper products 182, , ,765-2,367 4, % 2.6% 4.6% Metallic ores and metals 858, , ,409 27, , % 43.4% 21.9% Metallic ores (4) 665, , ,912 22, , % 44.6% 16.9% Coke 26,248 28,888 21,714-2,640 4, % 20.9% 0.7% Primary metal products (5) 119, ,535 86,024 2,595 33, % Iron & steel scrap 47,846 42,577 30,759 5,269 17, % 55.6% 1.2% Motor vehicles & parts 265, , ,644 15,036 69, % 6.8% Nonmetallic minerals & prod. 274, , ,551 9,128 51, % 22.9% 7. Crushed stone, gravel, sand 119, ,874 83,296 5,456 36, % 43.3% 3. Nonmetallic minerals (6) 86,811 85,709 79,225 1,102 7, % 9.6% 2.2% Stone, clay & glass prod. (7) 68,591 66,021 61,030 2,570 7, % 12.4% 1.7% Other 74,988 78,315 80,955-3,327-5, % -7.4% 1.9% Waste & nonferrous scrap (8) 22,295 20,278 25,433 2,017-3, % -12.3% 0.6% All other carloads 52,693 58,037 55,522-5,344-2, % -5.1% 1.3% TOTAL ALL CARLOADS 3,927,217 3,798,143 3,247, , , % 20.9% 100. Trailers 80,375 80,804 82, , % 3.2% Containers 2,424,706 2,365,950 2,030,157 58, , % 96.8% TOTAL ALL INTERMODAL 2,505,081 2,446,754 2,112,910 58, , % 18.6% 100. (1) - flour, animal feed, corn syrup, corn starch, soybean meal, DDGs, etc. (5) - primarily iron & steel; some aluminum, copper, etc. (2) - crude petroleum and all products of petroleum refining (6) - phosphate rock, rock salt, crude sulphur, clay, etc. (liquefied gases, asphalt, fuel oil, lubricating oil, jet fuel, etc.) (7) - cement, ground earths or minerals, gypsum, etc. (3) - wood raw materials such as pulpwood and wood chips (8) - scrap paper, construction debris, ashes, etc. (4) - overwhelmingly iron ore, but some aluminum ore, copper ore, etc. *CN and CP, including their U.S. operations. Data are originations not seasonally adjusted. Source: AAR Weekly Railroad Traffic % Change in Total Canadian Rail Carloads From Same Quarter Previous Year: Q Q % Data are based on originations, include CN and CP (including their U.S. operations), and reflect revisions to original reporting. Source: AAR Weekly Railroad Traffic % Change in Canadian Intermodal Traffic From Same Quarter Previous Year: Q Q % Data are based on originations, include CN and CP (including their U.S. operations), and reflect revisions to original reporting. Source: AAR Weekly Railroad Traffic Rail Time Indicators January 6, 2012 Page 9 of 33
12 COAL U.S. rail carloads of coal totaled 6.75 million in, up 0.3% (18,725 carloads) over and up 1. (98,235 carloads) over. In past editions of RTI, we ve pointed out that the coal share of U.S. electricity generation has been trending down in recent years and is now around 4. There are several reasons for this, but perhaps the most important is the big decline in natural gas prices for electricity generators see the chart on the bottom right as improved drilling techniques have unlocked huge new natural gas supplies in North Dakota and elsewhere. 160, , , , , ,000 Average Weekly U.S. Rail Carloads of Coal 2007 (peak year) Data are weekly average originations for each month, are not seasonally adjusted, exclude U.S. operations of CN and CP, and reflect revisions to original reporting. Source: AAR % Change in U.S. Rail Carloads of Coal From Same Month Previous Year: Jan Dec December was up 5.7% over December and up 15.3% over December Data are based on originations, are not seasonally adjusted, exclude U.S. operations of CN and CP, and reflect revisions to original reporting. Source: AAR Weekly Railroad Traffic 10,000 9,000 8,000 7,000 6,000 5,000 4,000 Avg. Weekly Canadian Rail Carloads of Coal 2007 Data are weekly average originations for each month, are not seasonally adjusted, include CN and CP (including their U.S. operations), and reflect revisions to original reporting. Source: AAR % Change in Canadian Carloads of Coal From Same Month Previous Year: Jan Dec December was up 9.2% over December and up 30.6% over December Data are weekly average originations for each month, include CN and CP (including their U.S. operations), and reflect revisions to original reporting. Source: AAR Weekly Railroad Traffic Bars = actual Red line = adjusted* U.S. Rail Carloads of Coal (Millions) Average Delivered Price of Fuel for the U.S. Electric Power Industry: Jan Oct. (Dollars Per Million Btu) $14 $12 $10 $8 $6 $4 Natural gas '88 '91 '93 '95 '97 '99 '01 '03 '05 '07 '09 '11 *Estimate of -equivalent carloads based on the fact that an average carload today carries more coal than an average carload in the past. Source: AAR Weekly Railroad Traffic $2 $0 Coal Source: Energy Information Administration Rail Time Indicators January 6, 2012 Page 10 of 33
13 CHEMICALS U.S. railroads originated 1.55 million carloads of chemicals in, up 3.4% (50,721 carloads) over, up 13.3% (182,312 carloads) over, and the second highest annual total ever (6,296 carloads fewer than 2007 s 1.55 million see the chart on the bottom right). Still, it wasn t a terribly auspicious end for the year year-over-year U.S. carloads of chemicals grew by progressively smaller amounts as the year went on, including just 1. in the fourth quarter (see bottom left chart below). Canadian rail carloads of chemicals actually fell 2.3% in the fourth quarter of. 33,000 32,000 31,000 30,000 29,000 28,000 27,000 26,000 25,000 24,000 23,000 22,000 Avg. Weekly U.S. Rail Carloads of Chemicals 2007 (peak year) Data are weekly average originations for each month, are not seasonally adjusted, exclude U.S. operations of CN and CP, and reflect revisions to original reporting. Source: AAR % Change in U.S. Rail Carloads of Chemicals From Same Month Previous Year: Jan Dec December was up 2.2% over December and up 14.3% over December Data are based on originations, are not seasonally adjusted, exclude U.S. operations of CN and CP, and reflect revisions to original reporting. Source: AAR Weekly Railroad Traffic Avg. Weekly Canadian Rail Carloads of Chemicals 13,000 12,000 11,000 10,000 9,000 8,000 7,000 6,000 Data are weekly average originations for each month, are not seasonally adjusted, include CN and CP (including their U.S. operations), and reflect revisions to original reporting. Due to data revisions, data prior to are not available. Source: AAR % Change in Canadian Carloads of Chemicals From Same Month Previous Year: Jan. - Dec December was down 2. from December and up 23.8% over December. Data are based on originations, are not seasonally adjusted, include CN and CP (including their U.S. operations), and reflect revisions to original reporting. Due to comparability issues, data prior to are not available. Source: AAR Weekly Railroad Traffic % Change in U.S. Rail Carloads of Chemicals From Same Quarter Previous Year: Q Q Data are based on originations, are not seasonally adjusted, exclude U.S. operations of CN and CP, and reflect revisions to original reporting. Source: AAR Weekly Railroad Traffic U.S. Rail Carloads of Chemicals (Millions) '88 '91 '93 '95 '97 '99 '01 '03 '05 '07 '09 '11 Source: AAR Weekly Railroad Traffic Rail Time Indicators January 6, 2012 Page 11 of 33
14 GRAIN U.S. + Canadian grain carloads totaled 1.6 million in, down 2.4% (39,673 carloads) from and up 4.8% (72,287 carloads) over. Last month we noted that the USDA expects U.S. grain exports to fall in the /12 crop year that began in September. The chart on the bottom right shows recent USDA grain export projections compared with actual exports in recent years. If lower exports come to pass, they will be a severe headwind for U.S. rail grain totals. Tougher competition from grain producers in other countries is a big reason for the expected export decline. Australia, for example, is a major grain exporter and just had a bumper grain harvest. 28,000 26,000 24,000 22,000 20,000 18,000 16,000 Average Weekly U.S. Rail Carloads of Grain 2007 Data are weekly average originations for each month, are not seasonally adjusted, exclude U.S. operations of CN and CP, and reflect revisions to original reporting. Source: AAR % Change in U.S. Rail Carloads of Grain From Same Month Previous Year: Jan Dec December was down 4.3% from December and up 6. over December Data are based on originations, are not seasonally adjusted, exclude U.S. operations of CN and CP, and reflect revisions to original reporting. Source: AAR Weekly Railroad Traffic Average Weekly Canadian Rail Carloads of Grain 12,000 11,000 % Change in Canadian Carloads of Grain From Same Month Previous Year: Jan Dec. 3 2 December was up 10.8% over December and up 16.3% over December. 10, ,000 8, ,000 Data are weekly average originations for each month, are not seasonally adjusted, include CN and CP (including their U.S. operations), and reflect revisions to original reporting. Source: AAR Data are weekly average originations for each month, include CN and CP (including their U.S. operations), and reflect revisions to original reporting. Source: AAR Weekly Railroad Traffic 1.8 U.S. + Canadian Rail Carloads of Grain (Millions) 3,000 U.S. Grain Exports: 2007-* (Millions of Bushels) 1.7 2, , , , '96 '97 '98 '99 '00 '01 '02 '03 '04 '05 '06 '07 '08 '09 '10 '11 Note: grain carried in containers is not reflected in this chart. Source: AAR Weekly Railroad /08 /09 /10 /11 / /08 /09 Corn Wheat Soybeans *Crop years beginning in September ; is preliminary and is a USDA estimate. Source: USDA Economic Research Service /10 /11 / /08 /09 /10 /11 /12 Rail Time Indicators January 6, 2012 Page 12 of 33
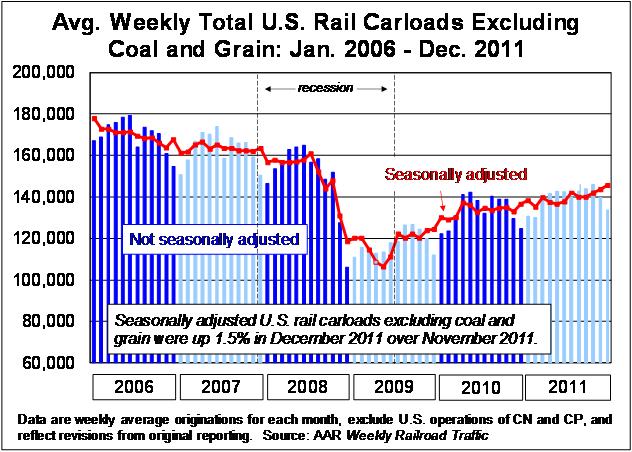
15 CARLOAD AND INTERMODAL TOTALS 375, , , , , , , , , ,000 U.S. Rail Carload Traffic: Jan Dec Data are weekly average originations for each month, are not seasonally adjusted, and exclude U.S. operations of CN and CP. Source: AAR Weekly Railroad Traffic U.S. Rail Intermodal Traffic: Jan Dec. 275, , , , , , , , Data are weekly average originations for each month, are not seasonally adjusted, and exclude U.S. operations of CN and CP. Source: AAR Weekly Railroad Traffic ALL COMMODITIES EXCLUDING COAL 210, , , , , , , , , , ,000 Average Weekly U.S. Rail Carloads: All Commodities Excluding Coal 2006 (peak year) Data are weekly average originations for each month, are not seasonally adjusted, exclude U.S. operations of CN and CP, and reflect revisions to original reporting. Source: AAR % Change in U.S. Rail Carloads Excluding Coal From Same Month Previous Year: Jan Dec December was up 8.7% over December and up 21.4% over December Data are based on originations, are not seasonally adjusted, exclude U.S. operations of CN and CP, and reflect revisions to original reporting. Source: AAR Weekly Railroad Traffic ALL COMMODITIES EXCLUDING COAL AND GRAIN 200, , , , , , , , , , ,000 Average Weekly U.S. Rail Carloads: All Commodities Excluding Coal and Grain 2006 (peak year) Data are weekly average originations for each month, are not seasonally adjusted, exclude U.S. operations of CN and CP, and reflect revisions to original reporting. Source: AAR % Change in U.S. Rail Carloads Excl. Coal and Grain From Same Month Prev. Year: Jan Dec December was up 11.1% over December and up 24.3% over December Data are based on originations, are not seasonally adjusted, exclude U.S. operations of CN and CP, and reflect revisions to original reporting. Source: AAR Weekly Railroad Traffic Rail Time Indicators January 6, 2012 Page 13 of 33
16 INDUSTRIAL PRODUCTS Avg. Weekly U.S. Rail Carloads: Industrial Products* 130, , , ,000 90,000 80,000 70,000 60, (peak year) *Data include chemicals; paper; metal products; autos; crushed stone and gravel; metallic ores; and stone and glass products. Data are weekly average originations for each month and exclude the U.S. operations of CN and CP. Source: AAR Weekly Railroad Traffic % Change in U.S. Rail Carloads of Industrial Products From Same Month Prev. Year: Jan Dec. * December was up 13.2% over December and up 30.4% over December *Data include chemicals; paper; metal products; autos; crushed stone and gravel; metallic ores; and stone and glass products. Data are weekly average originations for each month and exclude the U.S. operations of CN and CP. Source: AAR Weekly Railroad Traffic PRIMARY METAL PRODUCTS (MAINLY IRON AND STEEL) 14,000 12,000 10,000 8,000 6,000 4,000 2,000 Average Weekly U.S. Rail Carloads of Steel and Other Primary Metal Products 2007 Data are weekly average originations for each month, are not seasonally adjusted, exclude U.S. operations of CN and CP, and reflect revisions to original reporting. Source: AAR % Change in U.S. Rail Carloads of Steel and Other Primary Metal Products From Same Month Previous Year: Jan Dec. December was up 16.7% over December and up 45.6% over December Data are based on originations, are not seasonally adjusted, exclude U.S. operations of CN and CP, and reflect revisions to original reporting. Source: AAR Weekly Railroad Traffic IRON AND STEEL SCRAP 7,000 6,000 5,000 4,000 3,000 2,000 Average Weekly U.S. Rail Carloads of Iron and Steel Scrap Data are weekly average originations for each month, are not seasonally adjusted, and exclude U.S. operations of CN and CP. Data prior to are not available. Source: AAR % Change in U.S. Rail Carloads of Iron and Steel Scrap From Same Month Previous Year: Jan. - Dec. December was down 0.3% from December and up 24.2% over December. Data are based on originations, are not seasonally adjusted and exclude U.S. operations of CN and CP. Data prior to are not available. Source: AAR Weekly Railroad Traffic Rail Time Indicators January 6, 2012 Page 14 of 33
17 PETROLEUM & PETROLEUM PRODUCTS (LPGs, ASPHALT, FUEL OIL, LUBRICATING OILS, ETC.) 8,000 7,500 7,000 6,500 6,000 5,500 5,000 Average Weekly U.S. Rail Carloads of Petroleum and Petroleum Products Data are weekly average originations for each month, are not seasonally adjusted, and exclude U.S. operations of CN and CP. Data prior to are not available. Source: AAR % Change in U.S. Rail Carloads of Petroleum and Petroleum Products From Same Month Previous Year: Jan. - Dec December was up 22.7% -1 over December and up % over December. -2 Data are based on originations, are not seasonally adjusted and exclude U.S. operations of CN and CP. Data prior to are not available. Source: AAR Weekly Railroad Traffic CRUSHED STONE, SAND, AND GRAVEL 28,000 26,000 24,000 22,000 20,000 18,000 16,000 14,000 12,000 10,000 8,000 Average Weekly U.S. Rail Carloads of Crushed Stone, Sand, and Gravel 2006 (peak year) Data are weekly average originations for each month, are not seasonally adjusted, exclude U.S. operations of CN and CP, and reflect revisions to original reporting. Source: AAR % Change in U.S. Rail Carloads of Crushed Stone, Sand, and Gravel From Same Month Previous Year: Jan Dec December was up 32.8% over December and up 58.7% over December Data are based on originations, are not seasonally adjusted, exclude U.S. operations of CN and CP, and reflect revisions to original reporting. Source: AAR Weekly Railroad Traffic MOTOR VEHICLES AND PARTS Combined U.S. + Canadian Average Weekly Rail Carloads of Motor Vehicles* 35,000 32,000 29,000 26,000 23,000 20,000 17,000 14,000 11,000 8, *Includes parts. Data are weekly average originations for each month, are not seasonally adjusted, and reflect revisions to original reporting. Source: AAR Weekly Railroad Traffic % Change in Combined U.S. + Canadian Rail Carloads of Motor Vehicles* From Same Month Previous Year: Jan Dec December was up 22. over December and up 20.1% over December *Includes parts. Data are weekly average originations for each month, are not seasonally adjusted, and reflect revisions to original reporting. Source: AAR Weekly Railroad Traffic Rail Time Indicators January 6, 2012 Page 15 of 33
18 METALLIC ORES (OVERWHELMINGLY IRON ORE) 26,000 24,000 22,000 20,000 18,000 16,000 14,000 12,000 10,000 8,000 6,000 4,000 Combined U.S. + Canadian Avg. Weekly Rail Carloads of Metallic Ores 2007 Data are weekly average originations for each month, are not seasonally adjusted, and reflect revisions to original reporting. Source: AAR Weekly Railroad Traffic % Change in Combined U.S. + Canadian Rail Carloads of Metallic Ores From Same Month Previous Year: Jan Dec December was up 11.9% over December and up 25. over December Data are weekly average originations for each month, are not seasonally adjusted, and reflect revisions to original reporting. Source: AAR Weekly Railroad Traffic LUMBER AND WOOD PRODUCTS + PRIMARY FOREST PRODUCTS Combined U.S. + Canadian Average Weekly Rail Carloads of Lumber and Primary Forest Products 16,000 14,000 12,000 10,000 8,000 6,000 4, Data are weekly average originations for each month, are not seasonally adjusted, and reflect revisions to original reporting. Source: AAR Weekly Railroad Traffic % Change in Combined U.S. + Canadian Rail Carloads of Lumber and Primary Forest Products From Same Month Previous Year: Jan Dec December was up 12. over December and up 34.3% over December Data are weekly average originations for each month, are not seasonally adjusted, and reflect revisions to original reporting. Source: AAR Weekly Railroad Traffic PULP AND PAPER PRODUCTS 14,000 13,000 12,000 11,000 10,000 9,000 8,000 Combined U.S. + Canadian Average Weekly Rail Carloads of Pulp and Paper Products 2007 Data are weekly average originations for each month, are not seasonally adjusted, and reflect revisions to original reporting. Source: AAR Weekly Railroad Traffic % Change in Combined U.S. + Canadian Rail Carloads of Pulp and Paper Products From Same Month Previous Year: Jan Dec December was down 2.7% -2 from December and up over December Data are weekly average originations for each month, are not seasonally adjusted, and reflect revisions to original reporting. Source: AAR Weekly Railroad Traffic Rail Time Indicators January 6, 2012 Page 16 of 33
19 SEASONALLY ADJUSTED RAIL TRAFFIC Rail Time Indicators January 6, 2012 Page 17 of 33


20 SEASONALLY ADJUSTED RAIL TRAFFIC, cont. Where to go for more information: Weekly AAR press releases on railroad traffic are available on the AAR web site here. For a sample copy of an AAR Weekly Railroad Traffic report, Paul Posey at pposey@aar.org. Weekly Railroad Traffic is free to AAR members and available by subscription to others. Rail Time Indicators January 6, 2012 Page 18 of 33
21 GROSS DOMESTIC PRODUCT (GDP) What is it and why is it important? GDP (the output of goods and services produced by labor and property in a country) measures the size of an economy and how fast it s growing. Assuming it s measured accurately, it s probably the single most conclusive piece of information on the health of an economy. The GDP figure that gets all the press is the annualized percentage change in inflation-adjusted GDP from one quarter to the next. It is revised several times as better data become available. GDP and freight rail traffic have historically been closely correlated, although rail freight traffic tends to be much more volatile than the economy as a whole. The chart at right shows the percentage change in rail traffic versus year-over-year (note: not quarter to quarter) real GDP growth. The correlation isn t perfect, but it is strong and positive. What are the latest numbers? On December 22, the BEA revised its estimate of Q3 U.S. GDP growth down to 1.8% from November s estimate of 2., which itself was a downward revision of the original October estimate of 2.. In mid-december, the Associated Press (AP) asked three dozen top economists for their views on U.S. economic growth in The consensus was that U.S. GDP would grow 2.4% in 2012, up slightly from what will probably turn out to be around 2. growth in. The AP consensus is consistent with the 2.3% consensus forecast for 2012 GDP from the most recent monthly survey (from early December) of 50 prominent economists by The Wall Street Journal. What are the biggest risks to the U.S. Source: Bureau of Economic Analysis, Wall Street Journal forecasters economy? They include the possibility (some say certainty) of a severe recession in Europe; the effects of a slowdown in growth in China and elsewhere in Asia; potential retrenchment in U.S. consumer spending due to flat income growth, continued high unemployment, and a desire to shore up household balance sheets; and potential problems in the Middle East (as we write this, there is saber rattling going on in Iran, for example) that could provide a severe negative shock to oil markets. You can probably think of many other potential risks. Where to go for more information: 2 16% 12% 8% 4% -4% -8% -12% -16% -2-24% % Change in U.S. GDP vs. Rail Traffic bars = GDP line = rail traffic '01 '02 '03 '04 '05 '06 '07 '08 '09 '10 '11 Percentages are year-over-year. Traffic = carloads + intermodal 6% 4% 2% -2% -4% -6% -8% -1 Source: BEA, AAR Quarterly Real U.S. GDP Growth: Q Q (annualized % change from previous quarter) Estimates for Q4 to Q are the consensus forecast by around 50 leading economists surveyed by The Wall Street Journal in early December The most recent BEA news release on GDP, including links to detailed data tables, is here. BEA will release its first estimate of fourth quarter GDP growth on January 27. Actual Forecast 2012 Rail Time Indicators January 6, 2012 Page 19 of 33
22 PURCHASING MANAGERS INDEX (PMI) and NON-MANUFACTURING INDEX (NMI) What is it and why is it important? The PMI is released by the Institute for Supply Management (ISM formerly the National Association of Purchasing Managers) and combines data on new orders, inventory, production, supplier deliveries, and employment. It is based on a survey of several hundred supply managers at manufacturers throughout the country and is considered an indicator both of actual on-the-ground conditions as well as near- to medium-term sentiment. The NMI is like the PMI, except that it tracks services. Manufacturing accounts for around 12% of U.S. GDP not as much as it used to, but the U.S. is still by far the world s top manufacturer. Much of what railroads haul, of course, consists of raw materials for manufacturing or finished manufactured goods. Services account for around twothirds of U.S. GDP and around 8 of private-sector employment. According to the ISM, a PMI > 50 indicates that overall manufacturing is generally expanding; a PMI < 50 indicates manufacturing is generally contracting. Likewise, an NMI < 50 indicates the services sector overall is contracting; an NMI > 50 indicates the service sector is expanding. What are the latest numbers? The PMI rose to 53.9 in December, up from 52.7 in November and the highest it s been since July. The new orders component of PMI also rose, to 57.6 in December from 56.7 in November (see chart below left). The PMI for December indicates that ground lost in the summer has been largely regained, and there s now a bit of breathing room between where the PMI currently stands and the 50 level that signifies a contraction in manufacturing. That said, the PMI remains well below where it was in early and where it was a year ago (58.5). What the ISM said about the December PMI: Manufacturing is finishing out the year on a positive note, with new orders, production and employment all growing in December at faster rates than in November, and with an optimistic view toward the beginning of 2012 as reflected by the panel in this month's survey Purchasing Managers Index (PMI): Jan Dec. Overall PMI (> 50 = manuf. is expanding) (< 50 = manuf. is contracting) recession New orders Non-Manufacturing Index (NMI): Jan. - Dec. New orders component Overall NMI (> 50 = non-manuf. is expanding) (< 50 = non-manuf. is contracting) Data are seasonally adjusted. Source: Institute for Supply Management Data are seasonally adjusted. Source: Institute for Supply Management The NMI rose to 52.6 in December from 52.0 in November (see the chart above right), almost recovering to October s level. The new orders component of the NMI rose to 53.2 in December from 53.0 in November. Like the PMI, the NMI at the end of the year was significantly lower than it was at the beginning of the year. Where to go for more information: The ISM s press release on the December PMI is here; January s PMI will be released February 1. The press release on the December NMI is here; January s NMI will be released February 3. Rail Time Indicators January 6, 2012 Page 20 of 33
23 MANUFACTURING INVENTORIES AND SALES What is it and why is it important? Firms don t want to hold too much inventory because it costs money to store and it can become obsolete or spoil. Plus, inventory earns no return on investment. But firms don t want too little inventory either, or they could lose sales. Like Goldilocks, they want inventory that s just right. When sales fall, inventories must rise if production is kept at the same pace. Eventually, when inventories are too high, destocking occurs via production cuts. This leads to job losses, fewer raw material purchases, and other negative economy-wide effects. When sales rise, either inventories must fall, production must increase, or both. Eventually, inventories become too low and restocking occurs via production increases. This means more employment, more raw material purchases, and other positive economy-wide effects. What are the latest numbers? According to the Census Bureau, manufacturing sales were essentially flat in November compared with October. Meanwhile, manufacturing inventories rose 0. ($2.8 billion) in November. The resulting inventory-sales ratio for manufacturing rose 0.4% in November, reaching its highest level since October (see chart top right). The gap between sales and inventory rose too, continuing the trend it s been on for two years (see chart lower left). The Census Bureau releases data on manufacturing new orders at the same time it releases data on inventories and sales. The dashed line in the chart on the top left below shows that manufacturing new orders closely track sales. New orders rose 1.8% ($8.2 billion) in November following declines in September and October. Manufact. Sales & Inventories: Jan ($ Billions) $625 recession $600 $575 $550 $525 $500 $475 New orders Manufacturing inventories $450 $425 $400 $375 Manufacturing sales $350 $ Data are seasonally-adjusted but not adjusted for inflation. Source: Census Bureau Inventory-Sales Ratio for Manufacturing: Jan recession Data are seasonally-adjusted. Source: Census Bureau = 1.34, highest since Oct. $200 $180 $160 $140 $120 $100 $80 $60 $40 $20 $0 Gap Between Manufacturing Inventories and Manufacturing Sales: Jan ($ Billions) recession Inventory-Sales Ratio: Manufacturing vs. Retail vs. Wholesalers Jan Oct. Retail Wholesalers Total recession Manufacturing Data are seasonally-adjusted. Source: Census Bureau Data are seasonally adjusted. Source: Census Bureau Rail Time Indicators January 6, 2012 Page 21 of 33
24 The inventory-sales ratio for manufacturing remains much higher than it was in 2007 and. The chart on the bottom right of the previous page shows that the same ratio for retailers is trending down and is far below where it was in 2007 and, as retailers adopt a once burned, twice shy mentality. Where to go for more information: The Census Bureau s report on manufacturing sales and inventories in November is here. Figures for December will be released on February 3, INDUSTRIAL PRODUCTION What is it and why is it important? Industrial production figures are based on the monthly raw volume of goods produced by U.S. industrial firms such as factories, mines, and electric utilities. Data are obtained from a variety of government and industry sources. Manufacturing accounts for about 7 of industrial production, but utility and mine output are key components as well. The industrial sector typically exhibits the most volatility in output during a business cycle. Large changes in industrial output can mean that a business cycle has reached an inflection point. What are the latest numbers? U.S. industrial production unexpectedly fell 0.2% in November from October, the first real decline in seven months. (Technically, it fell 0.004% in September, but that doesn t count as a real decline.) The manufacturing component of industrial production fell 0.3% in November, its first decrease after six straight monthly increases (see chart below right). 2% 1% -1% -2% -3% -4% Overall U.S. Industrial Production: % Change From Previous Month Jan hurricanes recession Oct. to : -0.2% Manufacturing Component of Industrial Production: % Change From Previous Month Jan % 1% -1% -2% -3% recession Oct. to : -0.3% % Data are seasonally adjusted. Source: Federal Reserve Data are seasonally adjusted. Source: Federal Reserve The top chart on the next page shows changes in industrial production in November for several key industrial sectors. Increases for iron and steel products (4.2%), railroad rolling stock (6.8%), and paper (1.1%) were offset by declines in motor vehicles (-3.4%), wood products (-1.7%), and consumer durables (-1.4%). 1 Manufacturing excluding motor vehicles and parts fell 0.2% in November. Industrial production has clearly been trending up, albeit slowly, for many months (see bottom charts on the next page), and there s no clear reason at this point to think November s decline is an inflection point signaling darker days ahead. That s especially so in light of other more positive 1 A broad category of long-lasting things like washing machines and other appliances, home electronics, cars, and furniture. Durable goods usually have long periods between successive purchases. Rail Time Indicators January 6, 2012 Page 22 of 33
25 indicators such as the improvement in the ISM s purchasing manager s index in November and December (see page 20) and the improvement in new orders for manufacturing (see page 21). That said, no one should think that the U.S. economy is growing so fast that there won t be some fits and starts in industrial expansion, and slowing economic growth abroad is sure to have some effect on U.S. producers. The bottom line is that industrial production is worth keeping a close eye on Total IP Total mfg. Iron & steel U.S. Industrial Production: Jan. - (Dec = 100) Where each sector was at start of recession : -0.2% : -0.3% : +4.2% : -1.7% Wood products : -3.4% Motor vehicles : +1.1% Paper : -0.9% : -1.4% Chemicals Consumer durables % shown is the change from the previous month. Data are seasonally adjusted. Source: Federal Reserve : +6.8% RR rolling stock U.S. Industrial Production: Jan (Index January 2006 = 100) Overall Total industrial production was down 0.2% in ; manufacturing was down 0.3%. recession Data are seasonally adjusted. Source: Federal Reserve Manufacturing U.S. Industrial Production: % Change From Prev. Year Jan recession Data are seasonally adjusted. Source: Federal Reserve to : +3.7% Where to go for more information: The Federal Reserve release on industrial production in November is here. December data will be released on January 18. CAPACITY UTILIZATION What is it and why is it important? Capacity utilization attempts to capture the concept of sustainable maximum output i.e., the highest output a plant can maintain assuming a realistic work schedule, normal downtime, and Rail Time Indicators January 6, 2012 Page 23 of 33
26 sufficient availability of inputs to operate the capital in place. The data cover manufacturing, mining, and electric and gas utilities. In theory, a capacity utilization rate of, say, 7 means there is room to increase production up to 10 without having to build new plants or add equipment. In practice, capacity utilization rates (at least on an economy-wide basis) never come close to 10. Utilization levels above 82%- 8 are generally considered "tight" and portend price increases or supply shortages in the near future. The farther below this level, the more slack there is in the economy or particular sector. Firms in every industry walk a tightrope when it comes to capacity. If they take too long to bring back idled capacity or build new capacity, they risk shortages and lost sales. Or, they could face higher costs in other areas (e.g., higher overtime costs). On the other hand, adding capacity that ends up not being used adds costs with no offsetting returns. What are the latest numbers? Overall U.S. capacity utilization fell 0.2 percentage points in November to 77.8% from 78. in October, the second decline in three months (see chart below right). Capacity utilization was 75.8% in November. Capacity utilization for manufacturing fell to 75.8% in November from 76.1% in October ; it was 73.4% in November. The chart on the bottom below shows how capacity utilization has changed for several key sectors in the first 11 months of. Note the big increase in capacity utilization for iron and steel products in November and the big decline for motor vehicles and parts U.S. Capacity Utilization: Jan Manufacturing Overall Overall capacity utilization was down 0.2 percentage points in November to 77.8%. recession Data are seasonally adjusted. Source: Federal Reserve % Point Change in Total U.S. Capacity Utilization From Previous Month: Jan hurricanes recession Data are seasonally adjusted. Source: Federal Reserve : -0.2 percentage points 9 Capacity Utilization: January - November : -0.2% : -0.3% : -0.7% : -2.4% Total IP Total mfg. Chemicals Motor vehicles : +3.4% : +1. : -0.9% Iron & steel Paper Wood products : +0.1% Utilities Note: Data are percentage point changes from prior month. Data are seasonally adjusted. Source: Federal Reserve : -1.1% Coal mining Rail Time Indicators January 6, 2012 Page 24 of 33

27 Where to go for more information: The Federal Reserve release on capacity utilization in November is here. December data will be released on January 18. NUMBER OF EMPLOYED PERSONS AND UNEMPLOYMENT RATE What is it and why is it important? Released by the U.S. Bureau of Labor Statistics, the figures provide a snapshot of the strength of the U.S. labor market. Because of their visibility and political importance, they are probably the single most anticipated and widely publicized economic indicators in the world. They are based on two separate surveys: 1) an establishment survey of more than 400,000 businesses, and 2) a household survey of 60,000 households. Among other things, the net number of jobs gained or lost in a given month and the employment by industry figures come from the survey of businesses. The unemployment rate, the size of the labor force, and the labor force participation rate, among other data, come from the household survey. The two different surveys sometimes produce puzzling results. For example, in the same month there can be a sharp drop in the unemployment rate (household survey) without many new jobs created (establishment survey). In the United States, a gain of 150,000 or more jobs from one month to the next is generally considered solid job growth. (Average monthly U.S. job growth from September 2003 through December 2007 was 157,000 jobs.) Job growth of 100, ,000 is needed just to keep up with the typical growth in the labor force from one month to the next. Employment is often considered a lagging indicator because employers often decide to wait until they re sure an economic recovery is here to stay before making new permanent hires. In the meantime, they might rely on more hours for existing workers or on temporary workers. Weak job numbers cause even the still-employed to become less confident of the future, and, therefore, less prone to spend money (see Consumer Confidence and Retail Sales below). What are the latest numbers? 200,000 net new jobs were created in December, the fourth largest gain in. For all of, 1.6 million net new jobs were created, the most of any year since The official unemployment rate fell from 8.7% in November to 8. in December (see chart below right). U.S. Unemployment Rate: Jan Dec. * 12% 11% 1 9% 8% 7% 6% 4% The official U.S. unemployment rate fell to 8. in December from 8.7% in November. Men Women Overall 3% *Civilian labor force, seasonally adjusted. Source: Bureau of Labor Statistics Rail Time Indicators January 6, 2012 Page 25 of 33

28 A December 28 report in The Wall Street Journal points out that the bust in the housing market is constraining labor market mobility because workers who might otherwise move from places where jobs are scarce to places where jobs are more plentiful are finding it too difficult to sell their homes. The problem is especially acute for people who are underwater i.e., with houses worth less than the mortgage balance. Of course, the housing bust also directly means fewer construction workers (see chart below left). 700, , , , , , , , , , ,000 Weekly Initial Unemployment Claims: January December 400,000 is generally considered the threshold below which the economy is thought to be adding jobs at a decent pace. recession Figures are 4-week moving averages. Source: U.S. Department of Labor The chart above right shows that in recent weeks there has been a drop in initial unemployment claims, a good sign for labor markets especially when they drop below 400,000. Where to go for more information: The BLS press release on the December employment situation is here. Data for January will be released on February 3, CLASS I FREIGHT RAILROAD EMPLOYMENT What is it and why is it important? The data show the average number of Class I freight railroad employees at mid-month. As in other industries, employment in the rail industry is largely a function of the level of business, although there is also some seasonality to it. What are the latest numbers? Class I freight rail employment was down slightly (132 employees) in November from October, to 160,119. It s not unusual for rail employment to drop a bit at the end of the year for seasonal reasons. Employment in November was 5,077 (3.3%) higher than it was in November. Where to go for more information: The STB web site for railroad employment data is here. Class I Railroad Employment: Jan , , , , , , , ,000 Oct. to : Beginning in January, the bars in this chart are around 1,000 employees higher than in previous months due to the inclusion of employees from two large railroads acquired by a Class I railroad. Data are non-seasonally adjusted. Source: STB Rail Time Indicators January 6, 2012 Page 26 of 33
29 CONSUMER CONFIDENCE What is it and why is it important? The index, released by the Conference Board on the last Tuesday of the month, is based on surveys received from about 3,000 U.S. households. It is designed to gauge the financial health, spending power, and confidence of the average U.S. consumer. Respondents are asked about current conditions and their expectations for the next six months. The index is designed to predict future consumer spending, on the theory that the more confident consumers are about their job prospects, income, etc., the more likely they are to make purchases, especially big-ticket items. As David Wyss (the chief economist at Standard & Poor s) has said, A confident consumer buys a new car. A cautious consumer repairs the old one. Consumers psyches are most heavily influenced by economic factors, such as gas prices, the unemployment rate, and how much money they have to spend, but non-economic factors such as terrorist attacks, a military victory, or even a good performance at an international sporting event can come into play too. Because there is always going to be some noise and month-to-month volatility in consumer confidence, trends are more important than a single data point. What are the latest numbers? Consumer confidence rebounded sharply for the second straight month in December, rising to 64.5 from 55.2 in November and completing its recovery from the big late-summer decline (see chart at right). The index is now at its highest level since April (when it was 66.0) and slightly above where it was one year ago (63.4 in December ). Don t get carried away, though consumer confidence is still nowhere near where it needs to be to signal a healthy economy, and it s still not even back to its post-recession high of 72.0 from February. What the Conference Board said about the December index: [T]he Consumer Confidence Index is now back to levels seen last spring. Consumers assessment of current Index of Consumer Confidence: Jan Dec. (Index 1985 = 100) Source: Conference Board recession business and labor market conditions improved again. Looking ahead, consumers are more optimistic that business conditions, employment prospects, and their financial situations will continue to get better. While consumers are ending the year in a somewhat more upbeat mood, it is too soon to tell if this is a rebound from earlier declines or a sustainable shift in attitudes." Where to go for more information: The Conference Board s press release on December s consumer confidence index is here. January s consumer confidence index will be released on January 31. Rail Time Indicators January 6, 2012 Page 27 of 33
30 RETAIL SALES What is it and why is it important? The Census Bureau surveys 5,000 retailers of all types to track the dollar value of physical merchandise sold. The data are adjusted for holiday differences and seasonal variations but are not adjusted for inflation. Personal consumption accounts for approximately 7 of U.S. GDP. Thus, the health of the economy depends largely on how much people buy. What are the latest numbers? Retail sales in November rose 0.2% ($883 million) over October to $399.3 billion (see chart below left), the highest level ever. (The data are not adjusted for inflation.) Still, the 0.2% increase was less than the 0. or 0.6% increase most analysts were expecting. Most of the increase in November was due to non-store retailers (a proxy for Internet sales), which were up 1. ($521 million) for the month. Sales for motor vehicles and parts dealers were up 0. ($330 million) in November. Sales at grocery stores were down 0.3% ($143 million); sales at restaurants and other food and drinking places were down 0.3% ($106 million). $410 $400 $390 $380 $370 $360 $350 $340 $330 $320 $310 Total Retail Sales: Jan ($ billions) recession Data are seasonally adjusted but are not adjusted for inflation. Source: Census Bureau % Change in Total Retail Sales from Previous Month: Jan Up 0.2% in Data are seasonally adjusted but are not adjusted for inflation. Source: Census Bureau The chart at right is an update of a chart we last showed in August. It shows estimated mortgage and consumer debt as a percentage of disposable personal income. This Mortgage and Consumer Debt as a Percentage of percentage has been falling for Disposable Income: Q Q3 several years and by Q3 was 14. down to 11.1%, its lowest level since 14. the fourth quarter of To the extent consumers think they have 13. debt under control, they might be 13. more willing to increase their 12. spending, thereby boosting retail sales. The growth in retail sales for 12. the past few months suggests this 11. may now be happening. 11. Where to go for more information: The Census Bureau s press release covering November retail sales is here. December retail sales will be released on January Source: Federal Reserve Rail Time Indicators January 6, 2012 Page 28 of 33

31 NEW LIGHT VEHICLE SALES What is it and why is it important? Data cover U.S. sales of cars and light trucks, including pickups and SUVs. Over the past 50 years, spending on motor vehicles has accounted, on average, for about 3.7% of U.S. GDP. Monthly auto sales are often referred to in terms of seasonally-adjusted annualized rates (SAAR). In, 6% of U.S. Class I railroad gross revenue came from hauling autos and auto parts. What are the latest numbers? New light vehicle sales fell to 13.5 million on an annualized and seasonally-adjusted basis in December, a slight decline from 13.6 million units in November. New light vehicle sales in all of of 12.7 million (not seasonally adjusted) were up by 22% from the recession s low point in, but are still well short of the nearly 17 million sold annually in the years preceding the recession U.S. Light Vehicle Sales (millions) *Passenger cars, SUVs, minivans, and pickups. Source: AAR, BEA, NADA An article in The Wall Street Journal on December 21 st talked about how the strength of the yen against the dollar (see the chart at right) has made it very difficult for Japanese automakers to make money exporting cars to the United States. As a consequence, over the next few years some Japanese automakers are expected to sharply increase their North American production to replace exports from Japan. Clearly, rail auto traffic patterns would change if this happened. Yen-U.S. Dollar Exchange Rate*: Jan Dec. An article in The Washington Post on January 4 th reported that U.S. auto sales are projected to climb to somewhere between 13.5 million and 14 million units in *Yen per dollar. Source: Federal Reserve Board Analysts say, however, that production will not return to the pre-recession levels until Where to go for more information: BEA data on auto sales are here = dollar is getting stronger = dollar is getting weaker Rail Time Indicators January 6, 2012 Page 29 of 33
32 HOUSING STARTS What is it and why is it important? A housing start is beginning the foundation of a residential home. Historically, housing has directly accounted for around of the overall economy and has large spillover effects on other sectors (such as retail sales and manufacturing), since people buying new homes tend to spend on other goods such as furniture, lawn and garden supplies, and appliances. Since January 2006, single family homes have accounted for 79% of housing starts and multifamily buildings 21%. Housing starts, especially for multi-family buildings, often fluctuate considerably from month to month, so trends are more important than a particular point in time. In the past, housing starts have usually been considered a leading indicator because construction growth usually picks up at the beginning of a business cycle. However, factors in today s housing market including a huge oversupply of existing houses due to slow sales and widespread foreclosures means new construction is a big drag on the economy today. What are the latest numbers? One of the all-time great movies is a 1987 romantic comedy called The Princess Bride. In it, one of the characters says, Well, it just so happens that your friend here is only mostly dead. There's a big difference between mostly dead and all dead. For several years, it appeared that the housing sector was all dead, but it turns out that maybe it s just been mostly dead. Evidence for the fact that it may only be mostly dead is that housing starts totaled an annualized 685,000 in November. That s the highest monthly total since April (see chart below left), up 9.3% over October s 627,000, and the fifth year-over-year monthly increase in the past six months (see chart top left of the next page). 2,500 2,250 2,000 1,750 1,500 1,250 1, U.S. Housing Starts: Jan (Seasonally-Adjusted Annualized Rate, 000s) Multi-family units Source: Census Bureau Single- Multi- Family Family Total Oct. '11- '11 2.3% 32.2% 9.3% '10- ' % Total Single-family units % Change From Previous Month in U.S. Housing Starts: Jan Source: Census Bureau : +9.3% Of course, mostly dead is still not the preferred outcome housing starts are still ridiculously low. 30-year fixed mortgage rates recently fell to their lowest point ever, but that can t overcome all the other problems the sector is facing, including a huge supply of foreclosed and soon-to-be foreclosed homes and tremendous uncertainty regarding the entire housing finance system. Most of the increase in November was due to sharply higher starts for buildings with five or more units (i.e., apartment buildings and townhouses). They totaled an annualized 230,000 in November, their highest level since September and up 32.2% over October (see bottom line in the chart above left). Housing starts for single family homes in November Rail Time Indicators January 6, 2012 Page 30 of 33
. The chart above right shows the decline in the U.S.")
33 % Change in U.S. Housing Starts From the Same Month Previous Year: Jan Source: Census Bureau : +24.3% were 447,000, up a modest 2.3% over October s 437,000 but the highest of any month since June (see top line in the chart above left). The chart above right shows the decline in the U.S. homeownership rate over the past five years. (The 65.9% in Q2 was the lowest since Q ) As former homeowners have become renters due to foreclosures and other factors, the demand for rental units has increased and helps explain recent increases in housing starts for multifamily buildings. We last showed the chart below left five months ago. It shows the number of homes under construction i.e., houses started but not yet completed for the past several years. The figures for September, October, and November are all positive, meaning that more new homes were started those months than were completed. It s the first time that s happened for three consecutive months since November 2005 through January 2006 and constitutes more evidence that the housing sector has a pulse (albeit a weak one) after all. Month-To-Month Change in New Homes Under Construction: Jan ,000 20,000 10, ,000-20,000-30,000-40,000-50, Data are based on seasonally-adjusted numbers. Source: Census Bureau U.S. Housing Starts vs. U.S. + Canadian Rail Carloads of Lumber, Wood & Forest Products Housing starts (left scale, 000s) Rail carloads (right scale) correlation = 98% ,000 18,000 16,000 14,000 12,000 10,000 8,000 6,000 4,000 2,000 0 Data are not seasonally adjusted, are 3-month averages, and include Canadian railroads because much of the lumber consumed in the U.S. originates in Canada. Source: AAR, Census Bureau. The chart above right is a variation of one we show each month. The chart this month shows non-seasonally adjusted, 3-month moving average housing starts and rail carloads of lumber and wood products. Note the extremely strong positive correlation: rail carloads of lumber and wood products won t recover until the housing sector does. Where to go for more information: The Census Bureau s press release on housing starts in November is here. December data will be released on January 19. Rail Time Indicators January 6, 2012 Page 31 of 33
Rail Time Indicators A Review of Key Economic Trends Shaping Demand for Rail Transportation
 Rail Time Indicators A Review of Key Economic Trends Shaping Demand for Rail Transportation Policy & Economics Department Association of American Railroads Washington, D.C. May 4, Rail Time Indicators
Revenue Freight Traffic Statistics for the Major North American Railroads. Weekly Railroad Traffic
 Revenue Freight Traffic Statistics for the Major North American Railroads Weekly Railroad Traffic Week 26, Ended June 28, Notes 1. Traffic of Canadian railroads reflects their Canadian and U.S. operations,
Railroads - The Economy and Trade National Coal Transportation Association Denver, Colorado September 19, 2017
 Railroads - The Economy and Trade 2017 National Coal Transportation Association Denver, Colorado September 19, 2017 Railroads and the Economy 2017 SLIDE 2 Coal: 365,806 (14.1%) Railroads Help Keep Coal-
Evolution of Rail Related Energy Markets. The Energy Forum New York, NY March 18, 2013
 Evolution of Rail Related Energy Markets The Energy Forum New York, NY March 18, 2013 Assn. of American Railroads www.aar.org SLIDE 2 Integrated Rail Network U.S. freight rail network ~140,000 route-miles;
The U.S. Freight Railroad Industry. Ohio Conference on Freight Toledo, Ohio September 21, 2011
 The U.S. Freight Railroad Industry Ohio Conference on Freight Toledo, Ohio September 21, 2011 Assn. of American Railroads www.aar.org SLIDE 2 Integrated With Mexico and Canada ~140,000 route-miles in U.S.,
Norfolk Southern Corporation Weekly Merchandise, Intermodal and Coal/Coke Car loadings Week 26 (Q2) From: To:
 From: To:") Week 26 (Q2) From: 06-26-2016 To: 07-02-2016 Data Generated: Mon Jul 23 03:14:14 EST 2018 All Other Carloads 938 990 -(52) 12,491 13,115 -(624) 25,941 25,378 563 Chemicals 7,842 8,029 -(187) 101,625 104,399
Week 26 (Q2) From: 06-26-2016 To: 07-02-2016 Data Generated: Mon Jul 23 03:14:14 EST 2018 All Other Carloads 938 990 -(52) 12,491 13,115 -(624) 25,941 25,378 563 Chemicals 7,842 8,029 -(187) 101,625 104,399
The U.S. Freight Railroad Industry: Where We Are in Dan Keen Wichita Ad Valorem Conference July 31, 2018
 The U.S. Freight Railroad Industry: Where We Are in 2018 Dan Keen Wichita Ad Valorem Conference July 31, 2018 Topics For Today Background Current issues The future? Other \\aarfs2\communications\content
Railroads and Grain. Association of American Railroads June Summary
 s and Grain Association of American s June 2017 Summary s are critical to grain transportation. In 2016, U.S. Class I railroads originated 1.54 million carloads of grain (5.6 percent of total carloads)
Railroads and Grain. Association of American Railroads May Summary
 s and Grain Association of American s May 2018 Summary s are critical to grain transportation. In 2017, U.S. Class I railroads originated 1.46 million carloads of grain (5.1 percent of total carloads)
The Economics and Regulation of the Freight Rail Industry. Third Annual Colloquium. June 16, 2017
 The Economics and Regulation of the Freight Rail Industry Third Annual Colloquium June 16, 2017 Stage-Setting The Rail Industry and the Economy The Level of Rail Output Mix of Traffic Rail Employment Rail
National Conference of State Legislatures. Minneapolis, Minnesota August 20th, 2014
 National Conference of State Legislatures Minneapolis, Minnesota August 20th, 2014 Railroads Help Keep Coal- Based Electricity BNSF CN CP CSX FXE KCS/KCSM NS UP Other RRs Freight Railroads in North America
RAIL RENAISSANCE The Changing Dynamics of Freight Transportation. John Miller Group Vice President, Agricultural Products BNSF Railway
 RAIL RENAISSANCE The Changing Dynamics of Freight Transportation John Miller Group Vice President, Agricultural Products BNSF Railway 1 Railroads are the Backbone of America s Freight Transportation Nearly
Class I Railroad Statistics
 Class I Railroad Statistics Class I Railroads Class I Railroads are U.S. line haul freight railroads with operating revenue in excess of $266.7 million. Two Canadian railroads, Canadian National Railway
Infrastructure Framework
 Infrastructure Framework Infrastructure Impediment = Inefficiencies = Less Effective Transport Capacity = Higher Freight Rates = Lower Producer Returns = Lower Returns and Competitiveness = 2 Global Population
Overview of America s Freight Railroads
 Overview of America s Freight Railroads Association of American Railroads August 2017 Summary From one end of the country to the other, America is connected by the best freight rail system in the world.
RAILS AND RAIL OEMS A VIEW FROM THE STREET
 RAILS AND RAIL OEMS A VIEW FROM THE STREET Cowen Equity Research JULY 2018 Matt Elkott 646 562 1409 matthew.elkott@cowen.com The Current State of Rail The Terrific Trifecta 1. Robust traffic growth up
Prices Rise As Manufacturing Recovers
 Precision Machined Products Association Material Impacts On The Precision Machining Industry Prices Rise As Manufacturing Recovers August 2010 Executive Summary Quick Summary: The prices of all raw materials
Arkansas Transportation Report
 Arkansas Transportation Report February 2017 Arkansas River traffic up nearly 16% in 2016 Despite continued declines reported in iron and steel shipments, food and farm products and petroleum products,
TAPPI Shipping, Receiving & Warehousing Workshop
 TAPPI Shipping, Receiving & Warehousing Workshop Chip Davis CSX TRANSPORTATION APRIL 28, 2009 CSX TRANSPORTATION OVERVIEW The largest railroad in eastern North America Service area includes all major markets
Kentucky Transportation Conference January 22, 2015
 Kentucky Transportation Conference January 22, 2015 About GoRail National non-profit grassroots organization promoting the public benefits of rail We are: railroads, rail supply companies, local business,
RAIL COMMODITY FLOWS
 RAIL COMMODITY FLOWS. The major commodities handled by rail are bulk, with the exception of the automotive traffic. The following pages provide detailed information rail commodities in California, and
Monthly Report on the Corporate Goods Price Index ( Preliminary Figures for July 2013 )
") Research and Statistics Department Bank of Japan Report on the Corporate Goods Price Index The Domestic Corporate Goods Price Index rose 0.5 percent from the previous. The index excluding extra charges
Research and Statistics Department Bank of Japan Report on the Corporate Goods Price Index The Domestic Corporate Goods Price Index rose 0.5 percent from the previous. The index excluding extra charges
Railroad Performance: How good can it get?
 Railroad Performance: How good can it get? Quantifying the Opportunity Larry Shughart, Global Lead Transportation (352) 284 1250 For the last 10 years WorleyParsons analysts have maintained a model that
Darrell Wilson AVP Government Relations The Future of Freight Panel August 26 th, 2014
 Darrell Wilson AVP Government Relations The Future of Freight Panel August 26 th, 2014 Railroads - Safe & Getting Safer RR Safety Trends: 2000-2013* Train accident rate Employee injury rate Grade crossing
Fertilizer is a world market commodity, which means that supply
 Fertilizer supply Demand Supply demand, Energy Drive Global fertilizer prices The Fertilizer Institute Nourish, Replenish, Grow Fertilizer is a world market commodity necessary for the production of food,
Arkansas Transportation Report
 Arkansas Transportation Report January 2018 Arkansas River traffic up 3% in 2017 Despite a slow start in the spring, barge activity on the Arkansas River in 2017 reached its second-highest total in the
HKU announces 2016 Q3 HK Macroeconomic Forecast
 HKU announces 2016 Q3 HK Macroeconomic Forecast July 7, 2016 The of the Hong Kong Institute of Economics and Business Strategy at the University of Hong Kong (HKU) released its quarterly Hong Kong Macroeconomic
2012 Farm Outlook. Highlights
 2012 Farm Outlook Office of the Chief Economist USDA Highlights A promising spring planting was followed by historic drought. Record high commodity prices followed. Farm incomes are expected to be near
What Freight Flows tell us about the Economy?
 What Freight Flows tell us about the Economy? Donald Broughton Chief Market Strategist, Managing Director, Senior Equity Analyst September 11, 2012 I have often looked at that chair behind the President
Analyst: Meilin C. Pierce Spring Recommendation: Hold Target Stock Price (12/31/2016): $120
: $120") Recommendation: Hold Target Stock Price (12/31/2016): $120 1. Reasons for the Recommendation My recommendation is to hold Union Pacific Corporation (UNP) because my forecast shows that the stock is currently
Recommendation: Hold Target Stock Price (12/31/2016): $120 1. Reasons for the Recommendation My recommendation is to hold Union Pacific Corporation (UNP) because my forecast shows that the stock is currently
Feed Grain Outlook June 2, 2014 Volume 23, Number 33
 June 2, Today s Newsletter Market Situation Crop Progress 1 Corn Use 2 Outside Markets 3 Marketing Strategies Corn Marketing Plan 5 Upcoming Reports/Events 6 Market Situation Crop Progress. This afternoon
Dairy Outlook. January By Jim Dunn Professor of Agricultural Economics, Penn State University. Market Psychology
 Dairy Outlook January 2015 By Jim Dunn Professor of Agricultural Economics, Penn State University Market Psychology Dairy prices have fallen in the past month, especially butter prices. The dollar is still
Trends in the U.S. Rail Network. Mike McClellan Vice President Industrial Products Midwest Association of Rail Shippers July 15, 2014 Lake Geneva, WI
 Trends in the U.S. Rail Network Mike McClellan Vice President Industrial Products Midwest Association of Rail Shippers July 15, 2014 Lake Geneva, WI 1 The Dynamics in US Rail Freight Traffic The (Growing)
HKU announces 2017 Q4 HK Macroeconomic Forecast
 HKU announces 2017 Q4 HK Macroeconomic Forecast October 10, 2017 The of the Hong Kong Institute of Economics and Business Strategy at the University of Hong Kong (HKU) released its quarterly Hong Kong
Grain Market Outlook and Marketing Strategies
 Grain Market Outlook and Marketing Strategies Presented by: Brian Roach Dec 6 & 7, 2016 Roach Ag Marketing, Ltd. Disclaimer: Futures/options trading involves substantial risk of loss and trading may not
Agri-Service Industry Report
 Agri-Service Industry Report December 2016 Dan Hassler 2017 U.S. Industry Outlook A little better or a little worse is the quickest way to sum up the expectations for the agricultural equipment industry
March 2014 Manufacturing ISM Report On Business
 FOR RELEASE: April 1, 2014 Contact: Kristina Cahill Report On Business Analyst ISM, ROB Media Relations Tempe, Arizona 800/888-6276, Ext. 3015 E-mail: kcahill@ism.ws March 2014 Manufacturing ISM Report
FEDERAL RESERVE statistical release
 FEDERAL RESERVE statistical release G.17 (419) For release at 9:15 a.m. (EDT) August 17, 2017 INDUSTRIAL PRODUCTION AND CAPACITY UTILIZATION Industrial production rose 0.2 percent in July following an
Feed Grain Outlook June 26, 2018 Volume 27, Number 38
 Today s Newsletter Market Situation Crop Progress 1 Grain Use 4 Outside Markets 5 Marketing Strategies Seasonality 9 Market Situation Crop Progress. The corn crop condition index for June 25 (crop week
HKU announces 2018 Q1 HK Macroeconomic Forecast 1
 Q Q2 Q3 Q4 2Q 2Q2 2Q3 2Q4 3Q 3Q2 3Q3 3Q4 4Q 4Q2 4Q3 4Q4 5Q 5Q2 5Q3 5Q4 6Q 6Q2 6Q3 6Q4 7Q 7Q2 7Q3 7Q4 8Q year-on-year percentage HKU announces 208 Q HK Macroeconomic Forecast January 0, 208 The of the Hong
April 2015 Manufacturing ISM Report On Business
 FOR RELEASE: May 1, 2015 Contact: Kristina Cahill Report On Business Analyst ISM, ROB/Research Tempe, Arizona 800/888-6276, Ext. 3015 E-mail: kcahill@instituteforsupplymanagement.org April 2015 Manufacturing
February Crop Market Update Department of Economic Analysis
 Corn Price ($/bu) and Ethanol Price ($/gal) February 2011 - Crop Market Update Department of Economic Analysis In this edition: Energy Update: Matt Erickson, Economist Crop Update: Todd Davis, Senior Economist
National WIC Association
 National WIC Association Monthly Food Price Brief March 18, 2013 This monthly food price brief is designed to assist States in monitoring rising food costs by tracking the Consumer Price Index and average
Dairy Outlook. April By Jim Dunn Professor of Agricultural Economics, Penn State University. Market Psychology
 Dairy Outlook April 2017 By Jim Dunn Professor of Agricultural Economics, Penn State University Market Psychology The Class III price in March was $1.07 lower than in February, while the Class IV price
Rail Industry Overview and Trends
 Rail Industry Overview and Trends A Report to CSCMP 2006 Tom O Connor Snavely King Majoros O Connor & Lee 1111 14th St. NW Suite 300 Washington, DC 20005 Phone 202 371-9149 email skmoltom1@aol.com October
LAGGING EXPORTS SLIGHTLY NEGATIVE TO CORN PRICES
 November 5, 2001 Ames, Iowa Econ. Info. 1825 LAGGING EXPORTS SLIGHTLY NEGATIVE TO CORN PRICES While current utilization projections show record corn use for the year ahead, the slow start for corn export
Central Minnesota. Regional Freight Profile
 Central Minnesota Regional Freight Profile Working DRAFT May 21 Minnesota Department of Transportation The purpose of the Central Regional Freight Profile is to document freight movement trends in the
Arkansas Transportation Report
 Arkansas Transportation Report October 2017 Arkansas River traffic continues to make up ground Through the first eight months of 2017, barge activity on the Arkansas River continues to make up ground after
Janvier D. Nkurunziza, Commodities Branch, UNCTAD
 United Nations Conference on Trade and Development 10th MULTI-YEAR EXPERT MEETING ON COMMODITIES AND DEVELOPMENT 25-26 April 2018, Geneva Recent trends and outlook on commodity markets By Janvier D. Nkurunziza,
Nathan Kauffman Economist Federal Reserve Bank of Kansas City Omaha Branch August 21, 2013
 Nathan Kauffman Economist August 21, 213 The views expressed are those of the author and do not necessarily reflect the opinions of the Federal Reserve Bank of Kansas City or the Federal Reserve System.
FEDERAL RESERVE statistical release
 FEDERAL RESERVE statistical release G.17 (419) For release at 9:15 a.m. (EST) January 18, 2019 INDUSTRIAL PRODUCTION AND CAPACITY UTILIZATION Industrial production increased 0.3 percent in December after
March 2015 Manufacturing ISM Report On Business
 FOR RELEASE: April 1, 2015 Contact: Kristina Cahill Report On Business Analyst ISM, ROB/Research Tempe, Arizona 800/888-6276, Ext. 3015 E-mail: kcahill@ism.ws March 2015 Manufacturing ISM Report On Business
Signs align for corn profit hopes Short crop in Brazil could be fix the market needs By Bryce Knorr, senior grain market analyst
 Signs align for corn profit hopes Short crop in Brazil could be fix the market needs By Bryce Knorr, senior grain market analyst Corn growers enjoyed an outbreak of optimism last week at Commodity Classic
Cyclical Patterns of Railroad Freight Transportation in Russia
 CIRET Workshop, Zurich, October 2013 Session: Cyclical Patterns of Railroad Freight Transportation in Russia Sergey V. Smirnov Higher School of Economics, Development Center Institute. Moscow, Russia Abstract
Cautionary Information
 February 10, 2016 Stifel Nicolaus 2016 Transportation & Logistics Conference Rob Knight CFO 1 Cautionary Information This presentation and related materials contain statements about the Company s future
Dairy Outlook. October By Jim Dunn Professor of Agricultural Economics, Penn State University. Market Psychology
 Dairy Outlook October 2015 By Jim Dunn Professor of Agricultural Economics, Penn State University Market Psychology The world s financial markets were volatile again, last month but really d very little.
Agri-Service Industry Report
 Years Since Presidential Election 1950 1955 1960 1965 1970 1975 1980 1985 1990 1995 2000 2005 2010 2015 Billions Agri-Service Industry Report November 2016 Dan Hassler Farm Income and Presidential Elections
What are the risks? Crop Market Outlook
 What are the risks? 2012-13 Crop Market Outlook Frayne Olson, PhD Crop Economist/Marketing Specialist NDSU Extension Service ND Agricultural Experiment Station Dept. of Agribusiness & Applied Economics
Crop Market Outlook: Where do we go from here?
 2012-13 Crop Market Outlook: Where do we go from here? Frayne Olson, PhD Crop Economist/Marketing Specialist NDSU Extension Service ND Agricultural Experiment Station Dept. of Agribusiness & Applied Economics
SOUTH AMERICAN SOYBEAN CROP ESTIMATE INCREASED
 April 14, 2000 Ames, Iowa Econ. Info. 1787 SOUTH AMERICAN SOYBEAN CROP ESTIMATE INCREASED USDA s World Agricultural Outlook Board raised its estimate of combined Brazilian and Argentine soybean production
@IEG_Vantage #IMX2018
 @IEG_Vantage #IMX218 Charting the Course Informa Economics IEG Dry Commodity Trends Liquid Commodity Trends Questions and Answers IEG Services and Opportunities 2 Informa Economics IEG 3 4 Profile Approach
Ohio Maritime Study. Ohio Transportation Engineering Conference (OTEC) October 10, 2017 Columbus, OH
 October 10, 2017 Columbus, OH") Ohio Maritime Study Ohio Transportation Engineering Conference (OTEC) October 10, 2017 Columbus, OH Presentation Map Context the Great Lakes Region Ohio Maritime Transportation Study What Overview Comes
Ohio Maritime Study Ohio Transportation Engineering Conference (OTEC) October 10, 2017 Columbus, OH Presentation Map Context the Great Lakes Region Ohio Maritime Transportation Study What Overview Comes
Commodity Outlook: September 2017 West Central Illinois: July 2017
 Commodity Outlook: September 2017 West Central Illinois: July 2017 William George Senior Agriculture Economist U.S. Department of Agriculture Foreign Agriculture Service Office of Global Analysis Commodity
Appendix B. Commodity Flow Profile
 Appendix B 1.0 Introduction The overall goal of the Kansas Department of Transportation (KDOT) Statewide Freight Plan is to develop a set of infrastructure, operational, and institutional recommendations
AUGUST CLOSER LOOK SERIES: Open Top Hoppers SAMPLE
 AUGUST 217 1 AUGUST 217 The North American Open Top Hopper (OTH) fleet totaled x cars as of January 217, down from x in 213, a reduction. The Coal OTH fleet is the largest fleet segment, totaling x cars,
Dairy Outlook. June By Jim Dunn Professor of Agricultural Economics, Penn State University. Market Psychology
 Dairy Outlook June 2017 By Jim Dunn Professor of Agricultural Economics, Penn State University Market Psychology Cheese prices were up 15.9% in April over their values at the beginning of the month, despite
Monitoring the Canadian Grain Handling and Transportation System Grain Monitoring Program Report for: May 2018 Release Date: June 29, 2018
 Monitoring the Canadian Grain Handling and Transportation System Grain Monitoring Program Report for: May 218 Release Date: June 29, 218 GMP Dashboard Table M-1 APR 218 MAY 218 Canadian GHTS Performance
Dairy Outlook. March By Jim Dunn Professor of Agricultural Economics, Penn State University. Market Psychology
 Dairy Outlook March 2015 By Jim Dunn Professor of Agricultural Economics, Penn State University Market Psychology Cheese and butter prices have d slightly in the past month, while the powdered product
Hog:Corn Ratio What can we learn from the old school?
 October 16, 2006 Ames, Iowa Econ. Info. 1944 Hog:Corn Ratio What can we learn from the old school? Economists have studied the hog to corn ratio for over 100 years. This ratio is simply the live hog price
Genesee & Wyoming. September, Genesee & Wyoming Inc.
 Genesee & Wyoming September, 2015 1 Forward-Looking Statements This presentation contains forward-looking statements regarding future events and the future performance of that involve risks and uncertainties
Veal Price Forecast. October 2015
 Veal Price Forecast October 2015 VEAL PRICE FORECAST OCTOBER 2015 Veal Light Production Veal prices in 2015 have been stronger than anticipated and are expected to continue to show year-over-year increases
Chapter 5. Grain and Feed Loren W. Tauer, Professor
 Chapter 5. Loren W. Tauer, Professor The December 2014 Corn Futures Contract (CZ4) on the Chicago Board of Trade closed at $4.99 per bushel on May 1, 2014 when the new crop corn was beginning to be planted.
Short Term Energy Outlook March 2011 March 8, 2011 Release
 Short Term Energy Outlook March 2011 March 8, 2011 Release Highlights West Texas Intermediate (WTI) and other crude oil spot prices have risen about $15 per barrel since mid February partly in response
Commodity Market Outlook
 Commodity Market Outlook Jim Hilker Professor and MSU Extension Economist Department of Agricultural, Food, and Resource Economics Michigan State University Market Outlook Reports for January 6, 2017 (Written
85,500km. Second-longest rail track in the world accounting for nearly 87% of the country s freight turnover excluding pipelines
 STRATEGIC REPORT MARKET REVIEW Russia s rail network at a glance Russia and railways are inseparable; the rail network plays a key strategic role in connecting Russia s economy to world markets and linking
Railroads and Fertilizer
 Railroads and Fertilizer presented to The Fertilizer Institute and the Fertilizer Industry Round Table by Craig F. Rockey Vice President Policy an Economics Association of American Railroads October 26,
3/17/2016. Ross Pruitt Associate Professor. What is happening? What may happen? Economic/management considerations
 Ross Pruitt Associate Professor What is happening? What may happen? Economic/management considerations Mil. Head 40 JANUARY 1 COW INVENTORY U.S., Annual 35 30 25 2016 = 30.3 Million Head +3.5 Percent 20
SOYBEANS: LOW PRICES TO PERSIST
 SOYBEANS: LOW PRICES TO PERSIST JANUARY 2002 Darrel Good 2002 - NO. 2 Summary Soybean prices received some support from the USDA s January 11 final U.S. production estimate for the 2001 crop. At 2.891
Prospects for Corn Trade in 2018/19 and Beyond
 Prospects for Corn Trade in 2018/19 and Beyond Ben Brown Department of Agricultural, Environmental, and Development Economics The Ohio State University February 15, 2019 The agricultural industry is a
Minnesota Comprehensive Statewide Freight and Passenger Rail Plan
 Minnesota Comprehensive Statewide Freight and Passenger Rail Plan Freight Technical Advisory Committee August 13, 2009 presented by Cambridge Systematics, Inc. Kimley-Horn and Associates, Inc. TKDA, Inc.
Monthly Report on the Corporate Goods Price Index ( Preliminary Figures for January 2017 )
") Research and Statistics Department Bank of Japan Report on the Corporate Goods Price Index The Producer Price Index rose 0.6 percent from the previous. The Export Price Index (contract currency ) rose
Research and Statistics Department Bank of Japan Report on the Corporate Goods Price Index The Producer Price Index rose 0.6 percent from the previous. The Export Price Index (contract currency ) rose
MONTHLY FULL REPORT ON MANUFACTURERS SHIPMENTS, INVENTORIES AND ORDERS SEPTEMBER 2018
 FOR RELEASE AT 10:00 AM EDT, FRIDAY, NOVEMBER 2, 2018 MONTHLY FULL REPORT ON MANUFACTURERS SHIPMENTS, INVENTORIES AND ORDERS SEPTEMBER 2018 Release Number: CB 18 166 M3 2 (18) 09 November 2, 2018 The U.S.
The Outlook for the Swine Industry and Its Relationship with the Global Economy
 The Outlook for the Swine Industry and Its Relationship with the Global Economy Allen D. Leman Swine Conference September 19, 2011 Brian C. Briggeman Associate Professor and Director of the Arthur Capper
Can corn market think for itself? Fundamentals say prices should be higher By Bryce Knorr, senior grain market analyst
 Can corn market think for itself? Fundamentals say prices should be higher By Bryce Knorr, senior grain market analyst When supply and demand talk, markets are supposed to listen. But sometimes it can
Managing Change at G&W
 Managing Change at G&W Jack Hellmann, President & CEO Midwest Association of Rail Shippers July 12, 2016 1 Agenda 1.G&W Overview 2.Managing Change 3.Current Trends 2 Overview NYSE: Listed as GWR with ~$3.5
Iowa Farm Outlook. April 2015 Ames, Iowa Econ. Info March Hogs and Pigs Analysis
 Iowa Farm Outlook 0BDepartment of Economics April 2015 Ames, Iowa Econ. Info. 2060 March Hogs and Pigs Analysis The USDA March Hogs and Pigs report came in near trade expectations and indicated larger
EASTERN CORN BELT DELAYS CONTINUE, MORE FARM PROGRAM DETAILS
 May 31, 22 Ames, Iowa Econ. Info. 1839 EASTERN CORN BELT DELAYS CONTINUE, MORE FARM PROGRAM DETAILS Corn prices in the next two weeks will continue to be moderately sensitive to weather and planting progress
United Nations Conference on Trade and Development. Recent trends and outlook of Commodity Markets
 United Nations Conference on Trade and Development 9 th MULTI-YEAR EXPERT MEETING ON COMMODITIES AND DEVELOPMENT 12-13 October 2017, Geneva Recent trends and outlook of Commodity Markets By Mr. Janvier
Softwood Log and Lumber Markets in Asia
 Softwood Log and Lumber Markets in Asia Mapping the Course Vancouver, Washington January 24, 219 Bob Flynn Director, International Timber Fastmarkets/RISI Email: rflynn@fastmarkets.com Phone: 1-36-471-6578
Feed Grain Outlook March 10, 2016 Volume 25, Number 15
 Today s Newsletter Market Situation WASDE 1 Grain Use 3 Outside Markets 6 Market Situation WASDE. USDA made no changes to the supply and demand balance sheets for corn or sorghum in yesterday s World Agricultural
Material Impacts On The Precision Machining Industry. Pricing Tyranny: Low Utilization & Empty Pipeline
 Precision Machined Products Association Material Impacts On The Precision Machining Industry December 2010 Pricing Tyranny: Low Utilization & Empty Pipeline Executive Summary Quick Summary: The prices
LPG PRICES IN AN INCREASINGLY VOLATILE MARKET
 Information Analytics Expertise JUNE 214 LPG PRICES IN AN INCREASINGLY VOLATILE MARKET 18 th Annual Asia LPG Seminar Ronald L. Gist, Director +1 832 29 4426 Ron.Gist@ihs.com 214 IHS / ALL RIGHTS RESERVED
Executive summary. Butter prices at record levels
 June 2017 Executive summary Butter prices at record levels South African milk production growth disappointed in the first five months of 2017. Total production during this period is marginally lower than
Rail Intermodal Keeps America Moving
 Rail Intermodal Keeps America Moving Association of American railroads March 2018 Summary Rail intermodal the movement of shipping containers and truck trailers on railroad flat cars has been growing rapidly
January 9, 2014 WE WILL BE UPDATING AND ADDING MATERIAL THROUGHOUT THE DAY ON JANUARY 10 TO THIS LETTER BEGINNING AT 11:00 AM CST.
 January 9, 2014 WE WILL BE UPDATING AND ADDING MATERIAL THROUGHOUT THE DAY ON JANUARY 10 TO THIS LETTER BEGINNING AT 11:00 AM CST. PLEASE CHECK BACK OFTEN THROUGHOUT THE DAY FOR THE LATEST INFORMATION!
Feed Grain Outlook November 2, 2015 Volume 24, Number 67
 Today s Newsletter Market Situation Crop Progress 1 Grain Use 1 Outside Markets 3 Marketing Strategies 2015 Feed Grain Marketing Plan 7 Upcoming Reports/Events 8 Market Situation Crop Progress. Grain harvest
Dairy Outlook. January By Jim Dunn Professor of Agricultural Economics, Penn State University. Market Psychology
 Dairy Outlook January 2016 By Jim Dunn Professor of Agricultural Economics, Penn State University Market Psychology Both Class III and Class IV milk prices had a poor December. In particular butter prices
A Real Time Assessment of the Columbia-Snake River Extended Lock Outage: Process and Impacts
 FREIGHT POLICY TRANSPORTATION INSTITUTE A Real Time Assessment of the Columbia-Snake River Extended Lock Outage: Process and Impacts Sara Simmons, Ken Casavant and Jeremy Sage A Real Time Assessment of
Market Outlook. David Reinbott.
 Market Outlook David Reinbott Agriculture Business Specialist P.O. Box 187 Benton, MO 63736 (573) 545-3516 http://extension.missouri.edu/scott/agriculture.aspx reinbottd@missouri.edu Trending Issues China,
Multimodal Transport Institute Forum. Tom Malloy Thoroughbred Direct Intermodal Services. October 11, 2012 Los Angeles, California
 Multimodal Transport Institute Forum Tom Malloy Thoroughbred Direct Intermodal Services October 11, 2012 Los Angeles, California Topics North American Railroad Industry -Facts & Figures North American