The Economic Impacts of the Indiana Maritime Industry
|
|
|
- Grace Edwards
- 6 years ago
- Views:
Transcription

1 The Economic Impacts of the Indiana Maritime Industry Study Completed 2015 Prepared for: Martin Associates 941 Wheatland Avenue Suite 203 Lancaster, PA
2 TABLE OF CONTENTS EXECUTIVE SUMMARY... 1 I. INTRODUCTION IMPACT DEFINITIONS METHODOLOGY ECONOMIC IMPACT MODEL SUMMARY OF RESULTS II. ECONOMIC IMPACTS OF INDIANA WATERBORNE ACTIVITY IMPACT STRUCTURE The Surface Transportation Sector The Maritime Services Sector Tenants, Terminals and Dependent Shipper/Consignees Sector Ports of Indiana COMMODITIES INCLUDED IN THE ANALYSIS MARITIME CARGO EMPLOYMENT IMPACTS Direct Maritime Cargo Jobs Induced Jobs Indirect Jobs Related User (Shipper/Consignee) Jobs TOTAL ECONOMIC OUTPUT, BUSINESS REVENUE, INCOME AND TAX IMPACTS PERSONAL EARNINGS IMPACTS TAX IMPACTS APPENDIX A - TONNAGES BY COMMODITY AND BY MODE OF TRANSPORTATION APPENDIX B IMPACTS OF BARGE TRAFFIC APPENDIX C IMPACTS OF INTERNATIONAL SEAWAY TRAFFIC APPENDIX D PEER REVIEW LETTERS (Printed April 12, 2016) 2
3 EXECUTIVE SUMMARY Martin Associates was retained by the Ports of Indiana to measure the local, regional and state economic impacts generated by maritime activity at Indiana s public and private maritime terminals along the 400 miles of navigable waterways bordering the state on the Ohio River and Lake Michigan. Economic impacts generated at the cargo and industrial facilities include the impacts generated by steel products, steel input commodities such as iron ore and coal/coke, cement, fertilizer, grain/soybean products, limestone, as well as other dry and liquid bulk cargoes. In 2013, according to the U.S. Army Corps of Engineers Waterborne Commerce Statistics, about 64.9 million tons of foreign and domestic maritime cargoes were handled by Indiana terminals on Lake Michigan and the Ohio River. Approximately 34.6 million tons of cargo were handled by Indiana terminals on the Ohio River and 30.3 million tons were handled by the state s Lake Michigan terminals. It should be noted that 2013 was the most current year of data available for all shipping modes at the time of this study. One-Hundred-Forty-Seven terminals, industrial tenants, and service providers on Lake Michigan and the Ohio River were interviewed. Tonnages were estimated based upon these interviews and U.S. Army Corps of Engineers statistics. Indiana waterways are unique in the fact that three separate modes of waterborne commerce are currently used in the shipment and receipt of raw materials and finished product. These include: international ships moving cargo through the St. Lawrence Seaway ( salties ), lake ships moving international and domestic shipments throughout the Great Lakes ( lakers ), and barges of international and domestic cargoes moving along the Inland Waterways System. It is this unique convergence of water transportation modes that provides steel mills and other industries with the ability to use cost-effective methods for receiving raw materials such as iron ore, coal and limestone and for shipping finished products to domestic and international markets. Without water transportation, production costs would undoubtedly increase and therefore potentially hinder future operations and negatively impact the state s levels of manufacturing. While the balance of this report details the economic impact of Indiana waterway s waterborne shipping activity, key findings from the CY2013 analysis include the following: Annual Economic Impact of Waterborne Shipping on Indiana s Waterways: 155,169 direct, induced, indirect and related jobs; 115,613 jobs dependent upon marine terminals $9.9 billion of total income and re-spending; $21.5 billion of total economic activity to the state; and $936.9 million of total state and local tax revenue. 1
4 Exhibit ES-1 Economic Impacts of Waterborne Shipping Activity on Indiana s Waterways 1 Based on economic data from CY2013* LAKE MICHIGAN OHIO RIVER TOTAL INDIANA DEPENDENT JOBS 84,112 31, ,613 RELATED JOBS 27,634 11,922 39,557 TOTAL JOBS 111,746 43, ,169 DEPENDENT PERSONAL INCOME $6,443,928,082 $2,043,103,649 $8,487,031,730 RELATED PERSONAL INCOME $1,028,237,591 $346,999,353 $1,375,236,944 TOTAL INCOME/RE-SPENDING $7,472,165,673 $2,390,103,002 $9,862,268,674 LOCAL PURCHASES $2,802,772,293 $1,047,406,579 $3,850,178,872 DEPENDENT STATE & LOCAL TAXES $612,173,168 $194,094,847 $806,268,014 RELATED STATE & LOCAL TAXES $97,682,571 $32,964,939 $130,647,510 TOTAL STATE & LOCAL TAXES $709,855,739 $227,059,785 $936,915,524 DEPENDENT VALUE OF ECONOMIC ACT $11,769,336,407 $2,907,270,917 $14,676,607,325 RELATED VALUE OF ECONOMIC ACTIVIT $4,021,814,057 $2,798,599,038 $6,820,413,096 TOTAL VALUE OF ECONOMIC ACTIVITY $15,791,150,465 $5,705,869,955 $21,497,020,420 *Totals may be rounded. Waterborne cargo activity at a port contributes to the state economy by generating business revenue to local and national firms providing vessel and cargo handling services at the maritime terminals. These firms, in turn, provide employment and income to individuals, and pay taxes to state and local governments. Exhibit ES-2 shows how activity at maritime terminals generates impacts throughout the local, state and national economies. As this exhibit indicates, the impact of waterborne shipping on a local, state or national economy cannot be reduced to a single number, but instead, creates several impacts. These are the revenue impact, employment impact, personal income impact, and tax impact. These impacts are non-additive. For example, the income impact is a part of the revenue impact, and adding these impacts together would result in double-counting. 1 The total impacts include related jobs which are not dependent upon the port marine terminals to the same extent as are the direct, induced and indirect jobs since it is the demand for the final products which creates the demand for the employment with these related shippers/consignees, not the use of a particular port or maritime terminal, and therefore these firms can, and do use other ports. 2
5 ES-2 Flow of Economic Impacts of Waterway Activity through the Economy Waterway Activity Value of Imports/Exports Business Revenue Related User Output Payroll Retained Earnings, Dividends & Investments Local Purchases Related User Personal Income Direct Jobs Re-spending Induced Jobs Indirect Jobs Related User Jobs State & Local Taxes 3
6 I. INTRODUCTION Martin Associates was retained by the Ports of Indiana to measure the local, regional and state economic impacts generated by maritime activity at Indiana s maritime terminals, including the Port of Indiana-Burns Harbor, Jeffersonville and Mount Vernon tenants. Economic impacts generated at the cargo and industrial facilities include the impacts generated by steel products, steel input commodities such as iron ore and coal/coke, cement, fertilizer, grain/soybean products, limestone, as well as other dry and liquid bulk cargoes. In 2013, according to the U.S. Army Corps of Engineers Waterborne Commerce Statistics, about 64.9 million tons of foreign and domestic cargoes were handled on the 400 miles of navigable waterways bordering the state on Lake Michigan and the Ohio River. It should be noted that 2013 was the most current year of data available for all shipping modes at the time of this study. One-Hundred-Forty-Seven terminals, industrial tenants, and service providers on Lake Michigan and the Ohio River were interviewed. Tonnages were estimated based upon these interviews and U.S. Army Corps of Engineers statistics. The study employs methodology and definitions that have been used by Martin Associates to measure the economic impacts of port activity at more than 500 ports in the United States and Canada, and at the leading airports in the United States. It is to be emphasized that only measurable impacts are included in this study. In order to ensure defensibility, Martin Associates approach to economic impact analysis is based on data developed through an extensive interview and telephone survey program of the port tenants and the firms providing cargo and logistics services on Indiana waterways. Specific re-spending models have been developed for the state of Indiana to reflect the unique economic and consumer profiles of the regional economy. To further underscore the defensibility of the study, standardized impact models, such as the MARAD Port Kit were not used. Instead, the resulting impacts reflect the uniqueness of the state s port and maritime operations, as well as the surrounding regional economy. It is important to note that this paper is part of a larger study to measure the economic impacts of maritime activity occurring throughout the State of Indiana along with maritime activity occurring exclusively within Ports of Indiana harbors. The impacts presented in this paper represent the economic activity associated with all maritime activity within the state, including at the public docks and waterways. It is also important to note that, due to data availability limitations the statewide report is based upon 2013 tonnages while the impacts contained in the paper for the Ports of Indiana facilities are based upon 2014 tonnages. Furthermore, it should be emphasized that the impacts presented in both reports represent snapshots in time following a multi-year economic recession that significantly impacted maritime shipments and related economic activities. As the economy continues to recover, demand for commodities and goods moving via Indiana waterways will increase as will the economic impacts associated with that cargo. 4
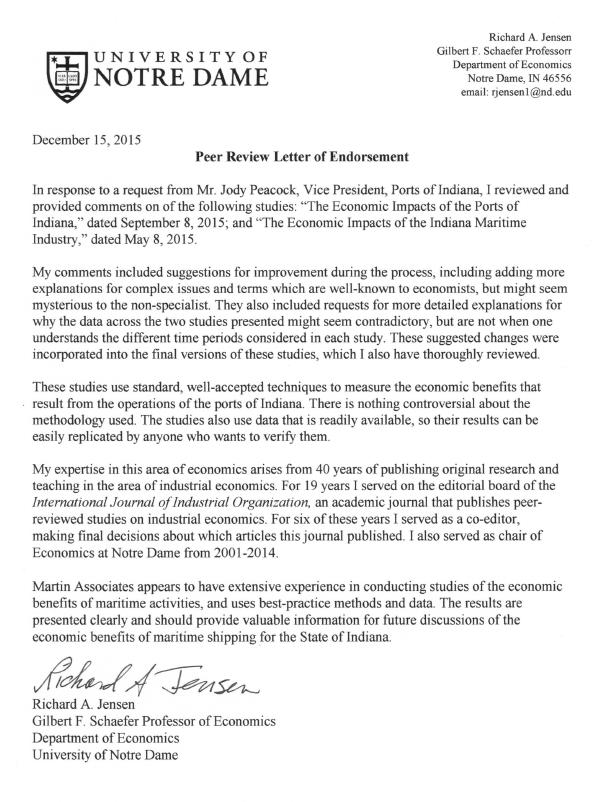
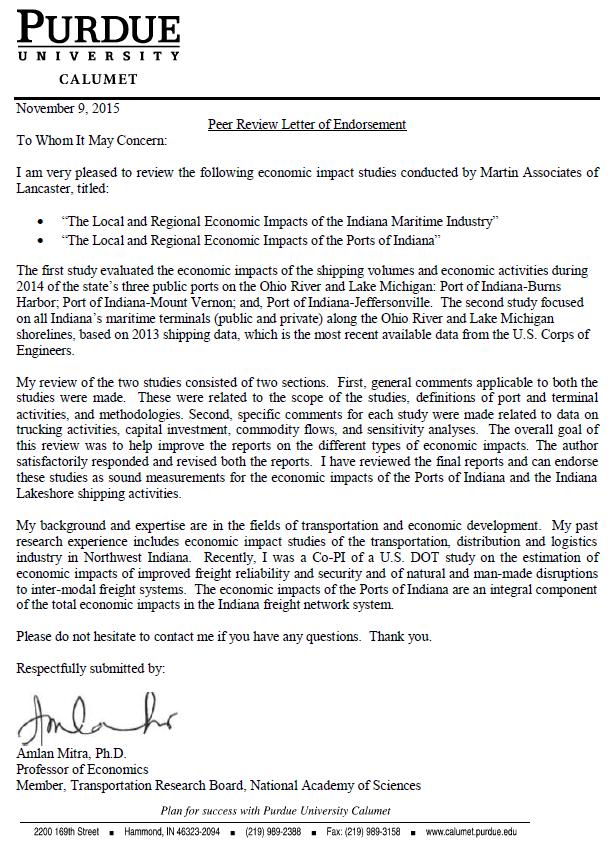
7 Indiana waterways are unique in the fact that three separate modes of waterborne commerce are currently used in the shipment and receipt of raw materials and finished products. These include: international ships moving cargo through the St. Lawrence Seaway ( salties ), lake vessels carrying international cross-lake and domestic intra-lake shipments ( lakers ), and barges moving international and domestic cargoes along the Inland Waterways System. It is this unique convergence of water transportation modes that provides steel mills and other industries with the ability to use cost-effective methods for receiving raw materials such as iron ore, coal and limestone and shipping finished products to domestic and international markets. Without water transportation, production costs would undoubtedly increase and therefore potentially hinder future contracts and levels of manufacturing. While the balance of this report details the economic impact of Indiana waterborne shipping activity, key figures from the CY2013 analysis include the following: Annual Economic Impact of Waterborne Shipping in Indiana: 155,169 direct, induced, indirect and related jobs; 115,613 jobs dependent upon marine terminals $21.5 billion of economic activity to the state; and $936 million of state and local tax revenue. The following university professors provided input and peer reviews of the analysis (Letters of Endorsement can be found in Appendix C): - Bruce Jaffee, Professor/Chairperson, Dept. of Economics & Public Policy, Indiana University - Richard Jensen, Professor of Economics, Dept. of Economics, University of Notre Dame - Amlan Mitra, Professor of Economics, Dept. of Finance and Economics, Purdue University Calumet; Member, Transportation Research Board, National Academy of Sciences Exhibit 5
8 1. IMPACT DEFINITIONS The impacts are measured separately for Indiana waterway cargo activity and industrial activity. The impacts are measured in terms of: Jobs [direct, induced, indirect and related shipper/consignee (related users)]; Personal income; Business revenue; and State and local taxes. Each impact measurement is described below: Direct, Induced, Indirect and Related Jobs: Direct jobs are those that would not exist if activity at Indiana waterway terminals were to cease. Direct jobs created by cargo activity at the maritime terminals are those jobs with the firms directly providing cargo handling and vessel services, including trucking companies, terminal operators and stevedores, members of the International Longshoremen s Association (ILA), International Union of Operating Engineers, International Brotherhood of Teamsters and United Steelworkers, vessel agents, pilots and tug assist companies. Induced jobs are jobs created in Indiana by the purchases of goods and services by those individuals directly employed by each of the terminals lines of business. These jobs are based on the local purchase patterns of area residents. The induced jobs are jobs with grocery stores, restaurants, health care providers, retail stores, local housing/construction industry, and transportation services, as well as with wholesalers providing the goods to the retailers. Indirect jobs are created throughout the area as the result of purchases for goods and services by the firms directly impacted by Indiana maritime activity, including the tenants, terminal operators and the firms providing services to cargo which includes steel, general cargo, dry bulks and liquid bulks. The indirect jobs are measured based on actual local purchase patterns of the directly dependent firms, and occur with such industries as utilities, office supplies, contract service providers, maintenance and repair, and construction. Related user jobs are jobs with shippers and consignees (exporters and importers) including the state s manufacturing, farming, retail, wholesale, distribution industries, and the in-state industries supporting the movement and distribution of cargo imports and exports using the port terminals for shipment and receipt of cargo. While these impacts occur for all commodities, the majority of Indiana s maritime shippers and consignees impacts involve the import and export of steel, coal, grain, fertilizers, salt, limestone and miscellaneous dry 6
9 and liquid bulk commodities. A large number of dependent steel users are already accounted for in the port tenant/dependent user category due to the fact that the Ports of Indiana s Burns Harbor and Jeffersonville facilities maintain a large steel manufacturing and processing presence. Related jobs are not dependent upon the port marine terminals to the same extent as are the direct, induced and indirect jobs since it is the demand for the final products, which creates the demand for the employment with these shippers/consignees, not the use of a particular port or maritime terminal, and therefore these firms can, and do use other ports. For example, when hurricane devastation renders a port s container and break bulk terminals inoperable, essentially suspending operations at the port, the direct, induced and indirect jobholders are immediately affected with similar consequence. However, the jobs held with related users such as manufacturing as well as wholesale and retail distribution throughout the unaffected areas of state will continue to operate. These firms are required to find alternative ports to ship and receive cargo in order to maintain given levels of operation. Therefore, viable port operations are essential to long-term retention of import and export related jobs throughout the state. Personal income impact consists of wages and salaries received by those directly employed by port and waterway activities, and includes a re-spending impact which measures the personal consumption activity in Indiana of those directly employed as the result of Indiana waterway cargo and industrial activity. Indirect personal income measures the wages and salaries received by those indirectly employed. Business revenue consists of total business receipts by firms providing services in support of the cargo activity. Local purchases for goods and services made by the directly impacted firms are also measured. These local purchases by the dependent firms create the indirect impacts. Revenues from port tenants, dependent shippers and consignees and waterway terminals are included. State and local taxes include taxes paid by individuals as well as firms dependent upon Indiana waterway cargo and industrial tenant activity. 2. METHODOLOGY The methodological approach to this study is designed to provide highly defensible, as well as accurate results. This same methodology has been used by Martin Associates in the last 25 years to assess the economic impacts of cargo and passenger activity at seaports including: Los Angeles, CA Long Beach, CA Oakland, CA Portland, OR Seattle, WA Sacramento, CA San Francisco, CA Vancouver, BC Vancouver, WA 7
10 Houston, TX Corpus Christi, TX Freeport, TX New Orleans, LA Texas City, TX Baton Rouge, LA Port Everglades, FL Palm Beach, FL Miami, FL Jacksonville, FL Wilmington/Morehead City, NC Virginia/Hampton Roads, VA Baltimore, MD Philadelphia, PA Wilmington, DE Brunswick, GA Richmond, VA Providence, RI Montreal, QC Quebec City, QC Prince Rupert, BC Halifax, NS Saint John, NB 18 U.S. Great Lakes Ports The economic impacts of Indiana waterways presented in this report were estimated based on telephone and personal interviews with 147 firms in Indiana. This represents the universe of cargo and related industrial businesses (with the exception of trucking firms) on Indiana waterways including Burns Harbor, Indiana Harbor, Buffington Harbor and Gary as well as the length of the Indiana bank of the Ohio River. It is to be emphasized that a 93% response rate was achieved from these firms located on Ports of Indiana property as well as those on the privately-held lands along the Ohio River and Lake Michigan coast. The direct impacts are measured at the firm level of detail, and aggregated to develop the impacts for each of the terminals lines of business. Each Ports of Indiana tenant surveyed provided Martin Associates with detailed employment levels (both full time and part time), annual payroll, local purchases and the residence of the employees. Additional data collected from the private Indiana waterway terminals includes: employment, vessel and barge tonnage, vessel and barge calls, revenues and expenditures. The induced impacts are based on the current expenditure profile of residents of Indiana as estimated by the U.S. Bureau of Labor Statistics, Consumer Expenditure Survey. This survey indicates the distribution of consumer expenditures over key consumption categories for Indiana residents. The consumption categories are: Food at Home; Food at Restaurants; Housing; Home Furnishings; Apparel; Transportation equipment and Services; Entertainment; and Health Care. The re-spending impact is developed by deriving an implied marginal propensity to consume from income multipliers for the water transportation industry, as developed by the Bureau of Economic Analysis. The estimated consumption expenditure generated as a result of the re- 8
11 spending impact is distributed across the above consumption categories. Associated with each consumption category is the relevant retail and wholesale industry. Jobs to sales ratios in each industry are then computed for Indiana, and induced jobs are estimated for the relevant consumption categories. It is to be emphasized that induced jobs are only estimated at the retail and wholesale level, since these jobs are most likely generated in each terminal s region. Further levels of induced jobs are not estimated since it is not possible to defensibly identify geographically where the subsequent rounds of purchasing occur. The Consumer Expenditure Survey does not include information to estimate the job impact with supporting business services, legal, social services, state and local governments, and educational services. To estimate this induced impact, a ratio of state of Indiana employment in these key service industries to total state of Indiana employment is developed. This ratio is then used with the direct and induced consumption jobs to estimate induced jobs with business/financial services, legal, educational, governmental and other social services. The indirect impacts are estimated based on the local purchases by the directly dependent firms, combined with indirect job, income and revenue coefficients for the supplying industries in the state of Indiana as developed for Martin Associates by the U.S. Bureau of Economic Analysis, Regional Input/Output Modeling System (RIMS II). 3. ECONOMIC IMPACT MODEL The impacts are measured for CY2013 based on interviews and the latest USACE data available at the time of this report, computer models for cargo and industrial operations have been developed to test the sensitivity of the impacts to changes in economic conditions and facility utilization. It is to be emphasized that this study is designed to provide a framework which Ports of Indiana can use in formulating and guiding future development of shipping facilities and policies for the state of Indiana. The cargo impact model is designed to test the sensitivity of impacts to changes in such factors as maritime tonnage levels, port productivity and work rules, new port facilities development, inland distribution patterns of cargo, number of vessel/barge calls and the introduction of new carrier services. The cargo impact model can also be used to assess the impact of developing a parcel of land as a maritime terminal versus other non-cargo land uses. Finally, the maritime cargo impact model can be used to assess the economic benefits of increased maritime activity due to infrastructure development and the opportunity cost of not undertaking specific maritime investments such as dredging, new terminal development or warehouse development. Page 9
12 4. SUMMARY OF RESULTS Exhibits I-1a and I-1b provide a breakdown by region for the economic impact analysis of the maritime activity on Indiana waterways. In Table I-1a, only dependent jobs, income, revenue and tax impacts are included. If access to Indiana marine terminals were to be cut off, the 115,613 direct, induced and indirect job holders would be immediately affected. Table I-1b includes related impacts in addition to the dependent direct, induced, and indirect impacts. The related job holders are employed in industries such as steel processing, agriculture and construction. They would not suffer the same level of disruption if marine activity at Indiana terminals were to cease because they would have the ability to route their cargo through other ports. When these impacts are included there are 155,169 jobs that are in some way related to, but not necessarily dependent upon, Indiana marine terminal activity. These impact summaries are shown separately to emphasize the fact that related jobs are not dependent upon the Indiana marine terminals to the same extent as the direct, induced and indirect impacts. The 39,557 related job holders benefit from lower shipping costs afforded by using the Ports of Indiana marine terminals and could suffer longer term disruptions if terminal activity were to cease. However, due to their ability to use other ports, they are not considered to be dependent upon the state s marine facilities. Exhibit I-1a Dependent Economic Impact of Indiana Waterborne Shipping Activity CY2013* LAKESHORE OHIO RIVER TOTAL INDIANA JOBS DIRECT 20,383 11,252 31,635 INDUCED 29,593 10,854 40,447 INDIRECT 34,136 9,395 43,531 TOTAL JOBS 84,112 31, ,613 PERSONAL INCOME DIRECT $1,294,028,440 $435,147,701 $1,729,176,141 INDUCED/RE-SPENDING $3,715,932,070 $1,249,570,138 $4,965,502,208 INDIRECT $1,433,967,571 $358,385,810 $1,792,353,381 TOTAL PERSONAL INCOME $6,443,928,082 $2,043,103,649 $8,487,031,730 VALUE OF ECONOMIC ACTIVITY BUSINESS SERVICES REVENUE $903,499,607 $1,147,156,935 $2,050,656,543 TENANT/DEPENDENT SHIPPER REVENUE $10,865,836,800 $1,760,113,982 $12,625,950,782 TOTAL VALUE OF ECONOMIC ACTIVITY $11,769,336,407 $2,907,270,917 $14,676,607,325 LOCAL PURCHASES $2,802,772,293 $1,047,406,579 $3,850,178,872 STATE & LOCAL TAXES $612,173,168 $194,094,847 $806,268,014 *Totals may be rounded. Page 10
13 Exhibit I-1b Related Economic Impact of Indiana Waterborne Shipping Activity CY2013* 2 LAKESHORE OHIO RIVER TOTAL INDIANA JOBS DIRECT 20,383 11,252 31,635 INDUCED 29,593 10,854 40,447 INDIRECT 34,136 9,395 43,531 RELATED 27,634 11,922 39,557 TOTAL JOBS 111,746 43, ,169 PERSONAL INCOME DIRECT $1,294,028,440 $435,147,701 $1,729,176,141 INDUCED/RE-SPENDING $3,715,932,070 $1,249,570,138 $4,965,502,208 INDIRECT $1,433,967,571 $358,385,810 $1,792,353,381 RELATED INCOME $1,028,237,591 $346,999,353 $1,375,236,944 TOTAL PERSONAL INCOME $7,472,165,673 $2,390,103,002 $9,862,268,674 VALUE OF ECONOMIC ACTIVITY BUSINESS SERVICES REVENUE $903,499,607 $1,147,156,935 $2,050,656,543 TENANT/DEPENDENT SHIPPER REVENUE $10,865,836,800 $1,760,113,982 $12,625,950,782 Dependent Revenue Subtotal $11,769,336,407 $2,907,270,917 $14,676,607,325 RELATED REVENUE $4,021,814,057 $2,798,599,038 $6,820,413,096 TOTAL VALUE OF ECONOMIC ACTIVITY $15,791,150,465 $5,705,869,955 $21,497,020,420 LOCAL PURCHASES $2,802,772,293 $1,047,406,579 $3,850,178,872 STATE & LOCAL TAXES DIRECT, INDUCED AND INDIRECT $612,173,168 $194,094,847 $806,268,014 RELATED TAXES $97,682,571 $32,964,939 $130,647,510 TOTAL STATE & LOCAL TAXES $709,855,739 $227,059,785 *Totals may be rounded. $936,915,524 In 2013, waterborne shipping at Indiana waterway facilities in some way supported 155,169 jobs in the region. Of these jobs, 31,635 jobs were directly created by cargo shipping and dependent industrial activities, while another 40,447 induced jobs were generated in the state as a result of local purchases made by those directly employed by Indiana waterway terminals and Ports of Indiana cargo and tenant activity. In addition, there were 43,531 indirect jobs supported in Indiana as the result of nearly $3.9 billion of local purchases. A further 39,557 jobs were in some way related to Indiana maritime cargo. The majority of these jobs were associated with the processing and movement of steel products, fertilizer, grain and dry bulk cargoes at the individual terminals. It 2 The total impacts include related jobs which are not dependent upon the port marine terminals to the same extent as are the direct, induced and indirect jobs since it is the demand for the final products which creates the demand for the employment with these related shippers/consignees, not the use of a particular port or maritime terminal, and therefore these firms can, and do use other ports. Page 11
14 must be emphasized that only the 115,613 direct, induced, and indirect jobs are generated by, and thus dependent upon, the Indiana maritime and associated industrial activity. The 31,635 direct jobs received $1.7 billion of direct wage and salary income, for average earnings of $54,660 per direct employee. As a result of local purchases with this $1.7 billion of direct wages and salaries, nearly $5 billion of additional income and local consumption expenditures were created in Indiana. It is this re-spending impact that supported the 40,447 induced jobs. 3 The indirect jobs holders received nearly $1.8 billion in personal income. Related users in the state received another $1.4 billion of personal income. In total, $9.8 billion of personal income is in some way related to Indiana waterborne shipping operations. Local maritime service businesses received more than $2 billion of revenue from providing services supporting cargo activity. Port tenants and dependent shippers generated $12.6 billion of revenue from processing and manufacturing activities at their facilities. In addition, $6.8 billion of output was generated throughout the state by related users using the marine terminal facilities for shipment and receipt of cargo. As a result of the cargo and industrial activity at Indiana waterway terminal facilities, a total of $806.3 million of state and local tax revenue was generated. A further $130.6 million of related taxes bring the total state and local taxes that are in some way related to maritime and cargo activity to over $936.9 million. 3 The induced income impact also includes local consumption expenditures and should not be divided by induced jobs to estimate the average salary per induced job. This re-spending throughout the region is estimated using a regional personal earnings multiplier, which reflects the percentage of purchases by individuals that are made within the area. For instance, when a dockworker purchases groceries, the entire value of his purchase is included in the re-spending impact, but only a portion of that is used to pay the wages of grocery store employees. The rest of that money is applied to the wholesale cost of goods purchased, used to pay the grocery store s utility bills, etc. Hence, to divide the re-spending by induced employees would result in an overestimated average salary. Page 12
15 II. ECONOMIC IMPACTS OF INDIANA WATERBORNE ACTIVITY Waterborne cargo activity at a port or cargo terminal contributes to the state economy by generating business revenue to local and national firms providing vessel and cargo handling services at the terminals. These firms, in turn, provide employment and income to individuals, and pay taxes to state and local governments. Exhibit II-1 shows how activity at maritime terminals generates impacts throughout the local, state and national economies. As this exhibit indicates, the impact of waterborne shipping on a local, state or national economy cannot be reduced to a single number, but instead creates several impacts. These are the revenue impact, employment impact, personal income impact, and tax impact. These impacts are non-additive. For example, the income impact is a part of the revenue impact, and adding these impacts together would result in double-counting. Exhibit II-1 shows graphically how activity at Indiana waterway facilities generates the four impacts. Exhibit II-1 Flow of Economic Impacts Generated by Maritime Activity Waterway Activity Value of Imports/Exports Business Revenue Related User Output Payroll Retained Earnings, Dividends & Investments Local Purchases Related User Personal Income Direct Jobs Re-spending Induced Jobs Indirect Jobs Related User Jobs State & Local Taxes At the outset, activity at the maritime terminals generates business revenue for firms which provide services. This business revenue impact is dispersed throughout the economy in several ways. It is used to hire people to provide the services, to purchase goods and services, and to make federal, state and local tax payments. The remainder is used to pay stockholders, retire debt, make investments, or is held as retained earnings. It is to be emphasized that the only portions of the revenue impact that can be definitely identified as remaining in the local/regional economy are those portions paid out in salaries to local employees, for local purchases by individuals and businesses directly dependent on the port, in contributions to state and local taxes, in lease payments by tenants, and wharfage and dockage fees paid to a port. Page 13
16 The employment impact of maritime activity consists of four levels of job impacts: Direct employment impact -- jobs directly generated by waterway activity. Direct jobs generated by cargo include jobs with railroads and trucking companies moving cargo between inland origins and destinations and the terminals, longshoremen and dockworkers, steamship agents, freight forwarders, stevedores, etc. It is to be emphasized that these are classified as directly generated in the sense that these jobs would experience near term dislocation if the activity at Indiana maritime terminals were to be discontinued. Induced employment impact -- jobs created throughout the local economy because individuals directly employed due to maritime activity spend their wages locally on goods and services such as food, housing and clothing. These jobs are held by residents located throughout the region, since they are estimated based on in-state purchases. Indirect Jobs -- are jobs created locally due to purchases of goods and services by firms, not individuals. These jobs are estimated directly from local purchases data supplied to Martin Associates by the companies interviewed as part of this study, and include jobs with local office supply firms, maintenance and repair firms, parts and equipment suppliers, etc. Related User jobs are jobs with shippers and consignees (exporters and importers) including the state s manufacturing, farming, retail, wholesale, distribution industries, and the in-state industries supporting the movement and distribution of cargo imports and exports using the port terminals for shipment and receipt of cargo. While these impacts occur for all commodities, the majority of Ports of Indiana shippers and consignees impacts involve the import and export of steel, coal, grain, fertilizers, salt, limestone and miscellaneous dry and liquid bulk commodities. A large number of dependent steel users are already accounted for in the port tenant/dependent user category due to the fact that the Ports of Indiana s Burns Harbor and Jeffersonville facilities maintain a large steel manufacturing and processing presence. Related jobs are not dependent upon the port marine terminals to the same extent as are the direct, induced and indirect jobs since it is the demand for the final products, which creates the demand for the employment with these shippers/consignees, not the use of a particular port or maritime terminal, and therefore these firms can, and do use other ports. For example, when hurricane devastation renders a port s container and break bulk terminals inoperable, essentially suspending operations at the port, the direct, induced and indirect jobholders are immediately affected with similar consequence. However, the jobs held with related users such as manufacturing as well as wholesale and retail distribution throughout the unaffected areas of the state will continue to operate. These firms are required to find alternative ports to ship and receive cargo in order to maintain given Page 14
17 levels of operation. Therefore, viable port operations are essential to long-term retention of import and export related jobs throughout the state. The personal earnings impact is the measure of employee wages and salaries (excluding benefits) received by individuals directly employed due to port activity. Re-spending of these earnings throughout the regional economy for purchases of goods and services is also estimated. This, in turn, generates additional jobs -- the induced employment impact. This re-spending throughout the region is estimated using a regional personal earnings multiplier, which reflects the percentage of purchases by individuals that are made within the area. The re-spending effect varies by region -- a larger re-spending effect occurs in regions that produce a relatively large proportion of the goods and services consumed by residents, while lower re-spending effects are associated with regions that import a relatively large share of consumer goods and services (since personal earnings leak out of the region for these out-of-regional purchases). The direct earnings are a measure of the local impact since they are received by those directly employed by local maritime activity. Tax impacts are payments to the state and local governments by firms and by individuals whose jobs are directly dependent upon and supported (induced jobs) by activity at the marine terminals. 1. IMPACT STRUCTURE Economic impacts are created throughout various business sectors of the state and local economies. Specifically, four distinct economic sectors are impacted as a result of activity at the marine terminals. These are the: Surface Transportation Sector; Maritime Services Sector; Port Tenants, Waterway Terminals and Dependent Shippers/Consignees Sector; and Ports of Indiana (Central Office/Administration). Within each sector, various participants are involved. Separate impacts are estimated for each of the participants. A discussion of each of the economic impact sectors is provided below, including a description of the major participants in each sector The Surface Transportation Sector The surface transportation sector consists of both the railroad and trucking industries. The trucking firms and railroads are responsible for moving the various cargoes between the marine terminals and the inland origins and destinations. Page 15
18 1.2. The Maritime Services Sector This sector consists of numerous firms and participants performing functions related to the following maritime services: Maritime Cargo Transportation; Vessel Operations; Cargo Handling; and Federal, State and Local Government Agencies. A brief description of major participants in these four categories is provided below: Maritime Cargo Transportation: Participants in this category are involved in providing and arranging for inland and water transportation for inbound and outbound freight. For example, a freight forwarder/customs house broker arranges for the freight to be delivered between the terminals and inland destinations, as well as the freight transportation, while the line haul barge operator provides transportation on the river system to port facilities. Vessel/Barge Maritime Service Operations: This category consists of several participants. The steamship agents provide a number of services for the vessel as soon as it enters a port. The agents arrange for medical and dental care of the crew, for ship supplies as well as payment of various expenses including port charges. The agents are also responsible for vessel documentation. In addition to the steamship agents arranging for vessel services, those providing the services include: - Chandlers - supply the vessels with ship supplies (food, clothing, nautical equipment, etc.); - Towing firms - provide the tug service to guide the vessel to and from port; - Pilots - assist in navigating the vessels to and from the maritime terminals; - Bunkering firms - provide fuel to the vessels; - Barge Fleeting/Cleaning provide fleeting services for barges at the terminals; - Marine surveyors - inspect the vessels/barges and the cargo; and - Shipyards/marine construction firms - provide repairs (either emergency or scheduled) as well as marine pier construction and dredging. Page 16
19 Cargo Handling: This category involves the physical handling of the cargo at the terminals between the land and the vessel/barge. Included in this category are the following participants: - Longshoremen & dockworkers - include members of the International Longshoremen s Association (ILA), International Union of Operating Engineers, International Brotherhood of Teamsters and United Steelworkers as well as those dockworkers with no union affiliation that are involved in the loading and unloading of cargo from the vessels/barges, as well as handling the cargo prior to loading and after unloading; - Stevedoring firms - manage the longshoremen and cargo-handling activities; - Cargo terminal operators - provide services to operate the maritime terminals, track cargo movement and provide security where cargo is loaded and off-loaded; - Warehouse operators - store cargo after discharge or prior to loading and consolidate cargo units into shipment lots. In many cases, the freight forwarders and consolidators are also involved in warehousing activity; and - Foreign Trade Zone (FTZ) tenants - operate facilities in the Ports of Indiana Foreign Trade Zones. Government Agencies: This service sector involves federal, state and local government agencies that perform services related to cargo handling and vessel/barge operations at the port. Department of Homeland Security (DHS), which includes Customs and Border Protection (CBP), U.S. Immigration and Customs Enforcement (ICE) and U.S. Coast Guard, U.S. Department of Agriculture (grain inspection) and the U.S. Army Corps of Engineers (USACE), are involved. These services are provided by the government offices located in the Great Lakes region Tenants, Terminals and Dependent Shipper/Consignees Sector Tenant, terminal and shipper/consignee jobs consist of jobs with dependent shippers/consignees that operate cargo terminals on or near Indiana waterways, including steel mills and petroleum refineries as well as port tenants shipping and receiving cargo through the cargo terminals at the Port of Indiana facilities. The Ports of Indiana is unique in the fact that many of the tenants of each facility are users of the waterborne cargo handled at the ports docks. Furthermore, many of the operations performed by these tenants, specifically in the steel manufacturing and steel processing are inter-dependent upon each other. It is to be noted that only a portion of the raw materials and finished products used and produced by the port s tenants is received/shipped via Page 17
20 vessel or barge. There is also a large portion of this cargo that enters/leaves the port via rail and truck. However, the advantage of having access to the Great Lakes and Inland River System with the low-cost option of vessel and barge shipments, as well as the presence of other complementary tenants, is a key attribute in attracting and maintaining such a strong tenant base at Ports of Indiana facilities. The Ports of Indiana has, over the years, been successful in creating a steel processing campus at Burns Harbor and Jeffersonville, and therefore, for the purpose of this analysis, all of the port tenant and dependent shipper/consignee jobs are included Ports of Indiana The Ports of Indiana includes those individuals employed by the port whose purpose is to oversee port activity at the port s cargo and industrial terminals. 2. COMMODITIES INCLUDED IN THE ANALYSIS A major use of an economic impact analysis is to provide a tool for terminal development planning. As a port or terminal grows, available land and other resources for facilities become scarce, and decisions must be made as to how to develop the land and utilize the resources in the most efficient manner. Various types of facility configurations are associated with different commodities. For example, containers, automobiles and RoRo require a large amount of paved, open storage space, while certain types of break bulk cargoes such as steel coils, lumber and plywood may require covered storage. Perishable commodities require temperature controlled warehouses and some dry bulk cargo requires covered storage and special dust removing equipment, while tank farms are needed to store liquid bulk cargo. An understanding of the commodity s relative economic value in terms of employment and income to the local community, the cost of providing the facilities, and the relative demand for the different commodities is essential in making future development plans. Because of this need for understanding relative commodity impacts, economic impacts are estimated for the following commodities handled at the public and private cargo terminals: Steel coils; Ore; Steel slabs; Plate and other steel; Coal and coke; Project Cargo and miscellaneous break bulk; Grain and soybeans; Bulk metals and scrap; Fertilizer; Page 18
21 Cement; Limestone and other dry bulks; Salt; and Other liquid bulks. It should be emphasized that commodity-specific impacts are not estimated for each of the economic sectors described in the last section. Specific impacts could not be allocated by individual commodities with any degree of accuracy for maritime construction, ship repair, or the state and federal government due to the fact that it is difficult to estimate the percentage of resources that are dedicated to one commodity over another. For example, maritime construction may occur at a terminal that is multi-use and cannot be attributed to a specific commodity. Similarly, law enforcement and security operations cannot be attributed to a single commodity. 3. MARITIME CARGO EMPLOYMENT IMPACTS Employment generated by maritime cargo activity on Indiana waterways is estimated. First, the total employment that is in some way related to maritime activity is estimated from the interview process of 147 Indiana waterway terminals, Port of Indiana tenants and service providers as well as data provided by the Ports of Indiana and USACE as described in the methodology; Second, the subset of total employment that is judged to be totally dependent (i.e., direct jobs) on port activity is analyzed as follows: - The direct job impact is estimated by detailed job category, i.e., trucking, dockworkers, barge operators, steamship agents, chandlers, surveyors, etc; - The direct job impact is estimated for each of the key commodities/commodity groups; Induced and indirect jobs are estimated; and Finally, jobs related to the maritime activity at the cargo terminals are described. It is estimated that 155,169 jobs are in some way related to the maritime activity at the cargo terminals on Indiana waterways. Of the 155,169 jobs: 31,635 jobs are directly generated by activities at the cargo terminals and if such activities should cease, these jobs would be discontinued over the short term. 40,447 jobs (induced jobs) are supported by the local purchases of the 31,635 individuals Page 19
22 directly generated by port activity at the cargo terminals. An additional 43,531 indirect jobs were supported by nearly $3.9 billion of purchases in the state of Indiana by firms providing direct cargo handling and vessel/barge services. Direct, induced and indirect categories total 115,613 jobs. These are the jobs that may be considered dependent upon Indiana waterway activity and would experience immediate disruption if that activity were to cease. 39,557 jobs are related to inbound and outbound cargoes transiting Indiana waterway facilities. These jobs are supported in the state s steel processing, manufacturing, farming, construction, retail, wholesale and distribution industries, and the in-state industries supporting the movement and distribution of all commodities, primarily concentrated with steel, coal, grain, limestone, salt and fertilizer cargo imports and exports using Indiana waterway terminals Direct Maritime Cargo Jobs In CY2013, about 64.9 million tons of domestic and foreign waterborne cargo moved via Indiana waterways. As a result of this activity, 31,635 full-time jobs were directly created 4. These jobs would vanish immediately if shipping operations on Indiana waterways were to cease. Most of the 31,635 jobs considered to be generated directly by maritime activity can be associated with the handling of specific commodities or commodity groups. Certain employment categories such as government employees and maritime construction firms cannot be identified with a specific commodity. As a result, employment in these groups (which totaled 2,401) was not allocated to specific commodity. Exhibit II-2 presents the relative employment impacts in terms of commodity groups. 4 Jobs are measured in terms of full-time worker equivalents. If a worker is employed only 50 percent of the time by activity at a cargo terminal, then this worker is counted as.5 jobs. Page 20
23 Exhibit II-2 Direct Employment by Commodity, 2013* LAKESHORE OHIO RIVER TOTAL INDIANA STEEL COILS 6, ,666 ORE 7, ,511 PLATE/OTHER STEEL SLAB COAL/COKE 2,493 1,068 3,561 OTHER BREAKBULK/PROJECT CARGO ,002 GRAIN/SOYBEANS 37 1,272 1,309 BULK METALS/SCRAP FERTILIZER CEMENT LIMESTONE/OTHER DRY BULK 1,192 2,617 3,809 SALT LIQUID BULKS 1,079 1,435 2,514 NOT COMMODITY SPECIFIC 80 2,321 2,401 TOTAL 20,383 11,252 31,635 *Totals may be rounded. As this exhibit shows, steel coils and iron ore generate the largest employment impacts followed by limestone/other dry bulks and coal/coke Induced Jobs The 31,635 directly employed individuals due to activity at the cargo terminals received $1.7 billion of wages and salaries, a part of which was used to purchase local goods and services such as food, housing, clothing, transportation services, etc. As a result of these local purchases, 40,447 induced jobs in the regional economy were supported. The majority of the induced jobs are with private sector social services, business services, educational services and state and local government agencies, followed by jobs in the food and restaurant sector, and then jobs in the construction and home furnishings sector Indirect Jobs In addition to the induced jobs generated via purchases by directly employed individuals, the firms providing the direct services and employing the 31,635 direct jobs make in-state purchases and capital expenditures for goods and services. These purchases by the firms dependent upon the cargo facilities generated additional Indiana jobs indirect jobs. Based on interviews, these firms made $3.9 billion of local and in-state purchases and capital expenditures. These purchases created an additional 43,531 indirect jobs in the local economy. Page 21
24 3.4. Related User (Shipper/Consignee) Jobs It is estimated that 39,557 jobs are supported in Indiana with shippers/consignees that use Indiana waterway facilities. To estimate the related user impact for cargo, the average value per ton of imports and exports was estimated using U.S. Maritime Administration, Foreign Trade Statistics and data from Ports of Indiana. The employment to value of output coefficient for the retail sector related to the exported and imported cargoes was then computed from Bureau of Economic Analysis, Regional Input-Output Model for the state of Indiana. For break bulk cargoes, the associated consuming and producing industries were identified with each commodity. For example, for inbound iron and steel products, relationships were developed to convert the dollar value of these materials into a dollar value of output in the key consuming industries, which include construction and metal fabrication. Relationships between the values of inputs to the value of outputs in these industries were estimated using data from the U.S. Bureau of Census, Census of Manufacturing and Census of Construction. These ratios were then used to convert the dollar value of the imported break bulk and bulk cargoes into a dollar value of output in the consuming industries in the state. Using the respective jobs to value of output multipliers for these industries from the Bureau of Economic Analysis, Regional Input-Output Modeling System (RIMS II) model, the value of the break bulk and bulk cargoes moving via the maritime terminals and remaining in (or produced in) the state of Indiana was converted into related shipper/consignee jobs with these users and associated supporting industries within the state. A similar methodology was used in estimating related user jobs for agricultural products. Finally, the direct, induced and indirect maritime sector job impacts (waterway shippers, port companies and dependent shippers) associated with each of the cargoes for which related shipper/consignee jobs were estimated were subtracted from the total related jobs (by commodity and cargo type) to avoid double-counting. The related shipper/consignee jobs include job impacts at each stage of handling the imported and exported cargo, such as the port activity, the trucking activity and the rail activity used to move the cargo to and from the waterway terminals and the induced and indirect jobs associated with the direct terminal activity. It is to be further emphasized that when the impact models are used for planning purposes and sensitivity analysis, related jobs should not be used to judge the economic benefits of a particular project. Related jobs are not estimated with the same degree of defensibility as are the direct, induced and indirect jobs. Therefore, only these three types of job impacts should be used in evaluating port investments. The purpose of the related jobs estimate is to provide a proxy for the magnitude of the more general economic development impact of the private and public port facilities. Page 22
25 4. TOTAL ECONOMIC OUTPUT, BUSINESS REVENUE, INCOME AND TAX IMPACTS The 64.9 million tons of steel, general cargo and bulk (dry and liquid) cargo handled on Indiana waterway cargo terminals included in the study generated revenue for firms in each of the economic sectors. For example, revenue is received by the railroads and the trucking companies within the surface transportation sector as a result of moving outbound cargo to the terminals and distributing the inbound commodities inland after receipt at the cargo terminals. The firms in the maritime services sector receive revenue from arranging for transportation services, cargo handling, providing services to vessels/barges and repairs to vessels/barges calling on the terminals. The Ports of Indiana receives revenue from terminal leases and port charges such as wharfage and dockage assessed on cargo and vessels. In addition, revenue is received by dependent shippers/consignees from the sales of cargo shipped or received via the cargo terminals and from the sales of products made with raw materials received through the terminals. Since this chapter is concerned with the revenue generated from providing maritime services, the shipper/consignee revenue (i.e., the value of the cargo shipped or received through the waterway terminals, as well as the value of the products produced by the port-dependent shippers/consignees) will be excluded from the remaining discussion. The revenue generated by port and waterway terminal activity consists of many components. For example, gross revenue is used to pay employee salaries and taxes. It is also distributed to stockholders of the companies providing the vessel and cargo handling services, and it is used for the purchases of equipment and maintenance services. Of these components, only three can be isolated geographically with any degree of accuracy. These are the personal income component of revenue, which can be traced to geographic locations based on the residence of those receiving the income, the payment of state and local taxes, and the local purchases made by firms dependent upon the maritime activity. The balance of the revenue is distributed in the form of payments to firms located outside the state of Indiana providing goods and services to the economic sectors and for the distribution of company profits to shareholders. Many of these firms and owners are located outside of the state of Indiana and, thus, it is difficult to trace the ultimate location of the distributed revenue (other than personal income, taxes and local purchases). The value of output created by instate related shippers/consignees of the port is attributed to the state of Indiana, and the local purchases from other firms within the state are also included in this user output measure, as defined by the in-state output coefficients (for the user industries) developed from the U.S. Bureau of Economic Analysis, Regional Input-Output Modeling System (RIMS II). The revenue impact is a measure of the total economic activity in the state that is generated by the cargo moving via Indiana waterways. In 2013, maritime cargo and port industrial activity on Indiana waterways and related activities generated a total of $21.5 billion of total economic activity in the state. Of the $21.5 billion, $2 billion is the direct business revenue received by the firms directly dependent upon the terminals and providing maritime services and inland transportation services to the cargo handled at the maritime terminals and the vessels calling on the Page 23
26 terminals, while another $12.6 billion of revenue is generated by the waterway shippers, port tenants and on-site dependent shippers/consignees. The remaining $6.8 billion represents the value of the output to the state of Indiana that is created due to the cargo moving via the port and waterway terminals. This includes the value added at each stage of producing an export cargo, as well as the value added at each stage of production for the firms using imported raw materials and intermediate products that flow via the marine terminals and are consumed by industries within the state of Indiana. Exhibit II-3 shows the direct revenue impact by commodity. It is to be emphasized that the revenue received by shippers/consignees from the sales of the products (value of the commodities) moving via the port terminals is not included, since product value is determined by the demand for the product, not the use of the cargo terminals. Exhibit II-3 Direct Revenue by Commodity, 2013* LAKESHORE OHIO RIVER TOTAL INDIANA STEEL COILS $285,645,963 $40,972,901 $326,618,865 ORE $334,198,075 $0 $334,198,075 PLATE/OTHER STEEL $20,810,174 $6,996,809 $27,806,983 SLAB $12,891,369 $0 $12,891,369 COAL/COKE $101,323,560 $269,201,662 $370,525,222 OTHER BREAKBULK/PROJECT CARGO $374,716 $1,100,833 $1,475,549 GRAIN/SOYBEANS $5,272,735 $194,550,244 $199,822,979 BULK METALS/SCRAP $15,784,859 $5,975,109 $21,759,968 FERTILIZER $4,144,747 $45,238,545 $49,383,292 CEMENT N/A $3,804,159 $3,804,159 LIMESTONE/OTHER DRY BULK $84,926,384 $137,426,197 $222,352,580 SALT $1,136,216 $4,642,464 $5,778,680 LIQUID BULKS $25,777,811 $31,818,661 $57,596,472 NOT COMMODITY SPECIFIC $11,212,999 $405,429,352 $416,642,350 TOTAL $903,499,607 $1,147,156,935 *Totals may be rounded. $2,050,656,543 As this exhibit indicates coal and coke generate the largest direct revenue impacts, followed by iron ore and steel coils. 5. PERSONAL EARNINGS IMPACTS The income impact is estimated by multiplying the average annual earnings (excluding benefits) of each port participant, i.e., truckers, steamship agents, pilots, towing firm employees, longshoremen, warehousemen, etc., by the corresponding number of direct jobs in each category. The individual annual earnings in each category multiplied by the corresponding job impact resulted in $1.7 billion in personal wage and salary earnings. It is important to emphasize that the average annual earnings of a marine terminal-dependent job is $54,660. By comparison, based on data Page 24
27 available from the Bureau of Labor Statistics (BLS), the annual mean wage for all occupations in Indiana was $41,470 in Therefore, these relatively high paying jobs will have a much greater economic impact in the local economy through stimulating induced jobs than will a job paying lower wages. The impact of re-spending this direct income for local purchases is estimated using a personal earnings multiplier. The personal earnings multiplier is based on data supplied by the Bureau of Economic Analysis (BEA), Regional Input-Output Modeling System (RIMS II). The BEA estimates that for every one dollar earned by direct employees generated by activity at the cargo terminals, an additional $2.87 of personal income and consumption expenditures would be created as a result of re-spending the direct income for purchases of goods and services produced locally. Hence, a personal earnings multiplier of $3.87 was used to estimate the total income and consumption impact of nearly $5 billion, inclusive of the re-spending effect. This additional respending of the direct income generates the 40,447 induced jobs. The 43,531 indirect job holders earned $1.8 billion in indirect wages and salaries. The 39,557 related shipper/consignee jobs tied to cargo moving via marine terminals received nearly $1.4 billion of personal income. Therefore, the total personal income impact and consumption impact created by Indiana waterway cargo shipments and related industrial activity is estimated at just under $10 billion. However, it must again be emphasized that the $1.4 billion received by the related shipper/consignee jobs cannot be said to be dependent upon Indiana s maritime industry. 6. TAX IMPACTS State and local tax impacts are based on per employee tax burdens which are developed at the county, local and state jurisdictional levels. These tax per employee burdens are essentially tax indices that are used to allocate total taxes at each level of government to economic activity generated by the cargo terminals. To estimate the per employee tax indices, total taxes received at each governmental level in Indiana was developed by applying indices from the Tax Foundation 6 to dependent and related incomes. These indices represent total state and local taxes paid by residents as a percent of total personal income. Cargo and marine terminal activity generated $806.3 million of state, county and local taxes. As a result of the economic activity created by the related shipper/consignees, an additional $130.6 million of state and local taxes were generated for a total cargo tax impact of $936.9 million. The State of Indiana receives approximately 64.4% of the tax revenues while local governments received 5 May 2013, State Occupational Employment and Wage Estimates, Indiana. Bureau of Labor Statistics. 6 Tax Foundation, Indiana s State and Local Tax Burden, < Page 25
28 35.6% of the tax impact as illustrated in Exhibit II-4. 7 Exhibit II-4 CY2014 Distribution of State and Local Tax Revenue* TAXES BY CATEGORY STATE LOCAL TOTAL DIRECT, INDUCED & INDIRECT $519,236,601 $287,031,413 $806,268,014 RELATED $84,136,996 $46,510,513 $130,647,510 TOTAL TAXES $603,373,598 $333,541,927 $936,915,524 *Totals may be rounded 7 United States Census Bureau, 2012 Census of Governments: State & Local Finances. Page 26
29 APPENDIX A - TONNAGES BY COMMODITY AND BY MODE OF TRANSPORTATION Exhibit A-1 breaks down the mode of transportation of the 64.9 million tons of maritime cargo handled at Indiana facilities. It also includes other related truck and rail movements. It is important to note that many commodities are handled multiple times, and thus this method can duplicate counts of certain commodities. For instance, steel coils may be trucked in, processed and then trucked out, or grain may be received by truck and shipped out by water. The table reflects the total waterborne and inland moves at Indiana marine facilities and is included to solely provide the reader with greater context concerning movement of cargoes to and from the state s terminals. Exhibit A-1 Tons by Mode of Transportation to or from Indiana Maritime Facilities, 2013* TONNAGES (1,000) WATER TONS TRUCK TONS RAIL TONS STEEL COILS ,275 6,229 ORE 22, PLATE/OTHER STEEL SLAB COAL/COKE 19, ,404 OTHER BREAKBULK/PROJECT CARGO GRAIN/SOYBEANS 4,089 3,704 2,063 BULK METALS/SCRAP 248 1, FERTILIZER 1,668 1, CEMENT LIMESTONE/OTHER DRY BULK 11,653 4, SALT LIQUID BULKS 2, TOTAL 64,955 24,766 22,819 *Totals may be rounded. Source: U.S. Army Corps of Engineers, Indiana State Profile; Martin Associates Page 27
30 APPENDIX B IMPACTS OF BARGE TRAFFIC Exhibits B-1 depicts the economic impacts generated by barge traffic at terminals located on the Indiana Lakeshore of Lake Michigan. In 2013, just over 2 million tons of cargo was shipped to or from Lakeshore terminals by barge through the Chicago Area Waterway System (CAWS.) Barge tonnage moving via the CAWS was isolated based on interviews with terminal operators/tenants, Ports of Indiana barge data, and historical United States Army Corps of Engineers Waterborne Commerce Statistics. The isolated tonnages for each were then used as the input in the Martin Associates sensitivity model to attain these impacts. These results can be interpreted as the immediate impact that would occur should the CAWS be closed to barge traffic. It is important to note that subtracting the CAWS and St. Lawrence Seaway (Appendix C) impact subsets from the total Indiana Lakeshore impact does not equate to the laker impact. Due to the complexities of the port industries, especially steel manufacturing, multiple modes may be used to source materials or deliver finished product. Also, these impact summary tables do not include related impacts since they are not dependent upon maritime activity to the same extent as the direct, induced and indirect impacts. For instance, we cannot assume that steel manufacturers or grain farmers would cease operating in the short term due to the loss of the ability to ship their products by river barge. By diverting their goods to rail or truck, they would be subjected to higher transportation costs. Over the medium to long term these costs could render their operations less competitive which could result in dislocation of Indiana jobs, however these impacts cannot be measured defensibly. Exhibit B-1 Economic Impact of Barge Traffic to the Indiana Lake Michigan, 2013* LAKE MICHIGAN CAWS IMPACTS JOBS DIRECT 3,175 INDUCED 3,839 INDIRECT 5,094 TOTAL JOBS 12,107 PERSONAL INCOME DIRECT $162,317,709 INDUCED/RE-SPENDING $466,111,533 INDIRECT $214,291,739 TOTAL PERSONAL INCOME $842,720,980 VALUE OF ECONOMIC ACTIVITY BUSINESS SERVICES REVENUE $363,813,817 TENANT/DEPENDENT SHIPPER REVENUE $760,608,576 TOTAL VALUE OF ECONOMIC ACTIVITY $1,124,422,393 LOCAL PURCHASES $423,634,107 STATE & LOCAL TAXES $80,058,493 *Totals may be rounded. Page 28
31 APPENDIX C IMPACTS OF INTERNATIONAL SEAWAY TRAFFIC Exhibit C-1depicts the economic impacts generated by international salties at terminals on the Indiana Lakeshore of Lake Michigan. In 2013, over 176,000 tons of cargo moved on internationally-flagged salties via the Saint Lawrence Seaway. Salty tonnages moving through the Seaway were isolated based on interviews with terminal operators/tenants, Ports of Indiana barge data, and historical United States Army Corps of Engineers Waterborne Commerce Statistics. The isolated tonnages for each were then used as the input in the Martin Associates sensitivity model to attain these impacts. These results can be interpreted as the immediate impact that would occur should the Saint Lawrence Seaway be closed to international salty traffic. It is important to note that subtracting the CAWS (Appendix B) and St. Lawrence Seaway impact subsets from the total Lakeshore impact does not equate to the laker impact. Due to the complexities of the port industries, especially steel manufacturing, multiple modes may be used to source materials or deliver finished product. Also, these impact summary tables do not include related impacts since they are not dependent upon maritime activity to the same extent as the direct, induced and indirect impacts. For instance, we cannot assume that steel manufacturers or grain farmers would cease operating in the short term due to the loss of the ability to ship their products through the Seaway. By diverting their goods to rail or truck, they would be subjected to higher transportation costs. Over the medium to long term these costs could render their operations less competitive which could result in dislocation of Indiana jobs, however these impacts cannot be measured defensibly. Exhibit C-1 Economic Impact of Salty Traffic to Lake Michigan, 2013* LAKE MICHIGAN SALTY IMPACTS JOBS DIRECT 479 INDUCED 595 INDIRECT 768 TOTAL JOBS 1,841 PERSONAL INCOME DIRECT $25,287,072 INDUCED/RE-SPENDING $72,614,357 INDIRECT $32,309,655 TOTAL PERSONAL INCOME $130,211,085 VALUE OF ECONOMIC ACTIVITY BUSINESS SERVICES REVENUE $49,776,684 TENANT/DEPENDENT SHIPPER REVENUE $108,658,368 TOTAL VALUE OF ECONOMIC ACTIVITY $158,435,052 LOCAL PURCHASES $63,873,073 STATE & LOCAL TAXES $12,370,053 *Totals may be rounded. Page 29

32 APPENDIX D PEER REVIEW LETTERS Page 30
33 Page 31
34 Page 32
The Economic Impacts of the Ports of Indiana
 The Economic Impacts of the Ports of Indiana Study Completed 2015 Prepared for: Martin Associates 941 Wheatland Avenue Suite 203 Lancaster, PA 17603 www.martinassoc.net TABLE OF CONTENTS EXECUTIVE SUMMARY...
The Local and Regional Economic Impacts of the Port of Vancouver Marine Terminals
 The Local and Regional Economic Impacts of the Port of Vancouver Marine Terminals Prepared for: PORT OF VANCOUVER 3103 NW Lower River Road Vancouver, WA 98660 (360) 693-3611 Prepared by: MARTIN ASSOCIATES
ECONOMIC IMPACT OF THE TEXAS PORTS ON THE STATE OF TEXAS AND THE UNITED STATES, 2015
 ECONOMIC IMPACT OF THE TEXAS PORTS ON THE STATE OF TEXAS AND THE UNITED STATES, 2015 Prepared for: TEXAS PORTS ASSOCIATION 1000 Foust Road Brownsville, TX 78521 www.texasports.org Prepared by: MARTIN ASSOCIATES
The Economic Impacts of Virginia s Maritime Industry
 The Economic Impacts of Virginia s Maritime Industry PORT COMMERCE Million Tons of Cargo Moved 0,00 Jobs $. Billion In Wages $. Billion In Spending $. Billion In State/Local Taxes.% of Virginia Gross State
Waterways 1 Water Transportation History
 Waterways 1 Water Transportation History Water Transportation Propulsion History Human (oars, poles) - - 7,000-10,000 BC Wind (sails) - - 3,000 BC Steamboat invented - - 1787 AD First diesel-powered ship
THE DYNAMICS OF THE US CONTAINER MARKET AND IMPLICATIONS FOR THE US PORT INDUSTRY
 THE DYNAMICS OF THE US CONTAINER MARKET AND IMPLICATIONS FOR THE US PORT INDUSTRY A PRESENTATION TO: CHANGING TRADE PATTERNS JANUARY 24, 2013 MARTIN ASSOCIATES 941 Wheatland Avenue, Suite 203 Lancaster,
Eric Thomas Benchmark River and Rail Terminals
 Eric Thomas Benchmark River and Rail Terminals CORBA s Mission The Central Ohio River Business Association (CORBA) is an alliance of businesses and industry engaged in river commerce on and along the Ohio
Waterborne Commerce Statistics Center
 Waterborne Commerce Statistics Center Amy Tujague, Special Requests Project Manager Waterborne Commerce Statistics Center Navigation & Civil Works Decision Support Center USACE 30 March 2016 US Army Corps
The Point Intermodal River Port Facility at the Port of Huntington Project Benefit Cost Summary
 The Point Intermodal River Port Facility at the Port of Huntington Project Benefit Cost Summary The Lawrence County Port Authority 216 Collins Avenue South Point, Ohio 45638 P a g e Contents I. Base Case...
Port of Vancouver USA Clark College Business Advisory Committee May 9, 2017
 Port of Vancouver USA Clark College Business Advisory Committee May 9, 2017 PORT OF VANCOUVER USA 800 acres of operating port marine and industrial 500 acres for future development More than 50 industrial
INLAND WATERWAYS TRANSPORTATION: Our Competitive Advantage. Delbert R Wilkins Canal Barge Company Big River Moves Leadership Forum April 15, 2013
 INLAND WATERWAYS TRANSPORTATION: Our Competitive Advantage Delbert R Wilkins Canal Barge Company Big River Moves Leadership Forum April 15, 2013 INLAND WATERWAYS TRANSPORTATION: Our Competitive Advantage
Maritime Transportation Research Bank
 University of Arkansas, Fayetteville ScholarWorks@UARK Industrial Engineering Undergraduate Honors Theses Industrial Engineering 5-2015 Maritime Transportation Research Bank Valeria A. Remon Perez University
APPENDIX. CALCULATING NATIONAL LOGISTICS COSTS
 APPENDIX. CALCULATING NATIONAL LOGISTICS COSTS Logistics costs are an important factor affecting the competitiveness of both firms and nations. Firms can enhance their market competitiveness by reducing
Central Minnesota. Regional Freight Profile
 Central Minnesota Regional Freight Profile Working DRAFT May 21 Minnesota Department of Transportation The purpose of the Central Regional Freight Profile is to document freight movement trends in the
DEPTH-UTILIZATION ANALYSIS FOR ESTIMATING ECONOMIC ACTIVITY SUPPORTED BY DREDGING
 DEPTH-UTILIZATION ANALYSIS FOR ESTIMATING ECONOMIC ACTIVITY SUPPORTED BY DREDGING Kenneth N. Mitchell 1 and James E. Walker 2 ABSTRACT The U.S. Army Corps of Engineers (USACE) has the federal mission of
Bayport, Texas August 27, 2012
 Panama Canal Stakeholder Working Group Bayport, Texas August 27, 2012 Texas Ports - VALUE TO THE NATION Col. Christopher W. Sallese Commander, Galveston District U.S. Army Corps of Engineers This briefing
The Emergence of. Florida s Seaports and Inland Ports. Florida League of Cities - International Relations Committee November 17, 2011
 The Emergence of Florida s Seaports and Inland Ports Florida League of Cities - International Relations Committee November 17, 2011 History of the Global Supply Chain 2 Supply Chain, Circa 1950 Regional
PORTS AND WATERWAYS Educational Series
 PORTS AND WATERWAYS 2017 Educational Series PORTS AND WATERWAYS OVERVIEW Texas ports and waterways are critical gateways for domestic and international freight. The State of Texas ranks second in the nation
A MODAL COMPARISON OF DOMESTIC FREIGHT TRANSPORTATION EFFECTS ON THE GENERAL PUBLIC EXECUTIVE SUMMARY. November 2007
 A MODAL COMPARISON OF DOMESTIC FREIGHT TRANSPORTATION EFFECTS ON THE GENERAL PUBLIC EXECUTIVE SUMMARY November 2007 Prepared by CENTER FOR PORTS AND WATERWAYS TEXAS TRANSPORTATION INSTITUTE 701 NORTH POST
Port of Thunder Bay [Lake Superior] Canada s Gateway to the West
![Port of Thunder Bay [Lake Superior] Canada s Gateway to the West](/thumbs/71/65587758.jpg "Port of Thunder Bay [Lake Superior] Canada s Gateway to the West") Port of Thunder Bay [Lake Superior] Canada s Gateway to the West Port of Duluth-Superior [Minnesota/Wisconsin] coal, iron ore, grain, and limestone to cement, salt, wood pulp, steel coil, wind turbine
Port of Thunder Bay [Lake Superior] Canada s Gateway to the West Port of Duluth-Superior [Minnesota/Wisconsin] coal, iron ore, grain, and limestone to cement, salt, wood pulp, steel coil, wind turbine
Analyst: Meilin C. Pierce Spring Recommendation: Hold Target Stock Price (12/31/2016): $120
: $120") Recommendation: Hold Target Stock Price (12/31/2016): $120 1. Reasons for the Recommendation My recommendation is to hold Union Pacific Corporation (UNP) because my forecast shows that the stock is currently
Recommendation: Hold Target Stock Price (12/31/2016): $120 1. Reasons for the Recommendation My recommendation is to hold Union Pacific Corporation (UNP) because my forecast shows that the stock is currently
Missouri Freight Transportation Economy on the Move. Waterway Freight. Missouri Economic Research and Information Center
 Missouri Freight Transportation Economy on the Move Waterway Freight Waterway Industry Missouri is home to 14 public Port Authorities and over 200 private ports operating on over 1,000 miles of waterways
BOARD OF TRUSTEES OF THE GALVESTON WHARVES Tariff Circular No. 6
 1 st Revised Page 29 ISSUED: MAY 24, 2002 EFFECTIVE: JULY 1, 2002 LOADING AND UNLOADING SERVICES (C) 505 The service of loading and unloading rail cars and motor trucks is performed by freight handlers
ST. LAWRENCE SEAWAY SCHEDULE OF TOLLS 2007
 ST. LAWRENCE SEAWAY SCHEDULE OF TOLLS 2007 INTERPRETATION 1. The definitions in this section apply in this Schedule. bulk cargo means cargo consisting of goods, loose or in mass, that generally must be
U.S. Department of Transportation Maritime Administration
 U.S. Department of Transportation Maritime Administration Organization of American States Hemispheric Conference on Inland Ports, Waterways, and Dredging: Inland Transport as an Engine for Competitiveness
Port of Algoma. Focal Point of the Great Lakes Region
 Port of Algoma Focal Point of the Great Lakes Region Overview Essar Global Fund Ltd s Investments ENERGY PORTS & INFRASTRUCTURE METALS & MINING SERVICES Oil & Gas #2 largest single location refineries
Inside the Port of Long Beach: Challenges & Opportunities
 Inside the Port of Long Beach: Challenges & Opportunities verview POLB Fact Sheet POLB Organization & Operation Public Policy & the POLB Challenges & Opportunities Your Opportunity POLB Fact Sheet verview
Distribution & Global Logistics
 Say Yes To Aerospace in Virginia Distribution & Global Logistics 1 Virginia s Distribution & Global Logistics Industry Employs over 69,000 people, primarily in Trucking, Warehousing, and Transportation
Statement on Marine Transportation
 Page 1 Introduction Statement on Marine Transportation The U.S. Marine Transportation System (MTS) consists of ports, coastal and inland waterways, the Great Lakes, and the St. Lawrence Seaway and is an
Centered on global trade.
 Centered on global trade. A world of customers and suppliers is as close as the Port of Little Rock. The Little Rock Port Authority (LRPA) was organized in 1959 to oversee the Port and provide intermodal
Factors Affecting Transportation Decisions. Transportation in a Supply Chain. Transportation Modes. Road freight transport Europe
 Transportation in a Supply Chain Factors Affecting Transportation Decisions Carrier (party that moves or transports the product) Vehicle-related cost Fixed operating cost Trip-related cost Shipper (party
Chapter 1 Introduction
 Chapter 1 Introduction KEY POINTS The amount and value of freight are critical components of the overall economic health of Missouri. Missouri s multimodal freight system supports the movement of trucks,
USDA s Perspective on Agricultural Transportation Priorities
 Bruce Blanton Director, Transportation Services Division USDA s Perspective on Agricultural Transportation Priorities Ag Transportation Summit August 4, 2015 Rosemont, IL Why Are We At This Summit? Transportation
The Impacts of Unscheduled Lock Outages
 The Impacts of Unscheduled Lock Outages Submitted to Prepared for: The National Waterways Foundation and The U.S. Maritime Administration Center for Transportation Research The University of Tennessee
WINDSOR PORT AUTHORITY
 By-Law No. 1 WINDSOR PORT AUTHORITY a By-Law fixing the fees to be paid to enter or use the Port of Windsor May 1, 2017 By-Law No. 1 WINDSOR PORT AUTHORITY a By-Law fixing the fees to be paid to enter
STRENGTHENING YOUR PORT S FINANCIAL STABILITY THROUGH DIVERSIFICATION
 STRENGTHENING YOUR PORT S FINANCIAL STABILITY THROUGH DIVERSIFICATION A Case Study of the Vancouver Fraser Port Authority s Natural Advantages and Diversification Strategies Larry Sawrenko, Director Finance
Bank of America Corporation Estimated economic benefits of the Environmental Business Initiative September 2017
 Bank of America Corporation Estimated economic benefits of the Environmental Business Initiative 2013-2016 September 2017 Contents Executive summary... 1 1. Bank of America Environmental Business Initiative...
Ports & Pilotage Authorities Case Studies
 Nicom Maritime Suite 8, 6960 Mumford Rd. Halifax, Nova Scotia Canada B3L 4P1 Ph: 877-454-4499 www.nicommaritime.com Ports & Pilotage Authorities Case Studies Halifax Port Authority Vessel Traffic Management
Creating Baseline Analytics and Automated Reporting for Improved Decision Making in the Maritime Transportation System
 Creating Baseline Analytics and Automated Reporting for Improved Decision Making in the Maritime Transportation System Jason Tieman, Director of Maritime Solutions June 26-28, 2012 Better visibility leads
PRINCE RUPERT PORT AUTHORITY
 PRINCE RUPERT PORT AUTHORITY Port of Prince Rupert Proposed 2015 Port Tariff Effective Date: June 1, 2015 Notice to Public This notice is authorized pursuant to Section 49 of the Canada Marine Act. Amendments
Overview of America s Freight Railroads
 Overview of America s Freight Railroads Association of American Railroads August 2017 Summary From one end of the country to the other, America is connected by the best freight rail system in the world.
Chapter 9 Domestic U.S. and International Logistics
 Chapter 9 Domestic U.S. and International Logistics TRUE/FALSE 1. The responsibility of transportation is to create both time utility and place utility, which means that products will be delivered at precisely
Morris County Freight Profile
 Morris County Freight Profile 2040 Freight Industry Level Forecasts ABOUT THIS PROFILE The NJTPA has developed a set of alternative freight forecasts to support transportation, land use, and economic development
Los Angeles Area Chamber of Commerce, 08/05/14
 Los Angeles Area Chamber of Commerce, 08/05/14 Overview California s global trade position Trade Corridors Improvement Fund (TCIF) Federal and State Encouragement & Requirements California Freight Advisory
Paul F. Richardson-Short-Sea Shipping Session. Marine Board Spring Meeting-May Short-Sea Shipping.
 Short-Sea Shipping. Paul F. Richardson Associates, Inc. (PFRA) believes that Short-Sea Shipping or Domestic Coastwise Shipping (or coastwise), will be revitalized and become a commercially viable alternative
Review of Inland Navigation Needs: Shipper and Carrier Perspectives
 Transportation Research Board 2002 Annual Meeting Review of Inland Navigation Needs: Shipper and Carrier Perspectives Mark E. Stevens Ingram Barge Company United States Navigable Waterways System is an
Economic Impacts of Greyhound Bus Passengers Visiting New York City
 Economic Impacts of Greyhound Bus Passengers Visiting New York City SUBMITTED TO Greyhound Lines, Inc. SUBMITTED BY Nathan Associates Inc. Arlington, Virginia August 2, 2004 www.nathaninc.com Economic
Maritime Administration
 Maritime Administration North Atlantic Gateway Office America s Marine Highway Program Update Delaware Valley Regional Planning Commission - July 2011 MARAD s Mission To improve and strengthen America
Economic Impact Analysis of Bulk Liquid Storage Facilities at the Port of Grays Harbor
 Economic Impact Analysis of Bulk Liquid Storage Facilities at the Port of Grays Harbor September 5, 2013 Prepared for: Westway Terminal Company LLC and Imperium Renewables Inc. ECONorthwest The KOIN Tower
Class I Railroad Statistics
 Class I Railroad Statistics Class I Railroads Class I Railroads are U.S. line haul freight railroads with operating revenue in excess of $266.7 million. Two Canadian railroads, Canadian National Railway
Investor Presentation February 2018 Slide 1. Investor Presentation February 2018
 Investor Presentation February 2018 Slide 1 Investor Presentation February 2018 Forward Looking Statements Statements made during this presentation that set forth expectations, predictions, projections
Institutional and Social Resilience Strategies to Manage Fragile Infrastructure
 Institutional and Social Resilience Strategies to Manage Fragile Infrastructure Sub M as Part of a Resilience Governance Model Dr. Craig Philip and Paul Johnson VECTOR Vanderbilt Center for Transportation
National Protection and Programs Directorate Office of Cyber and Infrastructure Analysis
 1 Overview One of the Nation s most economically vital systems, the iron mining integrated steel production manufacturing supply chain is potentially one of the least resilient to disruption. The Poe Lock
Alabama State Port Authority
 Alabama State Port Authority Port Update IFFCBANO June 6, 2014 www.asdd.com Port of Mobile Excellent Transportation Infrastructure I-10 & I-65 5 Class 1 Railroads (BNSF, CN, CSX, KCS, NS) Rail Ferry Service
Environmental Benefits of Transportation Planning & Future Freight Policy. AAPA Energy and Environment Seminar Chicago September 17, 2014
 Environmental Benefits of Transportation Planning & Future Freight Policy AAPA Energy and Environment Seminar Chicago September 17, 2014 Environmental Benefits of Transportation Planning & Future Freight
SWOT Analysis of Commodity Flow Datasets
 SWOT Analysis of Commodity Flow Datasets prepared for FDOT Transportation Statistics Office prepared by RS&H, Inc. 5/6/2015 Background Many users work with commodity flow data Modelers GIS analysts Policy
Port of Prince Rupert: Value of Trade Analysis
 Port of Prince Rupert: Value of Trade Analysis Prepared for Prince Rupert Port Authority Prepared by InterVISTAS Consulting Inc. 17 February 2012 i Table of Contents 1. Introduction... 1 1.1 Port of Prince
U.S. Shipper s Letter of Instruction (SLI) Completion Guide U.S. PRINCIPAL PARTY IN INTEREST (USPPI) ULTIMATE CONSIGNEE
 Completion Guide U.S. PRINCIPAL PARTY IN INTEREST (USPPI) ULTIMATE CONSIGNEE") U.S. Shipper s Letter of Instruction (SLI) Completion Guide This document is intended only as a general reference for completion of Expeditors Shipper s Letter of Instruction (SLI) form, which can be used
U.S. Shipper s Letter of Instruction (SLI) Completion Guide This document is intended only as a general reference for completion of Expeditors Shipper s Letter of Instruction (SLI) form, which can be used
Challenges and Opportunities for Canada s Freight Railways
 Challenges and Opportunities for Canada s Freight Railways Ninth Annual CILTNA Transportation Outlook Conference Cliff Mackay, President & CEO The Railway Association of Canada May 10, 2010 Ottawa, Ontario
The Port of Baltim re Welcomes
 The Port of Baltim re Welcomes Spring 2016 Conference Discussion Topics Role of the MPA Terminals On Dock Capability Rail Access Port Collaboration Future Mission: Cargo = Jobs The mission of the Maryland
New options for supply chain efficiency from Asia to the Americas
 New options for supply chain efficiency from Asia to the Americas dpworld.ca/tpm For decades, shipping routes from Asia to the Americas have been dominated by a few well known logistics hubs southern California
USING IMPLAN TO ASSESS LOCAL ECONOMIC IMPACTS. David Mulkey and Alan W. Hodges. Introduction 1
 USING IMPLAN TO ASSESS LOCAL ECONOMIC IMPACTS David Mulkey and Alan W. Hodges Introduction 1 Policymakers, industry officials, and others often need information on the total economic impacts of specific
Estimation and Analysis of Multifactor Productivity in Truck Transportation:
 Estimation and Analysis of Multifactor Productivity in Truck Transportation: 1987-2003 ANTHONY D. APOSTOLIDES, Ph.D. February 2009 U.S. Department of Transportation Research and Innovative Technology Administration
Delaware Department of Transportation Agriculture Supply Chain Study: Transportation Supply Chain Analysis ihs.com
 IHS TRANSPORTATION CONSULTING Delaware Department of Transportation Agriculture Supply Chain Study: Transportation Supply Chain Analysis ihs.com Overview of Findings Delmarva Freight Summit June 24 th,
Importing to the U.S.: Key requirements you need to be aware of
 Importing to the U.S.: Key requirements you need to be aware of Eight areas of the importing process you should familiarize yourself with before you ship your goods to the U.S. If you re new to international
by MARK M. SWEENEY senior principal, McCallum Sweeney Consulting Physical Factors: Site and Infrastructure
 Page 1 of 5 SPECIAL ADVERTISING SECTION EMERGING LOGISTICS HUBS JANUARY 2008 Places That Move (cover) Southwest Louisiana: Site Rich and Ready Liberty Property Trust Planes, trains & shipping lanes Think
International Maritime Trade Benefits the Nation s Economy
 Benefits the Nation s Economy Bruce Lambert, Executive Director Institute for Trade and Transportation Studies - 10 Veterans Blvd., New Orleans, LA 70124 T: 540-455-9882 E: bruce@ittsresearch.org Working
TRUCKING DANGEROUS GOODS IN CANADA, 2004 to 2012 Sagal Searag, Gregory Maloney and Lawrence McKeown Statistics Canada
 TRUCKING DANGEROUS GOODS IN CANADA, 2004 to 2012 Sagal Searag, Gregory Maloney and Lawrence McKeown Statistics Canada Introduction Recent events have heightened public awareness concerning the transportation
Partnerships in Capital Projects. AAPA Facilities Engineering Seminar and Expo
 Partnerships in Capital Projects AAPA Facilities Engineering Seminar and Expo November 6-8, 2013 1 There are Old Ways and New Ways of Doing Things Fore Front: New Oakland San Francisco Bay Bridge Background:
TRANSPORTATION 101 Today and Tomorrow. Moving People and Goods
 TRANSPORTATION 101 Today and Tomorrow Moving People and Goods What is the Transportation Commission? An independent, seven-member body of citizens appointed by the Governor for six-year terms and representing
The economic impact of Blount Island Command
 ABSTRACT The economic impact of Blount Island Command Hassan Pordeli, Jacksonville University Peter Wynkoop The HPW Group, LLC This report provides a detailed analysis of the economic impact of the U.S.
Q1 Fiscal 2016 Statistics
 Q1 Fiscal 2016 Statistics FedEx Corporation Financial and Operating Statistics First Quarter Fiscal 2016 September 16, 2015 This report is a statistical supplement to FedEx s interim financial reports
Freight Transportation Megatrends
 Freight Transportation Megatrends Copyright 2006 Global Insight, Inc. Freight Demand Modeling: Tools for Public-Sector Decision Making Conference Paul Bingham Global Insight, Inc. Washington, DC September
Cargo - Port Facilities Rates & Tariffs
 Cargo - Port Facilities Rates & Tariffs FMC Tariff No. 2 SECTION IV - VESSEL CHARGES/CARGO CHARGES HARBOR FEE 400 All vessels engaged in foreign, coastwise or intercoastal trade, arriving in the port limits,
MANUFACTURING IN IOWA
 MANUFACTURING IN IOWA NOVEMBER 2011 INSIDE: SECTOR SIZE 2 KEY INDUSTRIES EARNINGS 4 EXPORTS 5 JOB TRENDS 6 GDP TRENDS 7 COUNTY DEPENDENCE 3 8 OVERVIEW Iowa s competitive strengths in manufacturing emerged
The Economic Impact of the New York-New Jersey Port Industry Report
 The Economic Impact of the New York-New Jersey Port Industry 2017 Report Prepared by: Anne Strauss-Wieder Director, Freight Planning North Jersey Transportation Planning Authority As a member of the Council
SCHEDULE OF CHARGES ON GOODS OR CARGO LANDED, SHIPPED, TRANSSHIPPED OR STORED. Short Title. Interpretation
 SCHEDULE OF CHARGES ON GOODS OR CARGO LANDED, SHIPPED, TRANSSHIPPED OR STORED 2018 Short Title 1. This Schedule may be cited as the Schedule of St. Lawrence Seaway Wharfage and Storage Charges. 2. In this
Milton and CN A Partnership
 DID-5-15 APPENDIX A Milton and CN A Partnership Milton and CN A Partnership March 2014 0 Milton and CN CN has been in Milton for more than 100 years Our rail line runs through the community, carrying a
SHORT SEA SHIPPING IN CANADA: LESSONS LEARNED AND RESEARCH MODEL FOR THE DEVELOPMENT OF NEW SERVICES Marc-André Roy, CPCS 1 Peter Harrison, CPCS
 SHORT SEA SHIPPING IN CANADA: LESSONS LEARNED AND RESEARCH MODEL FOR THE DEVELOPMENT OF NEW SERVICES Marc-André Roy, CPCS 1 Peter Harrison, CPCS Introduction Short sea shipping (SSS) has been the subject
Notice of Tariff Change Effective January 1, 2014
 Notice of Tariff Change Effective January 1, 2014 Port of Seattle Terminals Tariff No. 5 is revised as follows: RATE CHANGES: ITEM 1460 SMALL LOTS FEE A charge of $116.09 increased from $114.33 will be
Chapter 10 Corn Futures
 Chapter 10 Corn Futures 10100. SCOPE OF CHAPTER This chapter is limited in application to Corn futures. The procedures for trading, clearing, inspection, delivery and settlement of Corn futures not specifically
TIGER Logistic Link INCOTERMS 2010 INCOTERMS. The rules come into effect on January 1, Israel Tel.:
 2010 The rules come into effect on January 1, 2011 CONTENTS Introduction to Incoterms 2010... 3 Incoterms Groups... 4 Incoterms Classes... 4 Notes on Incoterms... 5 E TERMS... 7 EXW... 7 F TERMS... 9 FCA...
Navios South American Logistics Inc. Company Presentation
 Navios South American Logistics Inc. Company Presentation April 2013 Forward Looking Statements This presentation contains forward-looking statements (as defined in Section 27A of the Securities Act of
NC State Ports Authority. 21 st Century Transportation Intermodal Committee February 21, 2008 NC State Ports Authority Tom Eagar, CEO
 NC State Ports Authority 21 st Century Transportation Intermodal Committee February 21, 2008 NC State Ports Authority Tom Eagar, CEO NC State Ports Authority Facts at a Glance 2 Enterprise agency unique
Terminal Opportunities & Challenges. Peter I. Keller NYK Line April 24, 2006
 Terminal Opportunities & Challenges Peter I. Keller NYK Line April 24, 2006 . First, a word about NYK 2 Sea Earth Air Logistics Integrator Hardware / Assets 660 Vessels Sea Software / Services NYK Line
Inland Port Cargo Complex
 Inland Port Cargo Complex Regional Approach for Ports A statewide improvement Connects five plus seaports Promotes connectivity utilizing existing transportation network Improves rail efficiencies Relocates
Best Practices for Transportation Management
 Best Practices for Transportation Management A White Paper from Ozburn-Hessey Logistics www.ohlogistics.com/countonus.html or 800-401-6400 Introduction The mantra for all transportation professionals is
INLAND WATERWAY OPERATIONS
 CHAPTER 4 INLAND WATERWAY OPERATIONS This chapter implements QSTAG 592. INTRODUCTION Inland waterway (IWW) operations are used when the theater of operations has an established inland waterway system of
YOUR GATEWAY TO MOLDOVA AND SOUTHEASTERN EUROPE
 YOUR GATEWAY TO MOLDOVA AND SOUTHEASTERN EUROPE Location and Regional Profile Giurgiulesti International Free Port (GIFP) is situated at 133.8 km / 72.2 nautical miles from the Black Sea on the maritime
Billions of dollars per year in: Savings in shipping costs Taxes and purchases that support tens of thousands of additional jobs Avoided highway
 Georgia s Freight Rail Advantage ACCG Transportation Mobile Classroom May 17, 2012 Freight Railroads Are Critical to the Economy Indispensable link connecting markets here and abroad huge global competitive
Southern Alberta: Growth of Import and Export Opportunities for West Coast Ports
 Southern Alberta: Growth of Import and Export Opportunities for West Coast Ports Stakeholders for the Study Port of Prince Rupert Province of Alberta Calgary Regional Partnership Calgary Economic Development
Rural Ports: An Important Asset for Economic Development
 Center for Logistics, Trade and Transportation Research supported by Economic Development Training for Mississippi Port Directors funded by the Mississippi Department of Transportation (MDOT) Rural Ports:
EP US RAIL SERVICE ISSUES - DATA COLLECTION
 1. System-Average Train Speed by Train Type for the Reporting Week (MPH) Intermodal 31.7 AAR train speed measure. Calculated by dividing train-miles by total Grain unit 24.0 hours from origin to destination,
Agricultural Trade Flows through Texas Ports: Recent Trends and Outlook
 Agricultural Trade Flows through Texas Ports: Recent Trends and Outlook Texas Roundup APHIS CBP TDA August 18, 2016 College Station, TX Flynn Adcock, International Program Coordinator Luis A. Ribera, Associate
Global Partners LP (GLP) Investor Presentation May Bakken Product Markets & Takeaway Capacity Congress January 29, 2014 Denver, CO
 Investor Presentation May Bakken Product Markets & Takeaway Capacity Congress January 29, 2014 Denver, CO") Global Partners LP (GLP) Investor Presentation May 2012 Bakken Product Markets & Takeaway Capacity Congress 2014 January 29, 2014 Denver, CO Global Partners at a Glance Leader in the logistics of transporting
Global Partners LP (GLP) Investor Presentation May 2012 Bakken Product Markets & Takeaway Capacity Congress 2014 January 29, 2014 Denver, CO Global Partners at a Glance Leader in the logistics of transporting
Trade Transformation. CBP Initiatives for 21 st Century Trade. September 2012
 Trade Transformation CBP Initiatives for 21 st Century Trade September 2012 1 Evolving our Mission 2 A Day at the U.S. Border CBP protects more than: 5,000 miles of border with Canada 1,900 miles of border
THE NEW YORK, SUSQUEHANNA AND WESTERN RAILWAY
 THE NEW YORK, SUSQUEHANNA AND WESTERN RAILWAY NYSW 8001 - I - SWITCHING RULES AND MISCELLANEOUS CHARGES - AT STATIONS ON THE NEW YORK, SUSQUEHANNA AND WESTERN RAILWAY This tariff is governed by NYSW Conditions
Potential of Coastal Shipping and Inland Navigation in Republic of Korea
 Potential of Coastal Shipping and Inland Navigation in Republic of Korea Dong Won HAN Korea Shipping Association UNESCAP Regional Conference for Logistics Service Providers CONTENTS 2 1Seaports and Routes
GST/HST Information for Freight Carriers
 GST/HST Information for Freight Carriers RC4080(E) Rev. 10 Is this booklet for you? T his booklet explains how the goods and services tax/harmonized sales tax (GST/HST) applies to domestic and international