Section 3.17 Road Traffic and Transport
|
|
|
- James Ford
- 6 years ago
- Views:
Transcription


1 Section 3.17 Road Traffic and Transport
2 Terminal 0 Environmental Impact Statement Abbot Point Coal Terminal 0 EIS Adani
3 3.17 Road Traffic and Transport The purpose of this section is to describe the current road transport network and usage, anticipated increases in the movement of traffic and impacts resulting from the construction and operation of the Project. This traffic assessment has been undertaken in accordance with the EIS Guideline requirements. For the purposes of this assessment, all permanent terrestrial components of the Project are situated entirely within Strategic Port Land (SPL). Some temporary support facilities, such as construction accommodation camp and material storage/laydown areas, will be located on land outside the Port precinct. Traffic demands likely to be generated during the construction and operation of the Project may be broader than this area, so have been reviewed and potential traffic impacts identified. The assessment describes the nature, magnitude and significance of road traffic and transport impacts and discusses the mitigation measures proposed to address these potential impacts. The technical report for this section is provided in Appendix E9. Shipping transport is addressed within Section 3.16 Shipping Relevant Legislation and Guidelines Road traffic and transport for the Project is governed by a range of legislation and guidelines described in Section 3.1 Legislation, Land Use and Planning. There is no Commonwealth road transport legislation that is applicable to the Project. However, a brief description of the relevant Queensland road transport legislation is provided below Queensland Legislation Transport Infrastructure Act 1994 The Transport Infrastructure Act 1994 (TI Act) allows for and encourages effective integrated planning and efficient transport infrastructure management. Related legislation and regulations, including the Transport Operations (Road Use Management Vehicle Standards and Safety) Regulation 2010, provide standards limiting noise and emissions from vehicles. See Section 3.1 Legislation, Land Use and Planning, for an overview of regulatory requirements for the Project under the TI Act. Transport Operations (Road Use Management) Act 1995 The Transport Operations (Road Use Management) Act 1995 (TO Act) manages road use in Queensland in order to establish a safe and efficient road transport system. Vehicles travelling to and from the Project must comply with requirements of the Act including: Established road rules; Vehicle and driver identification requirements; Monitoring requirements; Access and road network controls; and Traffic management requirements. Terminal 0 Environmental Impact Statement 3-558
4 Relevant Guidelines In preparing this assessment, the following guidelines and planning documents have been used: Department of Transport and Main Road s Guidelines for Assessment of Road Impacts of Development, (April 2006); and Department of Transport and Main Road s Road Planning and Design Manual, (May 2010) Assessment Method Investigations were undertaken to gather the relevant traffic data applicable for the Project during construction and operation. The transport aspects investigated include the following: Review of the existing road network in the vicinity of the Project; Review of the existing traffic volumes provided by the Queensland Department of Transport and Main Roads (DTMR) for the road segments identified as part of the potential haulage and transport routes for the Project; Review of crash statistics provided by DTMR for all road segments relevant to the Project; Estimation of developmental traffic demand during construction and operation of the Project; Estimation of future traffic demand for scenarios with and without the influence of the Project; Identification of likely impacts to the community resulting from the additional traffic. This includes: - Locations where traffic and pavement impacts are likely to be significant - Impacts on vehicle safety - Impacts on sensitive receivers within the community Identification of possible mitigation measures required to address impacts on the road network and pavement due to the increased traffic demand from the Project. Consultation was undertaken with the Whitsunday Regional Council (WRC) and DTMR to acquire information about school bus routes, accident data, traffic volumes and intersection data for areas relevant to the Project. The construction and operation of the Project is planned to occur in two phases nominally over a five to six year period and will be timed to correspond with production outputs at the Adani Carmichael Mine. Assessment of traffic impacts was divided into two primary stages for the Project; construction stage and operational stage. The traffic assessment has been based on a continuous construction schedule, over a three year period, to address any potential changes in the phasing. Construction will not occur for any less than a three year period, and therefore this assessment has modelled the Project based on the most intensive possible schedule (see Section 2 Project Details, for a further outline of the Project phasing). The operating life of the Project shall relate to production from the Carmichael Coal Mine. Terminal 0 Environmental Impact Statement 3-559
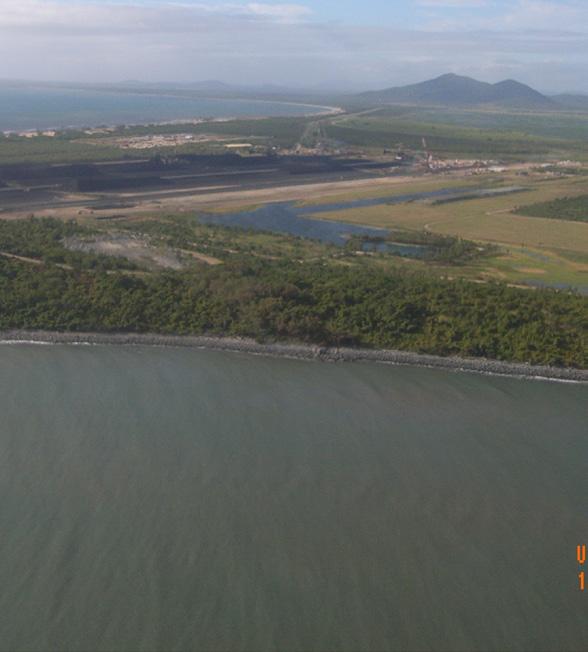
5 Existing Operations, Transport Networks and Infrastructure Existing Road Network The local roads, external to the Abbot Point SPL, are administered by the WRC, while the Bruce Highway is managed by DTMR. The Bruce Highway provides the primary road transport corridor along the eastern seaboard of Queensland and is the main highway for vehicles travelling to the site. The port access road (Abbot Point Road) is within SPL and is maintained by North Queensland Bulk Ports Corporation (NQBP). The hierarchy and description of surrounding access and external roads is provided in Table Table Local Road Hierarchy Road Authority Classification Carriageway Width Description Abbot Point Road NQBP Access Road 7.0m Bruce Highway DTMR National Strategic 9.0m Source: TTM Traffic Engineering Report (Appendix E9) Fully sealed carriageway, two lanes Fully sealed carriageway, two lanes plus shoulders Bruce Highway The Bruce Highway forms part of the Australian National Highway Network (AUSLINK) and is a major north-south route along the Brisbane-Cairns corridor. To the north of Brisbane, the Bruce Highway is a divided multi-lane road to Noosa. North of Noosa the Bruce Highway is primarily a two lane rural highway with sections of four lanes near regional centres. The Bruce Highway links the regional centres of Rockhampton, Mackay and Townsville via Proserpine and Bowen. This section focuses on the Bruce Highway corridor between Townsville, Bowen and Proserpine. It is anticipated that the majority of traffic generated by the development will access these key areas. This segment of highway has one lane in each direction with sealed shoulders on both sides and a posted speed limit of 100 kph. There are limited public transport, walking and cycling facilities along this segment of the Highway, and no educational or child facilities with direct access to the highway. The Bruce Highway between Proserpine and Cairns carries between 2,500 and 8,000 vehicles per day (Appendix E9) Abbot Point Road Abbot Point Road provides the main access route into the Project site and runs in a north south direction connecting the main port facilities in the north to the Bruce Highway in the south (Figure 3-103). The road has one lane in each direction with sealed shoulders on both sides. Terminal 0 Environmental Impact Statement 3-560


6 147 0'0"E '0"E 148 0'0"E '0"E 149 0'0"E '0"E 19 0'0"S 19 0'0"S '0"E 19 30'0"S 19 30'0"S TOWNSVILLE way BOWEN 20 0'0"S Ayr-Da lb erg Rd Hi g h D lls e rs Bu rd Fa am d Flin H ig ay hw Bru ce in ek 20 0'0"S Port of Abbot Point en ta op m a hw ig y Pe ak D ow n s H 21 30'0"S De yd g or Gr e 21 30'0"S n we Bo 21 0'0"S lr oa d 21 0'0"S 20 30'0"S 20 30'0"S Rd MACKAY l ve lo eve l nta pme Ro a 22 0'0"S 22 0'0"S d Moranbah 22 30'0"S 22 30'0"S Mount Rolfe '0"E Abbot Point Coal Terminal 0 (T0) Project 147 0'0"E Figure Project Location and Regional Road Network Legend Major Town Major Highway/Road GBRMP Boundary Job: B12705_080-R1_TransportRegional Date: 23/10/ '0"E 148 0'0"E '0"E 0 12, '0"E 25,000 50, '0"E µ Metres DISCLAIMER CDM Smith has endeavoured to ensure accuracy and completeness of the data. CDM Smith assumes no legal liability or responsibility for any decisions or actions resulting from the information contained within this map. Data source: Roads, rail from Geoscience Australia; Base Layer by ESRI, All other data by DERM, 2010; CAIRNS TOWNSVILLE MOUNT ISA ROCKHAMPTON BRISBANE "
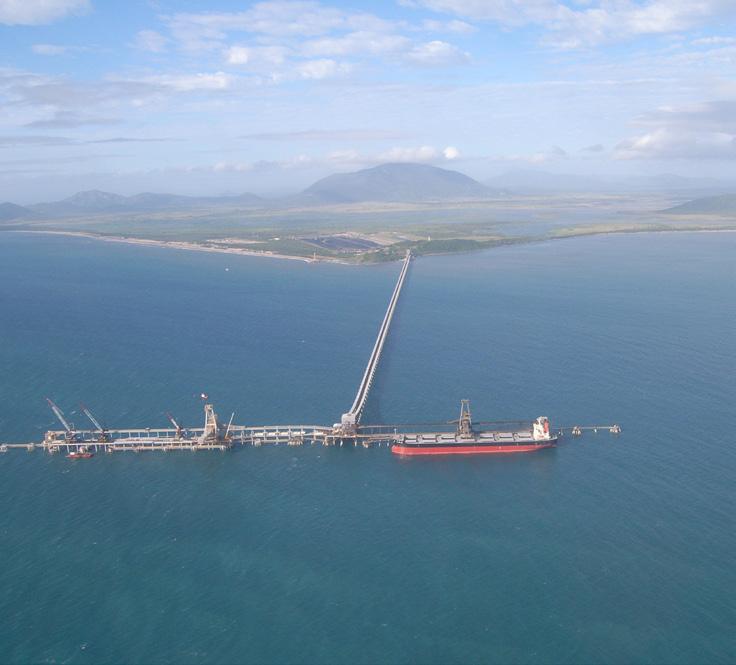
7 Major Structures The port access route includes a separated road and rail bridge that crosses Saltwater Creek (Figure 3-104). These structures have been designed to cater for general port traffic demands and are capable of accommodating oversize vehicles. There are also various bridge and culvert structures along the Bruce Highway corridor between Townsville, Bowen and Proserpine. As noted, the Bruce Highway is a strategic highway and it is expected that the associated highway structures will be able to cater for the anticipated development traffic demands Public Transport and School Bus Routes There are no school bus stops along Abbot Point Road or in the vicinity of the Project. However, there are existing school bus services that utilise sections of the Bruce Highway, which provides access to townships along the corridor, with the school buses generally operating between 7:30 am and 8:30 am; and 2:30 pm and 3:30pm Future Road Improvement Projects The DTMR Road Implementation Program to for the Mackay/Whitsunday Region, outlines proposed road improvement projects within the vicinity of the Project. The document has been used to identify any improvement works scheduled for roads that are relevant to the Project. It is noted that roads inland of the Mackay/Whitsunday Region were particularly impacted by flooding which affected large tracts of Queensland in early As such, a significant proportion of the Queensland State budget is allocated to road maintenance requirements, with AU$40.4 million of planned works along 72 km of the Bruce Highway through Isaac, Mackay and the WRC areas. There are plans to upgrade the Bruce Highway into Townsville from the south, however, no scheme funding has been identified at this stage Existing Rail The Queensland North Coast rail line provides connectivity between the major urban centres along the coast, with stops at Mackay, Proserpine, Bowen, Home Hill, Ayr, Giru and Townsville. The nearest train station to the Project is located on Bootooloo Road, approximately 3 km south-east of Bowen and approximately 28 km from the Project boundary. Given the nature and location of the workforce proposed for the Project (see Section 3.21 Social Matters) it is unlikely that any staff or contractors will travel by train and there will be limited use of rail for transport of plant or equipment for the Project. The Port of Abbot Point is currently served by heavy rail with connections to various inland coal mines to the south-west of the site. There are future plans for upgrading the heavy rail access which is intended to enhance the existing port capacity. As part of the Project new rail loops will be constructed within the common rail corridor. The proposed common rail corridor will be concentric to the existing T1 rail loop, thereby minimising the extent of new infrastructure required at the site (see Section 2.2.1). The rail corridor has been designed to accommodate both narrow and standard rail options. Terminal 0 Environmental Impact Statement 3-562
8 Staffing Operation Existing Abbot Point Coal Terminal Staffing Model For the purposes of comparison, the following staff numbers are representative of the existing facility (50 Mtpa) and are based on 2012 levels which had a planned operational throughput of 20 Mtpa (Table 3-119): Table Existing Staff Numbers (T1) Employment Personnel Numbers Administration Staff 50 Maintenance and Operations Staff 82 Apprentices 17 Contractors 35 Total 184 Source: TTM Traffic Engineering Report (Appendix E9) The maintenance crew is currently structured to operate during day time hours only. Maintenance employees form 2 teams, with each team working a 12 hour shift each day (6am-6pm), with a 7 days on/7 days off rotating roster. The operations team is required to keep the Terminal operating on a continuous 24 hour production mode, to receive trains and load vessels. The operating crew includes both production and a skeleton maintenance crew, primarily to manage system failures between 6pm to 6am (when the main maintenance crew is off shift). The crew is broken up into 4 teams with each team working a 12 hour shift, on a 7 days on/7 days off rotating roster Project Staffing Model The anticipated workforce and staffing numbers used for this traffic analysis have been set at a number relevant to the traffic component of the Project. At full operating capacity (70 Mtpa), the Project is anticipated to require the following staff numbers (Table 3-120): Table Anticipated Staff Numbers (T0) Employment Personnel Numbers Administration Staff 73 Maintenance and Operations Staff 108 Apprentices 26 Contractors 29 Total 236 Source: TTM Traffic Engineering Report (Appendix E9) The main consideration to determining the change between Project and the existing Terminal staffing structure is the increase in automation for the Project, both operationally and logistically. As a result of increased automation, less staff will be required per Mtpa of coal processed at full operation. A total of between 200 and 250 employees are planned to operate the Terminal at 70 Mtpa. At full capacity, maintenance and operational crewing is planned to be structured for a continuous 24 hour operation to receive trains, load vessels, and execute continuous minor and major maintenance tasks (both planned and unplanned), to keep the Terminal operating at full capacity. As a consequence, both operating and maintenance site teams will be broken up in to 4 equally sized teams. Each team will work a 12 hour shift, on a 7 days on/7 days off continuous rotating Terminal 0 Environmental Impact Statement 3-563
9 roster. In addition to the above crews, there will also be a weekday permanent maintenance crew that will be tasked to perform project work or support the day time shifts Construction Workforce It is estimated the Project would require approximately 500 workers during the construction phases (see Section 2 Project Details, for a detailed description of the two construction phases). The construction workforce will typically consist of permanent Fly-In Fly-Out (FIFO) staff who are likely to reside near regional centres. The accommodation for workers during the construction stage is likely to be located along Abbot Point Road or in the vicinity of the Merinda Township. It is expected that transport between the worker accommodation village and the site will be predominantly via buses, with limited private transport. The transfer of shift staff by buses is a general requirement of Occupational Health and Safety standards due to the length of shifts. The remaining construction work force will be sourced from the local population and subcontractors. The sub-contractors may participate in drive in/drive out from accommodation centres near Bowen or potentially utilise other accommodation facilities in the surrounding townships of Proserpine and Ayr. Local residents, including local subcontractors, may drive their private vehicles to the site, or utilise the Project s bus services Heavy Vehicle Movements All construction materials transported by the road network will access the site via the Bruce Highway. The Bruce Highway will continue to provide heavy vehicle access to supply the site with equipment, services and resources for the ongoing port operations. The proposed access and haulage routes are identified in Figure Description of Proposed Vehicles The site will be accessed by a full scope of vehicles, from private cars and buses to B-double trucks. Over-Dimensional (OD) vehicles will be required to transport plant and material during the construction phases. The designation type of OD vehicles are those which exceed the following dimensions when loaded: Width of 2.5 m; Height of 4.6 m; and Length of: 12.5 m for a rigid truck, 19 m for an articulated vehicle or 25 m for a B-Double Site Access The Port of Abbot Point is currently accessed via Abbot Point Road which is directly connected to the Bruce Highway. It is proposed that Abbot Point Road will be used as the main staff, contractor, and heavy vehicle access from the Bruce Highway. As the construction activity will be contained within the SPL, it is anticipated that no public roads or accesses will be closed for traffic management purposes. This intersection was recently upgraded to include turning lanes and street lighting. The site access (Bruce Highway/Abbot Point Road intersection) is a typical priority intersection with three approaches including left and right turn lane treatments. Terminal 0 Environmental Impact Statement 3-564


 19 58'0\"S!")

 Existing Rail Quarry Haul")
 Project Figure 3-104 Abbot Point")


10 Existing T '0"E 148 2'0"E 148 4'0"E 148 6'0"E Existing Jetty and Wharf Proposed T0 Berth 19 52'0"S Proposed T0 Jetty 19 52'0"S Proposed T0 MOF Proposed T0 Stockpiles 19 56'0"S 19 56'0"S 19 54'0"S 19 58'0"S 19 54'0"S Queensland North Coast Rail Line Bruce Highway! Abbot Point Quarry 1 (Existing) 19 58'0"S! Abbot Point Quarry 2 (Existing) 20 0'0"S 148 0'0"E Legend Minor Road Bruce Highway (State Controlled) Abbot Point Road (NQBP Controlled) Existing Rail Quarry Haul Route 148 2'0"E Abbot Point Coal Terminal 0 (T0) Project Figure Abbot Point Road Network and Site Access Job: B12705_037-R1_road Date: 23/01/2013 Proposed Road Easement Proposed Common Rail Corridor APSDA Boundary GBRMP Boundary 148 4'0"E ,000 2,000 µ 148 6'0"E Metres DISCLAIMER CDM Smith has endeavoured to ensure accuracy and completeness of the data. CDM Smith assumes no legal liability or responsibility for any decisions or actions resulting from the information contained within this map. Data source: Roads by Geoscience Australia; Terminal data by Adani; Aerial Image by NQBP, 2012; GBRMPA, 2011; All other data by DERM, MOUNT ISA CAIRNS TOWNSVILLE ROCKHAMPTON BRISBANE " 20 0'0"S
11 Traffic Generation, Distribution and Potential Impacts Basis for Traffic Impact Analysis Abbot Point Coal Terminal 0 EIS Adani In establishing the overall traffic demands, it was necessary to review the traffic associated with the existing Port of Abbot Point facilities and the likely level of construction activity that could be generated over the two construction phases. The assessment of traffic generation for the Project s construction stage is split into two vehicular categories; one addressing staff movements, the other addressing direct construction related traffic. The staff category is calculated based on the movement of workers to and from the site and the number of associated trips generated. The second category includes construction traffic predominantly consisting of heavy goods and oversized vehicles. The construction of the Project will nominally occur over a five to six year period, however traffic generation has been based on a three year construction period to address any potential changes to the phasing. The primary tasks involved will be the construction of the coal stockyard, rail and coal transport facilities, trestle jetty and ship berths. The following provides a review of the traffic generation for existing operations, and the proposed generation during the construction and operational stages Existing Operations Traffic Demand As noted, there are 184 existing staff working at the Port of Abbot Point, with four teams working a 12 hour shift, on a 7 days on/7 days off rotating roster. On this basis it is anticipated that approximately 46 staff work each shift and arrive and depart during the shift changes (i.e. between 5:30 am to 6:30 am and 5:30 pm to 6:30 pm). It is therefore estimated that there are approximately 30 vehicles entering and 30 vehicles exiting the site during the shift changes, based on vehicle occupancy of 1.5 workers. The existing port operation requires constant servicing and is supplied with materials (food supplies and maintenance equipment) through an average of 70 service vehicle movements per day. The service vehicles range in size, with the smaller and medium type service vehicles (van, small rigid vehicle, medium rigid vehicle and heavy rigid vehicle) providing the majority of daily service requirements. There are irregular operational requirements for larger loads through the use of articulated vehicles (AV). On average it is estimated that one AV enters the site per working day. In general, most deliveries will be undertaken during the working day with limited activity during the shift change periods. In terms of vehicle distributions, the typical amount of traffic accessing the site from the Bruce Highway is similar in both the north-west (Townsville) and south-east (Proserpine and Mackay) directions with the following breakdown in existing site traffic: AM Peak Period (5:30 am to 6:30 am): 30 private and three service vehicles from north/west; 30 private and three service vehicles from south-east; Off Peak Period (7 am to 5 pm): typically six service vehicles per hour (In/Out); and PM Peak Period (5:30 pm to 6:30 pm): 30 private and three service vehicles from north-west; 30 private and three service vehicles from south-east. Table provides a breakdown of worker movements for a typical daily operation. Terminal 0 Environmental Impact Statement 3-566
12 Table Existing Operational Traffic Shift Day Night Total Workforce 184 Total Rostered Staff 92 Shift Staff Staff Access Bus - - Private Total Staff Movements Vehicles Per Hour (vph) (during peak hour) 60 vph Total peak hour traffic generation, including service vehicles 6 vph Total peak hour traffic generation, including service vehicles 65 vph (In/Out) Daily service vehicle movement 70 vpd Total traffic generation vehicles per day (vpd) 260 vpd (In/Out) Source: TTM Traffic Engineering Report (Appendix E9) Construction Stage Traffic Demands The following provides a breakdown of the likely traffic generation and distribution during the construction stage Construction Stage Heavy Vehicle Traffic Generation The estimation of heavy vehicle traffic is based on general construction requirements, and the most appropriate locations for sourcing of materials. The locations for sourcing material have been divided into five areas as follows: Local within 100 km of the site, includes: Ayr, Bowen, Collinsville and Proserpine; Regional generally within 400 km, such as Charters Towers, Mackay and Townsville; State All areas of Qld; National provided from within Australia, but outside Queensland; and International provided from outside Australia, with delivery most likely via the existing Port. This demand assessment has made several assumptions in respect to the overall scope of works, as follows: The supply of material for construction is anticipated to be required for the following infrastructure: - Rail loops within the common rail corridor and train unloading facilities - Coal stockpile bunds, stackers and associated infrastructure - Conveyors from the coal stockpiles to offshore facilities - Trestle jetty, berthing and ship loading facilities - Site and common user infrastructure including but not limited to roads, telecommunications, electricity, water supply and storage laydown areas Terminal 0 Environmental Impact Statement 3-567
13 - Building and maintenance facilities Transportation of workers via bus between the construction camp and site during construction; Supply of all materials and replacement equipment to operate the site; and Local accomommodation camp likely to be located near Bowen. Items manufactured overseas will be transported to the site by sea directly or via road from regional ports. Locally sourced materials and items will be transport by road. Large components and modules are expected to arrive via the Material Offloading Facility (MOF) which was established in 1982 for the original port development works and subsequently upgraded to service the recent expansion of the terminal to 50 Mtpa. This facility will be further upgraded for the Project to include a roll-on roll-off (RORO) facility and potentially an extension to include a second berthing area. At this stage of the development process there is limited information in relation to the percentage break-down between sea and road transport. This percentage break-down depends on what this comparison is to be based upon (i.e. mass and size of materials or time and number of trips to transport the required materials). In a review of the mass and size of construction materials it is considered that larger materials and operating equipment will be transported by sea, with smaller standard construction materials or plant arriving by road. It is anticipated that this mass and size break-up would be approximately 75% by sea and 25% by road. A major part of the construction activity will be raising the ground level of the site, with infill material likely to be sourced from the existing Abbot Point Quarries located within the SPL (Figure 3-104). It is anticipated that approximately 430,000 m 3 of infill material is required for the Phase 1 construction works and a further 970,000 m 3 will be required for the Phase 2 construction works (see Section 2 Project Details, for a further outline of the Project phasing). Fill will predominately be gravel and less permeable material, and a bulking factor of between 1.2 and 1.3 has been used to determine the necessary truck trips. A truck and trailer set-up will be used to transport the fill material from the quarry to the site. This set-up will allow cartage of 35 tonnes of material per trip (this equates to just over 23 m 3 per trip). Based on 430,000 m 3 of fill, for the Phase 1 construction works, approximately 18,000 truck trips will be required internally within the SPL. For Phase 2, there is a need for approximately 970,000 m 3 of fill, requiring approximately 40,000 truck trips. In assuming a construction time of six months to complete the earthworks for the Phase 1 works only, the frequency of trucks taking fill material to the Project site from the Abbot Point Quarries quarry would be approximately 13 truck movements per hour. This equates to one truck and trailer combination travelling along Abbot Point Road approximately every 5 minutes to and from the quarry. This calculation is based on 9 hours of actual travelling time for a 12 hour working day and a six day working week. For Phase 2 construction works, the frequency of trucks travelling along Abbot Point Road is not expected to increase from the calculated rates above. The duration of the trucks hauling period will increase proportionally for the additional quantity of material which will be required for the Phase 2 works, based on an approximate duration of 14 months. At the commencement of the on-site construction activities, all contractor plant, equipment, temporary offices and amenities will be transported to site via the road network. All locally sourced building materials such as ready mixed concrete, precast concrete products (e.g. reinforced concrete stormwater pipes, manholes and reinforced concrete box culverts) and steel reinforcement will be transported by road. Terminal 0 Environmental Impact Statement 3-568
14 Locally sourced hire equipment and plant such as cranes, concrete pumping trucks, earthmoving plant and equipment, will either be transported or self-driven via the existing road network. Roadway pavement and rock armour material will likely be sourced from the existing Abbot Point Quarries 1 and 2 within SPL (Figure 3-104) and transported by road (Abbot Point Road) to the construction-site. There will be several new buildings required for the Project works and all materials to be incorporated in these new buildings will be transported via the existing road network. The movement of goods which cannot be further divided into smaller components will require transport on OD vehicles, with pilot vehicles and police escorts where required. The largest vehicles accessible to the site will be a type 2 road train. However, the access for these types of vehicles is restricted and it is not expected that these will be used for the Project. B-double trucks are expected to be the largest, standard access vehicles entering the site during the construction phase. Table provides a summary of the likely construction vehicle requirements external to the site, with approximately 2,240 trucks movements covering the construction phase. It is estimated that on average there will be 6 truck deliveries, or 12 total truck movements, per day, based on 6 loaded and 6 unloaded trip movements, covering typical construction operations. This level of activity may increase during specific construction operations and may peak at 12 truck deliveries, or 24 total truck movements, per day based on 12 loaded and 12 unloaded trip movements. It is assumed that all construction equipment and plant delivered to the site will be dedicated to construction activities and will be located on-site for the duration of construction. Table Construction Vehicle Requirements External to the Site Plant/Material Quantity Transport Arrangements Delivery Vehicles Origin General Construction Equipment Requirements Mobile Cranes 2 2 (AV) Regional Fork Lifts 4 1 (AV) Local Grader 3 3 (AV) Regional Dozer 10 Stored on-site for 10 (AV) Regional construction activities Excavators 10 Stored on-site for 10 (AV) Regional construction activities Dump Trucks 10 Standard size articulated tippers, self drive to site 10 (AV) Regional Building/Storage Tank Requirements Workshops Constructed from 2 (AV) Regional Stores base materials (steel/concrete) 4 (AV) Regional Workforce Demountable 20 (AV) State admin/muster (25m 2 ) 5 (AV) Footings Wash Facilities 3 (AV) Regional Fuel/oil 2 tanks 2 (AV) Regional Waste Station 2 tanks 2 (AV) Regional Hazardous 2 tanks 2 (AV) Local Materials Water Tanks/Treatment 3 tanks 3 (AV) Local Terminal 0 Environmental Impact Statement 3-569
15 Plant/Material Quantity Transport Arrangements Delivery Vehicles Origin New Rail Loop Requirements Rails Delivered by road 150 (AV) State Sleepers Delivered by road 50 (AV) State Base Materials 33 tonnes per truck 50 (AV) Local and trailer Construction Material Requirements Internal access roads material, Rock armour, quarry materials 35 tonnes per truck and trailer 500 Local Concrete For footings, retaining walls Rock Pavement/Rock armour Coal Handling Machinery Requirements standard concrete truck 100 (AV) Local Building/structures 50 (AV) Regional Coal handling Delivered by sea International - facility structure Regular Service Vehicle Requirements Potable water 2 per week (312 Local LRV) Fuel 1 per week (156 LRV) Regional General supplies 3 per week (468 Regional (office, catering and miscellaneous equipment) SRV) Waste collection 2 per week (312 Local MRV) Internal Infrastructure Sewerage pipes 2 (AV) Regional Electricity 2 (AV) Regional wire/poles Telecom line 2 (AV) Regional Water pipes 2 (AV) Regional Total 2,235 Source: TTM Traffic Engineering Report (Appendix E9) Construction Phase Workforce Traffic Generation The main factor influencing workforce traffic generation will be the general self-contained nature of the site. The provision of internal equipment and facilities will allow the majority of employees to stay within the vicinity of the site at most times during their shifts. Considering the spatial nature of the development it is anticipated that employees will be sourced primarily from the townships of Mackay, Townsville, Bowen, Ayr and Proserpine, and secondly from Southeast Queensland. It is therefore considered that the majority of traffic generated by the development will generally travel to and from these primary regional areas. At this initial development stage, the accommodation village is preferred to be located at the existing Merinda Camp, in the vicinity of Bowen and to the south-east of the site. An alternate camp will be located on Abbot Point Road or at the site of the original development camp at the intersection of Abbot Point Road and the Bruce Highway. Terminal 0 Environmental Impact Statement 3-570
16 It is considered that the majority of worker movements from the accommodation village will be via bus (40 person capacity), with further buses collecting workers at various nearby airports. However, not all workers will travel by bus, with approximately 20% likely to reside in nearby townships and use their private vehicles to access the site. There will also be a requirement for subcontractor workers, and they are likely to use private vehicles or hire cars as their primary method of transportation. Sub-contractors will also be encouraged to utilise the bus services. The traffic generation also takes into account the expected roster and shift systems which would result in: A total of 500 workers during the construction phase; 70% of workers rostered on two shifts of 12 hours each, with 70% of the rostered staff on day shift and 30% on night shift; 80% of workers to utilise group transport between worker accommodation and the site, averaging 40 persons per bus; 20% of workers (including sub-contractors) to access the site utilising private vehicles, with an average car occupancy for passenger vehicles being 1.5 persons; and Peak hour movements accounting for approximately 20% of daily traffic. As such, the maximum number of workers accessing the site (worst case scenario) for the day shift will be 350 and the evening shift will be 150. This will generate the following vehicle trips: Morning Shift Change (5:30am to 6:30am) In: 196 workers utilising 5 buses, with 33 private vehicles (1.5 worker occupancy) and Out: 84 workers, 3 buses, with 14 private vehicles; and Evening Shift Change (5:30pm to 6:30pm) In: 84 workers utilising 3 buses, with 14 private vehicles (1.5 worker occupancy) and Out: 196 workers, 5 buses, with 33 private vehicles. This is considered a worst case scenario as it assumes that shift workers, administrative staff and sub-contractors all arrive and depart the site during the same peak hour, which is unlikely to occur Construction Phase Traffic Distribution The total daily traffic volume generated by the construction activity is expected to equate to 122 vehicle movements per day based on average construction operations. The following provides a breakdown of likely worker and vehicle distributions during the construction period: 10% to and from Ayr, Townsville and other northern townships along the Bruce Highway; 10% to and from Bowen, Proserpine and other southern townships; and 80% to and from the worker accommodation camp. Further indirect traffic will be generated by FIFO activities. Once their 7 day roasters are complete, the workers will fly back to regional centres for their 7 day leave periods. Staff and contractors based in Southeast Queensland and other states are expected to fly to and from Townsville, Proserpine and Mackay airports. The construction and operation of a new accommodation camp is not addressed in this EIS. It is anticipated that the construction and service vehicles will have the following distributions: 50% to and from Townsville along the Bruce Highway; and Terminal 0 Environmental Impact Statement 3-571
17 50% to and from Bowen, Proserpine and further southbound along the Bruce Highway. Of the site generated traffic, 20% are expected to continue through Proserpine and travel further south towards Brisbane. These movements are primarily expected to consist of long distance heavy vehicle movements, servicing the site from major regional centres along the coast. Approximately 80% of these trips will be from the local area. These will consist of material deliveries from local quarries and suppliers, in addition to infrastructure components and equipment likely to be sourced from the Townsville area. The remainder will be sourced from the wider region, including inter-state. Based on the above assessment of construction (non-site staff) vehicle trips it is estimated that there will be an average of 5 Heavy Goods Vehicles (HGV) trips per day to and from the site during the construction phase. It is therefore estimated that there will be approximately 122 total vehicle trips daily generated during the construction phase, with the majority of site workers using bus transport Operational Phase Traffic Generation The following provides a breakdown of the likely traffic generation and distribution during the operational phase Operational Traffic For the duration of the operational life span of the port it is anticipated that the majority of staff will stay in nearby residential areas, particularly Bowen. All staff and service vehicle movements will access the site via the Bruce Highway. As noted, a total of employees are planned to operate the Terminal based on an output of 70 Mtpa. It is intended that the facility will be highly automated, both operationally and logistically, with less staff required for operation of the Project per Mtpa of material processed than the existing T1 facility. The staff will continue to work on a 4 team basis over a 12 hour shift, on a 7 days on/7 days off rotating roster. On this basis it is anticipated that 59 staff cover each shift. Staff are anticipated to arrive and depart during the shift changes, being 5:30am to 6:30am in the morning, and 5:30pm to 6:30pm in the evening. It is therefore estimated that there will be approximately 40 vehicles entering and 40 vehicles exiting the site during the shift changes, which is based on vehicle occupancy of 1.5 workers. The port operation will continue to require constant servicing and will be supplied with daily materials (including food, replacements and maintenance equipment) with a typical demand being 100 service vehicles per day. The service vehicles will range in size, with the smaller type service vehicles providing the majority of daily service requirements. In terms of vehicle distributions, traffic accessing the site from the Bruce Highway is similar to the existing T1 facility with vehicles arriving from both the north-west (Townsville) and south-east (Proserpine and Mackay). The following is a breakdown of the estimated operational traffic: AM Peak Period (5:30 am to 6:30 am): 40 private, 3 service vehicles from north-west, 30 private, 3 service vehicles from south-east; Off Peak Period (7 am to 5 pm): Typically 8 service vehicles per hour (In/Out); and Terminal 0 Environmental Impact Statement 3-572
18 PM Peak Period (5:30 pm to 6:30 pm): 40 private, three service vehicles from north-west, 40 private, 3 service vehicles from south-east. Table identifies the likely traffic generation and heavy vehicle requirements during the full operational stage. Table Full Operational Site Traffic Generation Shift Day Night Total Workforce 236 Total Rostered Staff 118 Shift Staff Staff Access Bus - - Private Total Staff Movements (during peak hour) Total peak hour traffic generation, service vehicles Total peak hour traffic generation, including service vehicles Daily service vehicle movement Total traffic generation vehicles per day Source: TTM Traffic Engineering Report (Appendix E9) 80 vph 6 vph 86 vph (In/Out) 100 vpd 360 vpd (In/Out) [Additional 100 vpd (In/Out)] Operational Phase Traffic Distribution As shown in Table 3-123, the daily traffic volume generated by the site is expected to equate to 360 (100 additional) daily vehicle movements. These traffic volumes are expected to be distributed as follows: 30% to the south-east along the Bruce Highway; and 70% to the north-west along the Bruce Highway. Of the port generated heavy vehicle traffic, 70% (70 vpd) is anticipated to be generated from the Townsville area, with the remaining 30% (30 vpd) from the south and further southern Queensland destinations Traffic Operation Assessment This section reviews the traffic operation and capacity performance of the Bruce Highway corridor in the vicinity of the site, including the Bruce Highway and Abbot Point Road intersection Average Annual Daily Traffic identifies the 2011 Average Annual Daily Traffic (AADT) volumes, sourced from DTMR, for the Bruce Highway between Bowen and Ayr. It is anticipated that the traffic growth on the Bruce Highway will continue to remain at 3% based on data sourced for a ten year period. Terminal 0 Environmental Impact Statement 3-573
19 Table Existing AADT Volumes on State-Controlled Roads (Road Section 10K - Bruce Highway (Bowen - Ayr)) Region Segment Start TDist Segment End TDist Site Site TDist Description km km km 200m North of Don River (Bowen) km km km 10K Little Goodbye Creek km km km WiM Site Guthalungra km km km Home Hill between 11 th and 12 th Steet km km km McDesme1.5 km North of Ayr-Dalbeg Road km km km Outside Ayr Courthouse Source: TTM Traffic Engineering Report (Appendix E9) AADT VKT (Millions) G A B G A B Data Page 3,839 3,809 7, ,801 1,784 3, ,430 1,411 2, ,342 3,833 7, ,408 4,417 8, ,161 5,174 10, Totals Terminal 0 Environmental Impact Statement 3-574
20 Road Corridor Capacity Criteria The Austroads Guide to Traffic Engineering Practice - Part 2: Roadway Capacity, indicates that twolane rural highways have a capacity of 2,800 passenger cars per hour total for both directions of flow. This is based on ideal conditions where there are no restrictive roadway, terrain or traffic conditions. Considering the prevailing roadway and traffic conditions along Bruce Highway, it is estimated that the highest total service flow rate (AM Peak) is approximately 900 vehicles per hour total for both directions of flow based on 2011 traffic levels. Austroads defines level of service as a qualitative measure describing operational conditions within a traffic stream. The term Level of Service (LOS) and its characteristics for rural roads is defined in Table Table Two Lane Rural Road Capacity - Rolling Terrain Two-Way Flow LOS Description Rating A Free, unrestrictive flow Very Good B Mostly free flow, few disruptions Very Good C Stable flow Good D Mostly stable flow, some delays Acceptable E Congested flow, delays common Bad F Forced flow Bad Source: Austroads Guide to Traffic Engineering Practice, Part 2 The volume and composition of traffic on a given road determines the level of interaction between vehicles and is measured as its LOS. LOS decreases with increasing traffic volumes. LOS A, LOS B, LOS C in a rural context are satisfactory, with a LOS D satisfactory in some circumstances. In cases where traffic, terrain or geometric data may not be precisely known, the Austroads Guide provides planning guidance on maximum AADT values that two-lane, two-way rural roads can accommodate under various terrain conditions. Table shows the values for various LOS for a rural road in rolling terrain with varying ratios of design hour volume to AADT Terminal 0 Environmental Impact Statement 3-575
21 Table Maximum AADTs for Various LOS on Two-Lane Two-Way Rural Roads Design Hour Volume to AADT Ratio Level of Service Design Hour Volume to AADT Ratio A B C D E ,100 2,800 5,200 8,000 14, ,000 2,500 4,700 7,200 13, ,300 4,400 6,600 12, ,100 4,000 6,100 11, ,480 3,700 5,700 10, ,800 3,500 5,300 9,900 Source: TTM Traffic Engineering Report (Appendix E9) Bruce Highway Operational Performance For a LOS C, the maximum AADT values range from 3,500 to 8,000 depending on the design hour volume to AADT ratio. The peak hour volumes along the Bruce Highway corridor were observed to be approximately 20% (or 0.15) of the average daily traffic on a weekday. From Table above, a maximum AADT of 3,500 to 5,300 is assumed for a LOS C, with 5,300 to 9,900 assumed for a LOS D. Comparing these values with the average AADT levels along the Bruce Highway (3,800 vehicles per day) indicates that the existing road corridor operates at LOS C, as shown in. As noted, the future year corridor operation is based on a 3% background traffic growth and from the criteria noted in will operate at a LOS D in 2026 (10 year post construction completion). Table Level of Service: Bruce Highway Bruce Highway Route / Counter Site 2013 AADT 2016 AADT 2026 AADT LOS J/ D D E 10J/ B B C 10J/ B B B 10J/ B B C 10J/ B B C 10K/ D D D 10K/ B B C 10K/ B B B 10K/ C D D 10K/ D D D 10K/ D D D 10J/ C C D 10J/ C D D 10J/ C C C 10J D D D Source: TTM Traffic Engineering Report (Appendix E9) Construction Stage The traffic assessment has been based on a continuous construction schedule, over a three year period, to address any potential changes in the phasing. Construction will not occur for any less than a three year period, and therefore this assessment has modelled the Project based on the most intensive possible schedule. The construction stage will involve the employment of up to 500 staff. Staff will be accommodated within a construction camp external to the SPL. Due to the self contained nature of the pre-constructionsite set-up it is anticipated that traffic impacts during this period will be lower than either the full construction or operational stages and as such have not been assessed. Terminal 0 Environmental Impact Statement 3-576
22 Operational Stage The operational stage of the Port is expected to be realted to the life of the Adani Carmichael Coal Mine. Table shows the predicted construction stage vehicle activity, with Table showing the operational stage traffic activity, and percentage of increase on the Bruce Highway. These figures have been based on a worst case scenario in which Phases 1 and 2 are combined into a construction stage of 3 years. The traffic increases associated with both stages is less than 5% and the worst case scenario is therefore considered to have a negligible impact on overall highway performance. Terminal 0 Environmental Impact Statement 3-577
23 Table AADT Impact on Road Network: Construction Stage Road Route / Counter Site 2013 AADT Construction-site Generated Traffic Vehicles per day % increase Bruce Highway <5% 10J/ <5% 10J/ J/ <5% 10J/ <5% 10J/ <5% 10K/ <5% 10K/ <5% 10K/ <5% 10K/ <5% 10K/ <5% 10K/ <5% 10J/ <5% 10J/ <5% 10J/ <5% 10J/ <5% Source: TTM Traffic Engineering Report (Appendix E9) Table AADT Impact on Road Network: Operational Stage Road Section 2016 AADT Construction-site Generated Traffic Vehicles per day % increase Bruce Highway 10J/ <5% 10J/ <5% 10J/ <5% 10J/ <5% 10J/ <5% 10K/ <5% 10K/ <5% 10K/ <5% 10K/ <5% 10K/ <5% 10K/ <5% 10J/ <5% 10J/ <5% 10J/ <5% 10J/ <5% Source: TTM Traffic Engineering Report (Appendix E9) Road Pavement Impact Review This section reviews the potential road pavement and traffic impacts associated with the construction and operation activities. The review addresses potential impacts on the Bruce Highway which will subject to additional heavy vehicle traffic from the Project Existing ESA Pavement Loadings It is assumed that the average ESA on the Bruce Highway equates to 2.8 for heavy vehicle classification. Traffic data gained from DTMR has established that the average percentage of heavy vehicles on the Bruce Highway between Bowen and Townsville is between 5% to 22%, with the percentage level of trucks on the Bruce Highway adjacent to the Port Access Road being 21%. Terminal 0 Environmental Impact Statement 3-578
24 Proposed Heavy Vehicle Generation The total heavy vehicle traffic generation from the site has been estimated in Section It has been identified that the site will generate 12 (24 total) larger type service vehicle trips and 7 (14 total) bus trips per day during the construction phases. This will change to 30 (60 total) smaller type service vehicle trips per day during the operational phase. The vehicles that terminate in the vicinity of Townsville are expected to be local service vehicles (generally smaller trucks). The vehicles which continue beyond Townsville and to the south are expected to be larger configuration (B-doubles if based on abnormal loads). Heavy vehicle distribution by classification is expected to be geared towards the higher loads and larger vehicles during the construction activity, with an average ESA of 3.0 per heavy vehicle. The type of load and truck is anticipated to be smaller during the operational phase, with typical servicing and maintenance deliveries to the site having an average ESA of 2.2 per heavy vehicle. Table and Table show the predicted level of heavy vehicle volumes and their resulting ESA s Table Daily Construction Stage ESA Generation Road Trucks Average ESA truck Truck ESAs Buses Average ESA bus Bus ESAs Daily Total ESAs Bruce Highway Source: TTM Traffic Engineering Report (Appendix E9) Table Daily Operational Stage ESA Generation Road Trucks Average ESA truck Truck ESAs Buses Average ESA bus Bus ESAs Daily Total ESAs Bruce Highway Source: TTM Traffic Engineering Report (Appendix E9) Pavement Impact Assessment The additional levels of construction and operational traffic are predicted to be less than 5% of the existing daily traffic levels on the Bruce Highway. Therefore, construction and operational traffic impacts from the Project are considered insignificant (Table and Table 3-131). The pavement impact of private vehicles and smaller type vans to transport employees between the site and accommodation camp, including sub-contractor vehicles, is anticipated to be negligible Site Access Impact Review This section reviews the adequacy of the Bruce Highway and Abbot Point Road intersection to adequately cater for the predicted development traffic demands. Terminal 0 Environmental Impact Statement 3-579
Transit Service Guidelines
 G R E AT E R VA N CO U V E R T R A N S P O RTAT I O N A U T H O R I T Y Transit Service Guidelines PUBLIC SUMMARY REPORT JUNE 2004 Greater Vancouver Transportation Authority TRANSIT SERVICE GUIDELINES
7. Community Consultation
 7. Community Consultation This section provides a summary of the public consultation process implemented for the Project, incorporating the Mine and Rail aspects. The consultation process has been undertaken
Environmental Impact Statement
 for South of Embley Section 14 Transport 14 TRANSPORT Road access to the Weipa area is currently by way of the Peninsula Developmental Road (PDR). The Port of Weipa on the Embley River is used for shipment
APPENDIX B. Public Works and Development Engineering Services Division Guidelines for Traffic Impact Studies
 APPENDIX B Public Works and Development Engineering Services Division Guidelines for Traffic Impact Studies Revised December 7, 2010 via Resolution # 100991 Reformatted March 18, 2011 TABLE OF CONTENTS
Appendix A: Project Characteristics
 Gorgon Fourth Train Expansion Proposal Appendix A: Project Characteristics Appendices Project Characteristics A Key Characteristics table has been prepared to describe the elements of the Foundation Project
INTEGRATED TRANSPORT PLANNING: A QUEENSLAND EXPERIENCE
 INTEGRATED TRANSPORT PLANNING: A QUEENSLAND EXPERIENCE Louw, J. Queensland Transport. ABSTRACT Transport plays a vital role in maintaining quality of life and enhancing attractiveness for industry development
DISTRICT OF NORTH VANCOUVER GUIDELINES FOR THE DEVELOPMENT OF CONSTRUCTION TRAFFIC MANAGEMENT PLANS
 DISTRICT OF NORTH VANCOUVER GUIDELINES FOR THE DEVELOPMENT OF CONSTRUCTION TRAFFIC MANAGEMENT PLANS Construction Impact Mitigation Strategy Guidelines for Major Developments The District of North Vancouver
TRAFFIC & TRANSPORTATION COMMISSION AGENDA REPORT
 TRAFFIC & TRANSPORTATION COMMISSION AGENDA REPORT AGENDA ITEM #4 T/T MTG: 092616 DATE: SEPTEMBER 26, 2016 TO: TRAFFIC & TRANSPORTATION COMMISSION FROM: BENJAMIN CHAN, P.E, T.E., DEPUTY PUBLIC WORKS DIRECTOR
Teck s Coal Export Ports. Brad Johnston General Manager, Marketing & Logistics, Coal
 Teck s Coal Export Ports Brad Johnston General Manager, Marketing & Logistics, Coal September 27 29, 2011 Forward-looking Information Both these slides and the accompanying oral presentation contain certain
SUPPLY CHAIN PERSPECTIVE
 SUPPLY CHAIN PERSPECTIVE LIVESTOCK/MEAT Overview 1234 Queensland has Australia s largest beef cattle herd and is the nation s largest producer and exporter of beef. Historically, beef comprises approximately
A+ ACADEMY HIGH SCHOOL
 TRAFFIC MANAGEMENT PLAN FOR A+ ACADEMY HIGH SCHOOL IN DALLAS, TEXAS Prepared for: A+ Charter Schools, Inc. 8225 Bruton Road Dallas, Texas 75217 Prepared by: Texas Registered Engineering Firm F-3199 400
Volvo Research Foundation Future Urban Transport Symposium
 Urban freight for liveable cities Volvo Research Foundation Future Urban Transport Symposium 15 th October 2012 Peter Hendy CBE Commissioner, Transport for London Contents Freight in London London Freight
Transportation and Works Department The Regional Municipality of York Yonge Street Newmarket, Ontario L3Y 6Z1
 TRANSPORTATION IMPACT STUDY (TIS) GUIDELINES FOR DEVELOPMENT APPLICATIONS Transportation and Works Department The Regional Municipality of York 17250 Yonge Street Newmarket, Ontario L3Y 6Z1 August, 2007
Road Transport Upgrade through Kapiti. Transportation Review for Kapiti Coast District Council
 Transportation Review for Kapiti Coast District Council September 2009 Project: Title: Document Reference: Prepared by: Reviewed by: Revisions: Road Transport Upgrade through Kapiti Transportation Review
IPSWICH NORTHERN ROUTES STUDY. Stage 1 Progress
 IPSWICH NORTHERN ROUTES STUDY Stage 1 Progress 17 th January 2017 STUDY CONTEXT 2 The study is being funded in partnership with the Suffolk district and borough councils. Work forms part of the Suffolk
COMMERCIAL AND INDUSTRIAL CONCRETE SPECIALISTS CAPABILITY STATEMENT
 COMMERCIAL AND INDUSTRIAL CONCRETE SPECIALISTS CAPABILITY STATEMENT INDEX ABOUT US OUR WORK ETHIC MANAGEMENT SYSTEMS ACCREDITATIONS & ASSOCIATIONS CAPABILITIES & COMPETENCIES PLANT AND EQUIPMENT PREVIOUS
Donegal County Council August 2008 Moville and Greencastle Sewerage Scheme Environmental Impact Statement Section 8. For inspection purposes only.
 Environmental Impact Statement Section 8 PLATES EPA Export 26-07-2013:10:54:05 EPA Export 26-07-2013:10:54:05 EPA Export 26-07-2013:10:54:06 Environmental Impact Statement Section 9 - Page 1 SECTION 9
Welcome to the Public Information Centre. Red Hill Business Park South Transportation Master Plan Addendum. June 25, :00 p.m. to 8:00 p.m.
 Welcome Welcome to the Transportation Master Plan Addendum June 25, 2012 6:00 p.m. to 8:00 p.m. Please sign-in Background In 2006 the City of Hamilton completed the North Glanbrook Industrial Business
CAPITAL AREA TRANSIT PLANNING SERVICE STANDARDS AND PROCESS. Planning Department
 CAPITAL AREA TRANSIT PLANNING SERVICE STANDARDS AND PROCESS Planning Department January 2016 INTRODUCTION Transit Service Standards are public rules and guidelines used to make decisions about where transit
A MODAL COMPARISON OF DOMESTIC FREIGHT TRANSPORTATION EFFECTS ON THE GENERAL PUBLIC EXECUTIVE SUMMARY. November 2007
 A MODAL COMPARISON OF DOMESTIC FREIGHT TRANSPORTATION EFFECTS ON THE GENERAL PUBLIC EXECUTIVE SUMMARY November 2007 Prepared by CENTER FOR PORTS AND WATERWAYS TEXAS TRANSPORTATION INSTITUTE 701 NORTH POST
CONTINENTAL FERRY PORT SITE INDUCTION
 CONTINENTAL FERRY PORT SITE INDUCTION Port activities As landlord of the Commercial Port, the Port Authority must be informed of all works conducted on these premises The Authority is committed to the
Evaluation of Freight Corridor Mode Performance: Brisbane - Cairns Corridor Freight Movement Analysis. Jonathan Bunker
 Evaluation of Freight Corridor Mode Performance: Brisbane - Cairns Corridor Freight Movement Analysis Jonathan Bunker Physical Infrastructure Centre School of Civil Engineering Queensland University of
Appendix H. Millennium Hollywood Project Trip Cap and Mitigation Triggers
 Appendix H Millennium Hollywood Project Trip Cap and Mitigation Triggers MILLENNIUM HOLLYWOOD PROJECT TRIP CAP AND MITIGATION TRIGGERS Crain and Associates Introduction The Millennium Hollywood Project
The Policies section will also provide guidance and short range policies in order to accomplish the goals and objectives.
 4 Goals & Objectives INTRODUCTION The 2015-2040 MTP preserves and promotes the quality of life and economic prosperity of the MAB by providing a transportation system consistent with the regional goals.
DYASON S KLIP SOLAR ENERGY FACILITY 1 (PTY) LTD. TRANSPORT STUDY AND TRAFFIC MANAGEMENT PLAN
 LTD. TRANSPORT STUDY AND TRAFFIC MANAGEMENT PLAN") DYASON S KLIP SOLAR ENERGY FACILITY 1 (PTY) LTD. TRANSPORT STUDY AND TRAFFIC MANAGEMENT PLAN Reference: A43448 Prepared for: ATLANTIC RENEWABLE ENERGY PARTNERS (Pty) Ltd Revision: 1 4 November 2014 Document
DYASON S KLIP SOLAR ENERGY FACILITY 1 (PTY) LTD. TRANSPORT STUDY AND TRAFFIC MANAGEMENT PLAN Reference: A43448 Prepared for: ATLANTIC RENEWABLE ENERGY PARTNERS (Pty) Ltd Revision: 1 4 November 2014 Document
(1) Site Suitability PURPOSE
 Site Suitability PURPOSE") 3.3 Code for Development and Use of Rural Service Industries PURPOSE This purpose of this code is to encourage the development and use of suitable rural service industries on rural, industrial or suitable
3.3 Code for Development and Use of Rural Service Industries PURPOSE This purpose of this code is to encourage the development and use of suitable rural service industries on rural, industrial or suitable
Land at Penny Pot Lane, Killinghall
 NORTH YORKSHIRE COUNTY COUNCIL BUSINESS and ENVIRONMENTAL SERVICES LOCAL HIGHWAY AUTHORITY Proposed Development: Location: Applicant: Outline Application for erection of 600 dwellings, primary school,
BUT001: Land to the east of Benington Road, Butterwick Sustainability Objective
 BUT001: Land to the east of Benington Road, Butterwick Sustainability Objective 1. Provide a miture of sustainably designed new housing to provide everybody in South East Lincolnshire with the opportunity
ENVIRONMENTAL IMPACTS OF TRANSPORTATION TO THE POTENTIAL REPOSITORY AT YUCCA MOUNTAIN
 ENVIRONMENTAL IMPACTS OF TRANSPORTATION TO THE POTENTIAL REPOSITORY AT YUCCA MOUNTAIN R.L. Sweeney, USDOE Yucca Mountain Project; R. Best, Jason and Associates; P. Bolton, P. Adams, Booz-Allen & Hamilton
Stage 4 Geotechnical Investigations Information Sheet
 Stage 4 Geotechnical Investigations Information Sheet Geotechnical specialists will use a range of equipment to examine ground conditions by either excavating small shallow test pits of soil, using a mechanical
6.2.2 Environmental Consequences and Mitigation Measures
 6.2 6.2.1 Introduction The existing conditions, regulatory setting, and methods of analysis for transportation under CEQA are described in Chapter 3, NEPA and CEQA Analysis. Impacts that would result from
REPLACEMENT BRIDGES FOR LOW TRAFFIC PART ONE: CONCRETE HOLLOWCORE
 REPLACEMENT BRIDGES FOR LOW TRAFFIC VOLUME ROADS PART ONE: CONCRETE HOLLOWCORE BRIDGE Chris Dowding Director Structures Group TOD Consulting - engineers and project managers BACKGROUND What is the true
Active Risk Management - Charles River Basin
 Protecting, Promoting and Enhancing our Commonwealth: Assisting MassDOT to deliver projects on Time and on Budget Active Risk Management - Charles River Basin September 18, 2013 & Massachusetts Accelerated
Caval Ridge Mine Change Request 8 Accommodation Village Condition Changes
 Caval Ridge Mine Change Request 8 Accommodation Village Condition Changes 31 May 2013 Contents Executive Summary... 3 1 Introduction... 5 1.1 Project Background... 6 1.1.1 Bowen Basin Coal Growth Project...
Volume to Capacity Estimation of Signalized Road Networks for Metropolitan Transportation Planning. Hiron Fernando, BSCE. A Thesis CIVIL ENGINEERING
 Volume to Capacity Estimation of Signalized Road Networks for Metropolitan Transportation Planning by Hiron Fernando, BSCE A Thesis In CIVIL ENGINEERING Submitted to the Graduate Faculty of Texas Tech
SPECIFICATION FOR NOISE MITIGATION
 SPECIFICATION FOR NOISE MITIGATION 1. SCOPE This specification covers the design, construction, documentation and postconstruction review of state highway road-traffic noise mitigation. This specification
TRANSPORTATION IMPACT ANALYSIS GUIDELINES
 TRANSPORTATION IMPACT ANALYSIS GUIDELINES SANTA CLARA COUNTY TRANSPORTATION AUTHORITY CONGESTION MANAGEMENT PROGRAM ADOPTED MARCH 2009 TABLE OF CONTENTS PART I - STATUTE AND AUTHORITY...1 CHAPTER 1. CMP
Construction Commissioning 2013 Demobalisation 2013
 GULLEN RANGE WIND FARM COMMUNITY UPDATE 3 March 2013 The contract for construction of the Gullen Range Wind Farm project (the Project) was awarded in August 2012 to Catcon and Consolidated Power Projects.
9.3.9 Industry uses code
 9.3.9 Industry uses code 9.3.9.1 Application (1) This code applies to accepted development and assessable development identified as requiring assessment against the Industry uses code by the tables of
Woodburn Interchange Project Transportation Technical Report
 Final Report Woodburn Interchange Project Transportation Technical Report Prepared for Oregon Department of Transportation April 212 Prepared by DKS Associates Contents Methodologies... 4 Volume Development...
Application Number: SP Project Name: Novo Nordisk Bright Sky Major Site Plan (acting as a Master Plan)
") STAFF REPORT Town of Clayton Staff Report Planning Department 111 E. Second Street, Clayton, NC 27520 P.O. Box 879, Clayton, NC 27528 Phone: 919-553-5002 Fax: 919-553-1720 Planning Board February 22, 2016
STAFF REPORT Town of Clayton Staff Report Planning Department 111 E. Second Street, Clayton, NC 27520 P.O. Box 879, Clayton, NC 27528 Phone: 919-553-5002 Fax: 919-553-1720 Planning Board February 22, 2016
LAS VEGAS STREET RAILROAD CROSSING RR/PUC CONNECTION AND PRELIMINARY DESIGN
 LAS VEGAS STREET RAILROAD CROSSING RR/PUC CONNECTION AND PRELIMINARY DESIGN Prepared for: City of Colorado Springs Prepared by: Felsburg Holt & Ullevig 508 South Tejon Street Colorado Springs, CO 80903
GO RAIL NIAGARA SERVICE EXTENSION
 Business Case: Finch Avenue West Rapid Transit GO RAIL NIAGARA SERVICE EXTENSION INITIAL BUSINESS CASE Date: November, 2014 NOVEMBER 2015 Page 1 TABLE OF CONTENTS 1.0 Executive Summary...p.5 2.0 Introduction....p.6
SEARs project justification and conclusion
 31 Project justification and conclusion This chapter presents a justification for the project and a conclusion to the environmental impact statement (EIS). The justification is based on the strategic need
Successful Incident Management on a Major Reconstruction Project
 Transportation Research Board 81 st Annual Meeting January 13-17, 2002 Washington, DC Successful Incident Management on a Major Reconstruction Project Pacific Motorway Project, Queensland Australia Professor
AREAWIDE BRIDGE REPLACEMENT AND REHABILITATION
 CECIL COUNTY 2018 TRANSPORTATION IMPROVEMENT PROGRAM AREAWIDE BRIDGE REPLACEMENT AND REHABILITATION DESCRIPTION: On-going program to provide major upgrades to state owned bridges that are structurally
2 Purpose and Need. 2.1 Study Area. I-81 Corridor Improvement Study Tier 1 Draft Environmental Impact Statement
 2 Purpose and Need 2.1 Study Area Interstate 81 (I-81) is relied upon for local and regional travel and interstate travel in the eastern United States. It extends 855 miles from Tennessee to New York at
Operating Requirements Manual 11 October 2015 Version 1
 Operating Requirements Manual 11 October 2015 Version 1 Contents 1 Introduction 1 2 Interface Risk Management 2 2.1 Interface Risk Assessment 2 2.2 Interface Risk Management Plan 4 2.3 Provision of Assistance
NEW SOUTH WALES INTERMODAL FORUM. August 2017
 NEW SOUTH WALES INTERMODAL FORUM August 2017 1 PACIFIC NATIONAL AT A GLANCE A summary of Pacific National s performance from the last financial year: TEUs HANDLED 0.8m (INTERMODAL) 57 BILLION NTKs REVENUE
Understanding the State Planning Policy July 2017 Changes to state interest statements, policies and assessment benchmarks
 Understanding the State Planning Policy July 2017 Changes to state statements, policies and assessment benchmarks This fact sheet outlines the key policy changes to the state statements, policies and assessment
Jim Alexander Director of Design and Engineering, Southwest Light Rail Transit Project
 Memorandum Date: January 15, 2014 To: CC: From: Subject: Jim Alexander Director of Design and Engineering, Southwest Light Rail Transit Project Paul Danielson, P.E. Project Manager, Southwest Light Rail
APPENDIX H: TRAVEL DEMAND MODEL VALIDATION AND ANALYSIS
 APPENDIX H: TRAVEL DEMAND MODEL VALIDATION AND ANALYSIS Travel demand models (TDM) simulate current travel conditions and forecast future travel patterns and conditions based on planned system improvements
Interchange Workshop Report (August 2004)
") U.S. Highway 14 Corridor Study New Ulm to North Mankato Table of Contents Section Interchange Workshop Report (August 2004) Page 1. Introduction and Next Steps 1 2. Interchange Workshop Participants &
U.S. Highway 14 Corridor Study New Ulm to North Mankato Table of Contents Section Interchange Workshop Report (August 2004) Page 1. Introduction and Next Steps 1 2. Interchange Workshop Participants &
Container Transfer Logistics at Multimodal Container Terminals
 Container Transfer Logistics at Multimodal Container Terminals Erhan Kozan School of Mathematical Sciences, Queensland University of Technology Brisbane Qld 4001 Australia e.kozan@qut.edu.au Abstract:
Importance of Road Freight Transport to the Organization and Economy. Amal S. Kumarage July 2014
 Importance of Road Freight Transport to the Organization and Economy Amal S. Kumarage July 2014 Freight Transport FT is the process of conveying different types of goods from one point to another using
Response of the Road Haulage Association to Transport for London. Consultation on Mayor s Transport Strategy.
 Response of the Road Haulage Association to Transport for London. Consultation on Mayor s Transport Strategy. Background about the RHA 2 October 2017 1. The Road Transport Industry is a dynamic, business
LEVIN TO WELLINGTON ROAD OF NATIONAL SIGNIFICANCE - QUESTIONS AND ANSWERS
 LEVIN TO WELLINGTON ROAD OF NATIONAL SIGNIFICANCE - QUESTIONS AND ANSWERS GENERAL What is a Road of National Significance? The Government has identified seven Roads of National Significance (RoNS). The
LAND USE POLICIES BY COMMUNITY DESIGNATION
 137 2040 138 Land Use Policies by Community Designation As discussed earlier in Thrive MSP 2040, the Council assigns a community designation to each city and township. This designation indicates the overall
HB2 Implementation Policy Guide
 report HB2 Implementation Policy Guide prepared for Commonwealth Transportation Board date August 1, 2015 6.0 Appendix A: Safety Measures Table 6.1 Safety Factor Measures Summary ID Measure Name Weight
Viridor Waste Management. Proposed Development of an In-Vessel Composting Facility. Land at Exide Batteries, Salford Road, Bolton
 Viridor Waste Management Proposed Development of an In-Vessel Composting Facility Land at Exide Batteries, Salford Road, Bolton Non-Technical Summary January 2009 Introduction Viridor Waste Management
Box Culverts. Easy to install, suitable for very shallow or deep fill, ideal for use in a wide variety of civil engineering applications.
 Box Culverts Box Culverts Easy to install, suitable for very shallow or deep fill, ideal for use in a wide variety of civil engineering applications. 2 3 System Overview Forterra is one of the largest
Downtown Estes Loop Project Frequently Asked Questions
 May 15 th, 2015 Project Status 1) Has Alternative 1 already been selected? Is it a done deal? Response: The NEPA process will proceed with environmental analysis of both the No Action and Alternative 1.
VALUING GHG SAVINGS FROM ITS IMPLEMENTATION IN URBAN AREAS
 PAPER for 26 th Conference of Australian Institutes of Transport Research CSIRO TRANSPORT FUTURES Bayview Conference Centre Melbourne 8-10 December 2004 VALUING GHG SAVINGS FROM ITS IMPLEMENTATION IN URBAN
DESIGN AND CONSTRUCTION OF DERRY ROAD AND CANADIAN NATIONAL RAIL GRADE SEPARATION
 DESIGN AND CONSTRUCTION OF DERRY ROAD AND CANADIAN NATIONAL RAIL GRADE SEPARATION Vireak Hinh, P.Eng. R.V. Anderson Associates Ltd., Toronto, Canada Jennifer Trimble Region of Halton, Oakville, Canada
Chapter 1 Introduction
 Chapter 1 Introduction KEY POINTS The amount and value of freight are critical components of the overall economic health of Missouri. Missouri s multimodal freight system supports the movement of trucks,
SECTOR ASSESSMENT (SUMMARY): TRANSPORT (RAIL TRANSPORT [NONURBAN])
![SECTOR ASSESSMENT (SUMMARY): TRANSPORT (RAIL TRANSPORT [NONURBAN])](/thumbs/76/73866832.jpg "SECTOR ASSESSMENT (SUMMARY): TRANSPORT (RAIL TRANSPORT [NONURBAN])") Railway Rolling Stock Project (RRP BAN 49094) SECTOR ASSESSMENT (SUMMARY): TRANSPORT (RAIL TRANSPORT [NONURBAN]) Sector Road Map 1. Sector Performance, Problems, and Opportunities 1. Bangladesh s transport
Railway Rolling Stock Project (RRP BAN 49094) SECTOR ASSESSMENT (SUMMARY): TRANSPORT (RAIL TRANSPORT [NONURBAN]) Sector Road Map 1. Sector Performance, Problems, and Opportunities 1. Bangladesh s transport
CHAPTER 4 GRADE SEPARATIONS AND INTERCHANGES
 CHAPTER 4 GRADE SEPARATIONS AND INTERCHANGES 4.0 INTRODUCTION The ability to accommodate high volumes of intersecting traffic safely and efficiently through the arrangement of one or more interconnecting
Stage One Reference Design Enhancements. Date: 2 October Cabinet-in-Confidence
 Stage One Reference Design Enhancements Date: 2 October 2013 Introduction This paper provides further information regarding the proposed enhancements to the Reference Design that have been identified since
TRANSPORTATION IMPACT STUDIES
 January 28, 2009 POLICIES AND PROCEDURES FOR TRANSPORTATION IMPACT STUDIES Related to Highway Occupancy Permits Pennsylvania Department of Transportation Bureau of Highway Safety and Traffic Engineering
CE 452 Traffic Impact Assessment
 CE 452 Traffic Impact Assessment 1 Why Required? New developments Produce/ attract new traffic Production: Residences Attraction: Shops, Offices, Schools, Hospitals etc. etc. Changes in traffic pattern
WELCOME IL 47. Community Advisory Group Meeting #5 Waubonsee Community College Wednesday, May 31, 2017
 WELCOME IL 47 Community Advisory Group Meeting #5 Waubonsee Community College Wednesday, May 31, 2017 MEETING PURPOSE MEETING AGENDA 1. Welcome/Introduction 2. Review Previous Public Involvement 3. Process/Schedule
DESCRIPTION OF THE GOURIKWA POWER STATION & TRANSMISSION INTEGRATION PROJECT CHAPTER 3
 DESCRIPTION OF THE GOURIKWA POWER STATION & TRANSMISSION INTEGRATION PROJECT CHAPTER 3 This chapter provides details regarding the scope of the proposed Gourikwa Power Station and Transmission Integration
Project 24 Rail Transport Energy Efficiency and Sustainability. Project background Commenced July Completed December 2006
 Rail Research Industry Report Project 24 Rail Transport Energy Efficiency and Sustainability Project background Commenced July 2002 - Completed December 2006 Results and Outcomes: 1. Energy efficiency
Charging Arrangements for New Connection Services
 Charging Arrangements for New Connection Services 2018-2019 About South East Water Developer Services Developer Services Department For any new connections requests or issues please contact our Developer
environmental issues Figure 15 and Figure 16 show the road network in and around the Project area. A description follows.
 7 assessment of key environmental issues 7 Assessment of key environmental issues 7.1 Traffic and transport Traffic and transport issues associated with the Project relate almost entirely to the construction
CHAPTER 14. ROADWAYS AND MARINE TRANSPORTATION
 CHAPTER 14. ROADWAYS AND MARINE TRANSPORTATION 14.1 AFFECTED ENVIRONMENT 14.1.1 Definition of Resource This section describes the existing transportation facilities, specifically roads, the Tinian International,
Works, services and infrastructure code
 9.4.11 Works, services infrastructure code 9.4.11.1 Application (1) This code applies to assessable development identified as requiring assessment against the Works, services infrastructure code by the
AIR QUALITY AND CLIMATE CHANGE EVALUATION GUIDANCE
 AIR QUALITY AND CLIMATE CHANGE EVALUATION GUIDANCE The following guidance provides additional details regarding the process followed by PSRC to evaluate projects for potential air quality benefits. As
New Jersey Department of Transportation. Local Freight Impact Fund Handbook. Procedures and Criteria for Local Freight Impact Fund Grant Program
 New Jersey Department of Transportation Local Freight Impact Fund Handbook Procedures and Criteria for Local Freight Impact Fund Grant Program Page 1 of 10 Overview The New Jersey Department of Transportation
To provide an update on the progress of the Peel Goods Movement Task Force and Peel Goods Movement Strategic Plan.
 8.4-1 REPORT Meeting Date: 2014-06-26 Regional Council For Information DATE: June 17, 2014 REPORT TITLE: PEEL GOODS MOVEMENT STRATEGIC PLAN UPDATE 2014 FROM: Dan Labrecque, Commissioner of Public Works
CITY OF JACKSONVILLE 2030 MOBILITY PLAN STUDY UPDATE GOALS, OBJECTIVES, AND PERFORMANCE MEASURES PREPARED FOR: CITY OF JACKSONVILLE
 CITY OF JACKSONVILLE 2030 MOBILITY PLAN STUDY UPDATE GOALS, OBJECTIVES, AND PERFORMANCE MEASURES 3.20.2017 PREPARED FOR: CITY OF JACKSONVILLE 55 Railroad Row White River Junction, VT 05001 802.295.4999
Rural-Residential Rural-Residential Explanatory Statement Significant Issues Objectives and Policies...
 Section Contents Rural-Residential... 2 16. Rural-Residential... 2 Explanatory Statement... 2 16.1 Significant Issues... 2 16.2 Objectives and Policies... 3 16.3 Activity Lists... 3 16.4 Activity Performance
Content of the module
 Content of the module Methodology approach Planning process Definition of working area Population and territorial context Supply Infrastructure Transport service Demand On board / at the stations or bus
4.0 ENVIRONMENTAL IMPACTS AND MITIGATION MEASURES. Negative or adverse impacts during the construction phase are:
 4.0 ENVIRONMENTAL IMPACTS AND MITIGATION MEASURES 4.1 POTENTIAL ENVIRONMENTAL IMPACTS 4.1.1 Impacts during Construction Phase Negative or adverse impacts during the construction phase are: Land environment:
Spatial Planning and National Roads
 21 Spatial Planning and National Roads Guidelines for Planning Authorities January 2012 Comhshaol, Pobal agus Rialtas Áitiúil Environment, Community and Local Government 2 Spatial Planning and National
MONITORING IMPLEMENTATION AND PERFORMANCE
 12 MONITORING IMPLEMENTATION AND PERFORMANCE The FAST Act continues the legislation authorized under MAP-21, which created a data-driven, performance-based multimodal program to address the many challenges
MTM REQUIREMENTS METROPOLITAN TRAIN MAINTENANCE DEPOT
 Approval Amendment Records Approval Date Version Description 14/11/2011 1 Initial Version Disclaimer Metro Trains Melbourne makes no warranties, express or implied, that compliance with the contents of
Standard Performance Attributes for Transportation Projects
 Standard s for Transportation Projects Mainline Operations Local Operations Maintainability Construction Impacts Environmental Impacts Project Schedule An assessment of traffic operations and safety on
TES Industrial Development SW ¼ SEC Lacombe County Outline Plan
 TES Industrial Development Lacombe County Outline Plan 112849297 June 2012 am v:\1128\active\112849297\07_reports_studies\rpt_tes_20120508.doc i Table of Contents 1.0 INTRODUCTION... 1 1.1 PURPOSE... 1
ROADSIDE SAFETY BARRIER ELEMENTS Module 3
 2 ROADSIDE SAFETY BARRIER ELEMENTS Module 3 3 Roadside Design Options 4 Expected Crash Reduction of Relocation of Fixed Objects Source: NCHRP Report 500, Vol 6, Exhibit V-26 Purpose of Safety Barriers
Southeast Florida Freight and Goods Movement Update Treasure Coast Regional Planning Council September 16, 2011
 Southeast Florida Freight and Goods Movement Update Treasure Coast Regional Planning Council September 16, 2011 For Questions on this Presentation, Please Contact: Jeff Weidner, Mobility Manager Florida
Miami River Freight Improvement Plan Financial Management Number:
 Miami River Commission January 8, 2018 Miami, FL Carlos A. Castro, District Freight Coordinator Miami River Freight Improvement Plan Financial Management Number: 437946-1-22-01 Agenda Study Background
Optimising Use ITS Smarter, better and more pleasant travel
 Optimising Use ITS Smarter, better and more pleasant travel DATA INCIDENTS TRAVEL INFORMATION SERVICES SUPERMARKET LOGISTICS EVENTS The seven themes of Beter Benutten ITS to 2017 www.beterbenutten.nl/its
2040 Transportation Policy Plan Conversion to Performance Based Planning Basis. 25 th Annual CTS Transportation Research Conference May 21, 2014
 2040 Transportation Policy Plan Conversion to Performance Based Planning Basis 25 th Annual CTS Transportation Research Conference May 21, 2014 1 About the plan Long-range transportation plan for the Twin
Value of Rail. Value of Rail The contribution of rail in Australia
 Value of Rail Value of Rail The contribution of rail in Australia A report commissioned by the Australasian Railway Association (ARA) November 2017 1 Executive Summary The Value of Rail Report has been
Reducing the response times of emergency vehicles in Queensland
 Reducing the response times of emergency vehicles in Queensland John a a Transmax Pty Ltd Abstract To address a growing and ageing population in Queensland and increased demand for emergency services,
RECYCLED ASPHALT PAVEMENT AND ASPHALT MILLINGS (RAP) REUSE GUIDANCE MARCH 2013 (VERSION 1.0)
 REUSE GUIDANCE MARCH 2013 (VERSION 1.0)") RECYCLED ASPHALT PAVEMENT AND ASPHALT MILLINGS (RAP) REUSE GUIDANCE MARCH 2013 (VERSION 1.0) RECYCLED ASPHALT PAVEMENT AND ASPHALT MILLINGS (RAP) REUSE GUIDANCE MARCH 2013 A. GENERAL INFORMATION It is
RECYCLED ASPHALT PAVEMENT AND ASPHALT MILLINGS (RAP) REUSE GUIDANCE MARCH 2013 (VERSION 1.0) RECYCLED ASPHALT PAVEMENT AND ASPHALT MILLINGS (RAP) REUSE GUIDANCE MARCH 2013 A. GENERAL INFORMATION It is
Scope of Work. Project Approach and Understanding. Task 1: Study Initiation and Administration
 Scope of Work Route 116/Hinesburg Growth Center Corridor Study Town of Hinesburg and CCRPC Project Approach and Understanding Route 116 through Hinesburg had seen substantial changes in the past 15 years,
407 TRANSITWAY. Planning & Preliminary Design
 FROM EAST OF HIGHWAY 400 TO KENNEDY ROAD GWP #252-96-00 Public Information Centre #2 June 24 th and 29 th, 2010 Purpose of Public Information Centre #2 The first Public Information Centre (PIC #1) was