ASSESSING THE IMPACT OF SECURITY MEASURES AT GATES OF SEAPORTS ON TRAFFIC OPERATION
|
|
|
- Clemence Kelley
- 6 years ago
- Views:
Transcription
1 ASSESSING THE IMPACT OF SECURITY MEASURES AT GATES OF SEAPORTS ON TRAFFIC OPERATION Dr. Arun Chatterjee Professor Emeritus Dept of Civil & Environmental Engineering The University of Tennessee Knoxville, TN And Airton Kohls Graduate Student Dept of Civil & Environmental Engineering The University of Tennessee Knoxville, TN And Dr. Joseph E. Hummer Professor Dept of Civil & Environmental Engineering Mann Hall NC State University Raleigh, NC And Dr. David B. Clarke Research Associate Professor & Director Center for Transportation Research The University of Tennessee Knoxville, TN Prepared for Southeastern Transportation Center and North Carolina State Ports Authority July 2008
2 ABSTRACT Seaports in the USA are using a variety of security measures that include increased inspection of entering and exiting vehicles at port gates. Further, the amount of traffic is growing rapidly. The delay caused by inspection in combination with traffic growth can increase the lengths of queues of vehicles both outside and inside ports to such an extent as to cause disruption of traffic on the road network surrounding a port, and also can affect internal operations. This negative impact should be assessed in a thorough manner, and this paper presents a methodology for this purpose, which was tested using real-life data from two ports in North Carolina. The methodology involves the adaptation and use of VISSIM software, which is a microscopic simulation model. The results show that the rigorous inspection strategies in combination with traffic growth would cause queues outside port gates long enough to block and disrupt major road intersections on the surrounding road network. Simulation models can be used to assess the effectiveness of alternative strategies for alleviating congestion problems. 2
3 ASSESSING THE IMPACT OF SECURITY MEASURES AT GATES OF SEAPORTS ON TRAFFIC OPERATION INTRODUCTION Many seaports in the United States are experiencing major growth in both container and general cargo traffic. Increased container and general cargo traffic will move in and out through port gates, and a large portion of this freight movement will be on trucks, which will use the surrounding road systems to gain access to the ports. The efficient handling of drayage truck traffic inside as well as outside a port presents a challenge. Another challenge for seaports involves security. Since 9/11, the U.S. Department of Homeland Security (DHS) has provided funding to many seaports to implement a variety of security measures on landside and waterside. These include installation of cameras, changes in vehicle routing, increased documentation requirements for drivers and cargo, and random vehicle checks. The nature and intensity of application of these measures varies according to the national terrorism threat level. The enhanced screening of vehicles and drivers at port gates has the potential to retard the movement of trucks and railcars into and out of port facilities. When the enhanced security inspections are combined with the increased traffic demand noted above, the result may be serious traffic congestion at port gates. Traffic congestion at a port gate and the resulting queue of vehicles could cause congestion problems on the surrounding road network and also inside a port itself, and in addition to traffic delay it can have negative effects on air quality and safety. It should also be pointed out that the air quality impact of truck traffic entering and exiting ports has been a serious issue in the case of a few large ports in the US. We know of no research on the traffic operation effects of enhanced security measures at port gates. However, there has been some research work dealing with the flow of drayage truck traffic through ports and its impact on air quality and energy, and there is computer software developed by The Tioga Group and Dowling Associates for this purpose (1). It also should be acknowledged that there are a few articles that reported the use of simulation models (e.g., VISSIM) for analyzing traffic at toll plazas, and these have some similarities with our research (2). 3
4 Our research was undertaken to develop a methodology for investigating the traffic flow effects of enhanced security measures at port gates. We were interested in the effects on traffic flow at the port gates and on the surrounding road networks. The ports of Wilmington and Morehead City in North Carolina, which are operated by the North Carolina State Port Authority (NCSPA), were used for the case study. In addition to developing a methodology, we also tested several scenarios for the future and identified potential traffic problems. The results of this research based on the North Carolina ports may provide lessons for other ports of similar size across USA. Furthermore, it is expected that the analytical approach and experience gained from this study will be useful for analyzing traffic at other types of secure areas with high traffic volumes, such as military bases and Federal laboratories. This paper presents the methodology that was used to develop simulation models and the findings of scenario analysis, which was performed with these models DATA COLLECTION At the beginning of the study we used video cameras and manual procedures to gather data at the Port of Wilmington s South and North Gates. Later, the NCSPA set up security cameras at these port gates and at the gate to the Port of Morehead City, and the pictures recorded by video cameras were available for data retrieval. The videos captured the movement of vehicles in and out of the gates and also showed a driver s behavioral pattern with regard to selecting lanes. The cameras also gave information on service times. Additional data were provided by the Division of Highways of the North Carolina Department of Transportation (NCDOT). These data included traffic volumes at selected intersections and also information on traffic signal timing. The data retrieved from the sources above were processed and tabulated for input into the VISSIM model, which is a microscopic traffic simulation model. The data represented a weekday in September or October in 2006 and it covered the period of 7:00 AM to 6:00 PM. Various data items compiled for each port gate are described below: Aerial image for the site Geometric features of the site: 4
5 Layout of the port facility at guard stations and interchange gates Location of scales and x-ray screening portals Layout of the roadway system outside the port facility Routing of vehicles Types/configuration of vehicles entering and leaving the facility Vehicle speeds inside and outside the facility Number of vehicles entering and leaving the gate: Vehicles that stop at gates Vehicles that do not stop at gates Service times for each type of vehicles entering and leaving the facility at guard stations and interchange gates Traffic volumes at adjacent intersections Train schedule Signal timing at the intersection near the Morehead City port gate including detector locations and preemption strategy MODEL DEVELOPMENT To test and analyze scenarios, the study team used the VISSIM traffic simulation model (3). VISSIM is a microscopic, time-step, and behavior-based simulation model designed to analyze a full range of traffic operations. The software was developed by and is maintained by PTV Traffic Mobility Logistics. This project used version 4.3. Even though the software was not specifically developed for port entrances, some of its capabilities allow for the simulation of these types of facilities. To simulate some of the unique operations of a port, which are not explicitly included in VISSIM, certain special adjustments had to be made. Vehicle actuated programming (VAP) coding was used to simulate the different levels of inspection strategies at the guard stations. A traffic signal and a detector was set up just before the guard station and the VAP coding allowed for the entering vehicles to be counted. To represent the strategy of inspecting every N th vehicle, the signal was set initially green and after the N th vehicle passed the detector, the signal 5
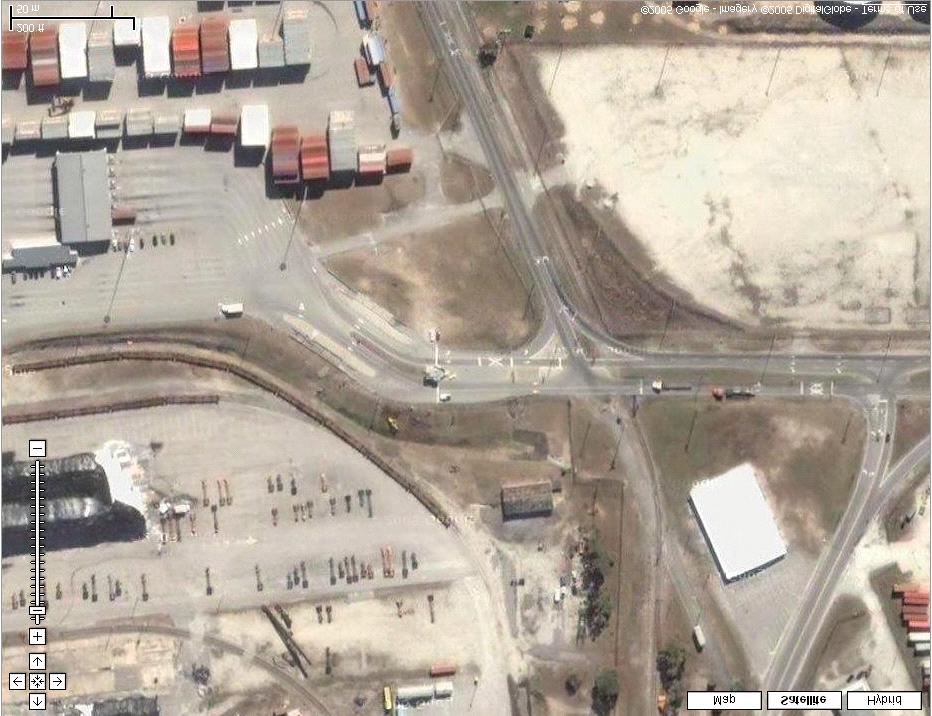
6 would turn red and stop the next vehicle that would be inspected for a specified time. [The coding used for this purpose is available from the lead author of this article.] VISSIM allows for many types of signal controllers to be used. The virtual Econolite ASC/ module was used in the case of the intersection just outside the gate at the Morehead City port. Detailed information on traffic signal operation was necessary, including a preemption strategy for input in the virtual controller. For the development of the simulation models for Wilmington South Gate and the gate at Morehead City, 15- minute intervals were used for auto and truck traffic volumes. One-hour intervals were used for auto and truck traffic volumes for the North Gate in Wilmington. The use of fifteen-minute intervals is preferred for simulation. SOUTH GATE IN WILMINGTON The Port of Wilmington South Gate entrance is located on Shipyard Boulevard and is designated specifically for container trucks. The current conditions show traffic queues reaching the intersection with River Road, which is located 250 feet from the port entrance. Burnett Boulevard is the next major road upstream of River Road; its intersection with Shipyard Boulevard is 720 feet from the port entrance. Entering vehicles are serviced first by security guards at the gated Guard Station, which has one lane open (out of two possible lanes) for the current configuration. The layout is shown in Figure 1. Once inside the facility, passenger vehicles are diverted towards the offices and container trucks towards the Interchange Gates. The Interchange Gates are 725 feet from the Guard Station. Currently, the Interchange Gates have 4 inbound lanes, but only 3 of them are used. These three lanes have static scales. Trucks pull up and stop for paperwork, while the weight is automatically measured and transferred to the recording system. After the processing of documents, trucks move to a position downstream but close to the Interchange Gates for the inspection of chassis and container by port inspectors who look for physical damage, condition of lights, etc. Exiting vehicles also have to go through Interchange Gates. Autos go through an open by-pass lane, and container trucks use three outbound lanes with screening (x-ray) portals for radiation detection. At the Guard Station there are three outbound lanes -- one 6
7 open lane, one lane with x-ray portals (used by customs, if necessary), and one lane with a scale for those container trucks that may like to be weighed before leaving. NORTH GATE IN WILMINGTON The Port of Wilmington s North Gate is located at the intersection of Burnett Boulevard and Myers Boulevard, and it is designated specifically for general cargo. Due to the geometry of the adjacent roadway, and also due to the proximity of the Guard Station to the main road (Burnett Boulevard), long queues are likely to spillback along Burnett Boulevard toward Carolina Beach Road, which is a major arterial (US-421) only about one-quarter mile from the port entrance. The security procedure at the North Gate is simple but may be time consuming. The Guard Station at the North Gate is the only place where vehicles are inspected or stopped. MOREHEAD CITY GATE The gate of the port of Morehead City is located just off of US-70 (Arendell Street) and just east of downtown. Due to the intersection geometry and a rail line that serves the Port and goes through the middle of the intersection, the intersection of the port access road with US-70 has a 7-phase-plus-preemption signal controller. A two-way, single-lane road that mostly serves semi-trailer trucks leads to the Port entrance. At the Guard Station, security personnel meet an entering truck for inspection. They open the back door of a trailer and check paperwork. On their way out, vehicles are stopped at the Guard Station for checkout. Currently, problems arise at the main intersection on US-70 during the morning and mid-day peak hours. VERIFICATION OF MODEL OUTPUTS The simulation model for each gate was verified with current data before future scenarios were run. The data collection points for model outputs were positioned just after the stop signs (inbound and outbound) at the Guard Stations to provide readings of how many vehicles entered and exited each port in a one-hour period of simulation. After the warm-up time of 300 seconds, the model produced very acceptable readings for the four 7
8 15-minute intervals for both inbound and outbound movements. The model output values of delay and travel time also matched the respective observed values. SCENARIO ANALYSIS Scenarios for analysis were developed for different levels of security inspection at the port gates in conjunction with the 5-year cargo growth forecasts made by the NCSPA. The current service times retrieved from video data were used for all Guard Stations and the Interchange Gate. All scenarios assumed one open inbound lane at each gate. Different combinations of traffic volumes and security levels are represented by the 8 different scenarios, which are presented in Table 1. For each scenario 20 different simulation runs were performed and the variations were examined. The projected increase in truck volume from 2007 to 2012 for the South Gate in Wilmington was 102%. The projected increase in truck volume for the same period for the North Gate in Wilmington was 58%. The projected increase in truck volume from 2007 to 2012 for the Port of Morehead City was 110%. Passenger vehicle traffic volume was assumed to remain constant during this time period in all facilities. Data collection points were located in the simulation network before and after the Guard Stations to create a one-mile long travel section and record the delay experienced by drivers while entering and exiting the facilities. The values presented for delay represent the average total delay per vehicle (in seconds). The total delay is computed for every vehicle completing the travel section by subtracting the theoretical (ideal) travel time from the simulated (actual) travel time. Queue counters were positioned just upstream of the Guard Station in inbound and outbound directions respectively for all models. For the Port of Wilmington South Gate, queue counters were also positioned at the front of the Interchange Gates. The queue length was measured upstream by the simulation model at every time step. VISSIM takes a snapshot at every second of simulation time. From these values the arithmetic average is computed for every time interval. The maximum queue length for every one minute time interval was determined based on the queue lengths measured upstream at every time step (i.e., every second). Each simulation run was for one hour and included 60 one-minute intervals. 8
9 RESULTS South Gate at Port of Wilmington Table 2 presents the results for the Guard Station at the South Gate in Wilmington for all eight scenarios. For current traffic volume (Scenarios 1 through 4), the results show that the average queues do not interfere with the closest intersection on River Road located 250 ft upstream from the Guard Station for the current Marsec level and Marsec levels 1 and 2 (Marsec levels were previously defined in Table 1). The average queue for Marsec level 3 will interfere with the intersection at River Road and the intersection at Burnett Boulevard, which is located 720 ft upstream from the Guard Station. With current volumes, the maximum queue will block the intersection at River Road for all Marsec levels. The intersection of Shipyard Boulevard and Burnett Boulevard, will not be affected by maximum queues with the current Marsec level and levels 1 and 2. The maximum queue for Marsec level 3 will block the intersection with Burnett Boulevard. Values of delay are acceptable for the current Marsec level and for levels 1 and 2, not exceeding 90 seconds per vehicle on average. For Marsec level 3, where every vehicle is inspected for at least 2 minutes, the mean delay of 23 minutes (1,380 seconds) per vehicle is very large. The frequencies of different lengths of queue for the current traffic volume and different Marsec levels are shown in Figure 2. For the 5-year cargo growth forecast, the intersection of Shipyard Boulevard with Burnett Boulevard, located 720 ft upstream from the Guard Station, will be blocked for all Marsec levels. Values of delay per vehicle will be high for the current Marsec level and for levels 1 and 2 due to longer queues. For Marsec level 3 the average delay per vehicle will be nearly 25 minutes. The frequency of different lengths of queue with five years of growth in traffic volume is shown in Figure 3. When all vehicles are stopped (Marsec level 3), the queue length was found to exceed 5,000 feet for 44 percent of the simulation time. Actually, long queues occurred at all Marsec levels. The distance from the Guard Station to the intersection of Shipyard Boulevard with Carolina Beach Road (a major arterial, US-421) is approximately 4,500 ft. It appears that this major intersection would be adversely affected by the long queues on Shipyard Boulevard, especially by those occurring under Marsec level 3. 9
10 In the case of the interchange gates inside the port, Table 3 shows that the average queues for scenarios 1 through 4 (current volume levels) can be accommodated between the Guard Station and the Interchange Gates. For scenarios 1, 2, 3, 5, 6 and 7 the maximum queue will spill back to the Guard Station causing further queues and delay outside the Port. Interestingly, for Scenarios 4 and 8 at Marsec level 3--this will not happen due to long delay in the queues outside the Guard Station. No major problems were detected for the outbound lanes at the South Gate for any of the scenarios tested. North Gate in Wilmington For current truck volumes, the results presented in Table 4 for inbound traffic at the Port of Wilmington North Gate show that the average queues for the current Marsec level and for level 1 are accommodated in the auxiliary lane on Burnett Boulevard, which is 500 feet long. Marsec levels 2 and 3 will produce average queues that spill into in the travel lane on Burnett Boulevard. Maximum queue lengths for all Marsec levels will produce queues in the travel lane on Burnett Boulevard. The average delay per vehicle exceeds 20 minutes for Marsec level 3; this will be problematic. No major problems were detected for the outbound lanes for all scenarios at the North Gate. The frequency distribution of different lengths of queue length with current traffic and different Marsec levels is shown in Figure 4. When all vehicles were stopped (Marsec level 3) the maximum queue extended over 2,000 feet during 50 percent of the simulation time. For the 5-year cargo growth forecast (scenarios 5-8 in Table 4), except for the current Marsec level, the average queue lengths will create problems for traffic operations on Burnett Boulevard. The average delay per vehicle also will be high, and will exceed 20 minutes for Marsec level 3. The frequency distribution of different levels of queue length with five years of growth in traffic volume is shown in Figure 5. The distance from the Guard Station to the major intersection of Burnett Boulevard with Carolina Beach Road is 1,875 ft. This intersection would be affected adversely under Scenarios 7 and 8 (Marsec levels 2 and 3, respectively.) 10
11 Morehead City For the current truck volume, the results presented in Table 5 for inbound traffic at the Port of Morehead City show that the average queue did not interfere with the intersection of the Port Access Road and US-70 (located 1,140 feet upstream from the Guard Station) for the current Marsec level and for levels 1 and 2. However, the average queue will spill back about 60 feet into US-70 for Marsec level 3. The maximum queue does not interfere with the intersection of the Port Access Road and US-70 for the current Marsec level and for levels 1 and 2. The maximum queue will spill back over 500 feet into US-70 for Marsec level 3. Values of delay are excessive for all Marsec levels. No major problems were detected for the outbound lanes for all scenarios. Figure 6 shows the distribution of queue lengths for inbound traffic with current traffic volumes. When all traffic is stopped at the gate the maximum queue usually extended 1,000 feet or more. For the 5-year cargo growth forecast, Table 5 shows that the average and maximum queue lengths for inbound traffic interfere with the intersection of the Port Access Road and US-70 for all Marsec levels nearly all of the time. Values of delay also are high for all Marsec levels. Figure 7 shows the frequency distribution of queue length for inbound traffic with 5-year growth volumes. Large queues were experienced for almost all simulation runs. CONCLUDING COMMENTS The Ports of Wilmington and Morehead City in NC were used to develop a methodology for investigating the effects of enhanced security measures at port gates on traffic flow at the gates and also on roads providing access to the ports. The methodology included extensive data collection, simulation models and scenario analyses. The VISSIM simulation software proved to be an effective tool to identify likely problems and generate information so that port authorities and highway agencies can make the changes of infrastructure needed to mitigate the traffic impacts of enhanced security procedures. In the cases examined the combination of traffic growth and enhanced security will likely lead to unacceptable queuing and delay for inbound traffic. These 11
12 queues will impede traffic on the surrounding street network. Clearly, appropriate measures will have to be taken, such as providing additional guard stations, to bring the queues and delays back to acceptable ranges. It should be acknowledged that the seaports used for this research are relatively small in size compared to many other ports such as those in Long Beach, Los Angeles, Charleston and Savannah. The authors believe that VISSIM can be used in the case of a larger port in a similar manner to study problems related to queuing and idling of drayage trucks at port gates for different scenarios. The effort required to code, calibrate, and run VISSIM should be within the means of a port s traffic planning staff. ACKNOWLEDGEMENT The authors would like to acknowledge the financial support provided by Southeastern Transportation Center and the encouragement of Ms. DeAnna Flinchum for this project. The project also received financial support from North Carolina State Ports Authority, and the cooperation of its officials Mr. Bill Bennett, Ms. Stephanie Ayers, Mr. Doug Campen and others -- was very helpful. NC State University and the University of Tennessee provided additional financial support. Technical help was received from Dr. J. P. Moon of NC State University. REFERENCES 1. SmartWay DrayFLEET Truck Drayage Environment and Energy Model, Version 1.0 User s Guide, The Tioga Group, Inc. and Dowling Associates, Inc., Prepared for U.S. Environmental Protection Agency, June Ceballos, G., and Curtis, O., Queue Analysis at Toll and Parking Exit Plazas: A Comparison between Multi-server Queuing Models and Traffic Simulation, Presented at the Annual Meeting of Institute of Transportation Engineers, Orlando, FL, August VISSIM User Manual. 12
13 13
14 14
15 15
16 16
17 17
18 18
19 19
20 20
OPTIMIZING RAMP METERING STRATEGIES
 OPTIMIZING RAMP METERING STRATEGIES Presented by Kouros Mohammadian, Ph.D. Saurav Chakrabarti. ITS Midwest Annual Meeting Chicago, Illinois February 7, 2006 Background Ramp control is the application of
The Folded Interchange: An Unconventional Design for the Reconstruction of Cloverleaf Interchanges
 The Folded Interchange: An Unconventional Design for the Reconstruction of Cloverleaf Interchanges I. ABSTRACT Keith A. Riniker, PE, PTOE This paper presents the Folded Interchange design and compares
The Secrets to HCM Consistency Using Simulation Models
 The Secrets to HCM Consistency Using Simulation Models Ronald T. Milam, AICP David Stanek, PE Chris Breiland Fehr & Peers 2990 Lava Ridge Court, Suite 200 Roseville, CA 95661 r.milam@fehrandpeers.com (916)
Comparing Roundabout Capacity Analysis Methods, or How the Selection of Analysis Method Can Affect the Design
 Comparing Roundabout Capacity Analysis Methods, or How the Selection of Analysis Method Can Affect the Design ABSTRACT Several analysis methods have been proposed to analyze the vehicular capacity of roundabouts.
Conclusions & Lessons Learned
 What is a DDI Recommended Practices Traffic Operations Analysis Geometric Design FHWA Review Conclusions & Lessons Learned It s not about you, it s about the public Developed by Access Utah County
APPENDIX B. Public Works and Development Engineering Services Division Guidelines for Traffic Impact Studies
 APPENDIX B Public Works and Development Engineering Services Division Guidelines for Traffic Impact Studies Revised December 7, 2010 via Resolution # 100991 Reformatted March 18, 2011 TABLE OF CONTENTS
CITY OF CLOVIS Traffic Impact Study Guidelines
 CITY OF CLOVIS Traffic Impact Study Guidelines CLOVIS, A WAY OF LIFE Approved August 25, 2014 City Council Resolution 2014-79 Prepared by City of Clovis Engineering Division Steve White, City Engineer
Dynamic Lane Merge Systems
 Dynamic Lane Merge Systems Acknowledgements Maryland State Highway Administration University of Maryland, College Park Michigan Department of Transportation Wayne State University Lane Merging Issues Merging
MULTIMODAL TRANSPORTATION IMPACT STUDY GUIDELINES
 MULTIMODAL TRANSPORTATION IMPACT STUDY GUIDELINES 1 st Edition City of San Luis Obispo 2035 Circulation Element 1 Table of Contents Introduction... 2 Process... 2 When Impact Studies Are Required... 3
A Unique Application of Railroad Preemption with Queue Mitigation at a Roundabout Interchange
 A Unique Application of Railroad Preemption with Queue Mitigation at a Roundabout Interchange Jeromy Grenard, PE, PTOE American Structurepoint Hardik Shah, PE, PTOE American Structurepoint Roundabouts
Woodburn Interchange Project Transportation Technical Report
 Final Report Woodburn Interchange Project Transportation Technical Report Prepared for Oregon Department of Transportation April 212 Prepared by DKS Associates Contents Methodologies... 4 Volume Development...
Operational Analyses of Freeway Off-Ramp Bottlenecks
 Transportation Research Procedia Volume 15, 2016, Pages 573 582 ISEHP 2016. International Symposium on Enhancing Highway Performance Operational Analyses of Freeway Off-Ramp Bottlenecks Alexander Skabardonis
Transportation and Works Department The Regional Municipality of York Yonge Street Newmarket, Ontario L3Y 6Z1
 TRANSPORTATION IMPACT STUDY (TIS) GUIDELINES FOR DEVELOPMENT APPLICATIONS Transportation and Works Department The Regional Municipality of York 17250 Yonge Street Newmarket, Ontario L3Y 6Z1 August, 2007
Advanced Transportation Management System (ATMS)
") Advanced Transportation Management System (ATMS) Presentation to the ITS Technology Workshop for Municipalities February 15, 2017 ATMS Project Background Increasing traffic volumes Roadway network is near
Advanced Transportation Management System (ATMS) Presentation to the ITS Technology Workshop for Municipalities February 15, 2017 ATMS Project Background Increasing traffic volumes Roadway network is near
A MODAL COMPARISON OF DOMESTIC FREIGHT TRANSPORTATION EFFECTS ON THE GENERAL PUBLIC EXECUTIVE SUMMARY. November 2007
 A MODAL COMPARISON OF DOMESTIC FREIGHT TRANSPORTATION EFFECTS ON THE GENERAL PUBLIC EXECUTIVE SUMMARY November 2007 Prepared by CENTER FOR PORTS AND WATERWAYS TEXAS TRANSPORTATION INSTITUTE 701 NORTH POST
The New Highway Capacity Manual 6 th Edition It s Not Your Father s HCM
 The New Highway Capacity Manual 6 th Edition It s Not Your Father s HCM Tom Creasey, PE, PhD Principal, Stantec Consulting Services Inc. Chair, TRB Highway Capacity and Quality of Service Committee Presented
6.2.2 Environmental Consequences and Mitigation Measures
 6.2 6.2.1 Introduction The existing conditions, regulatory setting, and methods of analysis for transportation under CEQA are described in Chapter 3, NEPA and CEQA Analysis. Impacts that would result from
LAS VEGAS STREET RAILROAD CROSSING RR/PUC CONNECTION AND PRELIMINARY DESIGN
 LAS VEGAS STREET RAILROAD CROSSING RR/PUC CONNECTION AND PRELIMINARY DESIGN Prepared for: City of Colorado Springs Prepared by: Felsburg Holt & Ullevig 508 South Tejon Street Colorado Springs, CO 80903
NC State Ports Authority. 21 st Century Transportation Intermodal Committee February 21, 2008 NC State Ports Authority Tom Eagar, CEO
 NC State Ports Authority 21 st Century Transportation Intermodal Committee February 21, 2008 NC State Ports Authority Tom Eagar, CEO NC State Ports Authority Facts at a Glance 2 Enterprise agency unique
IMPLEMENTING TOLL PLAZA ANALYSIS INTO FREEPLAN
 IMPLEMENTING TOLL PLAZA ANALYSIS INTO FREEPLAN By ROBIN PHILIP OSBORNE A THESIS PRESENTED TO THE GRADUATE SCHOOL OF THE UNIVERSITY OF FLORIDA IN PARTIAL FULFILLMENT OF THE REQUIREMENTS FOR THE DEGREE OF
Development of TSP warrants. to-day variability in traffic demand
 Development of TSP warrants considering vehicular emissions and day-to to-day variability in traffic demand Zeeshan Abdy Supervisor: Bruce R. Hellinga Dec 2006 Introduction Signalized intersections Traffic
The Policies section will also provide guidance and short range policies in order to accomplish the goals and objectives.
 4 Goals & Objectives INTRODUCTION The 2015-2040 MTP preserves and promotes the quality of life and economic prosperity of the MAB by providing a transportation system consistent with the regional goals.
BOSTON REGION METROPOLITAN PLANNING ORGANIZATION
 PLANNING ORGANIZATIO BOSTON REGION MPO NMETROPOLITAN BOSTON REGION METROPOLITAN PLANNING ORGANIZATION Stephanie Pollack, MassDOT Secretary and CEO and MPO Chair Karl H. Quackenbush, Executive Director,
Jim Alexander Director of Design and Engineering, Southwest Light Rail Transit Project
 Memorandum Date: January 15, 2014 To: CC: From: Subject: Jim Alexander Director of Design and Engineering, Southwest Light Rail Transit Project Paul Danielson, P.E. Project Manager, Southwest Light Rail
Volume to Capacity Estimation of Signalized Road Networks for Metropolitan Transportation Planning. Hiron Fernando, BSCE. A Thesis CIVIL ENGINEERING
 Volume to Capacity Estimation of Signalized Road Networks for Metropolitan Transportation Planning by Hiron Fernando, BSCE A Thesis In CIVIL ENGINEERING Submitted to the Graduate Faculty of Texas Tech
TABLE OF CONTENTS PAGE NUMBER. Executive Summary Why Variable Pricing? What Was Studied? User Surveys Air Quality Analysis User And Equity Analysis
 TABLE OF CONTENTS PAGE NUMBER Executive Summary Why Variable Pricing? What Was Studied? User Surveys Air Quality Analysis User And Equity Analysis Findings Scenario 1 Base Case Scenario 2 Detoll Scenario
DEVELOPMENT OF A MASTER PLAN FOR
 DEVELOPMENT OF A MASTER PLAN FOR AIRPORTS WITH VISSIM SUPPORT VISSIM USER S GROUP MEETING May 1 st 2009 Portland, Or Luis E. Maumejean Multiservicios Integrales de America S.A. de C.V. lmn@mia.com.mx OUR
Comparison of Queue Lengths Estimations at AWSC Intersections using Highway Capacity Software, Sidra Intersection, and SimTraffic
 Comparison of Queue Lengths Estimations at AWSC Intersections using Highway Capacity Software, Sidra Intersection, and SimTraffic Daniel Lai May 2, 2009 Characteristics of an All-Way Stop Controlled (AWSC)
Transit Service Guidelines
 G R E AT E R VA N CO U V E R T R A N S P O RTAT I O N A U T H O R I T Y Transit Service Guidelines PUBLIC SUMMARY REPORT JUNE 2004 Greater Vancouver Transportation Authority TRANSIT SERVICE GUIDELINES
TRANSPORTATION IMPACT ANALYSIS GUIDELINES
 TRANSPORTATION IMPACT ANALYSIS GUIDELINES SANTA CLARA COUNTY TRANSPORTATION AUTHORITY CONGESTION MANAGEMENT PROGRAM ADOPTED MARCH 2009 TABLE OF CONTENTS PART I - STATUTE AND AUTHORITY...1 CHAPTER 1. CMP
500 Interchange Design
 500 Interchange Design Table of Contents 501 Interchange Design... 5-1 July 2015 501.1 General... 5-1 501.2 Interchange Type... 5-1 501.2.1 General... 5-1 502 Interchange Design Considerations... 5-2 502.1
DEVELOPMENT, ANALYSIS, AND DESIGN OF A NEW PARKWAY AT GRADE INTERSECTION (PAGI)
") 2013 ITE Western District Annual Meeting COCEPT DEVELOPMET, AALYSIS, AD DESIG OF A EW PARKWAY AT GRADE ITERSECTIO (PAGI) Lead Author: James M. Witkowski, PhD Supporting Author: Darrell Truitt, PE The Pima
2013 ITE Western District Annual Meeting COCEPT DEVELOPMET, AALYSIS, AD DESIG OF A EW PARKWAY AT GRADE ITERSECTIO (PAGI) Lead Author: James M. Witkowski, PhD Supporting Author: Darrell Truitt, PE The Pima
CHAPTER 4 GRADE SEPARATIONS AND INTERCHANGES
 CHAPTER 4 GRADE SEPARATIONS AND INTERCHANGES 4.0 INTRODUCTION The ability to accommodate high volumes of intersecting traffic safely and efficiently through the arrangement of one or more interconnecting
EVALUATION OF INCIDENT MANAGEMENT BENEFITS USING TRAFFIC SIMULATION
 EVALUATION OF INCIDENT MANAGEMENT BENEFITS USING TRAFFIC SIMULATION Hussein Dia and Nick Cottman Department of Civil Engineering The University of Queensland Brisbane, Australia 4072 E-mail: H.Dia@uq.edu.au
siemens.com/mobility Traffic simulation with PTV Vissim Leading-edge software fully integrated in the Sitraffic landscape
 siemens.com/mobility Traffic simulation with PTV Vissim Leading-edge software fully integrated in the Sitraffic landscape For urban or interurban traffic, rail transport or private travel: To all kinds
Origin-Destination Trips and Skims Matrices
 Origin-Destination Trips and Skims Matrices presented by César A. Segovia, AICP Senior Transportation Planner AECOM September 17, 2015 Today s Webinar Content Matrix Estimation Data sources Florida Application
TRAFFIC DIVERSION RESULTING FROM RAMP METERING
 TRAFFIC DIVERSION RESULTING FROM RAMP METERING by Jingcheng Wu A Thesis Submitted in Partial Fulfillment of the Requirements for the Degree of Master of Science in Engineering at The University of Wisconsin
Construction Alternative Screening with Regional Travel Demand Model
 Construction Alternative Screening with Regional Travel Demand Model By: Marty Milkovits (Corresponding Author) Cambridge Systematics, Inc. 100 CambridgePark Drive, Suite 400 Cambridge, MA 02140 Phone:
LOCATION AND DESIGN DIVISION
 VIRGINIA DEPARTMENT OF TRANSPORTATION LOCATION AND DESIGN DIVISION INSTRUCTIONAL AND INFORMATIONAL MEMORANDUM GENERAL SUBJECT: Interstate, NHS Non-Interstate and Non-NHS (IJR / IMR Guidance) SPECIFIC SUBJECT:
COMPREHENSIVE TRANSPORTATION REVIEW THE WHARF PHASE 2 PUD
 COMPREHENSIVE TRANSPORTATION REVIEW THE WHARF PHASE 2 PUD WASHINGTON, DC September 18, 2017 Prepared by: 1140 Connecticut Avenue NW Suite 600 Washington, DC 20036 Tel: 202.296.8625 Fax: 202.785.1276 3914
New! Optimization for Intermodal Trucking
 Intermodal Trucking Optimized SM New! Optimization for Intermodal Trucking Get and Keep a Decisive Competitive Advantage The Industry's First Optimization Solution Delivers Breakthrough Performance Gains
2 Purpose and Need. 2.1 Study Area. I-81 Corridor Improvement Study Tier 1 Draft Environmental Impact Statement
 2 Purpose and Need 2.1 Study Area Interstate 81 (I-81) is relied upon for local and regional travel and interstate travel in the eastern United States. It extends 855 miles from Tennessee to New York at
TRAFFIC ANALYSES TO SUPPORT NEPA STUDIES
 VIRGINIA DEPARTMENT OF TRANSPORTATION ENVIRONMENTAL DIVISION NEPA PROGRAM LOCATION STUDIES TRAFFIC ANALYSES TO SUPPORT NEPA STUDIES CONSULTANT RESOURCE GUIDANCE DOCUMENT Issued on: November 18, 2016 Last
November 8, RE: Harrah s Station Square Casino Transportation Analysis Detailed Traffic Impact Study Review. Dear Mr. Rowe:
 November 8, 2006 Mr. Glenn Rowe, P.E. Pennsylvania Department of Transportation Bureau of Highway Safety and Traffic Engineering Commonwealth Keystone Building 400 North Street, 6 th Floor Harrisburg,
Proceedings of the 2015 Winter Simulation Conference L. Yilmaz, W. K. V. Chan, I. Moon, T. M. K. Roeder, C. Macal, and M. D. Rossetti, eds.
 Proceedings of the 2015 Winter Simulation Conference L. Yilmaz, W. K. V. Chan, I. Moon, T. M. K. Roeder, C. Macal, and M. D. Rossetti, eds. SIMULATION OF TRUCK CONGESTION IN CHENNAI PORT Gayathri Devi
A+ ACADEMY HIGH SCHOOL
 TRAFFIC MANAGEMENT PLAN FOR A+ ACADEMY HIGH SCHOOL IN DALLAS, TEXAS Prepared for: A+ Charter Schools, Inc. 8225 Bruton Road Dallas, Texas 75217 Prepared by: Texas Registered Engineering Firm F-3199 400
REQUIREMENTS FOR THE CALIBRATION OF TRAFFIC SIMULATION MODELS
 REQUIREMENTS FOR THE CALIBRATION OF TRAFFIC SIMULATION MODELS Bruce R. Hellinga Department of Civil Engineering University of Waterloo Waterloo, ON N2L 3G1 ABSTRACT The recent emphasis on utilising advanced
DISTRICT OF NORTH VANCOUVER GUIDELINES FOR THE DEVELOPMENT OF CONSTRUCTION TRAFFIC MANAGEMENT PLANS
 DISTRICT OF NORTH VANCOUVER GUIDELINES FOR THE DEVELOPMENT OF CONSTRUCTION TRAFFIC MANAGEMENT PLANS Construction Impact Mitigation Strategy Guidelines for Major Developments The District of North Vancouver
An Agent-based Simulation Tool for Evaluating Pooled Queue Performance at Marine Container Terminals
 An Agent-based Simulation Tool for Evaluating Pooled Queue Performance at Marine Container Terminals Matthew Fleming University of South Carolina Department of Civil and Environmental Engineering 00 Main
THE PROJECT. Executive Summary. City of Industry. City of Diamond Bar. 57/60 Confluence.
 THE PROJECT A freeway segment ranked 6th worst in the Nation, with levels of congestion, pollution and accidents that are simply unacceptable and which have Statewide and National implications. Executive
Analytical Tools and Decision Support Systems SANDAG I-15 ICM. ITS PA January 30 th, 2014
 Analytical Tools and Decision Support Systems SANDAG I-15 ICM ITS PA January 30 th, 2014 Project Partners/Stakeholders National ICM Evaluator National AMS Contractor 2 San Diego I-15 Corridor 21 mile corridor
GO RAIL NIAGARA SERVICE EXTENSION
 Business Case: Finch Avenue West Rapid Transit GO RAIL NIAGARA SERVICE EXTENSION INITIAL BUSINESS CASE Date: November, 2014 NOVEMBER 2015 Page 1 TABLE OF CONTENTS 1.0 Executive Summary...p.5 2.0 Introduction....p.6
Palm Beach County Fire Rescue
 Featured Case Study: Palm Beach County Fire Rescue Emergency Vehicle Signal Priority System By: Harold Slater 522 Gillingham Sugar Land, Texas 77478 1.800.952.7285 www.trafficware.com About the Author
MONITORING IMPLEMENTATION AND PERFORMANCE
 12 MONITORING IMPLEMENTATION AND PERFORMANCE The FAST Act continues the legislation authorized under MAP-21, which created a data-driven, performance-based multimodal program to address the many challenges
NATMEC June 30, 2014 Anita Vandervalk, PE, PMP
 NATMEC June 30, 2014 Anita Vandervalk, PE, PMP Agenda 1. Florida s MPM Program 2. Research Efforts and Progress 3. Source Book 4. Transitioning to Real Time Data 5. Next Steps Importance of Mobility Providing
An Evaluation of Alternative Permissive Periods on Non-Coordinated Phase Performance in Coordinated Traffic Signal Systems
 University of Tennessee, Knoxville Trace: Tennessee Research and Creative Exchange Masters Theses Graduate School 5-2005 An Evaluation of Alternative Permissive Periods on Non-Coordinated Phase Performance
Connected/Autonomous Vehicles in a
 Connected/Autonomous Vehicles in a Freight Corridor: Implementation Issues and Assumptions presented to ITS 3C Summit 2014 Mobile, AL presented by Cambridge Systematics, Inc. Kenny Voorhies, PE, PTOE September
Multi-level transport systems model for traffic management. activities
 10th ITS European Congress, Helsinki, Finland 16 19 June 2014 TP-SP 0051 Multi-level transport systems model for traffic management activities Jacek Oskarbski 1, Kazimierz Jamroz 2 1. Gdansk University
Strategic Transportation Plan. Presented to: ECO-Rapid Transit Board of Directors Presented by: Gill V. Hicks, Cambridge Systematics, Inc.
 Strategic Transportation Plan Presented to: ECO-Rapid Transit Board of Directors Presented by: Gill V. Hicks, Cambridge Systematics, Inc. June 11, 2014 1 Local Solutions for all Gateway Cities Communities
FULLY AUTONOMOUS VEHICLES: ANALYZING TRANSPORTATION NETWORK PERFORMANCE AND OPERATING SCENARIOS IN THE GREATER TORONTO AREA, CANADA
 FULLY AUTONOMOUS VEHICLES: ANALYZING TRANSPORTATION NETWORK PERFORMANCE AND OPERATING SCENARIOS IN THE GREATER TORONTO AREA, CANADA Bradley, University of Toronto Proceedings of the 52nd Annual Conference
Data processing. In this project, researchers Henry Liu of the Department of Civil Engineering and
 Data mining of transit vehicle location, passenger count, and fare collection databases for intelligent transportation applications Supporting efficient transit service by maximizing the use of available
Maine Turnpike Needs Assessment
 Maine Turnpike Needs Assessment Safety and Capacity Study Prepared for: Maine Turnpike Authority Prepared by: May 2016 ii P age TABLE OF CONTENTS EXECUTIVE SUMMARY... 1 1.1 Purpose and Scope... 1 1.2 Turnpike
LATTS II - Freight Investment Decision Principles
 LATIN AMERICA TRADE AND TRANSPORTATION STUDY (LATTS) II Emerging Principles in Freight Investment Decision Abstract An extremely important component to effective transportation planning and to this point
Stage One Reference Design Enhancements. Date: 2 October Cabinet-in-Confidence
 Stage One Reference Design Enhancements Date: 2 October 2013 Introduction This paper provides further information regarding the proposed enhancements to the Reference Design that have been identified since
The Calibration And Verification Of Simulation Models For Toll Plazas
 University of Central Florida Electronic Theses and Dissertations Masters Thesis (Open Access) The Calibration And Verification Of Simulation Models For Toll Plazas 2008 Christopher Russo University of
TERRA Engineering creates a competitive traffic data mix with Miovision
 CASE STUDY Miovision Scout TERRA Engineering creates a competitive traffic data mix with Miovision Scenario As a leader with over 20 years experience, TERRA Engineering is focused on providing a full spectrum
ITEM 8 Action May 17, 2017
 ITEM 8 Action May 17, 2017 Approval of Maryland Department of Transportation (MDOT) Additional Project Submission for the Out-Of-Cycle Air Quality Conformity Analysis for the Amendment to the 2016 CLRP
TRAFFIC & TRANSPORTATION COMMISSION AGENDA REPORT
 TRAFFIC & TRANSPORTATION COMMISSION AGENDA REPORT AGENDA ITEM #4 T/T MTG: 092616 DATE: SEPTEMBER 26, 2016 TO: TRAFFIC & TRANSPORTATION COMMISSION FROM: BENJAMIN CHAN, P.E, T.E., DEPUTY PUBLIC WORKS DIRECTOR
CE 452 Traffic Impact Assessment
 CE 452 Traffic Impact Assessment 1 Why Required? New developments Produce/ attract new traffic Production: Residences Attraction: Shops, Offices, Schools, Hospitals etc. etc. Changes in traffic pattern
I-710 Project Committee Meeting
 Los Angeles County Metropolitan Transportation Authority I-710 Project Committee Meeting January 29, 2009 Meeting Expectations Review I-710 planning context Concur on a port cargo forecast scenario to
Centered on global trade.
 Centered on global trade. A world of customers and suppliers is as close as the Port of Little Rock. The Little Rock Port Authority (LRPA) was organized in 1959 to oversee the Port and provide intermodal
MITSIMLab: Enhancements and Applications for Urban Networks
 Topic Area: C4 Paper Number: 3453 Authors: Moshe Ben-Akiva Margaret Cortes Angus Davol Haris Koutsopoulos Tomer Toledo Title: MITSIMLab: Enhancements and Applications for Urban Networks Abstract: Urban
Determining the Maximum Allowable Headway
 36 Determining the Maximum Allowable Headway The purpose of this activity is to give you the opportunity to determine the maximum allowable headway (MAH) for your intersection. Select an MAH VISSIM input
REAL-TIME MERGING TRAFFIC CONTROL AT CONGESTED FREEWAY OFF-RAMP AREAS
 REAL-TIME MERGING TRAFFIC CONTROL AT CONGESTED FREEWAY OFF-RAMP AREAS By Anastasia Spiliopoulou* PhD Dynamic Systems and Simulation Laboratory Department of Production Engineering and Management Technical
Inside the Port of Long Beach: Challenges & Opportunities
 Inside the Port of Long Beach: Challenges & Opportunities verview POLB Fact Sheet POLB Organization & Operation Public Policy & the POLB Challenges & Opportunities Your Opportunity POLB Fact Sheet verview
Delaware Department of Transportation Agriculture Supply Chain Study: Transportation Supply Chain Analysis ihs.com
 IHS TRANSPORTATION CONSULTING Delaware Department of Transportation Agriculture Supply Chain Study: Transportation Supply Chain Analysis ihs.com Overview of Findings Delmarva Freight Summit June 24 th,
U.S. 101 / San Mateo County Smart Corridor Project
 Department of Transportation District 4 - Traffic Operations October 1, 2013 U.S. 101 / San Mateo County Smart Corridor Project www.dot.ca.gov California Department of Transportation (Caltrans) Overview
Chapter 4 Future Demand Forecasts
 Chapter 4 Future Demand Forecasts This chapter summarizes the work done under Task 4 to build the Action Plan, which is further described in Tech Memos 4a (Freight Demand) and 4b (System Performance Report).
Performance Evaluation of Adaptive Ramp-Metering Algorithms Using Microscopic Traffic Simulation Model
 Performance Evaluation of Adaptive Ramp-Metering Algorithms Using Microscopic Traffic Simulation Model Lianyu Chu 1 ; Henry X. Liu 2 ; Will Recker 3 ; and H. Michael Zhang 4 Abstract: Adaptive ramp metering
Active Risk Management - Charles River Basin
 Protecting, Promoting and Enhancing our Commonwealth: Assisting MassDOT to deliver projects on Time and on Budget Active Risk Management - Charles River Basin September 18, 2013 & Massachusetts Accelerated
I-15 South, MP 0 to MP 16 Environmental Assessment. Public Hearing. August 7, :00 PM to 7:00 PM
 I-15 South, MP 0 to MP 16 Environmental Assessment Public Hearing August 7, 2012 5:00 PM to 7:00 PM 1 PROJECT OVERVIEW The Federal Highway Administration (FHWA) and the Utah Department of Transportation
Transit Applications and the EMTRAC System
 EMTRAC Systems STC, Inc. 1201 W. Randolph St. McLeansboro, IL 62859 Ph. (618) 648-2555 www.emtracsystems.com Transit Applications and the EMTRAC System It s 7:45 in the morning, and the number 10 bus is
Factors Affecting Transportation Decisions. Transportation in a Supply Chain. Transportation Modes. Road freight transport Europe
 Transportation in a Supply Chain Factors Affecting Transportation Decisions Carrier (party that moves or transports the product) Vehicle-related cost Fixed operating cost Trip-related cost Shipper (party
1.1 Purpose of the Project
 Chapter 1 Purpose and Need for East Link Project 1.1 Purpose of the Project The purpose of the East Link Project is to expand the Sound Transit Link light rail system from Seattle to Mercer Island, Bellevue
APPENDIX H: TRAVEL DEMAND MODEL VALIDATION AND ANALYSIS
 APPENDIX H: TRAVEL DEMAND MODEL VALIDATION AND ANALYSIS Travel demand models (TDM) simulate current travel conditions and forecast future travel patterns and conditions based on planned system improvements
INSIDE THIS ISSUE. mctrans.ce.ufl.edu VOLUME 64 \\ OCTOBER Streets Heat Map Freeways Animation HSM Supplement
 mctrans.ce.ufl.edu INSIDE THIS ISSUE McTrans Center University of Florida Civil & Coastal Engineering PO Box 116585 Gainesville, FL 32611-6585 Streets Heat Map Freeways Animation HSM Supplement Phone:
Data Requirements in Transportation Reauthorization Legislation Operations & Security
 Data Requirements in Transportation Reauthorization Legislation Operations & Security 1. Introduction This conference will identify and refine the data issues associated with the programs stipulated in
TRANSPORTATION IMPACT ANALYSIS GUIDELINES FOR ENVIRONMENTAL REVIEW
 TRANSPORTATION IMPACT ANALYSIS GUIDELINES FOR ENVIRONMENTAL REVIEW October 2002 The Planning Department City and County of San Francisco TABLE OF CONTENTS I. Introduction 1 II. Overview of Process and
Exclusive Facilities for Trucks in Florida: An Investigation of the Potential for Reserved Truck Lanes and Truckways on the State Highway System
 Exclusive Facilities for Trucks in Florida: An Investigation of the Potential for Reserved Truck Lanes and Truckways on the State Highway System Stephen L. Reich, Janet L. Davis, Anthony J. Ferraro, and
2040 Transportation Policy Plan Conversion to Performance Based Planning Basis. 25 th Annual CTS Transportation Research Conference May 21, 2014
 2040 Transportation Policy Plan Conversion to Performance Based Planning Basis 25 th Annual CTS Transportation Research Conference May 21, 2014 1 About the plan Long-range transportation plan for the Twin
ScienceDirect. Metering with Traffic Signal Control Development and Evaluation of an Algorithm
 Available online at www.sciencedirect.com ScienceDirect Transportation Research Procedia 8 (215 ) 24 214 European Transport Conference 214 from Sept-29 to Oct-1, 214 Metering with Traffic Signal Control
CHAPTER 14. ROADWAYS AND MARINE TRANSPORTATION
 CHAPTER 14. ROADWAYS AND MARINE TRANSPORTATION 14.1 AFFECTED ENVIRONMENT 14.1.1 Definition of Resource This section describes the existing transportation facilities, specifically roads, the Tinian International,
VISUM State-of-the-Art Travel Demand Modeling VISUM
 State-of-the-Art Travel Demand Modeling VISUM What is VISUM? VISUM is a comprehensive, flexible software system for transportation planning, travel demand modeling and network data management. VISUM is
HCM 6th Edition Planning and Preliminary Engineering Applications Guide (PPEAG) to the HCM Bringing Back-of-the-Envelope Back.
 to the HCM Bringing Back-of-the-Envelope Back.") HCM 6th Edition Planning and Preliminary Engineering Applications Guide (PPEAG) to the HCM Bringing Back-of-the-Envelope Back April, 2017 Potential Use of the HCM in Planning The HCM is commonly used to
HCM 6th Edition Planning and Preliminary Engineering Applications Guide (PPEAG) to the HCM Bringing Back-of-the-Envelope Back April, 2017 Potential Use of the HCM in Planning The HCM is commonly used to
APPROVAL TO SUBMIT COMMENTS ON I-45 AND MORE DRAFT ENVIRONMENTAL IMPACT STATEMENT
 TAC Agenda Item 09 Mailout 7/12/17 APPROVAL TO SUBMIT COMMENTS ON I-45 AND MORE DRAFT ENVIRONMENTAL IMPACT STATEMENT Background The Texas Department of Transportation, in cooperation with the Federal Highway
Application of Road Safety Audits to Urban Streets
 Application of Road Safety Audits to Urban Streets ABSTRACT EUGENE M. WILSON Professor Civil Engineering Dept. University of Wyoming Laramie, WY 82071 MARTIN E. LIPINSKI Professor Department of Civil Engineering
Evaluation of Infrastructure Design Solutions Based on Traffic Modelling
 The 9 th International Conference ENVIRONMENTAL ENGINEERING 22 23 May 2014, Vilnius, Lithuania SELECTED PAPERS eissn 2029-7092 / eisbn 978-609-457-640-9 Available online at http://enviro.vgtu.lt Section:
By Captain John C. Farmer Presented to: Knoxville Regional Transportation Planning Organization Technical Committee meeting January 10, 2017
 By Captain John C. Farmer Presented to: Knoxville Regional Transportation Planning Organization Technical Committee meeting January 10, 2017 Tennessee freight / transportation studies National and State
Fleet Optimization with IBM Maximo for Transportation
 Efficiencies, savings and new opportunities for fleet Fleet Optimization with IBM Maximo for Transportation Highlights Integrates IBM Maximo for Optimizes asset life-cycle Can result in better up-time,