TRANSPORTATION ADVISORY BOARD Of the Metropolitan Council
|
|
|
- Darleen Arlene Thomas
- 6 years ago
- Views:
Transcription
1 1. Call to Order 2. Approval of Agenda 3. Approval of August 2, 2017 Minutes 4. TAB Report 5. Committee Reports TRANSPORTATION ADVISORY BOARD Of the Metropolitan Council Notice of a Meeting of the TECHNICAL ADVISORY COMMITTEE Wednesday, September 6, 2017 Metropolitan Council 9:00 A.M. AGENDA Executive Committee (Steve Albrecht, Chair) Planning Committee (Lisa Freese, Chair) Funding and Programming Committee (Tim Mayasich, Chair) 6. Special Agenda Items TPP Update: Bicycle and Pedestrian (Steve Elmer, MTS) TPP Update: Aviation (Russ Owen, MTS) Regional Solicitation: Roadways measures (Steve Peterson, MTS) CMSP IV (Michael Corbett, MnDOT) 7. Agency Reports 8. Other Business 9. Adjournment Click here to print all agenda items at once. Streamlined Amendments going to TAB this month. Contact Joe Barbeau with questions at
2 Transportation Advisory Board Of the Metropolitan Council Minutes of a Meeting of the TECHNICAL ADVISORY COMMITTEE Wednesday, August 2, :00 A.M. Members Present: Joe MacPherson, Lyndon Robjent, Brian Sorenson, Carla Stueve, Tim Mayasich, Lisa Freese, Jan Lucke, Steve Bot, Elaine Koutsoukos, Steve Peterson, Michael Larson, Adam Harrington, Brian Isaacson, Bridget Rief, Dave Jacobson, Peter Dahlberg, Danny McCullough, Karl Keel, Steve Albrecht, Paul Oehme, Kim Lindquist, Robert Ellis, Jen Hager, Bill Dermody, Paul Kurtz (Excused: Jeff Rossate, Jean Keely, Michael Thompson, Jim Kosluchar, Jack Byers) 1. Call to Order The meeting was called to order by Steve Albrecht at 9:01 a.m. 2. Approval of Agenda A motion to approve the agenda was moved by Elaine Koutsoukos and seconded by Dave Jacobson. No discussion. Motion passed. 3. Approval of Minutes A motion to approve the minutes was moved by Lisa Freese and seconded by Bill Dermody. Elaine Koutsoukos asked that the July minutes be edited to reflect her presence. Motion passed. 4. TAB Report REPORTS TAB Chair s Report: Chair Hovland asked TAB members for their feedback on timing of the workshops for the Transportation Policy Plan. There was a workshop on the TPP in the morning. Handouts of the presentation given at the workshop were shared with the TAB members. Because of the light turnout for the workshop and the time commitment involved, those present discussed other meeting options (times/days) for these workshops to try to make it more convenient for TAB member schedules. TAB members decided to expand the TAB meeting time earlier and later. TAB will meet from 12:00-3:00 pm, August, September, and October. Agency Reports (MnDOT, MPCA, MAC and Metropolitan Council) MnDOT: Scott McBride reported that the St. Croix River Crossing opening is August 2. The 35W/Lake Street combined transit and highway project, a project of major regional significance, was let in June and will have major impacts on traffic for the next 4 years. The Franklin Street Bridge and the 38 th Street Bridge over 35W removals begin in August. MnDOT has two solicitations out. One for $20 million federal funds for highway construction projects in years with discernable freight transportation benefits. One for $18 million
3 state matching funds for state highway construction projects in with measurable economic benefits. DEED has a parallel program that funds projects on local roads for $4 million. MAC: Carl Crimmins reported that a truck hit a bridge beam and slowed construction for a week. Roadway construction is expected to be completed August 6. MSP Airport has a new website. On the website you can check flights, parking availability, and security wait times. They are hoping to add the hotel information. ACTION ITEMS : Approved Streamlined TIP Amendment to add a MnDOT median barrier HSIP project on US 10 in order to start project earlier : Approved Streamlined TIP Amendment to add a MnDOT railroad crossing project in South St. Paul in order to start project earlier. INFORMATION ITEMS 1. TMA Certification Review 2. Truck Highway Corridor Study 3. Shared-Mobility Action Plan for the Twin Cities, presented by Shared Use Mobility Center 4. Online Mapping Tool of Funded Regional Solicitation Projects 5. Expo 2023 Mark Ritchie presented information on Minnesota s bid for Expo Minnesota is one of three finalists. Decision will be made in November. Committee Reports A. Executive Committee (Steve Albrecht, Chair) The Executive Committee reviewed today s agenda. B. Planning Committee (Lisa Freese, Chair) The committee met in June and had a few information items, plus two action items Unified Planning Work Program. Lisa Freese introduced Katie White, who provided a brief presentation on the UPWP. Dave Jacobson asked what the Transit Service Allocation project is. Katie White responded that the scope has not been fully developed, but will be in coordination with all transit service providers. Lisa Freese moved and Adam Harrington seconded the recommended motion. Motion passed Long Term Comprehensive Plan: Crystal Airport. Lisa Freese presented this item. There were no questions. Lisa Freese moved and Bridget Rief seconded the recommended motion. Motion passed. C. Funding and Programming Committee (Tim Mayasich, Chair) Tim Mayasich reported that the committee met in July and its information items are later on today s agenda. 6. Special Agenda Items
4 TPP Update: Highways. (Steve Peterson, Tony Fischer, and Steve Elmer, MTS) Steve Peterson, Tony Fischer, and Steve Elmer presented on the highways content in the TPP. Steve Bot suggested that all maps be updated with the current conditions. Steve Peterson said that today s maps are what are in today s TPP. Sometimes there are data lags, but there will be a new 2016 congestion map in the next TPP. Lyndon Robjent said that the 2040 congestion map looks very dramatic and wondered if it is time to explore another PA ring around the metro area. Steve Peterson that the new Streetlight data source may help identify origin/destination pairs to determine the best locations in which to make investments. Adam Harrington asked if the congestion map represents all day congestion. Steve Peterson responded that represents more than one hour of congestion per day, which is defined as less than 45 mph. Tim Mayasich asked if the 2040 congestion map includes the transit investments (SWLRT, BLRT, Gold Line). Steve Peterson responded that it does. Americans with Disabilities Act. (Heidi Schallberg, MTS) Heidi Schallberg presented on FHWA requests for information from the state MPOs on ADA compliance. MnDOT has indicated that local jurisdictions will not be eligible for State Aid if they are not moving to compliance. Dave Jacobson asked if there was a timeline. Heidi Schallberg said that a survey from MTS would be going out within the next couple of months, and that all jurisdictions should update their plans periodically. Lyndon Robjent asked if ADA compliance would be a check box on the next solicitation; Heidi Schallberg responded that it is a consideration. Regional Solicitation Criteria, Forms, SRTS, and Pedestrian Facilities. (Joe Barbeau, MTS) Joe Barbeau presented on potential changes to the Regional Solicitation that were discussed at the July F&P meeting. Lyndon Robjent asked about signal timing qualifying criteria and the five year study. Steve Peterson responded that this item ties directly to the TPP requirements. Brian Sorenson asked about the risk assessment piece of identifying the local match. Many locals claim that they have the full amount available locally but are searching for bonding money, which may not materialize. Jan Lucke asked how often a project drops out due to lack of local match; Elaine Koutsoukos responded that one or two projects per year fall into that category. Lyndon Robjent, Brian Isaacson, and Brian Sorenson discussed the proposed language and how it might not serve the intended purpose of discouraging speculative funding arrangements. Lyndon Robjent asked why the engineering progress was removed from the criteria, and suggested that the number of points should be increased instead of eliminated. Steve Peterson responded that the scoring didn t differentiate between projects. This category has been changed from project readiness to risk assessment. 7. Agency Reports Bridget Rief said that ticket counters will be moving outside at MSP airport. The eventual goal is to have only bag drop inside the building. In August new automated security lanes will debut. Adam Harrington said that this coming Sunday and Monday the APTA Sustainability and Mobility Conference will be in MSP. 8. Other Business and Adjournment There being no other business, the meeting adjourned at 10:24am. Prepared by:
5 Katie White
6 Aviation Direction and Plan Introduction TAB - Technical Advisory Committee September 6, 2017

7 Today s Topics - Aviation Where are we now, what are the current issues? Where are we headed? How will we get there? What are the changes expected in this plan update? 2
8 What Feedback are We Looking for Today? Your reactions to high-level concepts Your ideas for clarifying the story Your ideas on things that should change Things you d like to bring back for future discussion 3
9 Where are We Now?

10 Where are We Now? Aviation System 9 Airports in the Regional System One of the largest airport systems in the country. Aviation System consists of more than just airports/seaplane bases 5
11 Where are We Now? Aircraft Operations 600, , , , , , Air Carrier Air Taxi General Aviation Military 6


12 Where are We Now? System Investments Recent Improvements: Minneapolis - St. Paul International Terminal 2, 4 Gate Expansion Minneapolis - St. Paul International Hotel under Construction Forest Lake Airport Paved Runway in

 MSP, Flying Cloud, Anoka-Blaine,")
13 Where are We Now? Long Term Comp Plans Two LTCP s will be updated by 2018 for the TPP. (Lake Elmo, Crystal) MSP, Flying Cloud, Anoka-Blaine, St. Paul Downtown, and Airlake be updated in 2020 prior to the next TPP update. 8
14 Where are We Headed?
15 Where are We Headed? Current TPP Planning Framework Goals Transportation System Stewardship 10 Objectives (Aviation-related Only) State of good repair (Maintain what we have!) Operate efficiently and cost-effectively Safety and Security Improve safety and security Access to Destinations Competitive Economy Multimodal options (transit/bike) to access MSP Improve multimodal access to job concentrations Continued development of MSP as a Major Hub Provide state of the art facilities that will attract and retain businesses and residents Healthy Environment Airport LTCP s should include Surface Water Management MAC should Monitor Air Quality Collaborate on Aircraft Noise Abatement and Mitigation Leveraging Investments to Guide Land Use Notification to FAA prior to permitting tall structures Joint Airport/Community Zoning Boards should be established Equity Throughout!
16 Key Aviation Outcomes Maintain Airport Infrastructure Efficient/Cost Effective Operations at all Airports Keep and Attract Businesses and Residents Growth in MSP air passenger service and number of airlines, to attain competitive prices Support alternative modes to access the airport Understand the emerging aerial drone regulations/operations 11
17 How Will We Get There?
18 Aviation Funding FEDERAL (FAA) Airport Improvement Program MnDOT - Aeronautics Airport Construction Grant Program Airport Maintenance and Operation Program Hangar Loan Revolving Account Program Airport Sponsor (MAC, city of Forest Lake, South St. Paul) for Airport Improvements Local and Sponsor Funding Municipal Airports Private Airports Metropolitan Airports Commission Private Funding 13
19 How Will We Get There? Aviation Investment Direction and Plan Planned Investments: Based on existing conditions and capacity demands Long Term Comprehensive Plans provide the framework and guidance to future investments No new airports in the system, and no airports are planned to close 14

20 What Changes are Expected in the Plan?
21 What are the Changes Expected in this Plan? Include Long Term Comp Plans that have been completed Updating Aviation Appendices Refreshing Long Term Comp Plan update schedule Expanded information on Aerial Drone operations in the region 16
22 What s Next? Future Meeting Schedule Month September October November Topic(s) Aviation Aviation Edits Aviation Red-Line 17

23 Questions 18
24 Bridges Prioritizing Criteria and Measures September 6, 2017 Definition: A bridge rehabilitation or replacement project located on a non Freeway Principal Arterial or A Minor Arterial functionally classified roadway, consistent with the latest TAB approved functional classification map. Bridge structures that have a separate span for each direction of travel can apply for both spans as part of one application. The bridge must carry vehicular traffic, but may also include accommodations for other modes. Bridges that are exclusively for bicycle or pedestrian traffic must apply under one of the Bicycle and Pedestrian Facilities application categories. Rail only bridges are not eligible for funding. Completely new bridges, interchanges, or overpasses should apply in the Roadway Expansion application category. Examples of Bridge Rehabilitation/Replacement Projects: Bridge rehabilitation of 20 or more feet with a sufficiency rating less than 80 and classified as structurally deficient or functionally obsolete. Bridge replacement of 20 or more feet with a sufficiency rating less than 50 and classified as structurally deficient or functionally obsolete. Scoring: Criteria and Measures Points % of Total Points 1. Role in the Regional Transportation System and Economy % Measure A Average ddistance to the nearest parallel bridges Measure B Connection to Total Jobs, and Manufacturing/Distribution 30 Jobs, and Post Secondary Students Measure C Current daily heavy commercial trafficregional Truck Corridor 3565 Tiers Measure D Freight project elements Usage % Measure A Current daily person throughput 100 Measure B Forecast 2040 average daily traffic volume Equity and Housing Performance % Measure A Connection to disadvantaged populations and project s benefits, impacts, and mitigation 30 Measure B Housing Performance Score Infrastructure Condition % Measure A Bridge Sufficiency Rating 300 Measure B Load Posting Multimodal Elements and Existing Connections % Measure A Transit, bicycle, or pedestrian project elements and connections Risk Assessment % Measure A Risk Assessment Form 75 Sub Total 1, % 7. Cost Effectiveness 100 9% 1
25 Measure A Cost effectiveness (total project cost/total points awarded/ 100 total project cost) Total 1,100 2
26 Bridge Rehabilitation/Replacement 1. Role in the Regional Transportation System and Economy (195 Points) Tying regional policy (Thrive MSP2040) to the Regional Solicitation, this criterion measures the project s ability to serve a transportation purpose within the regional transportation system and economy based on how well it fulfills its functional classification role, serves heavy commercial traffic, and connects to employment, post secondary students, and manufacturing/distribution related employment, and aligns with the HighwayRegional Truck Corridor Study tiers. A. MEASURE: Address how the project route fulfills its role in the regional transportation system by measuring the diversion to the nearest parallel crossing (must be an A minor arterial or principal arterial) if the proposed project is closed. (100 points) The project must be located on a non freeway principal arterial or an A minor arterial. RESPONSE: Distance from one end of proposed project to nearest parallel crossing (that is an A minor arterial or principal arterial) and then back to the other side of the proposed project: Location of nearest parallel crossing: Explanation (Limit 2,800 characters; approximately 400 words): Reference the Roadway Area Definition map generated at the beginning of the application process. Report the total area and project length, as depicted on the Roadway Area Definition map, to calculate the average distance between the project and the closest parallel A Minor Arterials or Principal Arterials on both sides of the project. Upload the Roadway Area Definition map used for this measure. SCORING GUIDANCE ( Points) The applicant with the furthest average distance from the closest parallel A Minor Arterial or Principal Arterial bridge on both sides will receive the full points. Remaining projects will receive a proportionate share of the full points. For example, if the project being scored had a distance of 8 miles and the top project was had an averagea distance of 10 miles, this applicant would receive (8/10)* points or points. Metropolitan Council staff will provide average distance data for all projects to ensure consistency of methodology between applications. B. MEASURE: Reference the Regional Economy map generated at the beginning of the application process. Report the employment, manufacturing/distribution related employment, and post secondary students enrolled within one mile, as depicted on the Regional Economy map. Upload the Regional Economy map used for this measure. RESPONSE (Data from the Regional Economy map): Existing Employment within 1 Mile: (Maximum of 30 points) Existing Manufacturing/Distribution Related Employment within 1 Mile: (Maximum of 30 points) Existing Post Secondary Students: (Maximum of 18 points) 3
27 Bridge Rehabilitation/Replacement SCORING GUIDANCE (30 Points) All Census block groups that are included within or intersect the buffer area around the project will be included. The applicant with the highest existing total employment will receive the full points. Remaining projects will receive a proportionate share of the full points. For example, if the application being scored had 1,000 workers within one mile and the top project had 1,500 workers, this applicant would receive (1,000/1,500)*30 points or 20 points. The applicant with the highest existing manufacturing/distribution related employment will receive the full points. Remaining projects will receive a proportionate share of the full points equal to the existing manufacturing/distribution related employment within one mile of the project being scored divided by the project with the highest manufacturing/distribution related employment within one mile multiplied by the maximum points available for the measure (20). For example, if the application being scored had 1,000 manufacturing/distribution related workers within one mile and the top project had 1,500 manufacturing/distribution related workers, this applicant would receive (1,000/1,500)*30 points or 20 points. The applicant with the highest number of post secondary students will receive 18 points. Remaining projects will receive a proportionate share of the 18 points. For example, if the application being scored had 1,000 students within one mile and the top project had 1,500 students, this applicant would receive (1,000/1,500)*18 points or 12 points. The scorer will assess if the applicant would score highest with the total employment part of the measure, the manufacturing/distribution employment part of the measure, or the education part of the measure and give the applicant the highest of the three scores out of a maximum of 30 points. Note: Due to the use of multiple sub measures, two applicants will receive the full 30 points. C. MEASURE: Provide the current daily heavy commercial traffic at one location on the A Minor Arterial or Non Freeway Principal Arterial project length. It is required that an actual daily count is collected or available data from within the last three years is used (from the city, county or MnDOT). Heavy commercial traffic is defined as all trucks with at least two axles and six tires. This criterionmeasure relies on the results onin the HighwayRegional Truck Corridor Study, which prioritized all roadwaysprincipal and minor arterials based on truck volume, truck percentage of total traffic, proximity to freight industry clusters, and proximity to regional freight terminals. (65 points) Use the final study report for this measure: 2/Transit Plans, Studies Reports/Highways Roads/Truck Freight Corridor Study.aspx RESPONSE (Select one for your project, based on the HighwayRegional Truck Corridor Study): The project is located on either a Tier 1, Tier 2, or Tier 3 corridor: (65 Points) 4
28 Bridge Rehabilitation/Replacement The project is not located on a Tier 1, Tier 2, or Tier 3 corridor: (0 Points) RESPONSE: Location: Current daily heavy commercial traffic volume: Date heavy commercial count taken: SCORING GUIDANCE (365 Points) The scorer will assign points based on which of the above scores applies. Note that multiple applicants can score the maximum point allotment. The applicant with the highest daily heavy commercial traffic at a location along the bridge will receive the full points. Remaining projects will receive a proportionate share of the full points. For example, if the application being scored had a heavy commercial volume of 750 vehicles and the top project had a heavy commercial volume of 1,000 vehicles, this applicant would receive (750/1,000)*35 points, or 26 points. C. MEASURE: Discuss any freight elements that are included as part of the project and how they improve efficiency, security, or safety. (15 points) Address how the proposed project safely integrates freight. Freight elements could be project elements such as upgrading a non ten ton roadway to a ten ton roadway, adding paved shoulders, wider shoulders, acceleration lanes, or longer turning lanes added specifically to accommodate freight movements. RESPONSE (Limit 1,400 characters; approximately 200 words): SCORING GUIDANCE (15 Points) The project with the most comprehensive freight elements included as part of the project will receive the full points. Remaining projects will receive a share of the full points at the scorer s discretion. 5
29 Bridge Rehabilitation/Replacement 2. Usage (130 Points) This criterion quantifies the project s potential impact by measuring the current daily person throughput and future vehicular traffic that will be served by the project. These roadway users directly benefit from the project improvements on the A Minor Arterial or Non Freeway Principal Arterial. A. MEASURE: Metropolitan Council staff will calculate the current daily person throughput at one location on the A Minor Arterial or Non Freeway Principal Arterial bridge using the current average annual daily traffic (AADT) volume and average annual ridership. The applicant must identify the location along the project length and provide the current AADT volume from the MnDOT 50 series maps and existing transit routes that travel on the road. Reference the Transit Map for transit routes along the project. Ridership data will be provided by the Metropolitan Council staff, if public transit is currently provided on the project length. Current Daily Person Throughput = (current average annual daily traffic volume x 1.30 vehicle occupancy) + average annual daily transit ridership ( ) RESPONSE: Location: Current AADT volume: Existing Transit Routes on the Project: SCORING GUIDANCE (100 Points) The applicant with highest current daily person throughput will receive the full points for the measure. Remaining projects will receive a proportionate share of the full. For example, if the application being scored had a daily person throughput of 1,000 vehicles and the top project had a daily person throughput of 1,500 vehicles, this applicant would receive (1,000/1,500)*100 points or 67 points. B. MEASURE: Provide the forecast (2040) average daily traffic volume at the same location on the A Minor Arterial or Non Freeway Principal Arterial bridge, as identified in the previous measure. The applicant may choose to use a county or city travel demand model based on the Metropolitan Council model to identify the forecast (2040) average daily traffic volume or have Metropolitan Council staff determine the forecast volume using the Metropolitan Council model and project location. Respond as appropriate to the use of one type of forecast model. (30 points) RESPONSE: Use Metropolitan Council model to determine forecast (2040) ADT volume METC Staff Forecast (2040) ADT volute OR RESPONSE: Approved county or city travel demand model to determine forecast (2040) ADT volume Forecast (2040) ADT volume : 6
30 Bridge Rehabilitation/Replacement SCORING GUIDANCE (30 Points) The applicant with the highest forecast (2040) ADT volume will receive the full points for the measure. Remaining projects will receive a proportionate share of the full points. For example, if the application being scored had a daily forecast of 28,000 vehicles and the top project had a daily forecast of 32,000 vehicles, this applicant would receive (28,000/32,000)*30 points or 26 points. 7
31 Bridge Rehabilitation/Replacement 3. Equity and Housing Performance (100 Points) This criterion addresses the project s positive and negative impacts to low income populations, people of color, children, people with disabilities, and the elderly. The criterion also evaluates a community s efforts to promote affordable housing. A. MEASURE: Reference the Socio Economic Conditions map generated at the beginning of the application process. Identify the project s location as it applies in the listed responses below. Describe the project s positive benefits, and negative impacts, and mitigation for lowincome populations; people of color; children, people with disabilities, and the elderly. Geographic proximity alone is not sufficient to receive the full points listed below. In order to receive the maximum points, the response should address the benefits, impacts, and mitigation for the populations listed. Upload the Socio Economic Conditions map used for this measure. RESPONSE (Select one, based on the Socio Economic Conditions map): Project located in Area of Concentrated Poverty with 50% or more of residents are people of color (ACP50): (0 to 30 Points) (up to 100% of maximum score) Project located in Area of Concentrated Poverty: (0 to 24 Points) (up to 80% of maximum score) Project s census tracts are above the regional average for population in poverty or population of color: (0 to 18 Points) (up to 60% of maximum score) Project located in a census tract that is below the regional average for population in poverty or populations of color, or includes children, people with disabilities, or the elderly: (0 to 12 Points) (up to 40% of maximum score) RESPONSE (Limit 2,800 characters; approximately 400 words): SCORING GUIDANCE (30 Points) Based on the Socio Economic Conditions map s output, the applicant will select the appropriate option from the above bullets. However, geographic proximity alone is not sufficient to receive full points. The applicant must fully describe the positive benefits and negative impacts (with mitigation to address the issue) for those identified groups. Each project will first be graded on a 10 point scale, not accounting for geography. Each score from the 10 point scale will then be adjusted to the appropriate geography. The project with the most positive benefits and appropriate mitigation for negative impacts will receive the full points relative to its maximum geographic sub area defined above. Remaining projects will receive a share of the full points at the scorer s discretion. This response is intended to be qualitative. Metropolitan Council staff will score this measure. Note: Due to the geographic adjustment to scores, it is possible that the above process will result in no project receiving the maximum allotment of 30 points. In this case, the highest scoring application for this measure will be adjusted to receive the full 30 points. Remaining projects will receive a proportionate share of the full points. For example, if the application being scored had 10 points and the top project had 20 points, this applicant would receive (10/20)*30 points or 15 points. 8
32 Bridge Rehabilitation/Replacement B. MEASURE: Metropolitan Council staff will award points to the project based on the Housing Performance Score for the city or township in which the project is located. The score includes consideration of affordability and diversification, local initiatives to facilitate affordable workforce housing development or preservation, and density of residential development. A one mile radius buffer will be drawn around the project. If the radius buffer enters more than one jurisdiction, the points will be awarded based on the proportionate population of the Census blocks in each jurisdiction that are all or partially located in the area within the one mile radius buffer. If a project is located in a city or township with no allocation of affordable housing need (either there is no forecasted household growth or the area does not have land to support sewered development), then the project will not be disadvantaged by this measure and the project s total score will be adjusted as a result. (70 Points) RESPONSE (Affordable Housing Score completed by Metropolitan Council staff): City/Township: Population from the Regional Economy map within City/Township: SCORING GUIDANCE (70 Points) The applicant with the highest Housing Performance Score will receive the full points. Remaining projects will receive a proportionate share of the full points. For example, if the application being scored had a Housing Performance Score of 55 and the top project had a Housing Performance Score of 90, this applicant would receive (55/90)*70 points or 43 points. Note: Metropolitan Council staff will score this measure. Projects will use the city Housing Performance Score based on the project location. A one mile radiusbuffer will be drawn around the project. If the radius buffer enters more than one jurisdiction, the points will be awarded based on the proportionate population of the Census blocks in each jurisdiction that are all or partially located in the area within the one mile radius buffer. If a project is located in a city or township with no allocation of affordable housing need (either there is no forecasted household growth or the area does not have land to support sewered development), then the project will not be disadvantaged by this measure and the project s total score will be adjusted as a result. If this is the case, then the total points possible in the application will be 930 instead of 1,000. The total points awarded through the rest of the application (900 as a hypothetical example) will be divided by 930, then multiplied by 1,000. Therefore, a project scoring 900 out of 930, will equate to 968 points on a 1,000 point scale. If a portion of the project is located in a city with an affordable housing allocation and the other portion is located in a township with no affordable housing allocation, then a combination of the weighted average and no affordable housing methodologies should be used. This will result in a total score that will be somewhere between 930 and 1,000; then the score will need to be adjusted to fit a 1,000 point scale. 9
33 Bridge Rehabilitation/Replacement 4. Infrastructure Condition (400 Points) This criterion will assess the age and condition of the bridge facility being improved. Bridge improvement investments should focus on the higher needs of unsafe facilities. If there are two separate spans, then the applicant should take the average bridge sufficiency rating of the two spans. A. MEASURE: Identify the bridge sufficiency rating, from the most recent market structure inventory report. Attach the report to the application. RESPONSE: Bridge Sufficiency Rating: SCORING GUIDANCE (300 Points) The applicant with the lowest bridge sufficiency rating will receive the full points for the measure. Remaining projects will receive a proportionate share of the full points equal to the rating for the project with the lowest bridge sufficiency rating divided by the project being scored multiplied by the maximum points available for the measure (300). For example, if the top project had a bridge sufficiency rating of 35 and the application being scored had a score of 55, this applicant would receive (35/55)*300 points or 191 points. B. MEASURE: Identify whether the bridge is posted for load restrictions. RESPONSE (Check box if the bridge is load posted): Load Posted (Check box if the bride is load posted): SCORING GUIDANCE (100 Points) Applicants will receive the points shown depending on whether the bridge is load posted. The applicant can only score 0 or 100 points for this measure. 10
34 Bridge Rehabilitation/Replacement 5. Multimodal Elements and Connections (100 Points) This criterion measures how the project improves the travel experience, safety, and security for other modes of transportation and addresses the safe integration of these modes. The Transportation Policy Plan requires that explicit consideration of all users of the transportation system be considered in the planning and scoping phase of roadway projects. A. MEASURE: Describe how the project positively affects the multimodal system. Discuss any bicycle, pedestrian, or transit elements that are included as part of the project and how they improve the travel experience, safety, and security for users of these modes. Applicants should make sure that new multimodal elements described in the response are accounted for as part of the cost estimate form earlier in the application. Applicants should note if there is no transit service in the project area and identify supporting studies or plans that address why a mode may not be incorporated in the project (e.g., a bicycle system plan that locates bikeway facilities on a lower volume parallel route). Describe how the proposed multimodal improvements positively affect identified alignments in the Regional Bicycle Transportation Network (RBTN) or along a regional trail, if applicable. Also, describediscuss the existing bicycle, pedestrian, and transit connections and how the project enhances these connections. Furthermore, address how the proposed project safely integrates all modes of transportation (i.e., vehicles, bicyclists, transit, and pedestrians) and, if applicable, supports planned transitway stations. RESPONSE (Limit 2,800 characters; approximately 400 words): SCORING GUIDANCE (100 Points) The project with thethat most positively affects comprehensive the multimodal elements included as part of the project will receive the full points. Remaining projects will receive a share of the full points at the scorer s discretion. The project score will be based on the quality of the improvements, as opposed to being based solely on the number of modes addressed. Points can be earned for incorporating multimodal project elements, positively affecting identified alignments in the Regional Bicycle Transportation Network (RBTN) or regional trail, or for making connections with existing multimodal systems. Scorers should make sure that new multimodal elements described in the response are accounted for on the cost estimate form earlier in the application. 11
35 Bridge Rehabilitation/Replacement 6. Risk Assessment (75 Points) This criterion measures the number of risks associated with successfully building the project. High risk applications increase the likelihood that projects will withdraw at a later date. If this happens, the region is forced to reallocate the federal funds in a short amount of time or return them to the US Department of Transportation. and the steps already completed in the project development process. These steps are outlined in the checklist in the required Risk Assessment. A. MEASURE: Applications involving construction must complete the Risk Assessment. This checklist includes activities completed to date, as well as an assessment of risks (e.g., rightof way acquisition, proximity to historic properties, etc.). RESPONSE (Complete Risk Assessment): SCORING GUIDANCE (75 Points) The applicant with the most points on the Risk Assessment (more points equate to less project risk) will receive the full points for the measure. Remaining projects will receive a proportionate share of the full points. For example, if the application being scored had 40 points and the top project had 70 points, this applicant would receive (40/70)*75 points or 43 points. 12
36 Bridge Rehabilitation/Replacement 7. Cost Effectiveness (100 Points) This criterion will assess the project s cost effectiveness based on the TAB eligible project cost (not including noise walls) and total points awarded in the previous six criteria. A. MEASURE: This measure will calculate the cost effectiveness of the project. Metropolitan Council staff will divide the number of points awarded in the previous criteria by the TABeligible project cost (not including noise walls) by the total number of points awarded in the previous criteria. Cost Effectiveness = total TAB eligible project cost (not including noise walls)/total number of points awarded in previous criteria/total TAB eligible project cost (not including noise walls) RESPONSE (Points Awarded and Cost Effectiveness will be Automatically Calculated): Total Project Cost (entered in Project Cost Form): SCORING GUIDANCE (100 Points) The applicant with the lowest dollar value per point earned in the application (i.e., the benefits) will receive the full points for the measure. Remaining projects will receive a proportionate share of the full points. For example, if the top project had 35,000 and the application being scored had 70,000, this applicant would receive (35,000/70,000) *100 points for 50 points.the applicant with the most points (i.e., the benefits) per dollar will receive the full points for the measure. Remaining projects will receive a proportionate share of the full points. For example, if the top project received.0005 points per dollar and the application being scored received points per dollar, this applicant would receive (.00025/.0005)*100 points or 50 points. The scorer for this measure will also complete a reasonableness check of the total project cost that is used for this measure. The scorer may follow up with the applicant to clarify any questions. Up to 50 percent of points awarded for this measure can be deducted if the scorer does not believe that the cost estimate is reasonable. Discretion will be given the applicant that they best understand the unique conditions of the project and have provided a fair cost estimate to successfully deliver the project. TOTAL: 1,100 POINTS 13
37 Roadway SystemTraffic Management Technologies Prioritizing Criteria and Measures September 6, 2017 Definition: An Intelligent Transportation System (ITS) or similar projects that primarily benefits roadway users. Roadway SystemTraffic Management Technology projects can include project elements along a single corridor, a continuous route (could be more than onemultiple roadwaycorridors,) or within a defined specific geographic area such as a downtown area. The To be eligible, system management projects must make improvements to at least one A Minor Arterial or non freeway Principal Arterial as part of the project. Projects that are more transit focused must apply in the Transit System Modernization application category. Examples of Roadway SystemTraffic Management Technology Projects: Flashing yellow arrow traffic signals New/replacement fiber optic cables Traffic signal retiming projects used for traffic control, Integrated corridor signal coordination etc.communication Traffic signal control system upgrades New/replacement CCTV cameras New/replacement detectors New/replacement variable message Passive detectors for bicyclists and signs & other info improvements pedestrians Incident management coordination New/replacement traffic mgmt. centers Scoring: Criteria and Measures Points % of Total Points 1. Role in the Regional Transportation System and Economy % Measure A Average distance to nearest parallel roadwaysfunctional classification of project 5550 Measure B Connection to Total Jobs and Manufacturing/Distribution Jobs Regional Truck Corridor Study Tiers 3050 Measure C Integration within existing traffic management systems 7050 Measure D Freight project elements Coordination with other agencies Usage % Measure A Current daily person throughput 85 Measure B Forecast 2040 average daily traffic volume Equity and Housing Performance % Measure A Connection to disadvantaged populations and project s benefits 30 Measure B Housing Performance Score Infrastructure Age % Measure A Date of construction Upgrades to obsolete equipment Congestion Reduction/Air Quality % Measure A Vehicle delay reducedcongested roadway 150 Measure B Kg of emissions reducedemissions and congestion benefits of project Safety % Measure A Crashes reduced
38 Roadway System Management Criteria and Measures Points % of Total Points Measure B Safety issues in project area Multimodal Elements and Existing Connections % Measure A Transit, bicycle, or pedestrian project elements and connections Risk Assessment % Measure A Risk Assessment Form 75 Sub Total 1, % 99. Cost Effectiveness 100 9% Measure A Cost effectiveness (total project cost/total points awarded/ total project cost) 100 Total 1,100 15
39 Roadway System Management 1. Role in the Regional Transportation System and Economy ( Points) Tying regional policy (Thrive MSP2040) to the Regional Solicitation, this criterion measures the project s ability to serve a transportation purpose within the regional transportation system and economy based on how well it fulfills its functional classification role, serves heavy commercial trafficaligns with the RegionalHighway Truck Corridor Study, and connects to employment, students, and manufacturing/distribution related employmentintegrates with existing traffic management systems, and provides coordination across agencies.. The project must be located on at least one Nnon Ffreeway Pprincipal Aarterial or A Mminor Aarterial. A. MEASURE: Address how the project route fulfills its role in the regional transportation system. The project must be located on at least one Non Freeway Principal Arterial or A Minor Arterial. Reference the functional classification(s) that the project would serve. Investment in a higher functionally classified roadway (i.e., the principal arterial system) serves a more regional purpose and will result in more points. Upload the Roadway Area Definition map used for this measure. RESPONSE (CalculationSelect one): The majority of the project funds will be invested on the principal arterial system: (450 points) The majority of the project funds will be invested on the A minor arterial system: (205 points) The majority of the project funds will be invested on the collector or local system with some investment either on the principal arterial or A minor arterial system: (0 points) SCORING GUIDANCE (50 Points) The scorer will assign points based on which of the above scores applies. Note that multiple applicants are able to score the maximum point allotment. If no applicant scores 50 points, the 25 point projects will be adjusted to 50 points, while the zero point projects will remain at zero.scoring GUIDANCE (55 Points) The applicant with the furthest average distance from the closest parallel A Minor Arterials or Principal Arterials on both sides will receive the full points. Remaining projects will receive a proportionate share of the full points. For example, if the project being scored had a distance of 8 miles and the top project was had an average distance of 10 miles, this applicant would receive (8/10)*55 points or 44 points. Metropolitan Council staff will provide average distance data for all projects to ensure consistency of methodology between applications. A. B. MEASURE: Reference Regional Economy map generated at the beginning of the application process. Report the employment and manufacturing/distribution related employment, and post secondary students enrolled within one mile, as depicted on the Regional Economy map. (30 Points) This criterion relies on the results on the HighwayRegional Truck Corridor Study, which prioritized all roadwaysprincipal and minor arterials based on truck volume, truck percentage of total traffic, proximity to freight industry clusters, and proximity to regional freight terminals. (50 points) 16
40 Roadway System Management Use the final study report for this measure: 2/Transit Plans, Studies Reports/Highways Roads/Truck Freight Corridor Study.aspx RESPONSE (Select one for your project, based on the HighwayRegional Truck Corridor Study): The majority of the project funds will be invested on either a Tier 1, Tier 2, or Tier 3 corridor: (50 Points) A majority of the project funds will NOT be invested on a Tier 1, Tier 2, or Tier 3 corridor, but at least 10 percent of the funds will be invested on these corridors: (25 Points) No project funds will be invested on a Tier 1, Tier 2, or Tier 3 corridor: (0 Points) SCORING GUIDANCE (50 Points) The scorer will assign points based on which of the above scores applies. Note that multiple applicants can score the maximum point allotment. If no applicant scores points, the 3025 point projects will be adjusted to 65 points, while the zero point projects will remain at zero.scoring GUIDANCE (30 Points) All Census block groups that are included within or intersect the buffer area around the project will be included. The applicant with the highest existing total employment will receive the full points. Remaining projects will receive a proportionate share of the full points. For example, if the application being scored had 1,000 workers within one mile and the top project had 1,500 workers, this applicant would receive (1,000/1,500)*30 points or 20 points. The applicant with the highest existing manufacturing/distribution related employment will receive the full points. Remaining projects will receive a proportionate share of the full points equal to the existing manufacturing/distribution related employment within one mile of the project being scored divided by the project with the highest manufacturing/distribution related employment within one mile multiplied by the maximum points available for the measure. For example, if the application being scored had 1,000 manufacturing/distribution related workers within one mile and the top project had 1,500 manufacturing/distribution related workers, this applicant would receive (1,000/1,500)*30 points or 20 points. The applicant with the highest number of students will receive 18 points. Remaining projects will receive a proportionate share of the 18 points. For example, if the application being scored had 1,000 students within one mile and the top project had 1,500 students, this applicant would receive (1,000/1,500)*18 points or 12 points. The scorer will assess if the applicant would score highest with the total employment part of the measure, the manufacturing/distribution employment part of the measure, or the education part of the measure and give the applicant the highest of the three scores out of a maximum of 30 points. Note: Due to the use of multiple sub measures, two applicants will receive the full 30 points. 17
41 Roadway System Management C. MEASURE: Provide the current daily heavy commercial traffic at one location along the A Minor Arterial or Non Freeway Principal Arterial project length. It is required that an actual count is collected or that available data from within the last three years is used (from the city, county or MnDOT). Heavy commercial traffic is defined as all trucks with at least two axles and six tires.discuss how the proposed project integrates and/or builds on existing traffic management infrastructure (examples of systems include traffic signal systems, freeway management systems, and incident management systems). (50 Points) RESPONSE (Limit 2,800 characters; approximately 400 words): RESPONSE: Location: Current daily heavy commercial traffic volume: Date(s) heavy commercial count taken: SCORING GUIDANCE (30 50 Points) The applicant with the highest daily heavy commercial traffic at a location along the project length will receive the full points. Remaining projects will receive a proportionate share of the full points. For example, if the application being scored had a heavy commercial volume of 750 vehicles and the top project had a heavy commercial volume of 1,000 vehicles, this applicant would receive (750/1,000)*30 points, or 23 points.the applicant will describe how the project would build on other infrastructure and management systems. Prioritizing projects that complement existing infrastructure and management methods, the scorer will award the full share of points to the project that best builds on other infrastructure and management systems. Remaining projects will receive a share of the full points at the scorer s discretion. This response is intended to be qualitative. D. MEASURE: Discuss any freight elements that are included as part of the project and how they improve efficiency, security, or safety. (10 points)address how the proposed project safely integrates freight. Freight elements could be project elements such as upgrading a non ten ton roadway to a ten ton roadway, adding paved shoulders, wider shoulders, acceleration lanes, or longer turning lanes added specifically to accommodate freight movements.demonstrate how the project provides or enhances coordination among operational and management systems and/or jurisdictions. (25 points) RESPONSE (Limit 21,8400 characters; approximately 4200 words): SCORING GUIDANCE ( Points) The project that best provides or enhances coordination among operational and management systems and/or jurisdictions with the most comprehensive freight elements included as part of the project will receive the full points. Remaining projects will receive a share of the full points at the scorer s discretion. 18
42 Roadway System Management 2. Usage ( Points) This criterion quantifies the project s potential impact by measuring the current daily person throughput and future vehicular traffic that will be served by the project. These roadway users directly benefit from the project improvements. A. MEASURE: Metropolitan Council staff will calculate the current daily person throughput at one location along the A minor arterial or non freeway principal arterial project length using the current average annual daily traffic (AADT) volume and average annual daily transit ridership. If more than one corridor or location is included in the project, then the applicant should select the corridor where the most investment is being made with the project. The applicant must identify the location along the project length and provide the current AADT volume from the MnDOT 50 series maps and existing transit routes that travel on the road. Reference the Transit Map for transit routes along the project. Ridership data will be provided by the Metropolitan Council staff, if public transit is currently provided on the project length. (805 points) Current Daily Person Throughput = (current average annual daily traffic volume x 1.30 vehicle occupancy) + average annual daily transit ridership ( ) RESPONSE: Location: Current AADT volume: Existing Transit transit Routes routes on the Projectat the location noted above: SCORING GUIDANCE (85805 Points) The project with highest current daily person throughput will receive the full points for the measure. Remaining projects will receive a proportionate share of the full points. For example, if the application being scored had a daily person throughput of 1,000 vehicles and the top project had a daily person throughput of 1,500 vehicles, this applicant would receive (1,000/1,500)*85805 points or 546 points. B. MEASURE: Provide the forecast (2040) average daily traffic volume at the same location along the A minor arterial or non freeway principal arterial project length, as identified in the previous measure. The applicant may choose to use a county or city travel demand model based on the Metropolitan Council model to identify the forecast (2040) average daily traffic volume or have Metropolitan Council staff determine the forecast volume using the Metropolitan Council model and project location. Respond as appropriate to the use of one type of forecast model. (40 points) RESPONSE: Use Metropolitan Council model to determine forecast (2040) ADT volume If checked, METC Staff will provide Forecast (2040) ADT volume OR RESPONSE: Approved county or city travel demand model to determine forecast (2040) ADT volume Forecast (2040) ADT volume: SCORING GUIDANCE (40 Points) 19
43 Roadway System Management The applicant with the highest forecast (2040) ADT volume will receive the full points for the measure. Remaining projects will receive a proportionate share of the full points. For example, if the application being scored had a daily forecast of 28,000 vehicles and the top project had a daily forecast of 32,000 vehicles, this applicant would receive (28,000/32,000)*40 points or 35 points. 20
44 Roadway System Management 3. Equity and Housing Performance (100 Points) This criterion addresses the project s positive and negative impacts to low income populations, people of color, children, people with disabilities, and the elderly. The criterion also evaluates a community s efforts to promote affordable housing. A. MEASURE: Reference the Socio Economic Conditions map generated at the beginning of the application process. Identify the project s location as it applies in the listed responses below. Describe the project s positive benefits, and negative impacts, and mitigation for lowincome populations; people of color; children, people with disabilities, and the elderly. Geographic proximity alone is not sufficient to receive the full points listed below. In order to receive the maximum points, the response should address the benefits, impacts, and mitigation for the populations listed. Upload the Socio Economic Conditions map used for this measure. RESPONSE (Select one, based on the Socio Economic Conditions map): Project located in Area of Concentrated Poverty with 50% or more of residents are people of color (ACP50): (0 to 30 Points) (up to 100% of maximum score) Project located in Area of Concentrated Poverty: (0 to 24 Points) (up to 80% of maximum score) Project s census tracts are above the regional average for population in poverty or population of color: (0 to 18 Points) (up to 60% of maximum score) Project located in a census tract that is below the regional average for population in poverty or populations of color, or includes children, people with disabilities, or the elderly: (0 to 12 Points) (up to 40% of maximum score) RESPONSE (Limit 2,800 characters; approximately 400 words): SCORING GUIDANCE (30 Points) Based on the Socio Economic Conditions map s output, the applicant will select the appropriate option from the above bullets. However, geographic proximity alone is not sufficient to receive full points. The applicant must fully describe the positive benefits and negative impacts (with mitigation to address the issue) for those identified groups. Each project will first be graded on a 10 point scale, not accounting for geography. Each score from the 10 point scale will then be adjusted to the appropriate geography. The project with the most positive benefits and appropriate mitigation for negative impacts will receive the full points relative to its maximum geographic sub area defined above. Remaining projects will receive a share of the full points at the scorer s discretion. This response is intended to be qualitative. Metropolitan Council staff will score this measure. Note: Due to the geographic adjustment to scores, it is possible that the above process will result in no project receiving the maximum allotment of 30 points. In this case, the highest scoring application for this measure will be adjusted to receive the full 30 points. Remaining projects will receive a proportionate share of the full points. For example, if the application being scored had 10 points and the top project had 20 points, this applicant would receive (10/20)*30 points or 15 points. 21
45 Roadway System Management B. MEASURE: Metropolitan Council staff will award points to the project based on the Housing Performance Score for the city or township in which the project is located. The score includes consideration of affordability and diversification, local initiatives to facilitate affordable workforce housing development or preservation, and density of residential development. If the project is in more than one jurisdiction, the points will be awarded based on a weighted average using the length of the projectpercent of total funds to be spent in each jurisdiction. For stand alone intersection, bridge, underpass, and interchange projects, a one mile radius buffer will be drawn around the project. If the radius buffer enters more than one jurisdiction, the points will be awarded based on the proportionate population of the Census blocks in each jurisdiction that are all or partially located in the area within the one mile radius buffer. If a project is located in a city or township with no allocation of affordable housing need (either there is no forecasted household growth or the area does not have land to support sewered development), then the project will not be disadvantaged by this measure and the project s total score will be adjusted as a result. RESPONSE (Affordable Housing Score completed by Metropolitan Council staff): City/Township: Length of SegmentPercent of total funds to be spend within City/Township: SCORING GUIDANCE (70 Points) The applicant with the highest Housing Performance Score will receive the full points. Remaining projects will receive a proportionate share of the full points. For example, if the application being scored had a Housing Performance Score of 55 and the top project had a Housing Performance Score of 90, this applicant would receive (55/90)*70 points or 43 points. Note: Metropolitan Council staff will score this measure. Projects will use the city Housing Performance Score based on the project location. If a project is located in more than one jurisdiction, the points will be awarded based on a weighted average of the city or township scores for the project location based on the length of the project in each jurisdiction. For stand alone roadway (intersection, bridge, underpass, and interchange) projects, a one mile radiusbuffer will be drawn around the project. If the radius buffer enters more than one jurisdiction, the points will be awarded based on the proportionate population of the Census blocks in each jurisdiction that are all or partially located in the area within the one mile radius buffer. If a project is located in a city or township with no allocation of affordable housing need (either there is no forecasted household growth or the area does not have land to support sewered development), then the project will not be disadvantaged by this measure and the project s total score will be adjusted as a result. If this is the case, then the total points possible in the application will be 930 instead of 1,000. The total points awarded through the rest of the application (900 as a hypothetical example) will be divided by 930, then multiplied by 1,000. Therefore, a project scoring 900 out of 930, will equate to 968 points on a 1,000 point scale. 22
46 Roadway System Management If a portion of the project is located in a city with an affordable housing allocation and the other portion is located in a township with no affordable housing allocation, then a combination of the weighted average and no affordable housing methodologies should be used. This will result in a total score that will be somewhere between 930 and 1,000; then the score will need to be adjusted to fit a 1,000 point scale. 23
47 Roadway System Management 4. Infrastructure Age (75 Points) This criterion will assess the age of the infrastructure elements being improved. Roadway system management investments should focus on improving and replacing existing equipment that is beyond its useful life degree to which functionally obsolete infrastructure elements are being replaced and improved. A. MEASURE: Identify Describe how various type(s) and age(s) of ITS, signal/control, and/or communication equipment will be improved or replaced as part of this project relative to its age and whether it is functionally obsolete, as reflected in the project cost estimate. RESPONSE: Equipment to be improved: Date of equipment installation (year): RESPONSE (Limit 2,800 characters; approximately 400 words): SCORING GUIDANCE (75 Points) The project that best provides for stewardship of public funds and resource by replacing functionally obsolete equipment and finding cost effective solutions to upgrade viable equipment will receive the full points. Remaining projects will receive a share of the full points at the scorer s discretion.all applicants replacing equipment past the total useful life, as listed below, will receive full points. Projects replacing more than one type or age of equipment should be scored based on the average remaining useful life. Remaining projects will receive a proportionate share of the full points equal to the total useful life minus the remaining useful life for the project being scored divided by the total useful life. If there are no projects at or past the useful life of the equipment, the applicant with shortest remaining useful life will receive full points, and remaining projects will receive a proportionate share. For example, if the oldest project was installed 18 years ago (traffic signal) and the application being scored was installed 14 years ago, this applicant would receive (14/18)*75 points, or 58 points. Equipment Useful Life Values ITS Equipment: 10 years Traffic Signals/Control Equipment: 20 years Communication Equipment: 10 years 24
48 Roadway System Management 5. Congestion Reduction/Air Quality (200 Points) This criterion measures the project s ability to reduce congestion. In addition, it will address its ability to improve congested intersections operating at unacceptable levels of service during peak hour conditions.make improvements in congested corridors. The project will also be measured based on its ability to reduce emissions. A. MEASURE: Council staff will use Streetlight travel speed data to compare the peak hour travel speed in the project area to free flow conditions.conduct a volume to capacity (V/C) ratio analysis at one or more of the intersections being located If more than one corridor or location is included in the project, then the applicant should select the corridor on which the most investment is being made with the project. The applicant must identify the corridor as part of the response. (150 Points) using existing turning movement counts (collected within the last three years) in the a.m. or p.m. peak hour and the Synchro or HCM software. The applicant must show the current total peak hour V/C ratio delay at one or more intersections (or rail crossings) and the reduction in total peak hour intersection delayv/c ratio at these intersections (or rail crossings), in seconds, due to the project. If more than one intersection (or rail crossing) is examined, then the V/C ratio delay reduced by each intersection can be added together to determine the project s total reductiontotal. For roadway projects that include a railroad crossing, the applicant should conduct fieldwork during either the a.m. or p.m. peak hour to determine the total peak hour delay reduced by the projectreduction resulting from the project. Applicants can also add together intersection delay reduced and railroad delay reduced, if they both will be improved by the project. The applicant should include the appropriate Synchro or HCM full reports (including the Timing Page Report) that support the improvement in total peak hour delay and should conduct the analysis using the following: Under the network settings, all defaults should be used for lanes, volumes, phases and simulation Use Synchro s automatic optimization to determine cycle, offset and splits (for traffic signals) Project improvements assumed in the build condition should be reflected in the total project cost, such as additional through or turn lanes and protective left turn phasing Roadway lengths for intersection approaches must be the same length for before and after scenarios Total Peak Hour Delay Reduced (Seconds) = Total Peak Hour Delay/Vehicle x Vehicles Per Hour RESPONSE (Calculation): Corridor: Corridor Start and End Points: Total Peak Hour Delay/Vehicle without the Project (Seconds/Vehicle): Total Peak Hour Delay/Vehicle with the Project (Seconds/Vehicle): 25
49 Roadway System Management Total Peak Hour Delay/Vehicle Reduced by the Project (Seconds/Vehicle): Volume (Vehicles Per Hour): Total Peak Hour Delay Reduced by the Project (Seconds): SCORING GUIDANCE (150 Points) The applicant with the most congestion (measured by the largest percentage decrease in peak hour travel speeds relative to free flow conditions)most peak hour vehicle delay reduced by the project improvement will receive the full points for the measure. Remaining projects will receive a proportionate share of the points. For example, if the application being scored showed a 5% decrease of travel speeds in the peak hour relative to free flow conditions reduced delay by 5,000.8 seconds and the top project reduced delay by 25, secondshad a 10% reduction, this applicant would receive (5/10)*150 points, or 75 points. A. MEASURE: Using the Synchro or HCM analysis completed in the previous measure, identify the total peak hour emissions reduction in kilograms (CO, NO X, VOC) due to the project. The applicant should include the appropriate Synchro or full HCM reports (including the Timing Page Report) that support the improvement in total peak hour emissions. If more than one intersection is examined, then the emissions reduced by each intersection can be can added together to determine the total emissions reduced by the project. Total Peak Hour Emissions Reduced (Kilograms)= Total Peak Hour Emissions Reduced per Vehicle x Vehicles Per Hour If more than one intersection is examined, the response is a total of all emissions reduced. Respond to one of the following sections, depending on project type: 1. Roadway projects that do not include new roadway segments or railroad gradeseparation elements 2. Roadway projects that are constructing new roadway segments, but do not include railroad grade separation elements (for Roadway Expansion applications only) 3. Roadway projects that include railroad grade separation elements RESPONSE (Calculation): Total (CO, NO X, and VOC) Peak Hour Emissions/Vehicle without the Project (Kilograms): Total (CO, NO X, and VOC) Peak Hour Emissions/Vehicle with the Project (Kilograms): Total (CO, NO X, and VOC)Peak Hour Emissions Reduced/Vehicle by the Project (Kilograms): Volume (Vehicles Per Hour): B. Total (CO, NO X, and VOC) Peak Hour Emissions Reduced by the Project (Kilograms): Discuss how the project will reduce emissions and congestion. The applicant should focus on any reduction in CO, NO X, and VOC. Projects on roadways that provide relief to congested, parallel principal arterial roadways should reference the current MnDOT Metro Freeway Congestion Report and discuss the systemwide emissions and congestion impact of the proposed improvements. 26
50 Roadway System Management SCORING GUIDANCE (50 Points) The project that is most likely to reduce emissions and congestion will receive the full points. Remaining projects will receive a share of the full points at the scorer s discretion.the applicant with the most kilograms reduced by the project improvement will receive the full points for the measure. Remaining projects will receive a proportionate share of the full. For example, if the application being scored reduced emissions by 3 kilograms and the top project reduced emissions by 5 kilograms, this applicant would receive (3/5)*50 points or 30 points. 27
51 Roadway System Management 6. Safety (200 Points) This criterion addresses the project s ability to correct deficiencies and improve the overall safety of an existing or future roadway facility. It will assess the project s monetized safety benefits. A. MEASURE: Calculate the reduction in the total number of crashes due to improvements on the A Minor Arterial or Non Freeway Principal Arterial made by the project. The applicant must base the estimate of crash reduction on the methodology consistent with the latest MnDOT Metro District Highway Safety Improvement Program (HSIP) application. Applicants should focus on the crash analysis for reactive projects starting on page 7 through page 11, in addition to Appendix A, E, and F. Crash data must be obtained for the project length using the MnDOT TIS system average for calendar years through Crash data should include all crash types and severity, including pedestrian and bicycle crashes. Applicants should request crash data from MnDOT as early as possible. The applicant must then attach a listing of the crashes reduced and the HSIP Benefit/Cost (B/C) worksheet that identifies the resulting benefit associated with the project. As part of the response, please detail and attach the crash modification factor(s) used from FHWA s Crash Modification Factors Clearinghouse: This measure requests the monetized safety benefit of the project. The cost of the project is scored in the Cost Effectiveness criterion. RESPONSE (Calculation): Crash Modification Factors Used: Rationale for Crash Modifications Selected (Limit 1,400 characters; approximately 200 words): Project Benefit ($) from B/C ratio : Explanation of Methodology: SCORING GUIDANCE (150 Points) The applicant with the highest dollar value of benefits will receive the full points for the measure. Remaining projects will receive a proportionate share of the full points. For example, if the application being scored had safety benefits of $11,000,000 and the top project had safety benefits of $16,000,000, this applicant would receive (11,000,000/16,000,000)*150 points or points. B. MEASURE: Discuss how the project will improve safety issues in the project area. As part of the response, the applicant may want to reference the project relative to County Highway Safety Plan or similar planning documents and what the project will specifically do to improve the safety issue. RESPONSE (Limit 2,800 characters; approximately 400 words): SCORING GUIDANCE (150 Points) 28
52 Roadway System Management The project that will provide the most safety benefits and alleviate identified safety concerns will receive the full points. Remaining projects will receive a share of the full points at the scorer s discretion. 29
53 Roadway System Management 7. Multimodal Elements and Existing Connections ( Points) This criterion measures how the project improves the travel experience, safety, and security for other modes of transportation, and addresses the safe integration of these modes. The Transportation Policy Plan requires that explicit consideration of all users of the transportation system be considered in the planning and scoping phase of roadway projects. A. MEASURE: Describe how the project positively affects the multimodal system. Discuss any bicycle, pedestrian, or transit elements that are included as part of the project and how they improve the travel experience, safety, and security for users of these modes. Applicants should make sure that new multimodal elements described in the response are accounted for as part of the cost estimate form earlier in the application. Applicants should note if there is no transit service in the project area and identify supporting studies or plans that address why a mode may not be incorporated in the project (e.g., a bicycle system plan that locates bikeway facilities on a lower volume parallel route). Describe how the proposed multimodal improvements positively affect identified alignments in the Regional Bicycle Transportation Network (RBTN) or along a regional trail, if applicable. Describe Discuss the existing bicycle, pedestrian, and transit connections and how the project enhances these connections. RESPONSE (Limit 2, 800 characters; approximately 400 words) : SCORING GUIDANCE ( Points) The project with thethat most positively affects comprehensive the multimodal elements included as part of the project system will receive the full points. Remaining projects will receive a share of the full points at the scorer s discretion. The project score will be based on the quality of the improvements, as opposed to being based solely on the number of modes addressed. Points can be earned for incorporating multimodal project elements, positively affecting identified alignments in the Regional Bicycle Transportation Network (RBTN) or regional trail, or for making connections with existing multimodal systems. Scorers should make sure that new multimodal elements described in the response are accounted for on the cost estimate form earlier in the application. 30
54 Roadway System Management 8. Risk Assessment (75 Points) This criterion measures the number of risks associated with successfully building the project. High risk applications increase the likelihood that projects will withdraw at a later date. If this happens, the region is forced to reallocate the federal funds in a short amount of time or return them to the US Department of Transportation. and the steps already completed in the project development process. These steps are outlined in the checklist in the required Risk Assessment. A. MEASURE: Applications involving construction must complete the Risk Assessment. This checklist includes activities completed to date, as well as an assessment of risks (e.g., rightof way acquisition, proximity to historic properties, etc.). RESPONSE (Complete Risk Assessment): SCORING GUIDANCE (75 Points) The applicant with the most points on the Risk Assessment (more points equate to less project risk) will receive the full points for the measure. Remaining projects will receive a proportionate share of the full points. For example, if the application being scored had 40 points and the top project had 70 points, this applicant would receive (40/70)*75 points or 43 points. 31
55 Roadway System Management 9. Cost Effectiveness (100 Points) This criterion will assess the project s cost effectiveness based on the total TAB eligible project cost (not including noise walls) and total points awarded in the previous 8 criteria. A. MEASURE: Calculate the cost effectiveness of the project. Metropolitan Council staff will divide the number of points awarded in the previous criteria by the TAB eligible project cost (not including noise walls) by the total number of points awarded in the previous criteria. Cost effectiveness = total TAB eligible project cost (not including noise walls)/total number of points awarded in previous criteria/total TAB eligible project cost (not including noise walls) RESPONSE (This measure will be calculated after the scores for the other measures are tabulated by the Scoring Committee): Total Project Cost (entered in Project Cost Form): SCORING GUIDANCE (100 Points) The applicant with the lowest dollar value per point earned in the application (i.e., the benefits) will receive the full points for the measure. Remaining projects will receive a proportionate share of the full points. For example, if the top project had 35,000 and the application being scored had 70,000, this applicant would receive (35,000/70,000) *100 points for 50 points.the applicant with the most points (i.e., the benefits) per dollar will receive the full points for the measure. Remaining projects will receive a proportionate share of the full points. For example, if the top project received.0005 points per dollar and the application being scored received points per dollar, this applicant would receive (.00025/.0005)*100 points or 50 points. The scorer for this measure will also complete a reasonableness check of the total project cost that is used for this measure. The scorer may follow up with the applicant to clarify any questions. Up to 50 percent of points awarded for this measure can be deducted if the scorer does not believe that the cost estimate is reasonable. Discretion will be given the applicant that they best understand the unique conditions of the project and have provided a fair cost estimate to successfully deliver the project. TOTAL: 1,100 POINTS 32
56 Roadway Reconstruction/Modernization and Spot Mobility Prioritizing Criteria and Measures September 6, 2017 Definition: A roadway project that does not add thru lane capacity, but reconstructs, reclaims, or modernizes, or adds new spot mobility elements (e.g., new turn lanes, traffic signal, or roundabout)the facility. Routine maintenance including mill and overlay projects are not eligible. Projects must be located on a non freeway principal arterial or A minor arterial functionally classified roadway, consistent with the latest TAB approved functional classification map. Examples of Roadway Reconstruction/Modernization and Spot Mobility Projects: Intersection improvements or alternative intersections such as unsignalized or signalized reduced conflict intersections. Interchange reconstructions that do not involve new ramp movements or added thru lanes Turn lanes (not continuous) Two lane to three lane conversions Four lane to three lane conversions Addition or replacement of traffic signals Shoulder improvements Strengthening a non 10 ton roadway Raised medians, frontage roads, access modifications, or other access management Roadway improvements that add multimodal elements New alignments that replace an existing alignment and do not expand the number of lanes Roundabouts Scoring: Criteria and Measures Points % of Total Points 1. Role in the Regional Transportation System and Economy % Measure A System Congestion and Principal Arterial Intersection Conversion Study PrioritiesAverage distance to nearest parallel roadways 8065 Measure B Connection to Total Jobs and Manufacturing/Distribution Jobs 3040 Measure C Regional Truck Corridor Study TiersCurrent daily heavy commercial 5065 traffic Measure D Freight project elements Usage % Measure A Current daily person throughput 110 Measure B Forecast 2040 average daily traffic volume Equity and Housing Performance % Measure A Connection to disadvantaged populations and project s benefits 30 Measure B Housing Performance Score Infrastructure Age/Condition % Measure A Date of construction 50 Measure B Geometric, structural, or infrastructure deficiencies Congestion Reduction/Air Quality % Measure A Vehicle delay reduced 4550 Measure B Kg of emissions reduced Safety % Measure A Crashes reduced Multimodal Elements and Existing Connections % Measure A Transit, bicycle, or pedestrian project elements and connections Risk Assessment % Measure A Risk Assessment Form 75 33
57 Roadway Reconstruction and Modernization Criteria and Measures Points % of Total Points 9. Cost Effectiveness 100 9% Measure A Cost effectiveness (total project cost/total points awarded/total project cost) 100 Total 1,100 34
58 Roadway Reconstruction and Modernization 1. Role in the Regional Transportation System and Economy ( Points) Tying regional policy (Thrive MSP2040) to the Regional Solicitation, this criterion measures the project s ability to serve a transportation purpose within the regional transportation system and economy based on how well it reduces systemwide congestion; aligns with the Principal Arterial Intersection Conversion Study; fulfills its functional classification role, serves heavy commercial traffic, and connects to employment, and manufacturing/distribution related employment, and post secondary students; and aligns with the Regional Truck Corridor Study. A. MEASURE: Address how the project route fulfills its role in the regional transportation system as identified by its current functional classification. Respond as appropriate to one type of functional classification. For A minor arterial projects only: The measure will analyze the level of congestion on the parallel A minor arterial or principal arterial to determine the importance of the roadway in reducing congestion on the entire Regional Highway System. Council staff will use Streetlight travel speed data on an applicantselected parallel route to the proposed project. The analysis will compare the peak hour travel speed on a parallel route to free flow conditions on this same route to see whether the proposed project could relieve congestion on the parallel route too. The applicant must identify the parallel corridor as part of the response. RESPONSE (Calculation): Parallel Corridor: Parallel Corridor Start and End Points: For principal arterial projects only: The measure relies on the results on the Principal Arterial Intersection Conversion Study, which prioritized non freeway principal arterial intersections. (65 points) Use the final study report for this measure: metrocouncil.org/paics RESPONSE Select one for your project, based on the Principal Arterial Intersection Conversion Study): Proposed at grade project that improves a High Priority Intersection: (65 Points) Proposed at grade project that improves a Medium Priority Intersection: (55 Points) Proposed at grade project that improves a Low Priority Intersection: (45 Points) Not listed as a priority in the study: (0 Points) SCORING GUIDANCE (80 65 Points) Expanders, Augmentors, Connectors, and Non Freeway Principal Arterials: The applicant with the furthest average distance from the closest parallel A Minor Arterials or Principal Arterials on both sides will receive the full points. The furthest average distance will be considered separately for Expanders, Augmentors, Connectors, and Non Freeway Principal Arterials. A Minor Arterials and Principal Arterials will be scored separately for this measure. 35
59 Roadway Reconstruction and Modernization A minor arterials: The applicant with the with the most congestion on a parallel route (measured by the largest percentage decrease in peak hour travel speeds relative to free flow conditions) will receive the full points. Remaining projects will receive a proportionate share of the full points. For example, if the application being scored showed a 5% decrease of travel speeds in the peak hour on the parallel route relative to free flow conditions and the top project had a 10% reduction, this applicant would receive (5/10)*65 points, or 33 points.relievers: The applicant with the highest number of hours per day in which current capacity exceeds the design capacity on the Principal Arterial will receive the full points. Remaining Reliever projects will receive a proportionate share of the full points, calculated as described above. In order to be awarded points as an A minor arterial the proposed project must show some delay reduction in measure 5A. If the project does not reduce delay, then it cannot reduce systemwide congestion and will score 0 points for this measure. The scorer will have discretion in determining whether the applicant selected the correct parallel A minor arterial or principal arterial (and location on that segment). Principal arterials: Projects will be scored based on their Principal Arterial Intersection Conversion Study priorities and project type. B. MEASURE: Reference the Regional Economy map generated at the beginning of the application process. Report the existing employment and manufacturing/distribution related employment, and post secondary students enrolled within one mile, as depicted on the Regional Economy map. Upload the Regional Economy map used for this measure. RESPONSE (Data from the Regional Economy map): Existing Employment within 1 Mile: (Maximum of points) Existing Manufacturing/Distribution Related Employment within 1 Mile: (Maximum of points) Existing Post Secondary Students: (Maximum of points) 36
60 Roadway Reconstruction and Modernization SCORING GUIDANCE (30 40 Points) All Census block groups that are included within or intersect the buffer area around the project will be included. The applicant with the highest existing total employment will receive the full points. Remaining projects will receive a proportionate share of the full points. For example, if the application being scored had 1,000 workers within one mile and the top project had 1,500 workers, this applicant would receive (1,000/1,500)*30 40 points or points. The applicant with the highest existing manufacturing/distribution related employment will receive the full points. Remaining projects will receive a proportionate share of the full points equal to the existing manufacturing/distribution related employment within one mile of the project being scored divided by the project with the highest manufacturing/distribution related employment within one mile multiplied by the maximum points available for the measure (30). For example, if the application being scored had 1,000 manufacturing/distribution related workers within one mile and the top project had 1,500 manufacturing/distribution related workers, this applicant would receive (1,000/1,500)*30 40 points or points. The applicant with the highest number of post secondary students will receive 18 points. Remaining projects will receive a proportionate share of the 18 points. For example, if the application being scored had 1,000 students within one mile and the top project had 1,500 students, this applicant would receive (1,000/1,500)*18 24 points or points. The scorer will assess if the applicant would score highest with the total employment part of the measure, the manufacturing/distribution employment part of the measure, or the education part of the measure and give the applicant the highest of the three scores out of a maximum of points. Note: Due to the use of multiple sub measures, two applicants will receive the full points. C. MEASURE: This criterion relies on the results on the Regional Truck Corridor Study, which prioritized all principal and minor arterials based on truck volume, truck percentage of total traffic, proximity to freight industry clusters, and proximity to regional freight terminals. (65 points) Use the final study report for this measure: 2/Transit Plans, Studies Reports/Highways Roads/Truck Freight Corridor Study.aspx RESPONSE (Select one for your project, based on the Regional Truck Corridor Study): Tier 1: (65 Points) Tier 2: (45 Points) Tier 3: (25 Points) None of the tiers: (0 Points) Provide the current daily heavy commercial traffic at one location along the A Minor Arterial or Non Freeway Principal Arterial project length. It is required that an actual count is 37
61 Roadway Reconstruction and Modernization collected, or that available data from within the last three years is used (from the city, county or MnDOT). Heavy commercial traffic is defined as all trucks with at least two axles and six tires. (50 Points) RESPONSE: Location: Current daily heavy commercial traffic volume: Date heavy commercial count taken: SCORING GUIDANCE (50 Points) The applicant with the highest daily heavy commercial traffic at a location along the project length will receive the full points. Remaining projects will receive a proportionate share of the full points. For example, if the application being scored had a heavy commercial volume of 750 vehicles and the top project had a heavy commercial volume of 1,000 vehicles, this applicant would receive (750/1,000)*50 points, or 38 points. C. MEASURE: Discuss any freight elements that are included as part of the project and how they improve efficiency, security, or safety. Address how the proposed project safely integrates freight. Freight elements could be project elements such as upgrading a non ten ton roadway to a ten ton roadway, adding paved shoulders, wider shoulders, acceleration lanes, or longer turning lanes added specifically to accommodate freight movements. RESPONSE (Limit 1,400 characters; approximately 200 words): SCORING GUIDANCE (15 Points) The project with the most comprehensive freight elements included as part of the project will receive the full points. Remaining projects will receive a share of the full points at the scorer s discretion. 38
62 Roadway Reconstruction and Modernization 2. Usage (175 Points) This criterion quantifies the project s potential impact by measuring the current daily person throughput and future vehicular traffic that will be served by the project. These roadway users directly benefit from the project improvements on the A Minor Arterial or Non Freeway Principal Arterial. A. MEASURE: The applicant must identify the location along the project length and provide the current AADT volume from the MnDOT 50 series maps and existing transit routes that travel on the road (reference Transit Connections Map). Ridership data will be provided by the Metropolitan Council staff, if public transit is currently provided on the project length. Metropolitan Council staff will calculate the current daily person throughput at one location along the A Minor Arterial or Non Freeway Principal Arterial project length using the current average annual daily traffic (AADT) volume and average annual ridership. Current Daily Person Throughput = (current average annual daily traffic volume x 1.30 vehicle occupancy) + average annual daily transit ridership ( ) RESPONSE: Location: Current AADT volume: Existing Transit Routes on the Project: SCORING GUIDANCE (110 Points) The applicant with highest current daily person throughput will receive the full points for the measure. Remaining projects will receive a proportionate share of the full points. For example, if the application being scored had a daily person throughput of 1,000 vehicles and the top project within the same functional classification had a daily person throughput of 1,500 vehicles, this applicant would receive (1,000/1,500)*110 points or 73 points. B. MEASURE: Provide the forecast (2040) average daily traffic volume at the same location along the A Minor Arterial or Non Freeway Principal Arterial project length, as identified in the previous measure. The applicant may choose to use a county or city travel demand model based on the Metropolitan Council model to identify the forecast (2040) average daily traffic volume or have Metropolitan Council staff determine the forecast volume using the Metropolitan Council model and project location. Respond as appropriate to the use of one type of forecast model. RESPONSE: Use Metropolitan Council model to determine forecast (2040) ADT volume If checked, METC Staff will provide Forecast (2040) ADT volume OR RESPONSE: Identify the approved county or city travel demand model to determine forecast (2040) ADT volume: Forecast (2040) ADT volume : 39
63 Roadway Reconstruction and Modernization SCORING GUIDANCE (65 Points) The applicant with the highest forecast (2040) ADT volume will receive the full points for the measure. Remaining projects will receive a proportionate share of the full points. For example, if the application being scored had a daily forecast of 28,000 vehicles and the top project had a daily forecast of 32,000 vehicles, this applicant would receive (28,000/32,000)*65 points or 57 points. 40
64 Roadway Reconstruction and Modernization 3. Equity and Housing Performance (100 Points) This criterion addresses the project s positive and negative impacts to low income populations, people of color, children, people with disabilities, and the elderly. The criterion also evaluates a community s efforts to promote affordable housing. A. MEASURE: Reference the Socio Economic Conditions map generated at the beginning of the application process. Identify the project s location as it applies in the listed responses below. Describe the project s positive benefits, and negative impacts, and mitigation for lowincome populations; people of color; children, people with disabilities, and the elderly. Geographic proximity alone is not sufficient to receive the full points listed below. In order to receive the maximum points, the response should address the benefits, impacts, and mitigation for the populations listed. Upload the Socio Economic Conditions map used for this measure. RESPONSE (Select one, based on the Socio Economic Conditions map): Project located in Area of Concentrated Poverty with 50% or more of residents are people of color (ACP50): (0 to 30 Points) (up to 100% of maximum score) Project located in Area of Concentrated Poverty: (0 to 24 Points) (up to 80% of maximum score) Project s census tracts are above the regional average for population in poverty or population of color: (0 to 18 Points) (up to 60% of maximum score) Project located in a census tract that is below the regional average for population in poverty or populations of color, or includes children, people with disabilities, or the elderly: (0 to 12 Points) (up to 40% of maximum score) RESPONSE (Limit 2,800 characters; approximately 400 words): SCORING GUIDANCE (30 Points) Based on the Socio Economic Conditions map s output, the applicant will select the appropriate option from the above bullets. However, geographic proximity alone is not sufficient to receive full points. The applicant must fully describe the positive benefits and negative impacts (with mitigation to address the issue) for those identified groups. Each project will first be graded on a 10 point scale, not accounting for geography. Each score from the 10 point scale will then be adjusted to the appropriate geography. The project with the most positive benefits and appropriate mitigation for negative impacts will receive the full points relative to its maximum geographic sub area defined above. Remaining projects will receive a share of the full points at the scorer s discretion. This response is intended to be qualitative. Metropolitan Council staff will score this measure. Note: Due to the geographic adjustment to scores, it is possible that the above process will result in no project receiving the maximum allotment of 30 points. In this case, the highest scoring application for this measure will be adjusted to receive the full 30 points. Remaining projects will receive a proportionate share of the full points. For example, if the application being scored had 10 points and the top project had 20 points, this applicant would receive (10/20)*30 points or 15 points. 41
65 Roadway Reconstruction and Modernization B. MEASURE: Metropolitan Council staff will award points to the project based on the Housing Performance Score for the city or township in which the project is located. The score includes consideration of affordability and diversification, local initiatives to facilitate affordable workforce housing development or preservation, and density of residential development. If the project is in more than one jurisdiction, the points will be awarded based on a weighted average using the length of the project in each jurisdiction. For stand alone intersection, bridge, underpass, and interchange projects, a one mile radius buffer will be drawn around the project. If the radius buffer enters more than one jurisdiction, the points will be awarded based on the proportionate population of the Census blocks in each jurisdiction that are all or partially located in the area within the one mile radius buffer. If a project is located in a city or township with no allocation of affordable housing need (either there is no forecasted household growth or the area does not have land to support sewered development), then the project will not be disadvantaged by this measure and the project s total score will be adjusted as a result. RESPONSE (Affordable Housing Score completed by Metropolitan Council staff): City/Township: Length of Segment (Population for stand alone projects from Regional Economy map) within City/Township: SCORING GUIDANCE (70 Points) The applicant with the highest Housing Performance Score will receive the full points. Remaining projects will receive a proportionate share of the full points. For example, if the application being scored had a Housing Performance Score of 55 and the top project had a Housing Performance Score of 90, this applicant would receive (55/90)*70 points or 43 points. Note: Metropolitan Council staff will score this measure. Projects will use the city Housing Performance Score based on the project location. If a project is located in more than one jurisdiction, the points will be awarded based on a weighted average of the city or township scores for the project location based on the length of the project in each jurisdiction. For stand alone intersection, bridge, underpass, and interchange projects, a one mile radius buffer will be drawn around the project. If the radius buffer enters more than one jurisdiction, the points will be awarded based on the proportionate population of the Census blocks in each jurisdiction that are all or partially located in the area within the one mile radius buffer. If a project is located in a city or township with no allocation of affordable housing need (either there is no forecasted household growth or the area does not have land to support sewered development), then the project will not be disadvantaged by this measure and the project s total score will be adjusted as a result. If this is the case, then the total points possible in the application will be 930 instead of 1,000. The total points awarded through the rest of the application (900 as a hypothetical example) will be divided by 930, then multiplied by 1,000. Therefore, a project scoring 900 out of 930, will equate to 968 points on a 1,000 point scale. 42
66 Roadway Reconstruction and Modernization If a portion of the project is located in a city with an affordable housing allocation and the other portion is located in a township with no affordable housing allocation, then a combination of the weighted average and no affordable housing methodologies should be used. This will result in a total score that will be somewhere between 930 and 1,000; then the score will need to be adjusted to fit a 1,000 point scale. 43
67 Roadway Reconstruction and Modernization 4. Infrastructure Age/Condition (150 Points) This criterion will assess the age of the roadway facility being improved. Roadway improvement investments should focus on the higher needs of an aging facility, whereas, improvements to a recently reconstructed roadway does not display an efficient use of funds. A. MEASURE: Identify the year of the roadway s original construction or most recent reconstruction. If the reconstruction date is used for the roadway, a full reconstruction must have been completed during the indicated year. Routine maintenance, such as an overlay or sealcoating project does not constitute a reconstruction and should not be used to determine the infrastructure age. RESPONSE: Year of original roadway construction or most recent reconstruction: Location(s) used: SCORING GUIDANCE (50 Points) The applicant with the oldest roadway will receive full points. Remaining projects will receive a proportionate share of the full points. For example, if the application being scored was constructed 41 years ago and the oldest project was constructed 48 years ago, this applicant would receive (41/48)*50 points or 43 points. Note: Because of the reporting of year of construction, it is possible for multiple projects to receive the full allotment of 50 points. B. MEASURE: Select the geometric, structural, or infrastructure deficiencies listed below that will be improved as part of this project, as reflected in the project cost estimate. (100 Points) RESPONSE (Select all that apply. Please identify the proposed improvement): Improving a non 10 ton roadway to better accommodate freight movementsa 10 ton roadway: 0 15 pts o RESPONSE (Limit 700 characters; approximately 100 words): Improved clear zones or sight lines: 0 10 pts o RESPONSE (Limit 700 characters; approximately 100 words) Improved roadway geometrics: 0 15 pts o RESPONSE (Limit 700 characters; approximately 100 words) Access management enhancements: 0 20 pts o RESPONSE (Limit 700 characters; approximately 100 words) Vertical/horizontal alignments improvements: 0 10 pts o RESPONSE (Limit 700 characters; approximately 100 words) Improved stormwater mitigation: 0 10 pts o RESPONSE (Limit 700 characters; approximately 100 words) Signals/lighting upgrades: 0 10 pts o RESPONSE (Limit 700 characters; approximately 100 words) Other Improvements: 0 10 pts o RESPONSE (Limit 700 characters; approximately 100 words) 44
68 Roadway Reconstruction and Modernization SCORING GUIDANCE (100 Points) Within each improvement sub measure, the answer most responsive to the need will receive full (e.g., the top project that improves clear zones or sight lines will receive 10 points), with each remaining project receiving a share of the full points at the scorer s discretion. It is possible for more than one project to receive maximum points for a sub measure. The highest scoring application for this measure will be adjusted to receive the full 100 points. Remaining projects will receive a proportionate share of the full points equal to the points for the project being scored divided by the points assigned to the highest scoring project multiplied by the maximum points available for the measure (100). For example, if the application being scored had 25 points and the top project had 50 points, this applicant would receive (25/50)*100 points or 50 points. 45
69 Roadway Reconstruction and Modernization 5. Congestion Reduction/Air Quality (75 80Points) This criterion measures the project s ability to reduce congestion. In addition, it will address its ability to improve congested intersections operating at unacceptable levels of service during peak hour conditions. The project will also be measured based on its ability to reduce emissions. A. MEASURE: Conduct a capacity analysis at one or more of the intersections (or rail crossings) being improved by the roadway project using existing turning movement counts (collected within the last three years) in the a.m. or p.m. peak hour and the Synchro or HCM software. The applicant must show the current total peak hour delay at one or more intersections (or rail crossings) and the reduction in total peak hour intersection delay at these intersections (or rail crossings) in seconds due to the project. If more than one intersection (or rail crossing) is examined, then the delay reduced by each intersection can be can added together to determine the total delay reduced by the project. For roadway projects that include a railroad crossing, the applicant should conduct fieldwork during either the a.m. or p.m. peak hour to determine the total peak hour delay reduced by the project. Applicants can also add together intersection delay reduced and railroad delay reduced, if they both will be improved by the project. The applicant should include the appropriate Synchro or HCM full reports (including the Timing Page Report) that support the improvement in total peak hour delay and should conduct the analysis using the following: Under the network settings, all defaults should be used for lanes, volumes, phases and simulation Use Synchro s automatic optimization to determine cycle, offset and splits (for traffic signals) Project improvements assumed in the build condition should be reflected in the total project cost, such as additional through or turn lanes and protective left turn phasing Roadway lengths for intersection approaches must be the same length for before and after scenarios An average weekday should be used for the existing conditions instead of a weekend, peak holiday, or special event time period that is not representative of the corridor for most of the year Total Peak Hour Delay Reduced (Seconds) = Total Peak Hour Delay/Vehicle x Vehicles Per Hour RESPONSE (Calculation): Total Peak Hour Delay/Vehicle without the Project (Seconds/Vehicle): Total Peak Hour Delay/Vehicle with the Project (Seconds/Vehicle): Total Peak Hour Delay/Vehicle Reduced by the Project (Seconds/Vehicle): Volume (Vehicles Per Hour): Total Peak Hour Delay Reduced by the Project (Seconds): EXPLANATION of methodology used to calculate railroad crossing delay, if applicable (Limit 1,400 characters; approximately 200 words): 46
70 Roadway Reconstruction and Modernization SCORING GUIDANCE (50 Points) The applicant with the most peak hour vehicle delay reduced by the project improvement will receive the full points for the measure. Remaining projects will receive a proportionate share of the points. For example, if the application being scored reduced delay by 5,000 seconds and the top project reduced delay by 25,000 seconds, this applicant would receive (5,000/25,000)*50 points, or 10 points. B. MEASURE: Using the Synchro or HCM analysis completed in the previous measure, identify the total peak hour emissions reduction in kilograms (CO, NO X, VOC) due to the project. The applicant should include the appropriate Synchro or full HCM reports (including the Timing Page Report) that support the improvement in total peak hour emissions. If more than one intersection is examined, then the emissions reduced by each intersection can be can added together to determine the total emissions reduced by the project. Roadway projects that do not include railroad grade separation elements: Total Peak Hour Emissions Reduced (Kilograms)= Total Peak Hour Emissions without the project Total Peak Hour Emissions with the Project Reduced Per Vehicle x Vehicles Per Hour RESPONSE (Calculation): Total (CO, NO X, and VOC) Peak Hour Emissions/Vehicle without the Project (Kilograms): Total (CO, NO X, and VOC) Peak Hour Emissions/Vehicle with the Project (Kilograms): Total (CO, NO X, and VOC) Peak Hour Emissions Reduced/Vehicle by the Project (Kilograms): Volume (Vehicles Per Hour): Total (CO, NO X, and VOC) Peak Hour Emissions Reduced by the Project (Kilograms): If more than one intersection is examined, the response in should include a total of all emissions reduced. Roadway projects that include railroad grade separation elements: For roadway projects that include a railroad crossing, the applicant needs to input four variables before and after the project to determine the change in emissions. Those variables include: speed, vehicle mile traveled, delay, and total vehicle stops. The applicant needs to conduct fieldwork during either the a.m. or p.m. peak hour to determine the existing conditions and then detail any assumptions used for conditions after the project is built. The variables will be used in the exact same equation used within the software program (i.e., Synchro) required of the other project types. Therefore, the approach to calculate the kilograms emissions reduced for railroad grade separation projects will be comparable to intersection improvement projects. 47
71 Roadway Reconstruction and Modernization RESPONSE (Calculation): Cruise speed in miles per hour without the project: (Applicant inputs number) Vehicle miles traveled without the project: (Applicant inputs number) Total delay in hours without the project: (Applicant inputs number) Total stops in vehicles per hour without the project: (Applicant inputs number) Cruise speed in miles per hour with the project: (Applicant inputs number) Vehicle miles traveled with the project: (Applicant inputs number) Total delay in hours with the project: (Applicant inputs number) Total stops in vehicles per hour with the project: (Applicant inputs number) Fuel consumption in gallons (F1) Fuel consumption in gallons (F2) Fuel consumption in gallons (F3) Total (CO, NOX, and VOC) Peak Hour Emissions Reduced by the Project (Kilograms): EXPLANATION of methodology and assumptions used:(limit 1,400 characters; approximately 200 words) Speed = cruise speed in miles per hour Total Travel = vehicle miles traveled Total Delay = total delay in hours Stops = total stops in vehicles per hour K1 = * Speed * Speed 2 K2 = K3 = * Speed 2 F1 (or F2 without the project) = Fuel consumption in gallons F1 = Total Travel * k1 + Total Delay * k2 + Stops * k3 F2 = Total Travel * k1 + Total Delay * k2 + Stops * k3 F3 = F1 F2 CO = F3 * kg/gallon NO X = F3 * kg/gallon VOC = F3 * kg/gallon Equation Automatically Provides Emissions Reduced: Total (CO, NO X, and VOC) Peak Hour Emissions Reduced by the Project (Kilograms): (Online Calculation) 48
72 Roadway Reconstruction and Modernization EXPLANATION of methodology and assumptions used (Limit 1,400 characters; approximately 200 words): SCORING GUIDANCE (30 Points) The applicant with the most kilograms reduced by the project improvement will receive the full points for the measure. Remaining projects will receive a proportionate share of the full. For example, if the application being scored reduced emissions by 3 kilograms and the top project reduced emissions by 5 kilograms, this applicant would receive (3/5)*30 points or 18 points. 49
73 Roadway Reconstruction and Modernization 6. Safety (150 Points) This criterion addresses the project s ability to correct deficiencies and improve the overall safety of a roadway facility. It will assess the project s monetized safety benefits. A. MEASURE: Respond as appropriate to one of the two project types below. (150 Points) Roadway projects that do not include railroad grade separation elements: Calculate the reduction in the total number of crashes due to improvements on the A Minor Arterial or Non Freeway Principal Arterial made by the project. The applicant must base the estimate of crash reduction on the methodology consistent with the latest Highway Safety Improvement Program (HSIP) application. Applicants should focus on the crash analysis for reactive projects starting on page 7 through page 11, in addition to Appendix A, E, and F. Crash data must be obtained for the project length using the MnDOT TIS system average for calendar years through Crash data should include all crash types and severity, including pedestrian and bicycle crashes. Applicants should request crash data from MnDOT as early as possible. The applicant must then attach a listing of the crashes reduced and the HSIP Benefit/Cost (B/C) worksheet that identifies the resulting benefit associated with the project. As part of the response, please detail and attach the crash modification factor(s) used from FHWA s Crash Modification Factors Clearinghouse: This measure requests the monetized safety benefit of the project. The cost of the project is scored in the Cost Effectiveness criterion. RESPONSE (Calculation): Crash Modification Factors Used: Rationale for Crash Modifications Selected (Limit 1,400 characters; approximately 200 words): Project Benefit ($) from B/C ratio: Explanation of Methodology: Roadway projects that include railroad grade separation elements: Since the number of observed crashes at an existing at grade railroad crossing is minor compared to an intersection, this measure will assess crash risk exposure that exists in order to compare projects. As a proactive safety measure, railroad grade separation projects eliminate the crash risk exposure. Crash Risk Exposure Eliminated = current average annual daily traffic volume x average number of daily trains at the at grade crossing RESPONSE (Calculation): Current AADT volume: Average daily trains: Crash Risk Exposure eliminated: 50
74 Roadway Reconstruction and Modernization SCORING GUIDANCE (150 Points) This measure will be considered separately for projects that do and do not include a railroad gradeseparation project. As a result, two projects (one without a railroad grade separation project and one with a railroad grade separation) may receive the full points. For projects that do not include a grade separation project, the applicant with the highest dollar value of benefits will receive the full points for the measure. Remaining projects will receive a proportionate share of the full points. For example, if the application being scored had safety benefits of $11,000,000 and the top project had safety benefits of $16,000,000, this applicant would receive (11,000,000/16,000,000)*150 points or 103 points. For railroad grade separation projects, the applicant with the highest crash risk exposure eliminated due to the project will receive the full points for the measure. Remaining projects will receive a proportionate share of the full points. For example, if the application being scored reduced 11,000 exposures and the top project reduced 16,000, this applicant would receive (11,000 /16,000)*150 points or 103 points. 51
75 Roadway Reconstruction and Modernization 7. Multimodal Elements and Existing Connections (100 Points) This criterion measures how the project improves the travel experience, safety, and security for other modes of transportation and addresses the safe integration of these modes. The Transportation Policy Plan requires that explicit consideration of all users of the transportation system be considered in the planning and scoping phase of roadway projects. A. MEASURE: Describe how the project positively affects the multimodal system. Discuss any bicycle, pedestrian, or transit elements that are included as part of the project and how they improve the travel experience, safety, and security for users of these modes. Applicants should make sure that new multimodal elements described in the response are accounted for as part of the cost estimate form earlier in the application. Applicants should note if there is no transit service in the project area and identify supporting studies or plans that address why a mode may not be incorporated in the project (e.g., a bicycle system plan that locates bikeway facilities on a lower volume parallel route). Describe how the proposed multimodal improvements positively affect identified alignments in the Regional Bicycle Transportation Network (RBTN) or along a regional trail, if applicable. Also, describediscuss the existing bicycle, pedestrian, and transit connections and how the project enhances these connections. RESPONSE (Limit 2,800 characters; approximately 400 words): SCORING GUIDANCE (100 Points) The project with thethat most positively affects the comprehensive multimodal elements included as part of the projectsystem will receive the full points. Remaining projects will receive a share of the full points at the scorer s discretion. The project score will be based on the quality of the improvements, as opposed to being based solely on the number of modes addressed. Points can be earned for incorporating multimodal project elements, positively affecting identified alignments in the Regional Bicycle Transportation Network (RBTN) or regional trail, or for making connections with existing multimodal systems. Scorers should make sure that new multimodal elements described in the response are accounted for on the cost estimate form earlier in the application. 52
76 Roadway Reconstruction and Modernization 8. Risk Assessment (75 Points) This criterion measures the number of risks associated with successfully building the project. High risk applications increase the likelihood that projects will withdraw at a later date. If this happens, the region is forced to reallocate the federal funds in a short amount of time or return them to the US Department of Transportation. and the steps already completed in the project development process. These risks are outlined in the checklist in the required Risk Assessment. A. MEASURE: Applications involving construction must complete the Risk Assessment. This checklist includes activities completed to date, as well as an assessment of risks (e.g., rightof way acquisition, proximity to historic properties, etc.). RESPONSE (Complete Risk Assessment): SCORING GUIDANCE (75 Points) The applicant with the most points on the Risk Assessment (more points equate to less project risk) will receive the full points for the measure. Remaining projects will receive a proportionate share of the full points. For example, if the application being scored had 40 points and the top project had 70 points, this applicant would receive (40/70)*75 points or 43 points. 53
77 Roadway Reconstruction and Modernization 9. Cost Effectiveness (100 Points) This criterion will assess the project s cost effectiveness based on the total TAB eligible project cost (not including noise walls) and total points awarded in the previous criteria. A. MEASURE: This measure will calculate the cost effectiveness of the project. Metropolitan Council staff will divide the number of points awarded in the previous criteria by the TABeligible project cost (not including noise walls) by the total number of points awarded in the previous criteria. Cost effectiveness = total TAB eligible project cost (not including noise walls)/total number of points awarded in previous criteria/total TAB eligible project cost RESPONSE (This measure will be calculated after the scores for the other measures are tabulated by the Scoring Committee): Total Project Cost (entered in Project Cost Form): SCORING GUIDANCE (100 Points) The applicant with the most points (i.e., the benefits) perlowest dollar value per point earned in the application (i.e., the benefits) will receive the full points for the measure. Remaining projects will receive a proportionate share of the full points. For example, if the top project had 35,000received.0005 points per dollar and the application being scored received points per dollar, had 70,000, this applicant would receive ( ,000/ ,000) *100 points for 50 points. The scorer for this measure will also complete a reasonableness check of the total project cost that is used for this measure. The scorer may follow up with the applicant to clarify any questions. Up to 50 percent of points awarded for this measure can be deducted if the scorer does not believe that the cost estimate is reasonable. Discretion will be given the applicant that they best understand the unique conditions of the project and have provided a fair cost estimate to successfully deliver the project. TOTAL: 1,100 POINTS 54
78 Roadway Expansion Prioritizing Criteria and Measures September 6, 2017 Definition: A roadway project that adds thru lane capacity. Projects must be located on a non freeway principal arterial or A minor arterial functionally classified roadway, consistent with the latest TAB approved functional classification map. However, A minor connectors cannot be expanded with new thru lane capacity with these federal funds per regional policy and must apply in the Reconstruction/Modernization and Spot Mobility application category. Examples of Roadway Expansion Projects: New roadways Two lane to four lane expansions Two lane to three lane expansions Four lane to six lane expansions New interchanges with or without associated frontage roads Expanded interchanges with either new ramp movements or added thru lanes New bridges, overpasses and underpasses Scoring: Criteria and Measures Points % of Total Points 1. Role in the Regional Transportation System and Economy % Measure A Average distance to nearestsystem Congestion and Principal 80 Arterial Intersection Conversion Study Priorities parallel roadways Measure B Connection to Total Jobs, and Manufacturing/Distribution 3050 Jobs, and Students Measure C Current daily heavy commercial trafficregional Truck Corridor 5080 Study Tiers Measure D Freight project elements Usage % Measure A Current daily person throughput 110 Measure B Forecast 2040 average daily traffic volume Equity and Housing Performance % Measure A Connection to disadvantaged populations and project s benefits, impacts, and mitigation 30 Measure B Housing Performance Score Infrastructure Age % Measure A Date of construction Congestion Reduction/Air Quality % Measure A Vehicle delay reduced 100 Measure B Kg of emissions reduced Safety % Measure A Crashes reduced Multimodal Elements and Existing Connections % Measure A Transit, bicycle, or pedestrian project elements & connections Risk Assessment 75 7% Measure A Risk Assessment Form Cost Effectiveness 100 9% Measure A Cost effectiveness (total project cost/total points awarded/total project cost)
79 Roadway Expansion Total 1,100 56
80 Roadway Expansion 1. Role in the Regional Transportation System and Economy ( Points) Tying regional policy (Thrive MSP2040) to the Regional Solicitation, this criterion measures the project s ability to serve a transportation purpose within the regional transportation system and economy based on how well it fulfills its functional classification role, reduces systemwide congestion, aligns with the Principal Arterial Intersection Conversion Study, ;serves heavy commercial traffic, and connects to employment, manufacturing/distribution related employment, and students, and aligns with i.e., the Regional Truck Corridor Study). A. MEASURE: Address how the project route fulfills its role in the regional transportation system as identified by its current functional classification. Respond as appropriate to one type of functional classification. For A minor arterial projects only: The measure will analyze the level of congestion on the parallel A minor arterial or principal arterial to determine the importance of the Relieverroadway in reducing congestion on the entire Regional Highway System. Council staff will use Streetlight travel speed data on an applicant selected parallel route to the proposed project. The analysis will compare the peak hour travel speed on a parallel route to free flow conditions on this same route to see whether the proposed project could relieve congestion on the parallel route too. The applicant must identify the parallel corridor as part of the response. RESPONSE (Calculation): Parallel Corridor: Parallel Corridor Start and End Points: For principal arterial projects only: The measure relies on the results on the Principal Arterial Intersection Conversion Study, which prioritized non freeway principal arterial intersections. In addition to interchange projects, other lane expansion projects that make improvements to a low, medium, or highpriority intersection can also earn points in this measure. Use the final study report for this measure: metrocouncil.org/paics RESPONSE (Select one for your project, based on the Principal Arterial Intersection Conversion Study): Proposed interchange or at grade project that improves a High Priority Intersection: (80 Points) Proposed at grade project that improves a Medium Priority Intersection: (60 Points) Proposed at grade project that improves a Low Priority Intersection: (50 Points) Proposed interchange that improves a Medium Priority Intersection: (40 Points) Proposed interchange project that improves a Low Priority Intersection: (0 Points) Not listed as a priority in the study: (0 Points) SCORING GUIDANCE (80 Points) 57
81 Roadway Expansion Expanders, Augmentors, and Non Freeway Principal Arterials: The applicant with the furthest average distance from the closest parallel A Minor Arterials or and Principal Arterials on both sides will receive the full points. The furthest average distance will be considered separately for Expanders, Augmentors, and Non Freeway Principal Arterialswill be scored separately for this measure. Relievers: A minor arterials: The applicant with the with the most congestion on a parallel route (measured by the largest percentage decrease in peak hour travel speeds relative to free flow conditions)highest number of hours per day in which current capacity exceeds the design capacity on the Principal Arterial will receive the full points. Remaining Reliever projects will receive a proportionate share of the full points. For example, if the application being scored showed a 5% decrease of travel speeds in the peak hour on the parallel route relative to free flow conditions and the top project had a 10% reduction, this applicant would receive (5/10)*80 points, or 40 points. In order to be awarded points as an A minor arterial the proposed project must show some delay reduction in measure 5A. If the project does not reduce delay, then it cannot reduce systemwide congestion and will score 0 points for this measure. The scorer will have discretion in determining whether the applicant selected the correct parallel A minor arterial or principal arterial (and location on that segment). Principal arterials: Projects will be scored based on their Principal Arterial Intersection Conversion Study priorities and project type. Four projects (one each for Augmentor, Expander, Reliever, and Non Freeway Principal Arterial) may receive the full points. Remaining projects will receive a proportionate share of the full points (awarded to the top score in the appropriate functional classification). For example, if the Expander being scored had a distance of 8 miles and the top Expander project had an average distance of 10 miles, this applicant would receive (8/10)*80 points or 64 points. Metropolitan Council staff will provide average distance data for all Augmentor, Expander, and Non Freeway Principal Arterial projects to ensure consistency of methodology between applications. B. MEASURE: Reference the Regional Economy map generated at the beginning of the application process. Report the existing employment, manufacturing/distribution related employment, and post secondary students enrolled within one mile, as depicted on the Regional Economy map. Upload the Regional Economy map used for this measure. RESPONSE (Data from the Regional Economy map): Existing Employment within 1 Mile: (Maximum of points) Existing Manufacturing/Distribution Related Employment within 1 Mile: (Maximum of points) Existing Post Secondary Students: (Maximum of points) SCORING GUIDANCE (350 Points) All Census block groups that are included within or intersect the buffer area around the project will be included. 58
82 Roadway Expansion The applicant with the highest existing total employment will receive the full points. Remaining projects will receive a proportionate share of the full points. For example, if the application being scored had 1,000 workers within one mile and the top project had 1,500 workers, this applicant would receive (1,000/1,500)*30 50 points or points. The applicant with the highest existing manufacturing/distribution related employment will receive the full points. Remaining projects will receive a proportionate share of the full points equal to the existing manufacturing/distribution related employment within one mile of the project being scored divided by the project with the highest manufacturing/distribution related employment within one mile multiplied by the maximum points available for the measure. For example, if the application being scored had 1,000 manufacturing/distribution related workers within one mile and the top project had 1,500 manufacturing/distribution related workers, this applicant would receive (1,000/1,500)*30 50 points or points. The applicant with the highest number of post secondary students will receive 18 points. Remaining projects will receive a proportionate share of the 18 points. For example, if the application being scored had 1,000 students within one mile and the top project had 1,500 students, this applicant would receive (1,000/1,500)*18 30 points or points. The scorer will assess if the applicant would score highest with the total employment part of the measure, the manufacturing/distribution employment part of the measure, or the education part of the measure and give the applicant the highest of the three scores out of a maximum of points. Note: Due to the use of multiple sub measures, two applicants will receive the full points. C. MEASURE: This criterion relies on the results on the Truck Highway Corridor Study, which prioritized all principal and minor arterials based on truck volume, truck percentage of total traffic, proximity to freight industry clusters, and proximity to regional freight terminals. (80 points) Use the final study report for this measure: 2/Transit Plans, Studies Reports/Highways Roads/Truck Freight Corridor Study.aspx RESPONSE Select one for your project, based on the Regional Truck Corridor Study): Tier 1: (80 Points) Tier 2: (60 Points) Tier 3: (40 Points) None of the tiers: (0 Points) C. Provide the current daily heavy commercial traffic at one location along the A Minor Arterial or Non Freeway Principal Arterial s project length. It is required that an actual count is collected, or that available data from within the last three years is used (from the city, county or MnDOT). Heavy commercial traffic is defined as all trucks with at least two axles and six tires. 59
83 Roadway Expansion For new roadways, using a traffic model, identify the estimated current daily heavy commercial traffic volume. RESPONSE: Location: Current daily heavy commercial traffic volume: Date heavy commercial count taken: SCORING GUIDANCE (50 Points) The applicant with the highest daily heavy commercial traffic at a location along the project length will receive the full points. Remaining projects will receive a proportionate share of the full points. For example, if the application being scored had a heavy commercial volume of 750 vehicles and the top project had a heavy commercial volume of 1,000 vehicles, this applicant would receive (750/1,000)*50 points, or 38 points. D. MEASURE: Discuss any freight elements that are included as part of the project and how they improve efficiency, security, or safety. (15 points) Address how the proposed project safely integrates freight. Freight elements could be project elements such as upgrading a non ten ton roadway to a ten ton roadway, adding paved shoulders, wider shoulders, acceleration lanes, or longer turning lanes added specifically to accommodate freight movements. RESPONSE (Limit 1,400 characters; approximately 200 words): SCORING GUIDANCE (15 Points) The project with the most comprehensive freight elements included as part of the project will receive the full points. Remaining projects will receive a share of the full points at the scorer s discretion. 60
84 Roadway Expansion 2. Usage (175 Points) This criterion quantifies the project s potential impact by measuring the current daily person throughput and future vehicular traffic that will be served by the project. These roadway users directly benefit from the project improvements on the A Minor Arterial or Non Freeway Principal Arterial. A. MEASURE: The applicant must identify the location along the project length and provide the current AADT volume from the MnDOT 50 series maps and existing transit routes that travel on the road (reference Transit Connections Map). Ridership data will be provided by the Metropolitan Council staff, if public transit is currently provided on the project length. Metropolitan Council staff will calculate the current daily person throughput at one location along the A Minor Arterial or Non Freeway Principal Arterial project length using the current average annual daily traffic (AADT) volume and average annual ridership. Current Daily Person Throughput = (current average annual daily traffic volume x 1.30 vehicle occupancy) + average annual daily transit ridership ( ) For new roadways, identify the estimated existing daily traffic volume based on traffic modeling. RESPONSE: Location: Current AADT volume: Existing Transit Routes on the Project: Transit routes that will likely be diverted to a the new proposed roadway (if applicable): SCORING GUIDANCE (110 Points) The applicant with highest current daily person throughput will receive the full points for the measure. Remaining projects will receive a proportionate share of the full points. For example, if the application being scored had a daily person throughput of 1,000 vehicles and the top project within the same functional classification had a daily person throughput of 1,500 vehicles, this applicant would receive (1,000/1,500)*110 points or 73 points. B. MEASURE: Provide the forecast (2040) average daily traffic volume at the same location along the A Minor Arterial or Non Freeway Principal Arterial project length, as identified in the previous measure. The applicant may choose to use a county or city travel demand model based on the Metropolitan Council model to identify the forecast (2040) average daily traffic volume or have Metropolitan Council staff determine the forecast volume using the Metropolitan Council model and project location. Respond as appropriate to the use of one type of forecast model. (65 Points) For new roadways, identify the modeled forecast daily traffic volume if this information is available. If not available, then identify the forecast volumes that will be relocated from any parallel roadway(s) to the new roadway. 61
85 Roadway Expansion RESPONSE: Use Metropolitan Council model to determine forecast (2040) ADT volume If checked, METC Staff will provide Forecast (2040) ADT volume OR RESPONSE: Identify the approved county or city travel demand model to determine forecast (2040) ADT volume: Forecast (2040) ADT volume : SCORING GUIDANCE (65 Points) The applicant with the highest forecast (2040) ADT volume will receive the full points for the measure. Remaining projects will receive a proportionate share of the full points. For example, if the application being scored had a daily forecast of 28,000 vehicles and the top project had a daily forecast of 32,000 vehicles, this applicant would receive (28,000/32,000)*65 points or 57 points. 62
86 Roadway Expansion 3. Equity and Housing Performance (100 Points) This criterion addresses the project s positive and negative impacts to low income populations, people of color, children, people with disabilities, and the elderly. The criterion also evaluates a community s efforts to promote affordable housing. A. MEASURE: Reference the Socio Economic Conditions map generated at the beginning of the application process. Identify the project s location as it applies in the listed responses below. Describe the project s positive benefits, and negative impacts, and mitigation for lowincome populations; people of color; children, people with disabilities, and the elderly. Geographic proximity alone is not sufficient to receive the full points listed below. In order to receive the maximum points, the response should address the benefits, impacts, and mitigation for the populations listed. Upload the Socio Economic Conditions map used for this measure. RESPONSE (Select one, based on the Socio Economic Conditions map): Project located in Area of Concentrated Poverty with 50% or more of residents are people of color (ACP50): (0 to 30 Points) (up to 100% of maximum score) Project located in Area of Concentrated Poverty: (0 to 24 Points) up to 80% of maximum score) Project s census tracts are above the regional average for population in poverty or population of color: (0 to 18 Points) (up to 60% of maximum score) Project located in a census tract that is below the regional average for population in poverty or populations of color, or includes children, people with disabilities, or the elderly: (0 to 12 Points) (up to 40% of maximum score) RESPONSE (Limit 2,800 characters; approximately 400 words): SCORING GUIDANCE (30 Points) Based on the Socio Economic Conditions map s output, the applicant will select the appropriate option from the above bullets. However, geographic proximity alone is not sufficient to receive full points. The applicant must fully describe the positive benefits and negative impacts (with mitigation to address the issue) for those identified groups. Each project will first be graded on a 10 point scale, not accounting for geography. Each score from the 10 point scale will then be adjusted to the appropriate geography. The project with the most positive benefits and appropriate mitigation for negative impacts will receive the full points relative to its maximum geographic sub area defined above. Remaining projects will receive a share of the full points at the scorer s discretion. This response is intended to be qualitative. Metropolitan Council staff will score this measure. Note: Due to the geographic adjustment to scores, it is possible that the above process will result in no project receiving the maximum allotment of 30 points. In this case, the highest scoring application for this measure will be adjusted to receive the full 30 points. Remaining projects will receive a proportionate share of the full points. For example, if the application being scored had 10 points and the top project had 20 points, this applicant would receive (10/20)*30 points or 15 points. 63
87 Roadway Expansion B. MEASURE: Metropolitan Council staff will award points to the project based on the Housing Performance Score for the city or township in which the project is located. The score includes consideration of affordability and diversification, local initiatives to facilitate affordable workforce housing development or preservation, and density of residential development. If the project is in more than one jurisdiction, the points will be awarded based on a weighted average using the length of the project in each jurisdiction. For stand alone intersection, bridge, underpass, and interchange projects, a one mile radiusbuffer will be drawn around the project. If the radius buffer enters more than one jurisdiction, the points will be awarded based on the proportionate population of the Census blocks in each jurisdiction that are all or partially located in the area within the one mile radius buffer. If a project is located in a city or township with no allocation of affordable housing need (either there is no forecasted household growth or the area does not have land to support sewered development), then the project will not be disadvantaged by this measure and the project s total score will be adjusted as a result. RESPONSE (Affordable Housing Score completed by Metropolitan Council staff): City/Township: Length of Segment (Population from Regional Economy Map for stand alone projects) within City/Township: SCORING GUIDANCE (70 Points) The applicant with the highest Housing Performance Score will receive the full points. Remaining projects will receive a proportionate share of the full points. For example, if the application being scored had a Housing Performance Score of 55 and the top project had a Housing Performance Score of 90, this applicant would receive (55/90)*70 points or 43 points. Note: Metropolitan Council staff will score this measure. Projects will use the city Housing Performance Score based on the project location. If a project is located in more than one jurisdiction, the points will be awarded based on a weighted average of the city or township scores for the project location based on the length of the project in each jurisdiction. For stand alone roadway (intersection, bridge, underpass, and interchange) projects, a one mile radiusbuffer will be drawn around the project. If the radius buffer enters more than one jurisdiction, the points will be awarded based on the proportionate population of the Census blocks in each jurisdiction that are all or partially located in the area within the one mile radius buffer. If a project is located in a city or township with no allocation of affordable housing need (either there is no forecasted household growth or the area does not have land to support sewered development), then the project will not be disadvantaged by this measure and the project s total score will be adjusted as a result. If this is the case, then the total points possible in the application will be 930 instead of 1,000. The total points awarded through the rest of the application (900 as a hypothetical example) will be divided by 930, then multiplied by 1,000. Therefore, a project scoring 900 out of 930, will equate to 968 points on a 1,000 point scale. 64
88 Roadway Expansion If a portion of the project is located in a city with an affordable housing allocation and the other portion is located in a township with no affordable housing allocation, then a combination of the weighted average and no affordable housing methodologies should be used. This will result in a total score that will be somewhere between 930 and 1,000; then the score will need to be adjusted to fit a 1,000 point scale. 65
89 Roadway Expansion 4. Infrastructure Age (75 40 Points) This criterion will assess the age of the roadway facility being improved. Roadway improvement investments should focus on the higher needs of an aging facility, whereas improvements to a recently reconstructed roadway does not display an efficient use of funds. A. MEASURE: Identify the year of the roadway s original construction or most recent reconstruction. If the reconstruction date is used for the roadway, a full reconstruction must have been completed during the indicated year. Routine maintenance, such as an overlay or sealcoating project does not constitute a reconstruction and should not be used to determine the infrastructure age. For new roadways, identify the average age of the parallel roadways from which traffic will be diverted to the new roadway. RESPONSE: Year of original roadway construction or most recent reconstruction: Segment length: SCORING GUIDANCE (75 40 Points) The applicant with the oldest roadway will receive full points. Remaining projects will receive a proportionate share of the full points. For example, if the application being scored was constructed 41 years ago and the oldest project was constructed 48 years ago, this applicant would receive (41/48)*75 40 points or points. Note: Because of the reporting of year of construction, it is possible for multiple projects to receive the full allotment of points. 66
90 Roadway Expansion 5. Congestion Reduction/Air Quality (150 Points) This criterion measures the project s ability to reduce intersection delay and emissions during peak hour conditions. In addition, it will address its ability to improve congested intersections operating at unacceptable levels of service during peak hour conditions. A. MEASURE: Conduct a capacity analysis at one or more of the intersections (or rail crossings) being improved by the roadway project using existing turning movement counts (collected within the last three years) in the weekday a.m. or p.m. peak hour and Synchro or HCM software. The analysis must include build and no build conditions (with and without the project improvements). The applicant must show the current total peak hour delay at one or more intersections (or rail crossings) and the reduction in total peak hour intersection delay at these intersections (or rail crossings) in seconds, due to the project. If more than one intersection is examined, then the delay reduced by each intersection (or rail crossing) can be can added together to determine the total delay reduced by the project. If expanding thru lanes or building a new interchange on an existing signalized corridor, signal retiming must be completed in the five year time period before the project was submitted for funding (i.e., completed a signal retiming between 2013 and 2018), consistent with regional policy in the 2040 Transportation Policy Plan. For new roadways, identify the key intersection(s) on any parallel roadway(s) that will experience reduced delay as a result of traffic diverting to the new roadway. If more than one intersection is examined, then the delay reduced by each intersection can be can added together. For roadway projects that include a railroad crossing, the applicant should conduct fieldwork during either the a.m. or p.m. peak hour to determine the total peak hour delay reduced by the project. Applicants can also add together intersection delay reduced and railroad delay reduced, if they both will be improved by the project. The applicant should include the appropriate Synchro or HCM full reports (including the Timing Page Report) that support the improvement in total peak hour delay and should conduct the analysis using the following: Under the network settings, all defaults should be used for lanes, volumes, phases and simulation Use Synchro s automatic optimization to determine cycle, offset and splits (for traffic signals) Project improvements assumed in the build condition should be reflected in the total project cost, such as additional through or turn lanes and protective left turn phasing Roadway lengths for intersection approaches must be the same length for before and after scenarios An average weekday should be used for the existing conditions instead of a weekend, peak holiday, or special event time period that is not representative of the corridor for most of the year Total Peak Hour Delay Reduced (Seconds) = Total Peak Hour Delay Per Vehicle x Vehicles Per Hour 67
91 Roadway Expansion RESPONSE (Calculation): Total Peak Hour Delay/Vehicle without the Project (Seconds/Vehicle): Total Peak Hour Delay/Vehicle with the Project (Seconds/Vehicle): Total Peak Hour Delay/Vehicle Reduced by the Project (Seconds/Vehicle): Volume (Vehicles Per Hour): Total Peak Hour Delay Reduced by the Project (Seconds): EXPLANATION of methodology used to calculate railroad crossing delay, if applicable, or date of last signal retiming for signalized corridors (Limit 1,400 characters; approximately 200 words): SCORING GUIDANCE (100 Points) The applicant with the most peak hour vehicle delay reduced by the project improvement will receive the full points for the measure. Remaining projects will receive a proportionate share of the points. For example, if the application being scored reduced delay by 5,000 seconds and the top project reduced delay by 25,000 seconds, this applicant would receive (5,000/25,000)*100 points, or 20 points. If expanding thru lanes or building a new interchange on an existing signalized corridor, signal retiming must be completed in the five year time period before the project was submitted for funding (i.e., completed a signal retiming between 2013 and 2018), consistent with regional policy in the 2040 Transportation Policy Plan. If the date of the signal retiming is more than five years past, then the project will be disqualified as part of the qualifications review of the projects. Applicants will provide that date as part of the explanation for this measure. B. MEASURE: Using the Synchro or HCM analysis completed in the previous measure, identify the total peak hour emissions reduction in kilograms (CO, NO X, VOC) due to the project. The applicant should include the appropriate Synchro or HCM reports (including the Timing Page Report) that support the improvement in total peak hour emissions. If more than one intersection is examined, then the emissions reduced by each intersection can be can added together to determine the total emissions reduced by the project. Roadway projects that do not include new roadway segments or railroad grade separation elements: Total Peak Hour Emissions Reduced (Kilograms)= Total Peak Hour Emissions without the project Total Peak Hour Emissions with the ProjectReduced Per Vehicle x Vehicles Per Hour RESPONSE (Calculation): Total (CO, NO X, and VOC) Peak Hour Emissions/Vehicle without the Project (Kilograms): Total (CO, NO X, and VOC) Peak Hour Emissions/Vehicle with the Project (Kilograms): Total (CO, NO X, and VOC) Peak Hour Emissions Reduced/Vehicle by the Project (Kilograms): Volume (Vehicles Per Hour): Total (CO, NO X, and VOC) Peak Hour Emissions Reduced by the Project (Kilograms): 68
92 Roadway Expansion If more than one intersection is examined, the response in should include a total of all emissions reduced. Roadway projects that are constructing new roadway segments, but do not include railroad grade separation elements: For new roadways, identify the key intersection(s) on any parallel roadway(s) that will experience reduced emissions as a result of traffic diverting to the new roadway (using Synchro). If more than one intersection is examined, then the emissions reduced by each intersection can be can added together. However, new roadways will also generate new emissions compared to existing conditions as traffic diverts from the parallel roadways. The applicant needs to estimate four variables to determine the new emissions generated once the project is completed on any major intersections. Those variables include: speed, vehicle mile traveled, delay, and total vehicle stops. The applicant needs to detail any assumptions used for conditions after the project is built. The variables will be used in the exact same equation used Synchro required of the other project types. The equation below should only be used to estimate the new emissions generated by new roadways. Parallel Roadways Enter data for Parallel Roadways. Total Peak Hour Emissions Reduced (Kilograms) = Total Peak Hour Emissions Reduced Per Vehicle x Vehicles Per Hourwithout the project Total Peak Hour Emissions with the Project RESPONSE (Data Input and Calculation): Total (CO, NO X, and VOC) Peak Hour Emissions Per Vehicle without the Project (Kilograms): (Applicant inputs number) Total (CO, NO X, and VOC) Peak Hour Emissions Per Vehicle with the Project (Kilograms): (Applicant inputs number) Total (CO, NO X, and VOC) Peak Hour Emissions Reduced Per Vehicle by the Project (Kilograms): (Online Calculation) Volume (Vehicles Per Hour): (Applicant inputs number) Total (CO, NO X, and VOC) Peak Hour Emissions Reduced by the Project (Kilograms): (Online Calculation) If more than one intersection is examined, the response is a total of all emissions reduced. Emissions Reduced on Parallel Roadways (Online Calculation) 69
93 Roadway Expansion New Roadway Portion Cruise speed in miles per hour with the project: (Applicant inputs number) Vehicle miles traveled with the project: (Applicant inputs number) Total delay in hours with the project: (Applicant inputs number) Total stops in vehicles per hour with the project: (Applicant inputs number) Fuel consumption in gallons: Total (CO, NOX, and VOC) Peak Hour Emissions Reduced or Produced on New Roadway (Kilograms): EXPLANATION of methodology and assumptions used:(limit 1,400 characters; approximately 200 words) Total (CO, NOX, and VOC) Peak Hour Emissions Reduced by the Project (Kilograms): Speed = cruise speed in miles per hour Total Travel = vehicle miles traveled Total Delay = total delay in hours Stops = total stops in vehicles per hour K4 = * Speed * Speed 2 K2 = K5 = * Speed 2 F2 = Fuel consumption in gallons CO = F2 * kg/gallon NO X = F2 * kg/gallon VOC = F2 * kg/gallon Total = Total Peak Hour Emissions reduced on Parallel Roadways (CO + NOx + VOC) Roadway projects that include railroad grade separation elements: For roadway projects that include a railroad crossing, the applicant needs to input four variables before and after the project to determine the change in emissions. Those variables include: speed, vehicle mile traveled, delay, and total vehicle stops. The applicant needs to conduct fieldwork during either the a.m. or p.m. peak hour to determine the existing conditions and then detail any assumptions used for conditions after the project is built. The variables will be used in the exact same equation used within the software program (i.e., Synchro) required of the other project types. Therefore, the approach to calculate the kilograms emissions reduced for railroad grade separation projects will be comparable to intersection improvement projects. RESPONSE (Calculation): Cruise speed in miles per hour without the project: (Applicant inputs number) Vehicle miles traveled without the project: (Applicant inputs number) 70
94 Roadway Expansion Total delay in hours without the project: (Applicant inputs number) Total stops in vehicles per hour without the project: (Applicant inputs number) Cruise speed in miles per hour with the project: (Applicant inputs number) Vehicle miles traveled with the project: (Applicant inputs number) Total delay in hours with the project: (Applicant inputs number) Total stops in vehicles per hour with the project: (Applicant inputs number) Fuel consumption in gallons (F1) Fuel consumption in gallons (F2) Fuel consumption in gallons (F3) Total (CO, NOX, and VOC) Peak Hour Emissions Reduced by the Project (Kilograms): EXPLANATION of methodology and assumptions used:(limit 1,400 characters; approximately 200 words) Speed = cruise speed in miles per hour Total Travel = vehicle miles traveled Total Delay = total delay in hours Stops = total stops in vehicles per hour K1 = * Speed * Speed 2 K2 = K3 = * Speed 2 F1 (or F2 without the project) = Fuel consumption in gallons F1 = Total Travel * k1 + Total Delay * k2 + Stops * k3 F2 = Total Travel * k1 + Total Delay * k2 + Stops * k3 F3 = F1 F2 CO = F3 * kg/gallon NO X = F3 * kg/gallon VOC = F3 * kg/gallon Equation Automatically Provides Emissions Reduced: Total (CO, NO X, and VOC) Peak Hour Emissions Reduced by the Project (Kilograms): (Online Calculation) EXPLANATION of methodology and assumptions used (Limit 1,400 characters; approximately 200 words): SCORING GUIDANCE (50 Points) The applicant with the most kilograms reduced by the project improvement will receive the full points for the measure. Remaining projects will receive a proportionate share of the full. For example, if the 71
95 Roadway Expansion application being scored reduced emissions by 3 kilograms and the top project reduced emissions by 5 kilograms, this applicant would receive (3/5)*50 points or 30 points. 72
96 Roadway Expansion 6. Safety (150 Points) This criterion addresses the project s ability to correct deficiencies and improve the overall safety of an existing or future roadway facility. It will assess the project s monetized safety benefits. A. MEASURE: Respond as appropriate to one of the two project types below. Calculate the reduction in the total number of crashes due to improvements on the A Minor Arterial or Non Freeway Principal Arterial made by the project. The applicant must base the estimate of crash reduction on the methodology consistent with the latest Highway Safety Improvement Program (HSIP) application. Applicants should focus on the crash analysis for reactive projects. starting on page 7 through page 11, in addition to Appendix A, E, and F. Crash data must be obtained for the project length using the MnDOT TIS system average for calendar years through Crash data should include all crash types and severity, including pedestrian and bicycle crashes. Applicants should request crash data from MnDOT as early as possible. The applicant must then attach a listing of the crashes reduced and the HSIP Benefit/Cost (B/C) worksheet that identifies the resulting benefit associated with the project. As part of the response, please detail and attach the crash modification factor(s) used from FHWA s Crash Modification Factors Clearinghouse: This measure requests the monetized safety benefit of the project. The cost of the project is scored in the Cost Effectiveness criterion. New Roadways: 1. For new roadways, identify the parallel roadway(s) from which traffic will be diverted to the new roadway. 2. Using the crash data for , calculate the existing crash rate for the parallel roadway(s) identified in Step Identify the daily traffic volume that will be relocated from the parallel roadway(s) to the new roadway. 4. Calculate the number of crashes on the parallel roadway(s) using the existing crash rate from Step 2 and the relocated traffic volume to determine the change in number of crashes due to the relocated traffic volume. For instance, if 5,000 vehicles are expected to relocate from the existing parallel roadway to the new roadway, calculate the number of crashes related to the 5,000 vehicles. 5. Identify the average crash rate for the new roadway using MnDOT s average crash rates by roadway type. Using the average crash rate for the new roadway, calculate the number of crashes related to the relocated traffic (i.e., the 5,000 vehicles). 6. Calculate the crash reduction factor using the existing number of crashes on the existing parallel roadway (Step 4) compared to the estimated crashes calculated for the new roadway (Step 5), due to the relocated traffic volume (i.e., the 5,000 vehicles). 73
97 Roadway Expansion 7. The calculated crash reduction factor should be used in the HSIP B/C worksheet. 8. Upload additional documentation materials into the Other Attachments Form in the online application. RESPONSE (Calculation): Crash Modification Factor Used (Limit 700 characters; approximately 100 words): Rationale for Crash Modifications Selected (Limit 1,400 characters; approximately 200 words): Project Benefit ($) from B/C ratio: Explanation of Methodology: Roadway projects that include railroad grade separation elements: Since the number of observed crashes at an existing at grade railroad crossing is minor compared to an intersection, this measure will assess crash risk exposure that exists in order to compare projects. As a proactive safety measure, railroad grade separation projects eliminate the crash risk exposure. Crash Risk Exposure Eliminated = current average annual daily traffic volume x average number of daily trains at the at grade crossing RESPONSE (Calculation): Current AADT volume: Average daily trains: Crash Risk Exposure eliminated: SCORING GUIDANCE (150 Points) This measure will be considered separately for projects that do and do not include a railroad gradeseparation project. As a result, two projects (one project without a railroad grade separation project and one with a railroad grade separation project) may receive the full points. For projects that do not include a grade separation project, the applicant with the highest dollar value of benefits will receive the full points for the measure. Remaining projects will receive a proportionate share of the full points. For example, if the application being scored had safety benefits of $11,000,000 and the top project had safety benefits of $16,000,000, this applicant would receive (11,000,000/16,000,000)*150 points or 103 points. For railroad grade separation projects, the applicant with the highest crash risk exposure eliminated due to the project will receive the full points for the measure. Remaining projects will receive a proportionate share of the full points. For example, if the application being scored reduced 11,000 exposures and the top project reduced 16,000 exposures this applicant would receive (11,000 /16,000)*150 points or 103 points. 74
98 Roadway Expansion 7. Multimodal Elements and Existing Connections (100 Points) This criterion measures how the project improves the travel experience, safety, and security for other modes of transportation and addresses the safe integration of these modes. The Transportation Policy Plan requires that explicit consideration of all users of the transportation system be considered in the planning and scoping phase of roadway projects. A. MEASURE: Describe how the project positively affects the multimodal system. Discuss any bicycle, pedestrian, or transit elements that are included as part of the project and how they improve the travel experience, safety, and security for users of these modes. Applicants should make sure that new multimodal elements described in the response are accounted for as part of the cost estimate form earlier in the application. Applicants should note if there is no transit service in the project area and identify supporting studies or plans that address why a mode may not be incorporated in the project (e.g., a bicycle system plan that locates bikeway facilities on a lower volume parallel route). Describe to reference how the proposed multimodal improvements positively affect identified alignments in the Regional Bicycle Transportation Network (RBTN) or along a regional trail, if applicable. Also, describediscuss the existing bicycle, pedestrian, and transit connections and how the project enhances these connections. RESPONSE (Limit 2, 800 characters; approximately 400 words): SCORING GUIDANCE (100 Points) The project with thethat most positively affects the comprehensive multimodal elements included as part of the projectsystem will receive the full points. Remaining projects will receive a share of the full points at the scorer s discretion. The project score will be based on the quality of the improvements, as opposed to being based solely on the number of modes addressed. Points can be earned for incorporating multimodal project elements, positively affecting identified alignments in the Regional Bicycle Transportation Network (RBTN) or regional trail, or for making connections with existing multimodal systems. Scorers should make sure that new multimodal elements described in the response are accounted for on the cost estimate form earlier in the application. 75
99 Roadway Expansion 8. Risk Assessment (75 Points) This criterion measures the number of risks associated with successfully building the project. High risk applications increase the likelihood that projects will withdraw at a later date. If this happens, the region is forced to reallocate the federal funds in a short amount of time or return them to the US Department of Transportation. and the steps already completed in the project development process. These steps risks are outlined in the checklist in the required Risk Assessment. A. MEASURE: Applications involving construction must complete the Risk Assessment. This checklist includes activities completed to date, as well as an assessment of risks (e.g., rightof way acquisition, proximity to historic properties, etc.). If the applicant is completing a transit or TDM application that is operations only, check the box and do not complete the remainder of the form. These projects will receive full points for the Risk Assessment. Park and Ride and other transit construction projects require completion of the Risk Assessment below. RESPONSE (Complete Risk Assessment): SCORING GUIDANCE (75 Points) The applicant with the most points on the Risk Assessment (more points equate to less project risk) will receive the full points for the measure. Remaining projects will receive a proportionate share of the full points. For example, if the application being scored had 40 points and the top project had 70 points, this applicant would receive (40/70)*75 points or 43 points. 76
100 Roadway Expansion 9. Cost Effectiveness (100 Points) This criterion will assess the project s cost effectiveness based on the total TAB eligible project cost (not including noise walls) and total points awarded in the previous 8 criteria. A. MEASURE: This measure will calculate the cost effectiveness of the project. Metropolitan Council staff will divide the number of points awarded in the previous criteria by the TABeligible project cost (not including noise walls) by the total number of points awarded in the previous criteria. Cost effectiveness = total TAB eligible project cost (not including noise walls)/total number of points awarded in previous criteria/total TAB eligible project cost (not including noise walls) RESPONSE (This measure will be calculated after the scores for the other measures are tabulated by the Scoring Committee): Total Project Cost (entered in Project Cost Form): SCORING GUIDANCE (100 Points) The applicant with the most points (i.e., the benefits) per dollar will receive the full points for the measure. Remaining projects will receive a proportionate share of the full points. For example, if the top project received.0005 points per dollar and the application being scored received points per dollar, this applicant would receive (.00025/.0005)*100 points or 50 points. The scorer for this measure will also complete a reasonableness check of the total project cost that is used for this measure. The scorer may follow up with the applicant to clarify any questions. Up to 50 percent of points awarded for this measure can be deducted if the scorer does not believe that the cost estimate is reasonable. Discretion will be given the applicant that they best understand the unique conditions of the project and have provided a fair cost estimate to successfully deliver the project. TOTAL: 1,100 POINTS 77
101 Risk Assessment Please check those that apply and fill in anticipated completion dates for all projects, except for new/expanded transit service projects, transit vehicle purchases, or travel demand management (TDM) projects. 1) Project ScopeFunding (5 20 Percent of Points) 100% Meetings or contacts with stakeholders have occurredall funding sources are identified and/or are local sources (the Regional Solicitation award is the gap funding/remaining funding needed to implement the project); applicants may still pursue other funding sources after the project award to reduce the local contribution. 40% Stakeholders have been identified 0% The applicant is promising to cover the entire local match, but it is necessary for them to seek other sources (e.g., state bonding or various state/federal competitive grants) or funding partners to be able to successfully deliver the project (i.e., the local agency does not have the entire local match committed at this time) Stakeholders have not been identified or contacted 2) Layout or Preliminary Plan (5 Percent of Points) 100% Layout or Preliminary Plan completed 50% Layout or Preliminary Plan started 0% Layout or Preliminary Plan has not been started Anticipated date or date of completion: 3) Environmental Documentation (5 Percent of Points) EIS EA PM Document Status: 100% Document approved (include copy of signed cover sheet) 75% Document submitted to State Aid for review (date submitted: ) 50% Document in progress; environmental impacts identified; review request letters sent 0% Document not started Anticipated date or date of completion/approval: 4)2) Review of Section 106 Historic Resources (10 20 Percent of Points) 100% No known historic properties eligible for or listed in the National Register of Historic Places are located in the project area, and project is not located on an identified historic bridge 100% There are historical/archeological properties present, but determination of no historic properties affected is anticipated. 80% Historic/archeological review under wayproperty impacted; determination of no historic properties affected or no adverse effect anticipated 40% Historic/archeological review under wayproperty impacted; determination of adverse effect anticipated 78
102 0% Unsure if there are any historic/archaeological resources properties in the project area. Anticipated date or date of completion of historic/archeological review: Project is located on an identified historic bridge: 5)3) Review of Section 4f/6f Resources (10 20 Percent of Points) 4(f) Does the project impacts any public parks, public wildlife refuges, public golf courses, wild & scenic rivers or public private historic properties? 6(f) Does the project impact any public parks, public wildlife refuges, public golf courses, wild & scenic rivers or historic property that was purchased or improved with federal funds? 100% No Section 4f/6f resources property located in or adjacent to the project 100% Impact to 4(f) property. The project is an Independent Bikeway/Walkway project covered by the bikeway/walkway Negative Declaration statement. Letter of support received (potential option for bicycle and pedestrian facility applications only) 8070% Section 4f resources present within the project area, but no adverse effectsimpacts are minor and they do not adversely affect the activities, features, or attributes of the 4(f) property. 50% Project impacts to Section 4f/6f resources likely present within project area; 4(f) evaluation required. Ccoordination/documentation has begun 30% Project impacts to Section 4f/6f present within project area; 4(f) evaluation required. Coordination/documentation has not begun resources likely coordination/documentation has not begun 0% Unsure if there are any impacts to Section 4f/6f resources in the project area 6)4) Right of Way (15 20 Percent of Points) 100% Right of way, permanent or temporary easements not required 100% Right of way, permanent or temporary easements has/have been acquired 75% Right of way, permanent or temporary easements required, offers made 50% Right of way, permanent or temporary easements required, appraisals made 25% Right of way, permanent or temporary easements required, parcels identified 0% Right of way, permanent or temporary easements required, parcels not identified 0% Right of way, permanent or temporary easements identification has not been completed Anticipated date or date of acquisition 7)5) Railroad Involvement (25 20 Percent of Points) 100% No railroad involvement on project 100% Railroad Right of Way Agreement is executed (include signature page) 60% Railroad Right of Way Agreement required; Agreement has been initiated 40% Railroad Right of Way Agreement required; negotiations have begun 20% Railroad Right of Way Agreement required; railroad has been contacted 0% Railroad Right of Way Agreement required; negotiations not begunrailroad has not been contacted. 79
103 Anticipated date or date of executed Agreement 8) Interchange Approval (15 Percent of Points)* 100% Project does not involve construction of a new/expanded interchange or new interchange ramps 100% Interchange project has been approved by the Metropolitan Council/MnDOT Highway Interchange Request Committee 0% Interchange project has not been approved by the Metropolitan Council/MnDOT Highway Interchange Request Committee *Please contact Karen Scheffing at MnDOT (Karen.Scheffing@state.mn.us or ) to determine if your project needs to go through the Metropolitan Council/MnDOT Highway Interchange Request Committee. 9) Construction Documents/Plan (10 Percent of Points) 100% Construction plans completed/approved (include signed title sheet) 75% Construction plans submitted to State Aid for review 50% Construction plans in progress; at least 30% completion 0% Construction plans have not been started Anticipated date or date of completion: 10) Letting Anticipated Letting Date: 80

104 REGIONAL SOLICIATION ROADWAY APPLICATIONS: POTENTIAL CHANGES TAC September 6, 2017

105 Application Categories
")
106 Potential Change: Bridge (Page 1) Incorporate Highway Truck Corridor Study Tiers instead of Freight Project Elements and Current Daily Heavy Commercial Traffic measures (Page 4) 3
107 Potential Changes: Roadway System Management (Page 14) Changes recommended by RSM Work Group 1. Role in the Regional Transportation System And Economy: Functional classification of project (Page 16) Integration with existing traffic management systems (Page 18) Coordination with other agencies (Page 18) 4
108 Potential Changes: Roadway System Management (Page 14) Changes recommended by RSM Work Group 4. Infrastructure age (Page 24) Shift focus from age to obsolescence Qualitative measure 5A. Congestion Reduction: Shift from Synchro analysis to Streetlight speed data (Page 25) 5
109 Potential Changes: Roadway System Management (Page 14) 6. Safety 6B. New qualitative measure identifying safety issues in project area and connection to local safety plans (Page 28) 6
110 Potential Changes: Roadway System Management (Page 14) Changes recommended by RSM Work Group Regional Signal Retiming Program 40:1 B/C Economies of Scale Consistency with TPP and FHWA feedback on needed changes to federally-required Congestion Management Process (CMP) 7
 PAs focus on PA Intersection Conversion Study priorities (Page 57) Points for both at-grade and grade-separated projects at")
111 Roadway Expansion (Page 55) 1A: A-Minors focus on systemwide congestion relief using Streetlight for travel speeds. (Page 57) PAs focus on PA Intersection Conversion Study priorities (Page 57) Points for both at-grade and grade-separated projects at these 90+ intersections 8
112 Questions Steve Peterson, Manager of Highway Planning and TAB/TAC Process Joe Barbeau, Senior Planner Elaine Koutsoukos, TAB Coordinator
113 7/14/2017 Regional Signal Retiming & Optimization Program Goal: Regional Signal Timing Program Background: The benefits of signal retiming are well documented and are commonly agreed to be around 40:1 return-on-investment. Federal Highway Administration recommends signal retiming every 3-5 years. This program will attempt to meet this goal. For the 2018 Regional Solicitation, funds will be available for the 2022 and 2023 program years, which is over five years out from today. Therefore, even recently timed signals would be eligible for a retiming. Program Outline: The project would consist of collecting all necessary data, developing 3-5 optimized timing plans, implementation, fine-tuning and creation of a final report documenting the benefits of the project. It is anticipated that this program would be able to retime over 500 traffic signals in the region. Hardware and communication upgrades are not being consider as part of this project. Elements such as this would still be able to be funded through the normal Regional Solicitation process. Funds for the proposed effort would come out of the approximately $4M-$5M per year that is currently being allocated to the Roadway System Management application category. MnDOT Metro District would facilitate this program through their State-Aid and Traffic Offices. Qualified consultant firms (5) with knowledge and expertise in signal retiming and signal operations would be pre-approved. The agencies would submit a list of intersections they would like retimed as part of this effort. Supporting documentation would be required (date last retimed, ADT, number of signals, etc.). Funds would be distributed to cities and counties based on the number of signals owned by each agency. For example, if City Y owns 10% of the traffic signals in the region, then they would get 10% of the total funds available. An inventory of existing signals was recently compiled at the request of the State Legislature. The amount of funds being requested would not retime the entire system. Each individual agency would be able to select the signals and corridors for retiming based on their priorities and needs using the money allocated to them. Consultants would be assigned on a rotating basis, ensuring agencies get exposed to various firms. The Program would fund 80% of the project with the agency funding the remaining 20%. The consultants would perform field evaluations, collect all required data, develop and implement timing plans, make any filed adjustments and document all benefits. See attached Scope of Work as an example. Program Benefits: Investment in signal timing and related projects is the highest priority for highway investment in the 2040 Transportation Policy Plan. In addition, the Plan states that when highway capacity issue are identified, regional transportation partners should first work to apply traffic management technologies to improve traffic flow without adding physical highway capacity. A recent federal certification review for the MPO indicated a need for major changes to the federally-required Congestion Management Process. This investment would be a significant step to meeting the changes required by the Federal Highway Administration. One of their
114 8/17/2017 requests is to supply before and after performance data, as will be done with this proposed effort, to ensure that wise investments are being made in the transportation system. Economies of scale will be realized as local agencies will not have to prepare costly funding applications, manage the federal grant, or hire a consultant to do the retiming work. This request is for $3,000,000 ($1,000,000 in 2022 to get the program started and then $2,000,000 in 2023). 2

115 Congestion Management Safety Plan Michael Corbett State Program Administrator September 2017
116 Agenda Topic 1 What is the Congestion Management Safety Plan (CMSP)? 2 Relevance to Congestion Investments 3 Approach and Methodology 4 Current Analysis and Next Steps 8/31/2017 2
117 What is the Congestion Management Safety Plan? A unique initiative aimed at identifying Highway investment solutions that can be quickly implemented at lower costs than traditional projects (e.g. adding new lanes or bridges) Goals are to address congestion, safety and travel time reliability concerns Focus is on MnDOT freeways & highways in 8-county metro 8/31/2017 3
118 What is the Congestion Management Safety Plan? Solutions strive to: Use existing pavement and right-of-way Be implemented in one construction season Take advantage of other upcoming funded projects Be less than one mile in length Fine-tune the system rather than expand it 8/31/2017 4

119 Project Examples 8/31/2017 5

120 Project Examples 8/31/2017 6

121 Project Examples 8/31/2017 7
122 Why Pick this type of approach? Realization that building our way out of congestion is not a feasible approach Impacts to environment and communities would be severe to catastrophic Right-of-way acquisition costs would be prohibitive in some areas Revenues to fund the expansion fall significantly short Study estimated a need of $40B, revenues were $6B Gas tax would need to increase by $2.30 per gallon 8/31/2017 8
123 Relevance to Congestion Investments Direction from recent MnDOT and Met Council long range plans realize constraints (environmental, political, funding) and set priorities for investment on our transportation network: Preservation Only Active Traffic Management Congestion Management Safety Plan MnPASS Strategic Capacity Congestion Management Safety Plan approach offers a more efficient use of limited resources 8/31/2017 9
124 Approach and Methodology First, traffic volumes, travel times, and crash data was collected for all MnDOT roadways in the Metro area Volume and travel time data came from our loop detectors and 3 rd party GPS data for the year 2015 Crash data covered a three year period from July 2012 to June 2015 Underlying causes of congestion or crashes were analyzed Analysis of over 600 locations led to the development of the System Problem Statement 8/31/

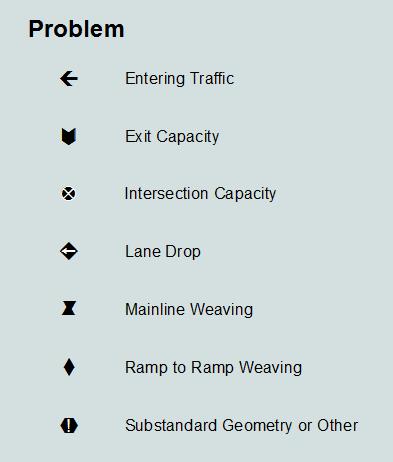
125 Approach and Methodology 8/31/
REGIONAL SOLICITATION ROADWAY APPLICATIONS: POTENTIAL CHANGES. TAB September 20, 2017
 REGIONAL SOLICITATION ROADWAY APPLICATIONS: POTENTIAL CHANGES TAB September 20, 2017 2 2016 Application Categories Bridge Incorporate Highway Truck Corridor Study Tiers instead of Freight Project Elements
Appendix D: Functional Classification Criteria and Characteristics, and MnDOT Access Guidance
 APPENDICES Appendix D: Functional Classification Criteria and Characteristics, and MnDOT Access Guidance D.1 Functional classification identifies the role a highway or street plays in the transportation
2040 Transportation Policy Plan Conversion to Performance Based Planning Basis. 25 th Annual CTS Transportation Research Conference May 21, 2014
 2040 Transportation Policy Plan Conversion to Performance Based Planning Basis 25 th Annual CTS Transportation Research Conference May 21, 2014 1 About the plan Long-range transportation plan for the Twin
The Policies section will also provide guidance and short range policies in order to accomplish the goals and objectives.
 4 Goals & Objectives INTRODUCTION The 2015-2040 MTP preserves and promotes the quality of life and economic prosperity of the MAB by providing a transportation system consistent with the regional goals.
Chapter 5: Highway Investment Direction and Plan
 5.1 Chapter 5: Highway Investment Direction and Plan 2040 2040 TRANSPORTATION POLIC PLAN version 1.0 5.2 Chapter 5: Highway Investment Direction and Plan Highway Investment Direction 3 Current Revenue
Twin Cities Regional Truck Corridors Study. MnDOT Metro Freight Studies Roundup
 Twin Cities Regional Truck Corridors Study MnDOT Metro Freight Studies Roundup February 3, 2017 Study Background Transportation Policy Plan Goal: The regional transportation system supports the economic
LAND USE POLICIES BY COMMUNITY DESIGNATION
 137 2040 138 Land Use Policies by Community Designation As discussed earlier in Thrive MSP 2040, the Council assigns a community designation to each city and township. This designation indicates the overall
CITY OF JACKSONVILLE 2030 MOBILITY PLAN STUDY UPDATE GOALS, OBJECTIVES, AND PERFORMANCE MEASURES PREPARED FOR: CITY OF JACKSONVILLE
 CITY OF JACKSONVILLE 2030 MOBILITY PLAN STUDY UPDATE GOALS, OBJECTIVES, AND PERFORMANCE MEASURES 3.20.2017 PREPARED FOR: CITY OF JACKSONVILLE 55 Railroad Row White River Junction, VT 05001 802.295.4999
Project Initiation Form
 Meeting Date: The Project Initiation Form should be completed in conjunction with the Level 2 Screening Form. Process Leads and/or Planners should complete the Project Initiation Form to document coordination
URBAN CENTER COMMUNITY ROLE COUNCIL ROLE ALL COMMUNITIES URBAN CENTER
 Orderly and Efficient Land Use Align land use, development patterns, and infrastructure to make the best use of public and private investment. Plan for forecasted population and household growth at average
HORIZON 2030: Plan Projects November 2005
 Horizon PROJECTS 2030 Projects 10-1 10-2 The Horizon 2030 Project Information section is comprised of individual project information in alphabetical order by project name. The information provided for
Congestion Management Process 2013 Update
 OVERVIEW OF THE DALLAS-FORT WORTH CONGESTION MANAGEMENT PROCESS Traffic Congestion In The Dallas-Fort Worth Region With the Dallas-Fort Worth (DFW) urban area as its center, the North Central Texas region
Regional Transportation Studies Regional Council
 Pima Association of Governments 1 E. Broadway, Tucson, Arizona Santa Rita Conference Room Regional Transportation Studies Regional Council September 28, 2017 I-11 Tier 1 Environmental Impact Statement
APPENDIX A: SHORT-TERM PROJECT DEPLOYMENTS
 APPENDIX A: SHORT-TERM PROJECT DEPLOYMENTS Page 1 of 15 ST-01: I-95 ITS DEPLOYMENT (DE STATE LINE TO AIRPORT) PROJECT DESCRIPTION AND SCOPE: Project will address gaps in ITS device coverage on I-95 from
Section 5: Performance-Based Planning
 Section 5: Performance-Based Planning Mapping the Future: The Southwestern PA Plan establishes a performance-based foundation for regional transportation investment decisions consistent with MAP-21 1 guidance.
2 Purpose and Need. 2.1 Study Area. I-81 Corridor Improvement Study Tier 1 Draft Environmental Impact Statement
 2 Purpose and Need 2.1 Study Area Interstate 81 (I-81) is relied upon for local and regional travel and interstate travel in the eastern United States. It extends 855 miles from Tennessee to New York at
MONITORING IMPLEMENTATION AND PERFORMANCE
 12 MONITORING IMPLEMENTATION AND PERFORMANCE The FAST Act continues the legislation authorized under MAP-21, which created a data-driven, performance-based multimodal program to address the many challenges
AREAWIDE BRIDGE REPLACEMENT AND REHABILITATION
 CECIL COUNTY 2018 TRANSPORTATION IMPROVEMENT PROGRAM AREAWIDE BRIDGE REPLACEMENT AND REHABILITATION DESCRIPTION: On-going program to provide major upgrades to state owned bridges that are structurally
ODOT Asset Management Plan 0
 ODOT Asset Management Plan 0 Table of Contents Executive Summary... 1 ODOT s Experience with Asset Management... 1 A New Way of Doing Business... 2 ODOT s Investment Plans... 3 Moving Forward... 5 1.0
TCATS October 12-Michigan Works 5:30-7pm. NATS October 19-Niles District Library 6-7:30pm
 Goal Development Workshop TCATS October 12- Works 5:30-7pm NATS October 19-Niles District Library 6-7:30pm SAFETEA-LU Goals 2035 TwinCATS Goals 2030 TwinCATS Goals 1. Support the economic vitality of the
Rapid City Area Metropolitan Planning Organization OPERATIONS PLAN
 Rapid City Area Metropolitan Planning Organization OPERATIONS PLAN Prepared for the Rapid City Area Metropolitan Planning Organization Endorsed by the Executive Policy Committee of the Rapid City Area
6.0 Indirect Effects and Cumulative Impacts
 6.0 Effects and Impacts 6.1 Introduction This chapter of the Draft EIS addresses potential indirect and cumulative impacts of the Bottineau Transitway project. effects are those that are caused by the
3.0 TRANSPORTATION AND CIRCULATION
 3.1 INTRODUCTION LEGAL BASIS AND REQUIREMENTS Government Code Section 65302(b) establishes the legal requirements of a Circulation Element as: [The shall include] a Circulation Element consisting of the
HB2 Implementation Policy Guide
 report HB2 Implementation Policy Guide prepared for Commonwealth Transportation Board date August 1, 2015 6.0 Appendix A: Safety Measures Table 6.1 Safety Factor Measures Summary ID Measure Name Weight
Transit Service Guidelines
 G R E AT E R VA N CO U V E R T R A N S P O RTAT I O N A U T H O R I T Y Transit Service Guidelines PUBLIC SUMMARY REPORT JUNE 2004 Greater Vancouver Transportation Authority TRANSIT SERVICE GUIDELINES
ACTIVE TRANSPORTATION PROGRAMMING COMMITTEE Project Funding and Scoring Criteria
 ACTIVE TRANSPORTATION PROGRAMMING COMMITTEE Project Funding and Scoring Criteria Section I. Project meets minimum MARC/State DOT/Federal DOT Requirements STBGP Set-Aside Project Eligibility The Surface
TRANSPORTATION IMPACT STUDIES
 January 28, 2009 POLICIES AND PROCEDURES FOR TRANSPORTATION IMPACT STUDIES Related to Highway Occupancy Permits Pennsylvania Department of Transportation Bureau of Highway Safety and Traffic Engineering
APPENDIX H: TRAVEL DEMAND MODEL VALIDATION AND ANALYSIS
 APPENDIX H: TRAVEL DEMAND MODEL VALIDATION AND ANALYSIS Travel demand models (TDM) simulate current travel conditions and forecast future travel patterns and conditions based on planned system improvements
Technical Memorandum MULTIMODAL NEEDS. Prepared for: Oklahoma Department of Transportation. Prepared by:
 Technical Memorandum MULTIMODAL NEEDS Prepared for: Oklahoma Department of Transportation Prepared by: May 2015 Technical Memorandum The Technical Memos were written to document early research for the
New Jersey Department of Transportation. Local Freight Impact Fund Handbook. Procedures and Criteria for Local Freight Impact Fund Grant Program
 New Jersey Department of Transportation Local Freight Impact Fund Handbook Procedures and Criteria for Local Freight Impact Fund Grant Program Page 1 of 10 Overview The New Jersey Department of Transportation
Transform 66 Multimodal Project: Prioritization Process and Evaluation Criteria Approved March 3, 2016
 Transform 66 Multimodal Project: Prioritization Process and Evaluation Criteria Approved March 3, 2016 The Memorandum of Agreement (MOA) for the Transform 66: Inside the Beltway Project directs NVTC to
CHAPTER 1: INTRODUCTION/ GOALS AND OBJECTIVES
 CHAPTER 1: INTRODUCTION/ GOALS AND OBJECTIVES 1.1: INTRODUCTION ABOUT THE FREDERICKSBURG AREA METROPOLITAN PLANNING ORGANIZATION (FAMPO) Established in 1992, the Fredericksburg Area Metropolitan Planning
APPENDIX B. Public Works and Development Engineering Services Division Guidelines for Traffic Impact Studies
 APPENDIX B Public Works and Development Engineering Services Division Guidelines for Traffic Impact Studies Revised December 7, 2010 via Resolution # 100991 Reformatted March 18, 2011 TABLE OF CONTENTS
Operations in the 21st Century DOT Meeting Customers Needs and Expectations
 Operations in the 21st Century DOT Meeting Customers Needs and Expectations 1 Purpose of this Meeting: Share Thoughts & Discuss Challenges brought about by the changing transportation environment and public
SOUTHEAST FLORIDA REGIONAL COMPACT CLIMATE CHANGE. Sustainable Communities & Transportation Planning
 SOUTHEAST FLORIDA REGIONAL COMPACT CLIMATE CHANGE Draft Regional Climate Action Plan Sustainable Communities & Transportation Planning SP-1 Develop criteria in collaboration with municipal and county planning
THE REGION S PLAN POLICY FRAMEWORK. August 2015
 THE REGION S PLAN POLICY FRAMEWORK August 2015 2 What is The Policy Framework? Cover photo credit: Sinan Sinharoy for Atlanta BeltLine, Inc. Atlanta is one of the world s most dynamic metropolitan areas,
Annual Transportation Performance Report 2012
 Annual Transportation Performance Report 2012 Page intentionally left blank... March 2014 Dear People and Businesses of Minnesota, I am pleased to share with you the 2012 Annual Transportation Performance
Memorandum. FROM: Jim Ortbal Rosalynn Hughey Barry Ng TO: HONORABLE MAYOR, CITY COUNCIL. DATE: June 16, 2017
 CITY OF SANjOSE CAPITAL OF SILICON VALLEY TO: HONORABLE MAYOR, CITY COUNCIL SUBJECT: TRANSPORTATION POLICY UPDATE REQUIRED BY STATE LAW - LOS TO VMT Memorandum FROM: Jim Ortbal Rosalynn Hughey Barry Ng
WELCOME IL 47. Community Advisory Group Meeting #5 Waubonsee Community College Wednesday, May 31, 2017
 WELCOME IL 47 Community Advisory Group Meeting #5 Waubonsee Community College Wednesday, May 31, 2017 MEETING PURPOSE MEETING AGENDA 1. Welcome/Introduction 2. Review Previous Public Involvement 3. Process/Schedule
The Folded Interchange: An Unconventional Design for the Reconstruction of Cloverleaf Interchanges
 The Folded Interchange: An Unconventional Design for the Reconstruction of Cloverleaf Interchanges I. ABSTRACT Keith A. Riniker, PE, PTOE This paper presents the Folded Interchange design and compares
Elements of a Complete Streets Policy Effective 2018
 1152 15 th Street NW, Suite 450 www.smartgrowthamerica.org/completestreets Washington, DC 20005 202-207-3355 Elements of a Complete Streets Policy Effective 2018 The National Complete Streets Coalition
Safety. Introduction. Total System
 Safety Introduction Ohio is the 35 th largest state in the nation based on geographic size, however it carries the 5 th largest total traffic volume and the 4 th largest truck traffic volume. With such
Congestion Management Plan Update. Public Works and Infrastructure Committee. General Manager, Transportation Services
 PW1.4 STAFF REPORT ACTION REQUIRED Congestion Management Plan 2014-2018 Update Date: December 9, 2014 To: From: Wards: Reference Number: Public Works and Infrastructure Committee General Manager, Transportation
HIGHWAY 14 NEW ULM TO NICOLLET 4-Lane Expansion Open House
 HIGHWAY 14 NEW ULM TO NICOLLET 4-Lane Expansion Open House HIGHLIGHTS OF HWY 14 PROGRESS 1960s & 70s Four-lane expansion in Rochester and Mankato areas 1993 Owatonna to Kasson EIS Completed (redone to
ROSEMOUNT TRANSPORTATION PLAN
 ROSEMOUNT TRANSPORTATION PLAN April 2008 (Revised April, July 2009) Prepared by: WSB & Associates, Inc. 701 Xenia Avenue South, Suite 300 Minneapolis, MN 55416 (763) 541-4800 (763) 541-1700 (Fax) WSB Project
10:00 AM Welcome, Introductions & Project Overview 10:15 AM ITS Architecture Overview
 Stakeholder Meeting February 10, 2016 Agenda 10:00 AM Welcome, Introductions & Project Overview 10:15 AM ITS Architecture Overview National ITS Architecture Terms and Concepts Regional ITS Architecture
Staff Priority and UPWP Committee Priority List 3/25/2016. ID Proposed Study Name Project Category Tentative Project Cost
 Staff and UPWP Committee List 3/25/2016 Projects with Only (No Bottom Non- ) C-2 Safety and Operations at Selected Intersections: FFY 2017 Roadway Network Performance $65,000 Purpose: The purpose of this
BOSTON REGION METROPOLITAN PLANNING ORGANIZATION
 PLANNING ORGANIZATIO BOSTON REGION MPO NMETROPOLITAN BOSTON REGION METROPOLITAN PLANNING ORGANIZATION Stephanie Pollack, MassDOT Secretary and CEO and MPO Chair Karl H. Quackenbush, Executive Director,
Regional Mobility Authorities in Texas
 Regional Mobility Authorities in Texas Testimony of Ginger Goodin, P.E., Senior Research Engineer and Director, TTI Transportation Policy Research Center John Overman, Research Scientist for Transit Mobility
LOCATION AND DESIGN DIVISION
 VIRGINIA DEPARTMENT OF TRANSPORTATION LOCATION AND DESIGN DIVISION INSTRUCTIONAL AND INFORMATIONAL MEMORANDUM GENERAL SUBJECT: Design Exceptions / Waivers SPECIFIC SUBJECT: Design Exception Request Form
INTRODUCTION... 4 DATA COLLECTION AND ASSESSMENT... 6 I-1. DATA COLLECTION AND ASSESSMENT... 6 I-1.1 CTP Inventory and Assessment... 6 I-1.
 1 INTRODUCTION... 4 DATA COLLECTION AND ASSESSMENT... 6 I-1. DATA COLLECTION AND ASSESSMENT... 6 I-1.1 CTP Inventory and Assessment... 6 I-1.2 Bicycle and Pedestrian Inventory and Assessment... 6 I-1.3
South Boston. Transportation Plan. Transportation Planning Division. Virginia Department of Transportation
 2020 Transportation Plan Developed by the Transportation Planning Division of the Virginia Department of Transportation in cooperation with the U.S. Department of Transportation, Federal Highway Administration
San Francisco Transportation Task Force 2045
 San Francisco Transportation Task Force 2045 August 21, 2017 Meeting Today s Meeting Objectives & Agenda Agenda Time Agenda Item 10 mins Welcome, introductions, task force updates 30 mins Revenue measure(s):
NJDOT: Asset Management Strategies and Tools
 NEW JERSEY DEPARTMENT OF TRANSPORTATION NJDOT: Asset Management Strategies and Tools Wednesday, October 1, 2014 Afternoon Session (1:45pm 2:30pm) Presenters Michael Castaldo New Jersey Department Of Transportation
PUBLICATIONS MAPS DATA
 PUBLICATIONS MAPS DATA REGIONAL INFORMATION CENTER North Central Texas Council of Governments Centerpoint Two, 616 Six Flags Drive, 76011 P. O. Box 5888, Arlington, Texas 76005-5888 Telephone: (817) 640-3300
TRANSPORTATION TRANSPORTATION 9-1
 TRANSPORTATION Community Vision 2028 Because we place such high value on our natural surroundings, we responsibly plan for, manage, and mitigate the impacts of growth on those surroundings. Kezziah Watkins
HB2 Implementation Policy Guide
 report HB2 Implementation Policy Guide prepared for Commonwealth Transportation Board date August 1, 2015 Table of Contents 1.0 Introduction... 1 1.1 HB2 Legislation Requirements... 1 1.2 Roles and Responsibilities...
CREATING A BLUEPRINT FOR CARGO-ORIENTED DEVELOPMENT
 Photo Credit: zman z28/flickr Creative Commons License CREATING A BLUEPRINT FOR CARGO-ORIENTED DEVELOPMENT IN THE MINNEAPOLIS M ST. PAUL REGION Metropolitan Council Meeting of the Whole, June 21 ABOUT
1.1.1.b. Agencies share best practices as they integrate COMPASS facilitates
 Transportation Goals 1.1 Enhance the system to improve accessibility and connectivity to jobs, schools, and services; allow the efficient movement of people and goods; and ensure the reliability of travel
Future System Planning (ST4)
") Future System Planning (ST4) Subarea All Primary Mode Policies and Programs Facility Type Length Version Draft ST3 Plan Date Last Modified March 28, 2016 PROJECT AREA AND REPRESENTATIVE ALIGNMENT SHORT
Future System Planning (ST4) Subarea All Primary Mode Policies and Programs Facility Type Length Version Draft ST3 Plan Date Last Modified March 28, 2016 PROJECT AREA AND REPRESENTATIVE ALIGNMENT SHORT
Los Angeles County Congestion Reduction Demonstration Project
 Los Angeles County Congestion Reduction Demonstration Project frequently asked questions update #1 /august 2008 Los Angeles County Metropolitan Transportation Authority (Metro), California Department of
Transportation Concurrency
 2015 Frequently Asked Questions About. Transportation Concurrency Q. What is Transportation Concurrency? A. Transportation Concurrency is both a State law requirement and a City pre-application development
Executive Summary. Overview
 Executive Summary Overview The Genesee-Finger Lakes Diversion Route Initiative identifies the most suitable diversion routes for Principal Arterial roads in the nine-county Genesee-Finger Lakes Region.
Connected/Autonomous Vehicles in a
 Connected/Autonomous Vehicles in a Freight Corridor: Implementation Issues and Assumptions presented to ITS 3C Summit 2014 Mobile, AL presented by Cambridge Systematics, Inc. Kenny Voorhies, PE, PTOE September
TRANSPORTATION 101 Today and Tomorrow. Moving People and Goods
 TRANSPORTATION 101 Today and Tomorrow Moving People and Goods What is the Transportation Commission? An independent, seven-member body of citizens appointed by the Governor for six-year terms and representing
2017 Highway Safety Improvement Program Call
 2017 Highway Safety Improvement Program Call The Highway Safety Improvement Program (HSIP) is for highway safety projects that eliminate or reduce the number of fatalities and serious injuries on all public
Funding Intelligent Transportation Systems in the Los Angeles Region
 Funding Intelligent Transportation Systems in the Los Angeles Region 2017 ITS California Annual Meeting Ed Alegre, PTP Los Angeles County Metropolitan Transportation Authority (Metro) Los Angeles Region
TRANSPORTATION IMPACT ANALYSIS GUIDELINES
 TRANSPORTATION IMPACT ANALYSIS GUIDELINES SANTA CLARA COUNTY TRANSPORTATION AUTHORITY CONGESTION MANAGEMENT PROGRAM ADOPTED MARCH 2009 TABLE OF CONTENTS PART I - STATUTE AND AUTHORITY...1 CHAPTER 1. CMP
IOWA TRANSPORTATION BY THE NUMBERS:
 IOWA TRANSPORTATION BY THE NUMBERS: Meeting the State s Need for Safe and Efficient Mobility MARCH 2013 202-466-6706 www.tripnet.org Founded in 1971, TRIP of Washington, DC, is a nonprofit organization
An Introduction to the. Safety Manual
 An Introduction to the Highway Safety Manual An Introduction to the HIGHWAY SAFETY MANUAL Table of Contents Section 1: HSM Overview... 1 What is the Highway Safety Manual?... 1 How is the HSM Applied?...
2016 Mid-Continent Transportation Research Symposium, October 24-25, Donna Brown-Martin, Director Bureau of Planning and Economic Development
 2016 Mid-Continent Transportation Research Symposium, October 24-25, 2016 Donna Brown-Martin, Director Bureau of Planning and Economic Development Why the State Freight Plan is Important to You Vision,
AIR QUALITY AND CLIMATE CHANGE EVALUATION GUIDANCE
 AIR QUALITY AND CLIMATE CHANGE EVALUATION GUIDANCE The following guidance provides additional details regarding the process followed by PSRC to evaluate projects for potential air quality benefits. As
Transit Oriented Development Study
 Federal Way Link Extension Transit Oriented Development Study Table of Contents Executive Summary ES 1 Chapter 1: Introduction.. 1-1 Chapter 2: Methodology. 2-1 Chapter 3: Project Overview 3-1 Chapter
SIEMENS CONCERT: City of Seattle
 SIEMENS CONCERT: City of Seattle Use of ATMS to Enhance and Extend Signal Operations Abstract: Today s signal systems are part of a complex environment that includes varied and disparate data sources and
MULTIMODAL TRANSPORTATION IMPACT STUDY GUIDELINES
 MULTIMODAL TRANSPORTATION IMPACT STUDY GUIDELINES 1 st Edition City of San Luis Obispo 2035 Circulation Element 1 Table of Contents Introduction... 2 Process... 2 When Impact Studies Are Required... 3
Scope of Services Traffic Signal Retiming Contract FM NO Florida Department of Transportation District Four
 Scope of Services Traffic Signal Retiming Contract FM NO. 230017-8-32-01 Florida Department of Transportation District Four A-1 Contents 1. Background... 3 2. Summary of Services... 3 3. Consultant Requirements...
Current Trends in Traffic Congestion Mitigation
 Current Trends in Traffic Congestion Mitigation April 24, 2009 NCSL Spring Forum Washington, DC Jeff Lindley Associate Administrator, Office of Operations Federal Highway Administration U.S. Department
NCDOT Overview. Nick Tennyson, Chief Deputy Secretary March 4, 2015
 NCDOT Overview Nick Tennyson, Chief Deputy Secretary March 4, 2015 Overview Major Functions of DOT Board of Transportation Highway System Overview Construction- Road Building Process Operations and Maintenance
TRANSIT SERVICE GUIDELINES
 CHATHAM AREA TRANSIT AUTHORITY FEBRUARY 2014 Table of Contents 1. PURPOSE... 3 2. CAT SERVICE GUIDELINES... 3 3. TRAVEL MARKETS... 4 4. TRANSIT COVERAGE... 4 5. TRANSIT ACCESS... 4 6. BUS STOP SPACING
INTELLIGENT TRANSPORTATION SYSTEMS SUMMARY
 Genesee County Shaping our Transportation Future Together 2035 Long Range Transportation Plan INTELLIGENT TRANSPORTATION SYSTEMS SUMMARY What is an Intelligent Transportation System? An Intelligent Transportation
1RUWKZHVW#:LFKLWD 0DMRU#,QYHVWPHQW#6WXG\
 1RUWKZHVW#:LFKLWD 0DMRU#,QYHVWPHQW#6WXG\ Executive Summary 3UHSDUHGýIRUã 3UHSDUHGýE\ã.DQVDVý'HSDUWPHQWýRI 7UDQVSRUWDWLRQ,QýDVVRFLDWLRQýZLWKã (DUWKý7HFKý,QFï EXECUTIVE SUMMARY Introduction This Northwest
Exposition Light Rail Transit Project
 Exposition Light Rail Transit Project Downtown & Mid-Corridor Project Status Update Meeting Holman United Methodist Church Thursday, July 23, 2009 Phase 1 Project Description 8.6 mile corridor from Downtown
CHAPTER 6: ECONOMIC DEVELOPMENT INTRODUCTION CHAPTER 6: ECONOMIC DEVELOPMENT 6-1
 CHAPTER 6: ECONOMIC DEVELOPMENT INTRODUCTION The purpose of this chapter is to identify strategies to increase commercial and industrial development in the City of Dayton. There are currently few commercial
MAINE TRANSPORTATION BY THE NUMBERS:
 MAINE TRANSPORTATION BY THE NUMBERS: Meeting the State s Need for Safe and Efficient Mobility OCTOBER 2012 202-466-6706 www.tripnet.org Founded in 1971, TRIP of Washington, DC, is a nonprofit organization
I-10 CORRIDOR IMPROVEMENTS STAGE 0 FEASIBILITY STUDY STATE PROJECT NUMBER H FEDERAL AID PROJECT NUMBER H004100
 JULY 2016 I-10 CORRIDOR IMPROVEMENTS STAGE 0 FEASIBILITY STUDY STATE PROJECT NUMBER H.004100 FEDERAL AID PROJECT NUMBER H004100 EAST BATON ROUGE AND WEST BATON ROUGE PARISHES, LOUISIANA Section TABLE OF
S-09: Auburn Station Access Improvements
 Project Number S-09 Subarea South King Primary Mode Commuter Rail Facility Type Infrastructure Improvements Length Version Number ST Board Workshop Date Last Modified 11-25-2015 PROJECT AREA AND REPRESENTATIVE
NATMEC June 30, 2014 Anita Vandervalk, PE, PMP
 NATMEC June 30, 2014 Anita Vandervalk, PE, PMP Agenda 1. Florida s MPM Program 2. Research Efforts and Progress 3. Source Book 4. Transitioning to Real Time Data 5. Next Steps Importance of Mobility Providing
HB2 Implementation Policy Guide
 report HB2 Implementation Policy Guide prepared for Commonwealth Transportation Board date March 18, 2015 Table of Contents 1.0 Introduction... 9 1.1 HB2 Legislation Requirements... 10 House Bill 1887...
EXHIBIT A. TRANSIT AND MULTIMODAL DEVELOPMENT SUPPORT CONTINUING SERVICES SCOPE OF SERVICES FM No
 EXHIBIT A TRANSIT AND MULTIMODAL DEVELOPMENT SUPPORT CONTINUING SERVICES SCOPE OF SERVICES FM No. 429768-4-12-01 This Exhibit forms an integral part of the Agreement between the DEPARTMENT and, the CONSULTANT,
This page intentionally left blank.
 EXECUTIVE SUMMARY This page intentionally left blank. SATOMORROW MULTIMODAL TRANSPORTATION PLAN EXECUTIVE SUMMARY Introduction The City of San Antonio is anticipated to experience tremendous growth resulting
OPTIMIZING RAMP METERING STRATEGIES
 OPTIMIZING RAMP METERING STRATEGIES Presented by Kouros Mohammadian, Ph.D. Saurav Chakrabarti. ITS Midwest Annual Meeting Chicago, Illinois February 7, 2006 Background Ramp control is the application of
The Indian Nations Council of Governments (INCOG) 2035 Plan: Roadways Element
 2035 Plan: Roadways Element") Roadways The Indian Nations Council of Governments (INCOG) The Indian Nations Council of Governments is the designated regional planning organization for the Tulsa Transportation Management Area (TMA).
Roadways The Indian Nations Council of Governments (INCOG) The Indian Nations Council of Governments is the designated regional planning organization for the Tulsa Transportation Management Area (TMA).
Geometric Design: Past, Present, and Future
 A2A02: Committee on Geometric Design Chairman: Daniel B. Fambro Geometric Design: Past, Present, and Future DANIEL B. FAMBRO, Texas A&M University JOHN C. COLLINGS, Delcan Corporation ROBERT DELLA VEDOVA,
MAINE TRANSPORTATION BY THE NUMBERS:
 MAINE TRANSPORTATION BY THE NUMBERS: Meeting the State s Need for Safe, Smooth and Efficient Mobility OCTOBER 2016 202-466-6706 tripnet.org Founded in 1971, TRIP of Washington, DC, is a nonprofit organization
Sustainability. Sustainability Principles. 1. Framework. Spokane Transit s definition of Sustainability is:
 Sustainability Spokane Transit s definition of Sustainability is: Sustainability at Spokane Transit is about providing services in ways that optimize our ability to meet the needs of present and future
With the challenges facing Washington s transportation
 CHAPTER 5 REACHING THE VISION HOW WILL WE GUIDE OURSELVES MOVING FORWARD? With the challenges facing Washington s transportation system, the project team and partners identified four focus areas that consistently
PLAN 2040 Regional Transportation Plan Update. Final Recommendations. Transportation and Air Quality Committee March 13, 2014
 PLAN 2040 Regional Transportation Plan Update Final Recommendations Transportation and Air Quality Committee March 13, 2014 TIP/RTP Update Milestones Official public comment period closed February 21 Final
City of Los Angeles California
 DEPARTMENT OF CITY PLANNING 200 N. Spring Street, Room 525 Los Angeles, CA 90012-4801 and 6262 Van Nuys Blvd., Suite 351 Van Nuys, CA 914011 City of Los Angeles California EXECUTIVE OFFICES MICHAEL J.
1.1 Purpose of the Project
 Chapter 1 Purpose and Need for East Link Project 1.1 Purpose of the Project The purpose of the East Link Project is to expand the Sound Transit Link light rail system from Seattle to Mercer Island, Bellevue
Functional Classification Comprehensive Guide. Prepared by
 Functional Classification Comprehensive Guide Prepared by June 6, 2014 INTRODUCTION PURPOSE OF DOCUMENT The intent of this document is to provide a comprehensive guide to Virginia Department of Transportation