Calibration and Field Validation of Four Double-Crossover Diamond Interchanges in VISSIM Microsimulation
|
|
|
- Angelica Hutchinson
- 6 years ago
- Views:
Transcription
1 Calibration and Field Validation of Four Double-Crossover Diamond Interchanges in VISSIM Microsimulation Bastian J. Schroeder, Ph.D., P.E.* Assistant Director, Highway Systems, ITRE Tel.: () -; Bastian_Schroeder@ncsu.edu Katayoun Salamati, Ph.D. Post-Doctoral Research Scholar, ITRE Tel.: () -; Katy_Salamati@ncsu.edu Joseph Hummer, Ph.D., P.E. Chair, Civil and Environmental Engineering, WSU Tel.: () -0; joseph.hummer@wayne.edu ) Institute for Transportation Research and Education, N.C. State University NCSU Campus Box 0, Raleigh, NC -0 ) Department of Civil and Environmental Engineering, Wayne State University 00 Anthony Wayne Dr. Detroit, MI 0 Submitted for consideration for publication and presentation at the th Annual Meeting of the Transportation Research Board, January -, 0 Word Count:,0 text words plus,00 for figures/tables (0*0) =, Revised Submission November 0 * Corresponding Author
2 0 ABSTRACT This paper presents calibration and validation results for modeling Double-Crossover Diamond (DCD) interchanges in a microsimulation environment. Using the VISSIM simulation tool and detailed field data collected at four operational DCDs in the United States, the paper describes modeling challenges, calibration steps, and validation results in the form of delay, travel time, and queuing estimates. DCD interchanges are rapidly being deployed across the United States, accelerated by their ability to process high volumes of especially left-turning traffic at interchanges, at a greatly-reduced construction cost over other interchange alternatives. In the absence of an analytical methodology for evaluating these interchanges, simulation presently represents the only option for evaluating the operational performance of DCDs. While other research has previously applied simulation to DCD evaluation, this paper is able to present detailed validation results from field data collected at four fully operational DCDs in the US. The results show that the operations of DCDs can largely be replicated in a simulation environment, but that care needs to be taken in properly setting speed and routing decisions throughout the DCD network. The analysis further showed that validation is more readily achieved over an extended route analysis, with increasing difficulties for short segment validation. The validation of field-measured queues proved challenging due to definitional differences between simulated and field study results. Overall, the results of this paper demonstrate the feasibility of satisfactory calibration of simulation tools to enable the operational performance evaluation of DCD interchanges.
3 0 0 0 INTRODUCTION Alternative intersections and interchanges have become popular alternatives for addressing congestion problems at nodes in the United States. The Alternative Intersection and Interchange Report (AIIR) produced by the Federal Highway Administration (FHWA), identifies several potential configurations, including guidance on geometric design, and to some extent operational analysis. The Cap-X tool produced by FHWA even allows a high-level operational assessment of various intersection and interchange forms through a methodology based on critical movement analysis. But while that tool is useful in a planning context, there currently exist no detailed analytical methods for evaluating and predicting the operational performance of alternative intersections and interchanges. As a result, many analysts turn to microscopic traffic simulation an analysis approach that is widely recognized to require careful calibration and validation to result in realistic performance estimates. Among the alternative intersection and interchanges, the Double-Crossover Diamond Interchange (DCD), also referred to as a Diverging Diamond Interchange (DDI), has become increasingly popular as a cost-effective treatment to replace over-capacity diamond interchanges. The DCD is able to process interchange traffic very efficiently, especially for locations with high left-turn demands to and from the freeway. The operational benefit of the DCD is rooted in a direction crossover of the mainline traffic of the arterial street, that switches through and left-turning traffic from the right to the left side in advance of the interchange (right turns veer off before the crossover). After the switch, left-turn traffic from the freeway, and left-turn traffic to the freeway are able to move through the interchange using a simple twophase signal and a free-flow movement, respectively. This operational benefit, combined with high costeffectiveness of the DCD (stemming largely from the ability to use existing bridge structures in most cases), have resulted in increased adoption of the DCD design in the US. At the time of this writing, over a dozen DCDs have already been constructed, with many dozens more in the planning, design, and construction stages. Due to the unique geometric configuration of the DCD, and unconventional signal timing and traffic patterns, traditional analysis methods like those in the Highway Capacity Manual presently do not allow for the evaluation of DCDs. Consequently, many analysts have turned to microsimulation to predict the operations of new and planned DCDs, but generally without the ability to collect field data at this very recent interchange configuration. As a result, most simulation analyses lack detailed calibration and validation with empirical data. This paper presents a detailed calibration and validation approach to replicate the field-measured performance of four operational DCDs in the United States. BACKGROUND AND LITERATURE The DCD was first introduced in the U.S. by Chlewicki, who published the idea of the Double Crossover Diamond (DCD) interchange, which he called the diverging diamond interchange at the time (). In a Synchro macroscopic evaluation, he found that the DCD was superior in operations to the conventional diamond, producing, for example, second average delay per vehicle, compared to 0 seconds for a conventional diamond (). Since that first introduction, the DCD has gathered significant attention and research, including driver perception and human factors studies (), and (limited) design guidance in the Alternative Intersections/Interchanges Informational Report ().
4 0 0 0 While the initial deterministic analysis approach in () proved feasible to some extent, it was soon recognized that simulation tools may be more appropriate for DCD evaluation; at least until a formally established method becomes available. The signalized intersection methodologies in the Highway Capacity Manual (HCM) () are largely intended for isolated intersections, and are not suitable for the DCD design. While the new urban streets procedures in the 00 HCM () allow the analyst to better estimate progression effects between adjacent intersections, the methods fall short of explicitly estimating the dynamic traffic patterns at the DCD. The HCM recognizes its limitations and refers to the use of alternative (simulation) tools to truly estimate these dynamic impacts (). Potential operational characteristics at the DCD not handled by HCM methodologies include: Queuing on the links between the two cross-over signals, Demand starvation at signalized approaches leaving the DCD, Queue blockage of left-turn on-ramp movements on shared lanes, Impact of reverse curves on speed patterns and progression, The presence of pedestrian movements, and especially unsignalized pedestrian crossings at the channelized lanes at the DCD, The presence of on-street bicycle movements, or The interaction between freeway and arterial traffic with potential queue spillback effects. In addition to improved operational evaluation, a simulation analysis provides four-dimensional visualization of traffic patterns and roadway geometry, an invaluable asset for communicating operations and geometry of the relatively new DCD configuration to a non-technical stakeholder audience. Consequently, a variety of studies have applied simulation to DCD evaluation. Bared, et al. () and Edara, et al. () conducted a more extensive VISSIM simulation-based evaluation of the DCD and predicted similar operational benefits over the traditional diamond. Their research showed that the DCD was far better at the higher levels of demand than the simple diamond. A few researches attempted to model the operations of DCD in microsimulation software. Maji et al. () used VISSIM to compare the capacity and level of service analyses of DCD from VISSIM with Critical Lane Volume (CLV) methodology. They applied both CLV method and VISSIM simulation to evaluate a possible DCD at I- 0 and MD in Maryland. Maji et al. found that in addition to CLV methodology, a calibrated simulation model is needed for a detail traffic and operations analysis of DCD (). It is recognized that a simulation analysis requires a well-calibrated and validated model to give confidence in the validity of the simulated traffic patterns. Resources including the FHWA traffic analysis toolbox () provide guidance to analysts for using simulation tools and emphasize calibration as a critical modeling component. What constitutes a perfectly calibrated model is still the subject of much debate in the simulation modeling community. Perhaps the most appropriate way to express whether a simulation model has been properly calibrated is through an error probability function as proposed by Bayyari et al (0) and Sacks et al (): Pr. ( Field MOE- Simulation MOE < α) β. Equation Where: α represents a tolerable error threshold and β the desired confidence level.
5 0 0 0 Thus for example one can declare a micro-simulation model successfully calibrated if there is at least a 0% probability that the mean speed difference between the field measurement and simulation model estimate is less than mph. Additional detail on methods for calibration are described in literature sources (,, and ) and are also stressed in a forthcoming chapter on simulation studies in the ITE Manual of Transportation Studies (MTS) (). That source describes recommended data items for calibration and validation and links those to empirical field data collection methods discussed throughout the MTS. Since DCD interchanges are still relatively new in the U.S., the availability of detailed field data for DCD evaluation is limited. As a result, noticeable knowledge gaps related to DCD operations and simulation exist, including:. Some of the research on operations has used a small set of demand scenarios, non-simulation traffic modeling, or suboptimal signal timing.. None of the simulation studies of the DCD conducted to this point has been able to use a model calibrated to DCD field conditions. OBJECTIVE AND SCOPE The objective of this paper is to present an approach for calibrating the operational performance of DCD interchanges in microsimulation, and to validate key performance measures from empirical data collected at four DCD interchanges in the U.S. The paper illustrates key configurations when setting up a simulation model for DCDs and aims to demonstrate that an acceptable validation match can be obtained in the simulation. The simulation tool VISSIM () was used for all analyses, although other tools are available to perform similar analyses. The team selected VISSIM for this project because its link-connector structure allows a great degree of flexibility in network coding. Node-based simulation tools are likely less appropriate for DCD modeling since the crossover nodes do not fit within the standard intersection paradigm. However, no claims are made here that VISSIM is the only viable simulation analysis tool for DCDs, nor that node-based simulators cannot be adapted to work with the DCD design. This paper is not intended to explore and test operational improvements of the DCD interchange through modified geometry, signal timing, etc. It is also not within the scope of this paper to compare the DCD configuration to alternative interchange forms. The modeling was applied to a total of four DCD interchanges, which are shown in Figure.. The Bessemer Street at US DCD in Alcoa, TN is an underpass interchange with a threelane arterial street cross-section. The Missouri- at Interstate- DCD in Springfield, MO is an overpass interchange with a four-lane arterial street cross-section.. The National Avenue at US-0 DCD in Springfield, MO is an overpass interchange with a six-lane arterial street cross-section.. The Dorsett Road at Interstate I-0 DCD in Maryland Heights, MO is an underpass interchange with a five-lane arterial street cross-section
")


6 a) Bessemer Street, Alcoa, TN b) MO,Springfield, MO c) National Ave., Springfield, MO d) Dorsett Rd., Maryland Heights, MO Figure : VISSIM Screenshots of the Four DCD Models
7 0 0 0 CALIBRATION AND VALIDATION APPROACH This section describes the general calibration and validation approach for the four DCD interchanges in VISSIM. For the purpose of this discussion, calibration refers to modification of inputs into the simulation tool, while validation refers to the verification of simulation outputs with field-observed performance measures. Calibration Factors The key calibration factors that serve as inputs into the simulation are:. Origin-Destination volumes at the DCD interchange and adjacent signals;. Look-Back Distances from route decision points to control lane positioning;. Field-measured free-flow speeds through the DCD interchange, as well as geometricallyconstrained free-flow speeds at the crossover and for turning movements; and. Field-implemented signal timing schemes as obtained from field controller settings at the DCD and adjacent signals. Interchange O/D route percentages can be estimated relatively easily from turning movement counts at the two cross-over signals, if the percentage of interchange U-turns is known (or assumed to be zero). If the analyst choses to include adjacent signals in the evaluation of the DCD (which is desirable), it is preferable to estimate a global O/D matrix of the entire corridor. Synthesizing an O/D matrix to include adjacent intersections can be more cumbersome, but may be approximated by assuming a proportional allocation of the volumes of an upstream origin to all downstream destination. In the case of VISSIM, the combine routes can be used to accomplish this, or alternatively, the O/D may be estimated externally to the simulation. Figure -a illustrates the concept of O/D routing for the Dorsett Road DCD showing O/D pairs to cover the DCD interchange and adjacent signals along the arterial street. In addition to the O/D volume and routing set-up, many simulation tools employ the concept of a look-back distance, which is the distance upstream from a diverge point at which simulated vehicles are affected by the diverge and initiate any necessary lane changes. In VISSIM, this is referred to as the Lane Change Distance (LCD). In field observations of DCD interchanges it was frequently observed that drivers pre-position themselves well in advance of the DCD interchange for downstream turning movement. This phenomenon was especially pronounced for left-turning movements from arterial to freeway, where the lane utilization at upstream signal was highly impacted by downstream turning percentages. Consequently the look-back distance for these movements needs to be specified in a way that it extends through the upstream signals. Figure -b illustrates the look-back distance concept for the Dorsett Road DCD.


8 a) VISSIM O/D Set-Up for Vehicle Routing 0 b) Concept of Look-Back Distance in Simulation Figure VISSIM Volume and Routing Settings For calibration, speeds at DCD crossovers were observed to be well below the free-flow speeds on tangent sections of the arterial. It is therefore recommended to use speed reduction zones to control freeflow speed at critical segments through the DCD. Table shows the calibrated speed control decisions used at the crossover, as well as turning movements at the four modeled interchanges. Notice that the speed at the segment between crossovers has also been observed to be less than the speed limit. All speed distributions were modeled as normal distributions in VISSIM.

9 0 Table Field-Measured Speed Parameters for DCD Sites Crossover Speed (mph) Turning Speed (mph) Bridge Speed (mph) Interchange Avg. StdDev. Avg. StdDev. Avg. StdDev. MO National Ave Bessemer St Dorsett Rd Accurate speed modeling is especially important for newly-opened DCDs, where drivers may not yet be comfortable with the geometry. The (free-flow) speed inputs are considered the key differentiating factor between models for the transition and after periods (in addition to potential work zone friction in transition, and signal timing adjustments in the after period). To accurately model signalized control of the DCD interchange, the analyst needs to explore whether the interchange is modeled with one versus two controllers. The selected tool should employ signal control logic that is flexible enough to allow modeling of two-controller two-phase signal control, as well as four phases on a single controller. Figure shows a standard coding scheme of the DCD with eight phases, which can be implemented in the field with one or two controllers. In addition to the eight numbered phases, the diagram shows four overlap phases as letters A through F. These overlaps are used to tie together multiple phases (e.g. overlap A corresponds to phases plus ). Figure Eight-Phase DCD Timing Scheme with Four Overlaps at National Ave. site
10 0 0 The signal phasing shown in Figure can work within an actuated-coordinated scheme if two controllers are used, and coordination offsets can be manipulated separately at each controller. If a single controller is used in the phasing scheme in Figure, the signal typically runs pre-timed to assure proper progression through the interchange. Alternatively, the DCD can use a single controller, but employ overlap phases to implement a relative offset between the two crossover signals. The controller offset is then used to coordinate the DCD with adjacent signals. The team further observed simpler single-ring configurations, as well as more complicated four-ring configurations. Validation Parameters The three key validation parameters used in this evaluation are:. Interchange travel times, as defined by travel time segments through the two DCD signals (through routes), as well as left-turning routes through the DCD (to and from the freeway);. Route travel times, as defined by travel time segments through the DCD and adjacent signals for through movements, left-turns from freeway to arterial, and left turns from arterial to freeway; and. Comparison of average and th percentile queue lengths, estimated from maximum queue lengths on a per-cycle basis. The interchange travel time includes the two DCD signals and any queues immediately upstream of the DCD. The route travel time segments include at a minimum the adjacent signals upstream and downstream of the DCD. For left turn routes, the travel time segments start or end at the top of the freeway off-ramp or on-ramp, respectively. The travel time data were collected from extensive travel time runs during field visits to all four DCD interchanges. For all runs, a floating car technique was employed to assure the travel time vehicle is representative travel stream. For the queue measurements, cycle-by-cycle queues were observed through manual observation in the field on a per-lane basis. The detailed operational results of the field studies at these four DCDs are documented in (). A summary of field-measured travel times for the longer route travel times for the through routes, including a listing of sample size, is shown in Table. It is noted that the corresponding sample size for the left-turn movements is approximately half that of the through routes. Table Field-Measured Route Travel Time Summary for Through Movements AM Peak Period (sec) PM Peak Period (sec) Interchange Movement Avg. StdDev. n Avg. StdDev. n MO- South to North North to South National Ave South to North..0.. North to South Bessemer St East to West.... West to East.0... Dorsett Rd East to West.... West to East.... 0
11 0 MODELING RESULTS This section presents the VISSIM modeling results and a comparison of the modeling results to fieldobserved data. Table, Table, and Table summarize the results for the three validation performance measures across all sites, in terms of the percent difference of VISSIM minus field data, relative to the field-observed data. A negative percent difference thus corresponds to a lower estimate in VISSIM relative to the field. Interchange Travel Times The interchange route results in Table show some routes and sites with a very close match with less than 0% error, while other errors are higher. While these differences may seem higher than more commonly-accepted calibration targets in the -0% range, it should be considered that the interchange routes are relatively short, resulting in potential large percent difference despite small absolute differences. It should also be noted that these short travel times are highly dependent on vehicle arrivals in red vs. green phases. At the DCD interchanges, which are typically part of a coordinated signal system, travel times for arrivals in green can be significantly shorter than travel times in red. Table Interchange Travel Time Segment Summary Bessemer St. MO Movement AM PM AM PM Through S-N / E-W % % % % Route N-S / W-E -% % -% 0% Left from Arterial Left from Freeway S-W / E-S % % % -% N-E / W-N -% % % % W-N / N-E -% -% % % E-S / S-W % % % % 0 National Ave. Dorsett Road Movement AM PM AM PM Through S-N / E-W -% -% % % Route N-S / W-E -% % % % Left from Arterial Left from Freeway S-W / E-S -% % -% % N-E / W-N % % % -% W-N / N-E 0% -% % -% E-S / S-W -% % -% 0% For the simulation results, it can be expected that the travel time observations include an adequate sample of both arrival types proportional to the effective green to cycle length ratio (g/c) on the DCD approach. However, for the much smaller field sample size, it is more likely that a truly representative sample was not obtained. 0
12 Route Travel Times In the second validation exercise, the short interchange travel times were expanded to include the adjacent intersections upstream and downstream of the DCD. It is generally expected that the validation results would be improved for longer routes, which is evident in the results shown in Table. Table Route Travel Time Segment Summary Bessemer St. MO Movement AM PM AM PM Through S-N / E-W % % -% % Route N-S / W-E -% -% -% -% Left from S-W / E-S % -% 0% -% Arterial N-E / W-N % % % % Left from Freeway W-N / N-E -% % -0% -% E-S / S-W -0% -% % % 0 National Ave. Dorsett Road Movement AM PM AM PM Through S-N / E-W -% -% % -% Route N-S / W-E -% % % % Left from S-W / E-S % % -% -% Arterial N-E / W-N 0% -% -% -% Left from Freeway W-N / N-E % 0% % % E-S / S-W % -% % -% The results of the longer route travel times generally show a much improved match between VISSIM and field data. This is expected because cycle-by-cycle arrival patterns and low sample sizes are likely to have less of an impact across a larger distance. Especially the through travel time routes show a match within 0% for ten scenarios across the four sites, with five additional scenarios having less than 0% error, and the highest error being only %. For the left turns, most of the scenarios showed an error within %, with only five scenarios having a larger error. In fact, 0 of the left turns had an error less than %. These results show a lot of promise that simulation can be used to evaluate and predict the performance of DCD interchanges in a corridor context. Figure shows bar chart comparison of the VISSIM vs. Field route travel time comparison for all movements at all four sites. The bar charts show the average route travel times, as well as error bars drawn at one standard error. The standard error is defined as the standard deviation divided by the square root of the sample size, and is used to show both negative and positive variation about the means.

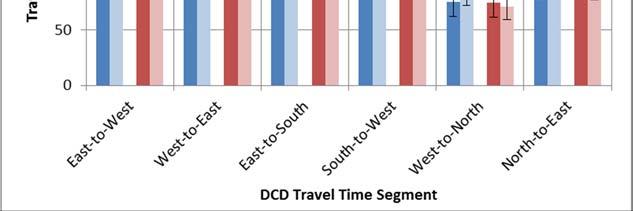
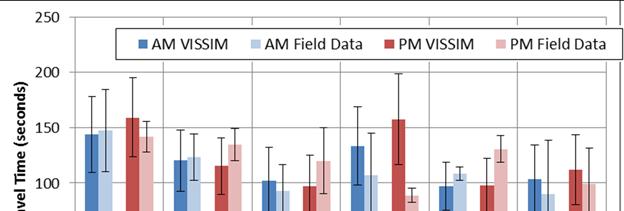
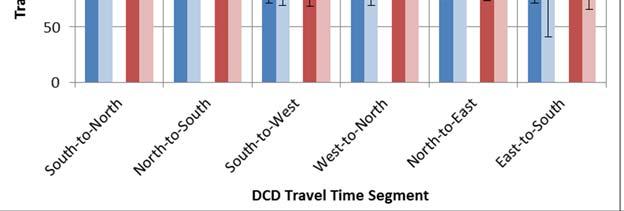
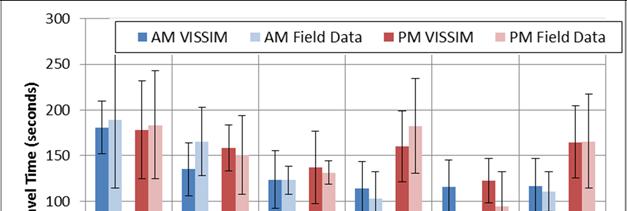
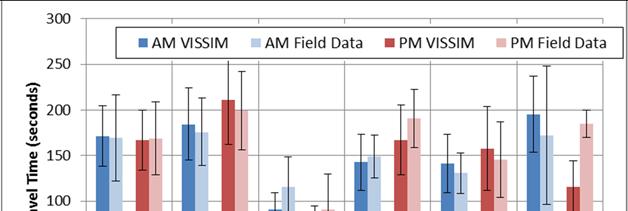
13 a) Bessemer Street, Alcoa, TN b) MO,Springfield, MO c) National Ave., Springfield, MO d) Dorsett Rd., Maryland Heights, MO Figure : Route Travel Time Comparison
14 0 0 0 Figure shows for Bessemer Street that the route travel times for all simulated routes match the fieldobserved average within 0% or better. In fact, several routes match within 0% difference in means with the field data. For MO, the route travel time estimates show a match within % for all except one route between VISSIM and field-observed data. The one outlier is a yield-controlled movement of the west-to-north left turn from freeway to arterial, which showed very low delay in the (low sample) field data, as drivers happened to arrive during times with little opposing flows. For National Avenue the biggest error is evident for the north-to-east left turn onto the freeway, which shows % and 0% error in the AM and PM peak, respectively. A clear challenge in the left-turn analysis is the sample size, which in this case only showed three travel time runs in the AM Peak period for the north-to-east movement, and four runs in the PM peak. For comparison, the field sample size for the PM peak through routes was and observations for the northbound and southbound movements, respectively. For the through routes on the arterial, the VISSIM travel times match within % error. Finally, for the Dorsett Road the route travel times show a close match with field data. The through travel times match the field observations within less than 0% error, with most turning movements showing less than % error. The exception is the north-to-east movement described above, but even here the error is contained to % and % in AM and PM peak, respectively. Queue Validation The final data element gave a look at queuing patterns. Queue lengths are a very challenging metric to validate because (a) field measured vehicle queues need to be compared to distance-based queues (in feet) from simulation, (b) queue lengths are highly sensitive to arrival patterns, progression, and random variation in traffic, and (c) queue lengths are expected to show high variability across the peak hour. In an effort to overcome the first challenge, the field-observed vehicle queues were multiplied by an assumed spacing of. feet per vehicle to convert the queue-length to an approximate distance in feet. That assumed spacing corresponds to the car-following setting used in VISSIM, and specifically the stand-still vehicle spacing. The other two issues are more challenging to overcome. All three considerations are likely explanations for observed differences in queue length estimates from field study and simulation, which are summarized in Table for the th percentile cycle-by-cycle queue lengths. The VISSIM estimated queue lengths are in most cases lower than the corresponding field data with an average difference of 0 to 0% less than field-observed data. The authors attribute the majority of these differences to definitional discrepancy between field queues and observations gathered from VISSIM, and generally places less weight on these results than the travel time findings. For reasons mentioned above, queue lengths are generally very difficult to validate, and the definition differences are recognized by national guidance documents like the 00 Highway Capacity Manual.
15 0 0 Table th percentile Queue Length Results Summary Bessemer St. MO Movement AM PM AM PM West/North Inbound 0% % -% -% West/North Outbound -% % -% % East/South Inbound -% -% -% -% East/South Outbound % -% -% -% National Ave. Dorsett Road Movement AM PM AM PM West/North Inbound -% -% -% -% West/North Outbound -% -% -% -% East/South Inbound -% -% -% -% East/South Outbound -0% -% -% -% DISCUSSION Model Inputs and Set-Up One of the biggest challenges with simulation studies in general is the set-up of the base network and accumulation of all necessary inputs. With VISSIM s link-connector structure and the availability of high-resolution aerial photographs, drawing the DCD network proved to be a very straightforward activity, with only few obstacles encountered. The simulation tool was readily used to replicate the crossover geometry and all turning movements. One minor challenge was related to the geometry of the various lane adds and drops at the DCD signals, where links needed to be coded as wide segments that include through and turning lanes, to assure that lane changes could happen across an extended distance. In other words, the merge and diverge lanes on the arterial were coded consistent with VISSIM guidance on how to code freeway merge and diverge areas. This practice proved to be important in replicating field observations, and is preferred over coding exclusive left-turn lanes as separate links from through traffic, which would have limited merging behavior to a single (connector) point. For modeling speed inputs into VISSIM, the team relied on its extensive field data collection effort, and had at its disposal detailed free-flow speed measurements for turning movements, through the DCD crossovers, and between the two DCD intersections, which proved to be critically-important inputs into the simulation. The team also collected Origin-Destination turning movement counts, which proved essential in coding DCD volume inputs. A challenge related to volume input originated from the adjacent signals, and the need to include their turning movement counts in a synthesized O/D matrix for the entire modeled corridor. From field observations it was evident that drivers pre-positioned well in advance of the DCD turns, which required routing information to be provided well in advance to the simulated vehicles. The team expects that it will be very difficult to adequately replicate DCD operations in a simulator tool that is
16 0 0 0 limited to node-based routing. The overall O/D estimation proved straightforward with VISSIM s built-in combine routes feature; although an external matrix estimation tool could have been used as well. The use of O/D routing, as well as long lane-change distance settings was important to replicate fieldobserved unbalanced lane utilization at the external DCD signals. Even though no formal analysis of lane utilization was performed, the team confirmed traffic patterns through visual calibration. One challenging aspect in coding the DCD interchanges was replicating the at times complicated signal control strategies of the DCDs, which use various combinations of rings, barriers, overlap phases, and dummy phases. With its Ring-Barrier-Controller (RBC), VISSIM could readily be used to replicate all four DCD timing schemes despite their differences. While all four DCDs operated on a single controller, the phasing scheme ranged from a single ring with five phases (two overlaps) to a four-ring design with fourteen phases. Other than an initial learning curve in understanding the four different signalization schemes, VISSIM s RBC controller correctly replicated field controller settings. Overall, the VISSIM input and coding process proved highly effective and accurate in replicating the unique geometric, operational, and signal timing parameters observed at the four DCD interchanges. Calibration and Validation Lessons Learned The team had at its disposal a detailed and comprehensive field data set consisting of extensive field GPS travel time runs, as well as cycle-by-cycle back-of-queue measurements. But while the field data was much richer than for many previous attempts at validating DCD VISSIM models, it also proved to be very challenging in designing an apples to apples comparison between simulation and field data. One key challenge for travel time runs was to reconcile differences of one-hour VISSIM simulation results over ten iterations with every vehicle delivering one data point, with more sporadic GPS data collected over multiple peak hours over multiple days. For example, while the team assured an adequate sample size of field runs for a peak period, the actual time stamps for the GPS runs oftentimes covered multiple hours in the morning peak, while VISSIM was used only to model the 0-minute peak (plus a warm-up period). The team was therefore faced with tradeoffs between having a homogeneous (shortduration) data set, versus assuring an adequate sample size of field travel time runs. Ultimately, the team decided to focus its analysis on a two-hour peak period, and place higher emphasis on the standard deviation and confidence intervals of both VISSIM and field travel time data. The results generally showed a better match for the through routes, which the team attributes to a large extent to a larger sample size for those movements. For left-turn routes, smaller sample sizes proved to be biased by coincidental arrival patterns, where for example the GPS trajectories from the freeway happened to arrive at the DCD left turn always during green, while VISSIM showed the full distribution of arrivals in red and green. The challenge of arrival patterns and relatively small sample size proved most challenging for the shorter interchange segments, and it proved difficult to reconcile highly variable travel time results across short routes that are highly sensitive to arrivals in red versus green. Nonetheless, the interchange travel times showed acceptable performance across most scenarios. For the longer route travel time, the validation effort proved to generate significantly matches with field data.
17 0 0 0 For queue data, queue measurements in simulation versus field data are difficult to compare as documented in the HCM00 and elsewhere, as definitions, aggregation intervals, and data units differ across the two. Further, queues are generally considered a challenging validation metric, because of very high variability and a high sensitivity to changing arrival patterns from cycle to cycle. Despite these challenges, the simulated queue results of average and th percentile back-of-queue proved to be within an order of magnitude of the field-observed results. The error was generally negative, to where actual queues were 0-0% larger than the simulation results. This error is larger than for other performance measures, but is at least partly attributed to definitional differences in queue measurements, where fieldmeasurements are taken in vehicles, while VISSIM provides queue length in feet. The field measurements were converted by assuming an average vehicle spacing of. feet per VISSIM settings. But if field vehicle spacing in queues was closer to say 0 feet, or if larger vehicles were common in the field, the resulting error would be much reduced. CONCLUSION This paper presents calibration and validation results for modeling Double-Crossover Diamond (DCD) interchanges in a microsimulation environment. The results show that the operations of DCDs can largely be replicated in a simulation environment, but that care needs to be taken in properly setting speed and routing decisions throughout the DCD network. The analysis further showed that validation is more readily achieved over an extended route analysis, with increasing difficulties for short segment validation. The validation of field-measured queues proved challenging due to definitional differences between simulated and field study results. While simulation models of DCDs have been plentiful, this is the first source with detailed field data and validation across multiple sites, movements, time periods, and performance measures. From these results, the team proposes to focus the validation activities for DCDs on travel time estimates, with a preference to longer routes when possible. Any field data collection needs to assure a sufficient sample size of travel time data, and should consider that the simulated volumes are often representative of only one hour of observation. Consequently, travel times may need to be measured within the same hour over multiple days, rather than over a multi-hour period on one observation day. Model volume inputs should be based on origins and destinations at the model perimeter, and routes should be configured across the network (rather than node-based routing). The analysis further recommends coding approaches to the DCDs as wide multi-lane segments, similar to freeway merge/diverge areas, to allow free lane selection by drivers. The corresponding look-back distances for lane-changes also need to be calibrated carefully to mirror imbalanced lane utilization in the approach of the first crossover. In closing, this paper demonstrated the ability of VISSIM to model DCD interchanges, and replicate field-observed performance for the most part. The modeling guidance and lessons learned from this paper are considered to be very important for analysts hoping to model the DCD in a simulation environment, as many nuances of DCD performance are not necessarily represented correctly without careful set-up of the various model parameters.
18 ACKNOWLEDGMENT The study on which this paper is based was funded by the Federal Highway Administration. The authors would like to thank FHWA for their support throughout this project, along with the cities of Alcoa, TN, Springfield, MO, and Maryland Heights, MO for their support and assistance in data collection. All opinions expressed in this paper are the views of the authors, and do not represent the official views of FHWA. REFERENCES. Chlewicki, G. L., New Interchange and Intersection Designs: The Synchronized Split- Phasing Intersection and the Diverging Diamond Interchange, nd Urban Street Symposium, TRB, Anaheim, CA, 00.. FHWA, Drivers Evaluation of the Diverging Diamond Interchange, Tech Brief, FHWA- HRT-0-0, McLean, VA, 00.. Hughes, W., R. Jagannathan, D. Sengupta, and J. Hummer, Alternative Intersections/ Interchanges: Informational Report, FHWA-HRT-0-00, Washington, DC, April 00.. TRB (00). Highway Capacity Manual, HCM00. Washington, D.C., 00. Courage, K. (00). NCHRP Project 0-: Guidance on the Use of Alternative Traffic Analysis Tools in Highway Capacity Analyses. Washington, D.C.: Transportation Research Board.. Bared, J.G., P.K. Edara, and R. Jagannathan, Design and Operational Performance of Double Crossover Intersection and Diverging Diamond Interchange, Transportation Research Record, 00.. Edara, P. K., J. G. Bared, and R. Jagannathan, Diverging Diamond Interchange and Double Crossover Intersection Vehicle and Pedestrian Performance, rd International Symposium on Highway Geometric Design, Chicago, IL, June 00.. Maji, Avijit; Mishra, Sabyasachee; Jha, Manoj K. Critical Lane Volume (CLV)-based Capacity and Level of Service Analyses for Diverging Diamond Interchange. Transportation Research Board nd Annual Meeting;0, p. Dowling, R. S. (00). Traffic Analysis Toolbox Volume III: Guidelines for Applying Traffic Microsimulation Modeling Software. Washington, D.C.: Federal Highway Administration. 0. Bayarri, M., J. Berger, G. Molina, N. Rouphail and J. Sacks (00), Assessing Uncertainties in Traffic Simulation: Key Component in Model Calibration & Validation, Transportation Research Record,pp.-0. Sacks, J., N. Rouphail, B. Park and P. Thakhuriah (00), Statistically-Based Validation of Computer Simulation Models in Traffic Operations and Management, Journal of Transportation and Statistics, Vol. (), pp.-.. Zhang, M. &. (00-a). Developing Calibration Tools for Microscopic Traffic Simulation Final Report Part : Overview Methods and Guidelines on Project Scoping and Data Collection. Berkely, CA: Partners for Advanced Transit and Highways (PATH) Working Paper; California Department of Transportation.
19 0. Zhang, M. M. (00-b). Developing Calibration Tools for Microscopic Traffic Simulation Final Report Part II: Calibration Framework and Calibration of Local/Global Driving Behavior and Departure/Route Choice Model Parameters. Berkely, CA: Partners for Advanced Transit and Highways (PATH); University of California; California Department of Transportation.. Zhang, M. M. (00-c). Developing Calibration Tools for Microscopic Traffic Simulation Final Report Part III: Global Calibration - O/D/ Estimation, Traffic Signal Enhancement and a Case Study. Berkely, CA: Partners for Advanced Transit and Highways (PATH); University of California; California Department of Transportation.. Schroeder et al. (0). Manual of Transportation Studies (MTS) nd Edition. Institute of Transportation Engineers. Washington, D.C.. PTV America, VISSIM.0 User Manual, PTV America. 00. Vaughan, Chris, Chris Cunningham, Bastian Schroeder, and Joseph Hummer. Empirical Study and Assessment of the Operational Performance of Double Crossover Diamond Interchanges. TRB 0 Annual Meeting. Washington, D.C.
The Folded Interchange: An Unconventional Design for the Reconstruction of Cloverleaf Interchanges
 The Folded Interchange: An Unconventional Design for the Reconstruction of Cloverleaf Interchanges I. ABSTRACT Keith A. Riniker, PE, PTOE This paper presents the Folded Interchange design and compares
The Secrets to HCM Consistency Using Simulation Models
 The Secrets to HCM Consistency Using Simulation Models Ronald T. Milam, AICP David Stanek, PE Chris Breiland Fehr & Peers 2990 Lava Ridge Court, Suite 200 Roseville, CA 95661 r.milam@fehrandpeers.com (916)
The New Highway Capacity Manual 6 th Edition It s Not Your Father s HCM
 The New Highway Capacity Manual 6 th Edition It s Not Your Father s HCM Tom Creasey, PE, PhD Principal, Stantec Consulting Services Inc. Chair, TRB Highway Capacity and Quality of Service Committee Presented
OPTIMIZING RAMP METERING STRATEGIES
 OPTIMIZING RAMP METERING STRATEGIES Presented by Kouros Mohammadian, Ph.D. Saurav Chakrabarti. ITS Midwest Annual Meeting Chicago, Illinois February 7, 2006 Background Ramp control is the application of
New HCM Chapter(s)/ Alternative Intersections/Interchanges
/ Alternative Intersections/Interchanges") SAXTON TRANSPORTATION LABORATORY New HCM Chapter(s)/ Alternative Intersections/Interchanges 2010 HCM Major Update July 2014 Project Vision and Goals To develop HCM analysis procedures for evaluating capacity
SAXTON TRANSPORTATION LABORATORY New HCM Chapter(s)/ Alternative Intersections/Interchanges 2010 HCM Major Update July 2014 Project Vision and Goals To develop HCM analysis procedures for evaluating capacity
Conclusions & Lessons Learned
 What is a DDI Recommended Practices Traffic Operations Analysis Geometric Design FHWA Review Conclusions & Lessons Learned It s not about you, it s about the public Developed by Access Utah County
INSIGHTS INTO THE FIRST THREE DIVERGING DIAMOND INTERCHANGES IN MISSOURI. A Thesis presented to. the Faculty of the Graduate School
 INSIGHTS INTO THE FIRST THREE DIVERGING DIAMOND INTERCHANGES IN MISSOURI A Thesis presented to the Faculty of the Graduate School at the University of Missouri In Partial Fulfillment of the Requirements
Comparing Roundabout Capacity Analysis Methods, or How the Selection of Analysis Method Can Affect the Design
 Comparing Roundabout Capacity Analysis Methods, or How the Selection of Analysis Method Can Affect the Design ABSTRACT Several analysis methods have been proposed to analyze the vehicular capacity of roundabouts.
Volume to Capacity Estimation of Signalized Road Networks for Metropolitan Transportation Planning. Hiron Fernando, BSCE. A Thesis CIVIL ENGINEERING
 Volume to Capacity Estimation of Signalized Road Networks for Metropolitan Transportation Planning by Hiron Fernando, BSCE A Thesis In CIVIL ENGINEERING Submitted to the Graduate Faculty of Texas Tech
Woodburn Interchange Project Transportation Technical Report
 Final Report Woodburn Interchange Project Transportation Technical Report Prepared for Oregon Department of Transportation April 212 Prepared by DKS Associates Contents Methodologies... 4 Volume Development...
APPENDIX B. Public Works and Development Engineering Services Division Guidelines for Traffic Impact Studies
 APPENDIX B Public Works and Development Engineering Services Division Guidelines for Traffic Impact Studies Revised December 7, 2010 via Resolution # 100991 Reformatted March 18, 2011 TABLE OF CONTENTS
ASSESSING THE IMPACT OF SECURITY MEASURES AT GATES OF SEAPORTS ON TRAFFIC OPERATION
 ASSESSING THE IMPACT OF SECURITY MEASURES AT GATES OF SEAPORTS ON TRAFFIC OPERATION Dr. Arun Chatterjee Professor Emeritus Dept of Civil & Environmental Engineering The University of Tennessee Knoxville,
EVALUATION OF INCIDENT MANAGEMENT BENEFITS USING TRAFFIC SIMULATION
 EVALUATION OF INCIDENT MANAGEMENT BENEFITS USING TRAFFIC SIMULATION Hussein Dia and Nick Cottman Department of Civil Engineering The University of Queensland Brisbane, Australia 4072 E-mail: H.Dia@uq.edu.au
Origin-Destination Trips and Skims Matrices
 Origin-Destination Trips and Skims Matrices presented by César A. Segovia, AICP Senior Transportation Planner AECOM September 17, 2015 Today s Webinar Content Matrix Estimation Data sources Florida Application
CITY OF CLOVIS Traffic Impact Study Guidelines
 CITY OF CLOVIS Traffic Impact Study Guidelines CLOVIS, A WAY OF LIFE Approved August 25, 2014 City Council Resolution 2014-79 Prepared by City of Clovis Engineering Division Steve White, City Engineer
A Unique Application of Railroad Preemption with Queue Mitigation at a Roundabout Interchange
 A Unique Application of Railroad Preemption with Queue Mitigation at a Roundabout Interchange Jeromy Grenard, PE, PTOE American Structurepoint Hardik Shah, PE, PTOE American Structurepoint Roundabouts
CHAPTER 4 GRADE SEPARATIONS AND INTERCHANGES
 CHAPTER 4 GRADE SEPARATIONS AND INTERCHANGES 4.0 INTRODUCTION The ability to accommodate high volumes of intersecting traffic safely and efficiently through the arrangement of one or more interconnecting
DEVELOPMENT, ANALYSIS, AND DESIGN OF A NEW PARKWAY AT GRADE INTERSECTION (PAGI)
") 2013 ITE Western District Annual Meeting COCEPT DEVELOPMET, AALYSIS, AD DESIG OF A EW PARKWAY AT GRADE ITERSECTIO (PAGI) Lead Author: James M. Witkowski, PhD Supporting Author: Darrell Truitt, PE The Pima
2013 ITE Western District Annual Meeting COCEPT DEVELOPMET, AALYSIS, AD DESIG OF A EW PARKWAY AT GRADE ITERSECTIO (PAGI) Lead Author: James M. Witkowski, PhD Supporting Author: Darrell Truitt, PE The Pima
Development of TSP warrants. to-day variability in traffic demand
 Development of TSP warrants considering vehicular emissions and day-to to-day variability in traffic demand Zeeshan Abdy Supervisor: Bruce R. Hellinga Dec 2006 Introduction Signalized intersections Traffic
Appendix D: Functional Classification Criteria and Characteristics, and MnDOT Access Guidance
 APPENDICES Appendix D: Functional Classification Criteria and Characteristics, and MnDOT Access Guidance D.1 Functional classification identifies the role a highway or street plays in the transportation
Past, Present, and Future
 The Highway Capacity Manual: Past, Present, and Future HCM Chronology 1 st Ed.: 1950 BPR/HRB/GPO (147 Pgs) 1957 Highway Research Board Bulletin 167 2 nd Ed: 1965 TRB Special Report 87 (411 pgs) 1980 TRB
LAS VEGAS STREET RAILROAD CROSSING RR/PUC CONNECTION AND PRELIMINARY DESIGN
 LAS VEGAS STREET RAILROAD CROSSING RR/PUC CONNECTION AND PRELIMINARY DESIGN Prepared for: City of Colorado Springs Prepared by: Felsburg Holt & Ullevig 508 South Tejon Street Colorado Springs, CO 80903
Stage One Reference Design Enhancements. Date: 2 October Cabinet-in-Confidence
 Stage One Reference Design Enhancements Date: 2 October 2013 Introduction This paper provides further information regarding the proposed enhancements to the Reference Design that have been identified since
MULTIMODAL TRANSPORTATION IMPACT STUDY GUIDELINES
 MULTIMODAL TRANSPORTATION IMPACT STUDY GUIDELINES 1 st Edition City of San Luis Obispo 2035 Circulation Element 1 Table of Contents Introduction... 2 Process... 2 When Impact Studies Are Required... 3
Apply DynusT Model for Incident Management along Loop 101 Corridor
 Apply DynusT Model for Incident Management along Loop 101 Corridor Lili(Leo) Luo, P.E. ITS/Safety Engineer Sarath Joshua, P.E. ITS/Safety Program Manager What do Transportation Models do? Help us answer
REQUIREMENTS FOR THE CALIBRATION OF TRAFFIC SIMULATION MODELS
 REQUIREMENTS FOR THE CALIBRATION OF TRAFFIC SIMULATION MODELS Bruce R. Hellinga Department of Civil Engineering University of Waterloo Waterloo, ON N2L 3G1 ABSTRACT The recent emphasis on utilising advanced
Comparison of Queue Lengths Estimations at AWSC Intersections using Highway Capacity Software, Sidra Intersection, and SimTraffic
 Comparison of Queue Lengths Estimations at AWSC Intersections using Highway Capacity Software, Sidra Intersection, and SimTraffic Daniel Lai May 2, 2009 Characteristics of an All-Way Stop Controlled (AWSC)
LOCATION AND DESIGN DIVISION
 VIRGINIA DEPARTMENT OF TRANSPORTATION LOCATION AND DESIGN DIVISION INSTRUCTIONAL AND INFORMATIONAL MEMORANDUM GENERAL SUBJECT: Interstate, NHS Non-Interstate and Non-NHS (IJR / IMR Guidance) SPECIFIC SUBJECT:
Since the introduction of the 1985
 IComparing the 1985 HCM and the ICU Methodologies BY JOHN F GOULD Since the introduction of the 1985 High way Capacity Manual, there has been much discussion concerning its application. This is especially
INSIDE THIS ISSUE. mctrans.ce.ufl.edu VOLUME 64 \\ OCTOBER Streets Heat Map Freeways Animation HSM Supplement
 mctrans.ce.ufl.edu INSIDE THIS ISSUE McTrans Center University of Florida Civil & Coastal Engineering PO Box 116585 Gainesville, FL 32611-6585 Streets Heat Map Freeways Animation HSM Supplement Phone:
Quantifying the performance of a traffic data collection system: Scout Connect match rate evaluation
 Technology Showcase Miovision Scout Quantifying the performance of a traffic data collection system: Scout Connect match rate evaluation Contents Executive summary 2 Elements of the study 2 Objectives
Copy. Final Report to the NATIONAL COOPERATIVE HIGHWAY RESEARCH PROGRAM (NCHRP)
") Copy Guidance for the Use of Alternative Traffic Analysis Tools in Highway Capacity Analyses Final Report to the NATIONAL COOPERATIVE HIGHWAY RESEARCH PROGRAM (NCHRP) Prepared by The University of Florida
Copy Guidance for the Use of Alternative Traffic Analysis Tools in Highway Capacity Analyses Final Report to the NATIONAL COOPERATIVE HIGHWAY RESEARCH PROGRAM (NCHRP) Prepared by The University of Florida
PREPRINT TITLE: AUTHORS: Matthew Thornton Post, Buckley, Schuh, and Jernigan 1575 Northside Drive, NW, Suite 350 Atlanta, GA
 Paper No. -1132 PREPRINT Duplication of this preprint for publication or sale is strictly prohibited without prior written permission of the Transportation Research Board TITLE: VEHICLE MODAL ACTIVITY
RELATIONSHIP BETWEEN TRAFFIC FLOW AND SAFETY OF FREEWAYS IN CHINA: A CASE STUDY OF JINGJINTANG FREEWAY
 RELATIONSHIP BETWEEN TRAFFIC FLOW AND SAFETY OF FREEWAYS IN CHINA: A CASE STUDY OF JINGJINTANG FREEWAY Liande ZHONG, PhD Associate professor, Certified Safety Engineer, Research Institute of Highway, Ministry
3.6 GROUND TRANSPORTATION
 3.6.1 Environmental Setting 3.6.1.1 Area of Influence The area of influence for ground transportation consists of the streets and intersections that could be affected by automobile or truck traffic to
MITSIMLab: Enhancements and Applications for Urban Networks
 Topic Area: C4 Paper Number: 3453 Authors: Moshe Ben-Akiva Margaret Cortes Angus Davol Haris Koutsopoulos Tomer Toledo Title: MITSIMLab: Enhancements and Applications for Urban Networks Abstract: Urban
Advanced Transportation Management System (ATMS)
") Advanced Transportation Management System (ATMS) Presentation to the ITS Technology Workshop for Municipalities February 15, 2017 ATMS Project Background Increasing traffic volumes Roadway network is near
Advanced Transportation Management System (ATMS) Presentation to the ITS Technology Workshop for Municipalities February 15, 2017 ATMS Project Background Increasing traffic volumes Roadway network is near
A Practical Approach to Managing Intersection Traffic Data for Large Scale Studies
 MID-CONTINENT TRANSPORTATION SYMPOSIUM PROCEEDINGS 77 A Practical Approach to Managing Intersection Traffic Data for Large Scale Studies JEFF GERKEN AND DAN MEYERS As an increasing number of metropolitan
500 Interchange Design
 500 Interchange Design Table of Contents 501 Interchange Design... 5-1 July 2015 501.1 General... 5-1 501.2 Interchange Type... 5-1 501.2.1 General... 5-1 502 Interchange Design Considerations... 5-2 502.1
VISUM State-of-the-Art Travel Demand Modeling VISUM
 State-of-the-Art Travel Demand Modeling VISUM What is VISUM? VISUM is a comprehensive, flexible software system for transportation planning, travel demand modeling and network data management. VISUM is
NW La Center Road/I-5 Interchange Improvement Project (MP 16.80)
") FINAL DRAFT - NW La Center Road/I-5 Interchange Improvement Project (MP 16.80) La Center, Washington February 2015 FINAL DRAFT - NW La Center Road/I-5 Interchange Improvement Project (MP 16.80) La Center,
FINAL DRAFT - NW La Center Road/I-5 Interchange Improvement Project (MP 16.80) La Center, Washington February 2015 FINAL DRAFT - NW La Center Road/I-5 Interchange Improvement Project (MP 16.80) La Center,
Evaluating Design Alternatives using Crash Prediction Methods from the Highway Safety Manual
 Evaluating Design Alternatives using Crash Prediction Methods from the Highway Safety Manual Andrew Ooms November 2012 Outline Safety Overview Current practices Safety Fundamentals Introduction the Highway
Analytical Tools and Decision Support Systems SANDAG I-15 ICM. ITS PA January 30 th, 2014
 Analytical Tools and Decision Support Systems SANDAG I-15 ICM ITS PA January 30 th, 2014 Project Partners/Stakeholders National ICM Evaluator National AMS Contractor 2 San Diego I-15 Corridor 21 mile corridor
National Capital Region Congestion Report
 Item #6 TPB Technical Committee May 2, 2014 NATIONAL CAPITAL REGION TRANSPORTATION PLANNING BOARD National Capital Region Congestion Report 4th Quarter 2013 (DRAFT) Metropolitan Washington Council of Governments
APPENDIX H: TRAVEL DEMAND MODEL VALIDATION AND ANALYSIS
 APPENDIX H: TRAVEL DEMAND MODEL VALIDATION AND ANALYSIS Travel demand models (TDM) simulate current travel conditions and forecast future travel patterns and conditions based on planned system improvements
Performance you can see
 Performance you can see Features and benefits of Siemens SCOOT and ACS Lite Adaptive Signal Coordination software SCOOT Adaptive Traffic Management Why manually update your coordination timings every three
CE 452 Traffic Impact Assessment
 CE 452 Traffic Impact Assessment 1 Why Required? New developments Produce/ attract new traffic Production: Residences Attraction: Shops, Offices, Schools, Hospitals etc. etc. Changes in traffic pattern
FREEWAY PERFORMANCE MEASUREMENT SYSTEM (PeMS): AN OPERATIONAL ANALYSIS TOOL
: AN OPERATIONAL ANALYSIS TOOL") FREEWAY PERFORMANCE MEASUREMENT SYSTEM (PeMS): AN OPERATIONAL ANALYSIS TOOL Tom Choe Office of Freeway Operations California Department of Transportation District 7 120 S Spring Street Los Angeles, CA
FREEWAY PERFORMANCE MEASUREMENT SYSTEM (PeMS): AN OPERATIONAL ANALYSIS TOOL Tom Choe Office of Freeway Operations California Department of Transportation District 7 120 S Spring Street Los Angeles, CA
A MODIFIED LOCAL FEED-BACK RAMP METERING STRATEGY BASED ON FLOW STABILITY
 A MODIFIED LOCAL FEED-BACK RAMP METERING STRATEGY BASED ON FLOW STABILITY Martijn Ruijgers Eric van Berkum, University of Twente, PO Box 217, 7500 AE, Enschede, the Netherlands Goudappel Coffeng, PO Box
Two-Lane Highway Work Zone Capacity Model and Control Analysis
 Two-Lane Highway Work Zone Capacity Model and Control Analysis Wenbo Zhu A thesis submitted in partial fulfillment of the requirements for the degree of Master of Science in Civil Engineering University
Improved Methods for Superelevation Distribution: I. Single Curve
 Improved Methods for Superelevation Distribution: I. Single Curve Udai Hassein 1, Said Easa 2, Kaarman Raahemifar 3 1 Ph.D Candidate, 2 Professor, Dept. of Civil Engineering, Ryerson University, Toronto,
TRAFFIC ANALYSES TO SUPPORT NEPA STUDIES
 VIRGINIA DEPARTMENT OF TRANSPORTATION ENVIRONMENTAL DIVISION NEPA PROGRAM LOCATION STUDIES TRAFFIC ANALYSES TO SUPPORT NEPA STUDIES CONSULTANT RESOURCE GUIDANCE DOCUMENT Issued on: November 18, 2016 Last
TRANS INTELLIGENCE TRAFFIC SIGNAL TIMING
 TRANS INTELLIGENCE TRAFFIC SIGNAL TIMING TRANSYNC-D At A Glance About TranSync-D TranSync-Desktop is a Windows-based optimization and data management tool for traffic signal systems. It provides abundant
FLORIDA DEPARTMENT OF TRANSPORTATION Planning and Environmental Management Office INTERCHANGE MODIFICATION REPORT
 FLORIDA DEPARTMENT OF TRANSPORTATION Planning and Environmental Management Office INTERCHANGE MODIFICATION REPORT District 2 1109 South Marion Avenue Lake City, FL 32025-5874 INTERSTATE 10 (SR 8) / SR
Travel Time in Macroscopic Traffic Models for Origin-Destination Estimation
 University of Wisconsin Milwaukee UWM Digital Commons Theses and Dissertations May 2013 Travel Time in Macroscopic Traffic Models for Origin-Destination Estimation Eric Youngblom University of Wisconsin-Milwaukee
TRAFFIC & TRANSPORTATION COMMISSION AGENDA REPORT
 TRAFFIC & TRANSPORTATION COMMISSION AGENDA REPORT AGENDA ITEM #4 T/T MTG: 092616 DATE: SEPTEMBER 26, 2016 TO: TRAFFIC & TRANSPORTATION COMMISSION FROM: BENJAMIN CHAN, P.E, T.E., DEPUTY PUBLIC WORKS DIRECTOR
State of the Practice, Case Studies and Analysis Tools on Unconventional Intersection & Interchange Designs in Maryland
 State of the Practice, Case Studies and Analysis Tools on Unconventional Intersection & Interchange Designs in Maryland Saed Rahwanji and Minseok Kim Office of Traffic & Safety Maryland State Highway Administration
Transportation and Works Department The Regional Municipality of York Yonge Street Newmarket, Ontario L3Y 6Z1
 TRANSPORTATION IMPACT STUDY (TIS) GUIDELINES FOR DEVELOPMENT APPLICATIONS Transportation and Works Department The Regional Municipality of York 17250 Yonge Street Newmarket, Ontario L3Y 6Z1 August, 2007
ScienceDirect. Metering with Traffic Signal Control Development and Evaluation of an Algorithm
 Available online at www.sciencedirect.com ScienceDirect Transportation Research Procedia 8 (215 ) 24 214 European Transport Conference 214 from Sept-29 to Oct-1, 214 Metering with Traffic Signal Control
IMPLEMENTING TOLL PLAZA ANALYSIS INTO FREEPLAN
 IMPLEMENTING TOLL PLAZA ANALYSIS INTO FREEPLAN By ROBIN PHILIP OSBORNE A THESIS PRESENTED TO THE GRADUATE SCHOOL OF THE UNIVERSITY OF FLORIDA IN PARTIAL FULFILLMENT OF THE REQUIREMENTS FOR THE DEGREE OF
Operational Analyses of Freeway Off-Ramp Bottlenecks
 Transportation Research Procedia Volume 15, 2016, Pages 573 582 ISEHP 2016. International Symposium on Enhancing Highway Performance Operational Analyses of Freeway Off-Ramp Bottlenecks Alexander Skabardonis
INSIDE THIS ISSUE. mctrans.ce.ufl.edu VOLUME 65 \\ JANUARY Capacity Analysis Webinars. Bus Bike-Rack App HCS Release 7.5
 mctrans.ce.ufl.edu INSIDE THIS ISSUE Bus Bike-Rack App HCS Release 7.5 Capacity Analysis Webinars McTrans Center University of Florida Civil & Coastal Engineering PO Box 116585 Gainesville, FL 32611-6585
Scope of Services Traffic Signal Retiming Contract FM NO Florida Department of Transportation District Four
 Scope of Services Traffic Signal Retiming Contract FM NO. 230017-8-32-01 Florida Department of Transportation District Four A-1 Contents 1. Background... 3 2. Summary of Services... 3 3. Consultant Requirements...
Traffic Control Concepts for Urban and Suburban Streets
 Traffic Control Concepts for Urban and Suburban Streets Course No: C07-004 Credit: 7 PDH Gilbert Gedeon, P.E. Continuing Education and Development, Inc. 9 Greyridge Farm Court Stony Point, NY 10980 P:
An Introduction to the. Safety Manual
 An Introduction to the Highway Safety Manual An Introduction to the HIGHWAY SAFETY MANUAL Table of Contents Section 1: HSM Overview... 1 What is the Highway Safety Manual?... 1 How is the HSM Applied?...
TERRA Engineering creates a competitive traffic data mix with Miovision
 CASE STUDY Miovision Scout TERRA Engineering creates a competitive traffic data mix with Miovision Scenario As a leader with over 20 years experience, TERRA Engineering is focused on providing a full spectrum
Jim Alexander Director of Design and Engineering, Southwest Light Rail Transit Project
 Memorandum Date: January 15, 2014 To: CC: From: Subject: Jim Alexander Director of Design and Engineering, Southwest Light Rail Transit Project Paul Danielson, P.E. Project Manager, Southwest Light Rail
Available online at ScienceDirect. Transportation Research Procedia 3 (2014 )
") Available online at www.sciencedirect.com ScienceDirect Transportation Research Procedia 3 (214 ) 131 14 17th Meeting of the EURO Working Group on Transportation, EWGT214, 2-4 July 214, Sevilla, Spain
Available online at www.sciencedirect.com ScienceDirect Transportation Research Procedia 3 (214 ) 131 14 17th Meeting of the EURO Working Group on Transportation, EWGT214, 2-4 July 214, Sevilla, Spain
Construction Alternative Screening with Regional Travel Demand Model
 Construction Alternative Screening with Regional Travel Demand Model By: Marty Milkovits (Corresponding Author) Cambridge Systematics, Inc. 100 CambridgePark Drive, Suite 400 Cambridge, MA 02140 Phone:
I-10 CORRIDOR IMPROVEMENTS STAGE 0 FEASIBILITY STUDY STATE PROJECT NUMBER H FEDERAL AID PROJECT NUMBER H004100
 JULY 2016 I-10 CORRIDOR IMPROVEMENTS STAGE 0 FEASIBILITY STUDY STATE PROJECT NUMBER H.004100 FEDERAL AID PROJECT NUMBER H004100 EAST BATON ROUGE AND WEST BATON ROUGE PARISHES, LOUISIANA Section TABLE OF
siemens.com/mobility Traffic simulation with PTV Vissim Leading-edge software fully integrated in the Sitraffic landscape
 siemens.com/mobility Traffic simulation with PTV Vissim Leading-edge software fully integrated in the Sitraffic landscape For urban or interurban traffic, rail transport or private travel: To all kinds
USING TRAVEL TIME RELIABILITY DATA TO DEVELOP CONGESTION MANAGEMENT STRATEGIES IN THE TRANSPORTATION PLANNING PROCESS.
 USING TRAVEL TIME RELIABILITY DATA TO DEVELOP CONGESTION MANAGEMENT STRATEGIES IN THE TRANSPORTATION PLANNING PROCESS by Shuangshuo Wang B.S. Engineering, Tongji University, 2014 Submitted to the Graduate
FULLY AUTONOMOUS VEHICLES: ANALYZING TRANSPORTATION NETWORK PERFORMANCE AND OPERATING SCENARIOS IN THE GREATER TORONTO AREA, CANADA
 FULLY AUTONOMOUS VEHICLES: ANALYZING TRANSPORTATION NETWORK PERFORMANCE AND OPERATING SCENARIOS IN THE GREATER TORONTO AREA, CANADA Bradley, University of Toronto Proceedings of the 52nd Annual Conference
2 Purpose and Need. 2.1 Study Area. I-81 Corridor Improvement Study Tier 1 Draft Environmental Impact Statement
 2 Purpose and Need 2.1 Study Area Interstate 81 (I-81) is relied upon for local and regional travel and interstate travel in the eastern United States. It extends 855 miles from Tennessee to New York at
Project History Interchange Innovation Existing Conditions Proposed Design Approval Process Final Details PRESENTATION FOCUS
 DIVERGING DIAMOND INTERCHANGE State Route 120/Union Road Diverging Diamond Retrofit Presented by: Mark Houghton Sam Sherman Matt Brogan Aaron Silva City of Manteca Caltrans, District 10 Mark Thomas Mark
Development of Capacity Estimation Method from Statistical Distribution of Observed Traffic Flow
 Development of Capacity Estimation Method from Statistical Distribution of Observed Traffic Flow MYUNGSOON CHANG Prof., Department of Transportation Engineering, Hanyang University, Korea YOUNGKOL KIM
Are We Ready for Autonomous and Connected Vehicles?
 Are We Ready for Autonomous and Connected Vehicles? Flow and Operations Considerations Hani Mahmassani Northwestern University 103rd Annual Transportation and Highway Engineering Conference UIUC, February
Performance Based Practical Design (PBPD)
") Performance Based Practical Design (PBPD) 2016 ODOT D08 LPA Day John R. Kasich, Ohio Governor Jerry Wray, ODOT Director PBPD PBPD Presenter Katherine DeStefano, P. E. District 08 Design Engineer ODOT D08
Performance Based Practical Design (PBPD) 2016 ODOT D08 LPA Day John R. Kasich, Ohio Governor Jerry Wray, ODOT Director PBPD PBPD Presenter Katherine DeStefano, P. E. District 08 Design Engineer ODOT D08
LOCATION AND DESIGN DIVISION
 VIRGINIA DEPARTMENT OF TRANSPORTATION LOCATION AND DESIGN DIVISION INSTRUCTIONAL AND INFORMATIONAL MEMORANDUM GENERAL SUBJECT: Design Exceptions / Waivers SPECIFIC SUBJECT: Design Exception Request Form
APPENDIX A TIER 1 ANALYSIS
 SPN H.004100 FEASIBILITY STUDY APPENDIX A TIER 1 ANALYSIS 040-012-042AH Appendices Lead Sheets PROVIDENCE STATE PROJECT. H.004100 The following worksheets analyze various project alternatives at various
IMPLEMENTATION OF TRAFFIC CONTROL MEASURES SYSTEMS AS AN INTERIM LABOUR-BASED ALTERNATIVE TO INTELLIGENT TRANSPORT SYSTEMS
 IMPLEMENTATION OF TRAFFIC CONTROL MEASURES SYSTEMS AS AN INTERIM LABOUR-BASED ALTERNATIVE TO INTELLIGENT TRANSPORT SYSTEMS H DE JONGH SCHREUDER 1 and C VENTER 2 1 Africon Engineering (Pty) Ltd, PO Box
AMPO Annual Conference Session: Performance (Part 1) October 18, 2017 Savannah, GA
 October 18, 2017 Savannah, GA") AMPO Annual Conference Session: Performance (Part 1) October 18, 2017 Savannah, GA Introduction: North Jersey Transportation Planning Authority NJTPA Congestion Management Process Study Goals Analysis
AMPO Annual Conference Session: Performance (Part 1) October 18, 2017 Savannah, GA Introduction: North Jersey Transportation Planning Authority NJTPA Congestion Management Process Study Goals Analysis
Validate: A New Method To Generate Nationwide Traffic Data
 Validate: A New Method To Generate Nationwide Traffic Data Thomas Haupt Udo Heidl PTV AG PTV AG Stumpfstr.1 Stumpfstr. 1 76131 Karlsruhe, 76131 Karlsruhe Email thomas.haupt@ptv.de Email udo.heidl@ptv.de
Application of Road Safety Audits to Urban Streets
 Application of Road Safety Audits to Urban Streets ABSTRACT EUGENE M. WILSON Professor Civil Engineering Dept. University of Wyoming Laramie, WY 82071 MARTIN E. LIPINSKI Professor Department of Civil Engineering
HCM 6th Edition Planning and Preliminary Engineering Applications Guide (PPEAG) to the HCM Bringing Back-of-the-Envelope Back.
 to the HCM Bringing Back-of-the-Envelope Back.") HCM 6th Edition Planning and Preliminary Engineering Applications Guide (PPEAG) to the HCM Bringing Back-of-the-Envelope Back April, 2017 Potential Use of the HCM in Planning The HCM is commonly used to
HCM 6th Edition Planning and Preliminary Engineering Applications Guide (PPEAG) to the HCM Bringing Back-of-the-Envelope Back April, 2017 Potential Use of the HCM in Planning The HCM is commonly used to
PROBE SAMPLING STRATEGIES FOR TRAFFIC MONITORING SYSTEMS BASED ON WIRELESS LOCATION TECHNOLOGY
 FINAL CONTRACT REPORT VTRC 07-CR12 PROBE SAMPLING STRATEGIES FOR TRAFFIC MONITORING SYSTEMS BASED ON WIRELESS LOCATION TECHNOLOGY MICHAEL D. FONTAINE, P.E., Ph.D. Assistant Professor Old Dominion University
Chapter 1. FHWA Guidance & Policies Traffic Analysis
 Chapter 1 FHWA Guidance & Policies Traffic Analysis Microsimulation as a Design Tool James P. McCarthy Federal Highway Administration James.mccarthy@fhwa.dot.gov 651-291-6112 Traffic Analysis in Design?
Determining the Maximum Allowable Headway
 36 Determining the Maximum Allowable Headway The purpose of this activity is to give you the opportunity to determine the maximum allowable headway (MAH) for your intersection. Select an MAH VISSIM input
Geometric Design: Past, Present, and Future
 A2A02: Committee on Geometric Design Chairman: Daniel B. Fambro Geometric Design: Past, Present, and Future DANIEL B. FAMBRO, Texas A&M University JOHN C. COLLINGS, Delcan Corporation ROBERT DELLA VEDOVA,
November 8, RE: Harrah s Station Square Casino Transportation Analysis Detailed Traffic Impact Study Review. Dear Mr. Rowe:
 November 8, 2006 Mr. Glenn Rowe, P.E. Pennsylvania Department of Transportation Bureau of Highway Safety and Traffic Engineering Commonwealth Keystone Building 400 North Street, 6 th Floor Harrisburg,
Central Phoenix Transportation Framework Study
 Central Phoenix Transportation Framework Study Study Area 2013, All Rights Reserved. 1 Agenda Introductions Work Products Feedback on previous products Draft products for Planning Partner review SR-30
TRANSPORTATION IMPACT ANALYSIS GUIDELINES
 TRANSPORTATION IMPACT ANALYSIS GUIDELINES SANTA CLARA COUNTY TRANSPORTATION AUTHORITY CONGESTION MANAGEMENT PROGRAM ADOPTED MARCH 2009 TABLE OF CONTENTS PART I - STATUTE AND AUTHORITY...1 CHAPTER 1. CMP
Distribution of traffic over buffer space by using controlled intersections
 Distribution of traffic over buffer space by using controlled intersections Master of Science Thesis Mark Buitenhuis Distribution of traffic over buffer space by using controlled intersections Master
FEDERAL BOULEVARD (5 TH AVENUE TO HOWARD PLACE) PLANNING ENVIRONMENTAL LINKAGE STUDY TRAFFIC NOISE IMPACT ANALYSIS
 PLANNING ENVIRONMENTAL LINKAGE STUDY TRAFFIC NOISE IMPACT ANALYSIS") FEDERAL BOULEVARD (5 TH AVENUE TO HOWARD PLACE) PLANNING ENVIRONMENTAL LINKAGE STUDY TRAFFIC NOISE IMPACT ANALYSIS Prepared for: City and County of Denver 201 West Colfax Avenue, Department 509 Denver,
FEDERAL BOULEVARD (5 TH AVENUE TO HOWARD PLACE) PLANNING ENVIRONMENTAL LINKAGE STUDY TRAFFIC NOISE IMPACT ANALYSIS Prepared for: City and County of Denver 201 West Colfax Avenue, Department 509 Denver,
Florida International University; University of Central Florida. Mohammed Hadi, Ph.D., PE (Dr. Haitham Al-Deek from UCF is Co-PI)
") Project Information Form Project Title University Principal Investigator PI Contact Information Performance Measurements of Transportation Systems based on Fine- Grained Data Collected by AVI and AVL Systems
Project Information Form Project Title University Principal Investigator PI Contact Information Performance Measurements of Transportation Systems based on Fine- Grained Data Collected by AVI and AVL Systems
Active Risk Management - Charles River Basin
 Protecting, Promoting and Enhancing our Commonwealth: Assisting MassDOT to deliver projects on Time and on Budget Active Risk Management - Charles River Basin September 18, 2013 & Massachusetts Accelerated
Interchange Workshop Report (August 2004)
") U.S. Highway 14 Corridor Study New Ulm to North Mankato Table of Contents Section Interchange Workshop Report (August 2004) Page 1. Introduction and Next Steps 1 2. Interchange Workshop Participants &
U.S. Highway 14 Corridor Study New Ulm to North Mankato Table of Contents Section Interchange Workshop Report (August 2004) Page 1. Introduction and Next Steps 1 2. Interchange Workshop Participants &
Adaptive Signal Control Technology Research in Illinois. Kyle Armstrong, Ray Benekohal, Xueying Liu
 Adaptive Signal Control Technology Research in Illinois Kyle Armstrong, Ray Benekohal, Xueying Liu Overview ASCT ASCT Research Study Phases Before Study SynchroGreen Implementation After Study Future Tasks
Travel Time Reliability in the SLOCOG Region. October 27, 2014 San Luis Obispo Council of Governments Transportation Education Series
 Travel Time Reliability in the SLOCOG Region October 27, 2014 San Luis Obispo Council of Governments Transportation Education Series 1 Transportation Education Series - Agenda Grab Some Free Lunch!! Introductions
Appendix B Highway 407 Interchange Review - Cochrane Street Area
 Appendix B Highway 407 Interchange Review - Cochrane Street Area AECOM 300 ater Street hitby, ON, Canada L1N 9J2 www.aecom.com Memorandum To Michael May, P.Eng., Town of hitby Page 1 CC Subject Greg Hardy,