Technical Report 7: Freight Mobility Final Adopted Plan
|
|
|
- Loreen Tyler
- 6 years ago
- Views:
Transcription


1 2040 Long Range Transportation Plan Technical Report 7: Freight Mobility Final Adopted Plan January South Orange Avenue, Suite 200, Orlando, FL MetroPlan
2 Table of Contents EXECUTIVE SUMMARY INTRODUCTION Developing the Plan Organization of the Report CURRENT FREIGHT AND GOODS MOVEMENTS Orange County Osceola County Seminole County FUTURE FREIGHT AND GOODS MOVEMENT Forecast Methodology Orange County Osceola County Seminole County NEEDS ASSESSMENT Regional Freight System Overview Regional Freight Highway Subsystem Railroads Air Cargo Freight Villages Orange County Osceola County Seminole County REGIONAL SOLUTIONS AND RECOMMENDATIONS Infrastructure Recommendations Operational Recommendations Institutional Recommendations i
3 Executive Summary Integrating freight into the planning process is critical to the region and its citizens because of freight s role in these policy areas: Economic Competitiveness The higher the cost of moving goods, the higher the cost of doing business, leading to an increase in the cost of living in the region. A higher cost of living impacts the region s ability to attract and retain jobs. Regional Mobility Significant portions of the region s primary freeways and arterials operate near capacity, leading to significant congestion and delay. Freight is a contributing factor, and it is projected that for every 100 trucks on the region s roads today, there will be up to 160 trucks in Air Quality The freight sector is associated nationally with increasing pollution, especially emissions of criteria pollutants (particularly NO x and particulate matter due to the prevalence of diesel engines), air toxins, and greenhouse gases. This includes emissions from mobile sources such as trucks, and stationary sources, such as rail yards. Emissions from the movement of freight can have serious impacts on public health, the environment and the region s economy. Safety Safety concerns arise from several sources, including trucks and passenger vehicles sharing the same roadways, passenger and freight trains sharing the same rail tracks, at-grade rail crossings and the transport of hazardous materials. Understanding the risks associated with goods movement is the first step in mitigating them. Community Impacts Freight transportation and facilities give rise to negative community impacts if not properly planned, including noise, pollution, excessive vibration, and wear and tear on roadways. Low-income and minority residents often are more adversely affected by freight transportation, because they are more likely to live close to freight intensive facilities and industries. MetroPlan Orlando led the Central Florida Regional Freight Mobility Study, which included the three-county MetroPlan region, as well as Brevard, Lake, Sumter and Volusia counties. The assessment of the current and future situation revealed three primary categories of needs and deficiencies: 1) capacity and congestion; 2) community impacts, including air quality and safety; and 3) institutional and regulatory bottlenecks. 1 Regional Freight and Goods Movement Facilities Profile, Central Florida Regional Goods Movement Study. 1
4 This report presents solutions to address the needs. Addressing the deficiencies will require multifaceted solutions that include recommendations of these types: Physical infrastructure refers to investment in improving and/or expanding the transportation system in such areas as roadways, rail and ports. The improvements may include new facilities, capacity enhancements or reconstruction to existing facilities, reconstruction and maintenance activities, such as repaving. Operational solutions focus on improving the efficiency and velocity of the existing system. Examples include: improving signage and way-finding programs; synchronizing traffic signals to maximize traffic flows; altering the time of day traffic is on the roadways to make better use of the infrastructure, and providing real-time traffic data and information to dispatchers and drivers. Institutional solutions focus on policies, regulations and governance issues that affect goods movement and the communities impacted by those movements. Institutional bottlenecks arise from industry regulations, such as truck size and weight and drivers hours of service rules. Local, regional and state governance over publicly owned assets, such as roadways, leads to local officials having total responsibility (including funding requirements) for roads that may have regional, state or even national roles in terms of the freight movement. This can also affect public policies, such as how projects are selected and prioritized in the regional, state, and federal planning processes. 2
5 1.0 Introduction Goods movement is a "derived demand" meaning that freight volumes increase as population, income, and employment grow. Since completion of MetroPlan Orlando s original Freight, Goods and Services Mobility Strategy Plan in 2002, there have been significant developments and changes in the region. Some of these are regional, such as the development of SunRail, the shifting of some CSX freight trains from the A Line to the S Line, transitioning away from the shuttle program at Cape Canaveral and developing the intermodal logistics center (ILC) in Winter Haven. Others relate to state initiatives, such as the 2060 Florida Transportation Plan (FTP), the 2010 Strategic Intermodal System (SIS) Strategic Plan, the investment elements of the 2010 Rail and Seaport System Plans, the trade development strategies developed as part of the Florida Trade and Logistics Study, recent legislative actions, and ongoing reorganization of the Florida Department of Transportation (FDOT) to create an Office of Freight and Logistics. The Central Florida Regional Freight and Goods Movement Plan was undertaken in conjunction with MetroPlan s long range plan update and included an expanded examination of the needs and opportunities. This report draws from the research, analysis and findings from that larger effort. Metroplan Orlando s three-county region represented the most urbanized area and population base of the larger study area. It is home to renowned theme parks, making it one of the largest tourist destinations in the world. It is centered on Florida s Turnpike and I-4, and CSX and Florida Central Railroad. It is home to the region s largest freight hubs, such as the Orlando and Sanford International Airports, and CSX s existing Taft Yard. 1.1 Developing the Regional Freight Plan The steps for developing the regional freight and goods movement plan include identifying key elements of the region s freight transportation system, estimating current and future levels of freight flow, assessing existing and future conditions, and developing recommendations. In addition to data collection and analysis, each step included private and public sector stakeholder input through interviews, meetings and surveys. A series of technical reports were developed around these steps and are described below. Current Regional Freight and Goods Flow Profile. The freight and goods moving into, out of, and through the region were analyzed and documented for the base year of The analysis examined types of commodities, how they are moving and where they are moving. The flows are documented for the region as a whole and for individual counties. Regional Freight and Goods Movement Facilities Profile. An inventory and assessment of the highway, rail, air, water, and space transportation system in the seven-county study region was conducted. In addition, freight-supported land use related to that system was documented and described, and a regional priority freight subsystem was identified. 3
6 Future Regional Freight and Goods Flow Profile. The amount of goods and freight moving in the region is expected to increase as the region grows. Two alternative forecasts of regional freight and goods movement in 2035 were developed. The forecasts documented what type of commodities will be moving, how, and where they will be moving in The forecasts were presented for the region as a whole and for individual counties. Regional Freight and Goods Movement Needs Assessment. Regionally significant (as opposed to local) needs include mobility, community impact mitigation, and regulatory and institutional bottlenecks. The challenges included significant delay on the road and rail systems, deficient intermodal connectors, interchange bottlenecks, safety concerns, air quality concerns, and community impacts. Regional Freight and Goods Movement Recommendations. The recommendations were grouped into three categories; physical infrastructure, operations, and institutional recommendations were developed using public and private sector input, data analysis and modeling, best practices and ground observations. A screening process based on the plan goal and objectives led to a set of short-term, medium-term, and long-term recommendations. 1.2 Organization of Report This final report draws from the above set of technical reports and is organized as follows: Section 2.0 provides a profile of relationship between current regional freight and goods movement and the region s economy; Section 3.0 discusses future freight flows; Section 4.0 summarizes current and future needs and deficiencies; Section 5.0 puts forth solutions and recommendations. 4
7 2.0 Current Freight and Goods Movement The following sections provide summaries for each of the three counties in the MetroPlan Orlando study area. Each summary provides data on freight flows by mode, direction, and commodity type for each county. The summaries also describe the trade flow surplus or deficit within each county. 2 Trade deficits can affect the net flow of capital to a region. This information helps local governments and businesses make investments and plan for growth. The consumption patterns of visitors and tourists to the counties in Central Florida may also contribute to the trade imbalance of many commodities, such as consumer products, which may be mitigated with outside revenue. The data source for the commodity flow analysis in this report is the Florida Trade and Logistics database provided by Florida Department of Transportation (FDOT) for truck, air and waterborne freight movements, and the Surface Transportation Board (STB) Full Carload Waybill Sample for rail flows. The Florida Trade and Logistics database was developed for the Florida Trade and Logistics Study commissioned by the Florida Chamber of Commerce Foundation and FDOT. The base year for this database was normalized to 2010 and forecasts were developed for 10-, 25-, and 50-year time periods. It used IHS Global Insight TRANSEARCH commodity flow data to describe the truck and domestic air cargo flows; and used the Journal of Commerce s Port Import Export Reporting System (PIERS) data to describe Florida s international waterborne imports and exports. Rail freight flows were analyzed with the 2009 Surface Transportation Board Full Carload Waybill Sample. 2.1 Orange County In 2010, 132 million tons of freight moved into, out of, within, and through Orange County. Table 2.1 details the freight tonnage by direction and mode. Figure 2.1 presents the same information graphically. Approximately 24 million tons (18%) traveled inbound, 12 million tons (9%) traveled outbound, and 2.5 million tons (2%) traveled from one point within the county to another. Through freight accounted for 94 million tons or 71% of the total. The modal breakdown of the tonnage associated with Orange County in 2010 was 96% by truck, 4% by rail and less than 0.1% by air (see Figure 2.2). 2 If a particular county exports more freight tonnage than it imports, the trade flow is termed a surplus (net inflow of capital to the county from outside the county). If a county imports more freight tonnage than it exports, the flow is termed a deficit (net outflow of capital to purchase commodities from outside). 5

8 Table 2.1 Summary of Orange County Freight Flows by Weight 2010, Tons in Thousands Direction Total Truck Rail a Air Air- Truck Inbound 23,920 19,560 4, Outbound 12,104 11, Intra-county 2,584 2, Through 93,832 93,824 N/A b - 8 Total 132, ,695 4, Source: 2010 FDOT Trade and Logistics dataset and 2009 full Surface Transportation Board (STB) Waybill dataset. a The base year for the rail data is b Through rail moves were not included due to the inability to estimate it with the full Surface Transportation Board (STB) Waybill dataset. Therefore, the total through tonnage shown here likely underestimates actual through tonnage due to the lack of through rail data. Figure 2.1 Direction of Total Freight Flows by Weight Orange County 2010 Inbound 18% Outbound 9% Through 71% Intra 2% Source: 2010 FDOT Trade and Logistics dataset and 2009 full Surface Transportation Board (STB) Waybill dataset. 6
9 Figure 2.2 Mode Share by Weight Orange County 2010 Air-Truck <1% Rail 4% Air <1% Truck 96% Source: 2010 FDOT Trade and Logistics dataset and 2009 full Surface Transportation Board (STB) Waybill dataset. Figure 2.3 highlights the balance of imports (inbound tonnage) to exports (outbound tonnage) and shows that Orange County businesses receive more inbound goods than they ship outbound, translating into a freight trade deficit of 32%. Although this is a relatively low deficit compared to other counties in the study area (70% for Osceola, 60% for Seminole) it reflects a strong imbalance toward consumption over production and could lead to outflows of capital from the area. However, the strong role of the tourism industry in Orange County likely mitigates much of this imbalance. Many commodities are consumed by visitors to Orange County (with capital from outside the region). 7


10 Figure 2.3 Imports/Exports Orange County 2010 Export 34% Import 66% Source: 2010 FDOT Trade and Logistics dataset and 2009 full Surface Transportation Board (STB) Waybill dataset. In 2010, about 38.6 million tons of freight moved inbound, outbound, and within Orange County. By weight, nonmetallic minerals and products made of clay, concrete, glass or stone account for 17.8 million tons or 46% of the total tonnage. Warehouse and distribution goods, and food and kindred products are also top commodity groups, accounting for 11.7 million tons or 30% of the total tonnage (see Figure 2.4). Figure 2.4 Commodities Orange County 2010 Farm Products Pulp, Paper or Allied Products Printed Matter Chemicals or Allied Products Petroleum or Coal Products Coal Food or Kindred Products Warehoused Goods Clay, Concrete, Glass or Stone Nonmetallic Minerals Tons (in Thousands) Note: Sum of inbound, outbound, and intracounty freight Source: 2010 FDOT Trade and Logistics dataset and 2009 full Surface Transportation Board (STB) Waybill dataset. 8
11 2.2 Osceola County In 2010, 96 million tons of freight moved into, out of, within, and through Osceola County. Table 2.2 displays the freight tonnage by direction and mode. Approximately 2.6 million tons (3%) traveled inbound, 458,000 tons (less than 1%) traveled outbound, and 12,000 tons (less than 1%) traveled from one point within the county to another. Through freight accounted for 93 million tons or 97% of the total (see Figure 2.5). Nearly all freight associated with Osceola County is transported by truck (see Figure 2.6). Table 2.2 Summary of Osceola County Freight Flows by Weight 2010, Tons in Thousands Direction Total Truck Rail a Air Air- Truck Inbound 2,598 2, Outbound Intra-county Through 93,139 93,020 N/A b Total 96,207 96, Source: 2010 FDOT Trade and Logistics dataset and 2009 full Surface Transportation Board (STB) Waybill dataset. a The base year for the rail data is b Through rail moves were not included due to the inability to estimate it with the full Surface Transportation Board (STB) Waybill dataset. Therefore, the total through tonnage shown here likely underestimates actual through tonnage due to the lack of through rail data. 9
12 Figure 2.5 Direction of Total Freight Flows by Weight Osceola County Inbound 3% 2010 Outbound <1% Intracounty <1% Through 97% Source: 2010 FDOT Trade and Logistics dataset and 2009 full Surface Transportation Board (STB) Waybill dataset. Figure 2.6 Mode Share by Weight Osceola County Air-Truck <1% Rail <1% Truck 99% Source: 2010 FDOT Trade and Logistics dataset and 2009 full Surface Transportation Board (STB) Waybill dataset. 10
13 Figure 2.7 highlights the balance of imports (inbound tonnage) to exports (outbound tonnage) and shows that Osceola County businesses receive more inbound goods than they ship outbound, translating into a freight trade deficit of 70%. As with Orange County, the strong role of the tourism industry in Osceola County mitigates much of the imbalance. Many commodities are consumed by visitors (with capital from outside the region). Figure 2.7 Imports/Exports Osceola County 2010 Export 15% Import 85% Source: 2010 FDOT Trade and Logistics dataset and 2009 full Surface Transportation Board (STB) Waybill dataset. In 2010, about 3 million tons of freight moved inbound, outbound, and within Osceola County. Nonmetallic minerals, and products made of clay, concrete, glass, or stone account for 2.3 million tons or 74% of total tonnage reflecting the relative strength of the construction industry in the county (see Figure 2.8). 11
14 Figure 2.8 Commodities Osceola County 2010 Printed Matter Chemicals or Allied Products Farm Products Lumber or Wood Products Primary Metal Products Petroleum or Coal Products Warehoused Goods Food or Kindred Products Clay, Concrete, Glass or Stone Nonmetallic Minerals Tons (in Thousands) Note: Sum of inbound, outbound, and intracounty freight Source: 2010 FDOT Trade and Logistics dataset and 2009 full Surface Transportation Board (STB) Waybill dataset. 2.3 Seminole County In 2010, 39.5 million tons of freight moved into, out of, within, and through Seminole County. Table 2.3 details the county s freight moves by direction and mode. Figures 2.9 and 2.10 display the information graphically. Approximately 8.5 million tons (21%) traveled inbound, 2.1 million tons (5%) traveled outbound, and 171,000 tons (less than 1%) traveled from one point within the county to another. Through freight accounted for 28.8 million tons or 73% of the total. About 99% of the freight associated with Seminole County was transported by truck and approximately 1% by rail. 12

 Waybill dataset.")
15 Table 2.3 Summary of Seminole County Freight Flows by Weight 2010, Tons in Thousands Direction Total Truck Rail a Air Air- Truck Inbound 8,474 8, Outbound 2,074 2, Intra-county Through 28,829 28,828 N/A b - 1 Total 39,549 39, Source: 2010 FDOT Trade and Logistics dataset and 2009 full Surface Transportation Board (STB) Waybill dataset. a The base year for the rail data is b Through rail moves were not included due to the inability to estimate it with the full Surface Transportation Board (STB) Waybill dataset. Therefore, the total through tonnage shown here likely underestimates actual through tonnage due to the lack of through rail data. Figure 2.9 Direction of Total Freight Flows by Weight Seminole County 2010 Inbound 21% Outbound 5% Intracounty 1% Through 73% Source: 2010 FDOT Trade and Logistics dataset and 2009 full Surface Transportation Board (STB) Waybill dataset. 13

 to exports (outbound tonnage) and shows")

16 Figure 2.10 Mode Share by Weight Seminole County Air-Truck <1% Rail 1% Air <1% Source: 2010 FDOT Trade and Logistics dataset and 2009 full Surface Transportation Board (STB) Waybill dataset. Truck 99% Figure 2.11 highlights the balance of imports (inbound tonnage) to exports (outbound tonnage) and shows that Seminole County businesses receive more inbound goods than they ship outbound, thus translating into a freight trade deficit of 60%. Figure 2.11 Imports/Exports Seminole County 2010 Export 20% Import 80% Source: 2010 FDOT Trade and Logistics dataset and 2009 full Surface Transportation Board (STB) Waybill dataset. 14
17 In 2010, about 10.7 million tons of freight moved inbound, outbound, and within Seminole County. Clay, concrete, glass, and stone products, and nonmetallic minerals combined account for 6.7 million tons or 63% of total tonnage reflecting the strength of the construction industry in the county (see Figure 2.12). Figure 2.12 Commodities Seminole County 2010 Primary Metal Products Printed Matter Fabricated Metal Products Lumber or Wood Products Food or Kindred Products Chemicals or Allied Products Warehoused Goods Petroleum or Coal Products Nonmetallic Minerals Clay, Concrete, Glass or Stone ,000 1,500 2,000 2,500 3,000 3,500 4,000 Tons (in Thousands) Note: Sum of inbound, outbound, and intracounty freight Source: 2010 FDOT Trade and Logistics dataset and 2009 full Surface Transportation Board (STB) Waybill dataset. 15
18 3.0 Future Freight and Goods Movement This chapter presents the results of the future commodity flow profile. Two forecasts were developed to examine the future demand for freight transportation in the region 3. Forecast 1 - Adjusted Trade and Logistics Forecast: The forecast developed for the Florida Trade and Logistics study was adjusted to reflect the most up-to-date expected growth in population and Gross Domestic Product (GDP) in the region, state and country. Forecast 2 FAF3 Based Forecast: The Federal Highway Administration s (FHWA) Freight Analysis Framework version 3.3 (FAF3.3) growth rates were calculated by mode, commodity and origin-destination (O-D) and were applied to the base year. The results from these two forecasts are presented for truck, rail and international waterborne cargo moving to, from, through and within the study area. The air cargo existing and future demand are not included due to the lack of international data in the Trade and Logistics database. Air cargo forecasts were developed separately and are analyzed in the air cargo profile. 3.1 Forecast Methodology The Trade and Logistics truck and international water forecasts were updated to include the most current 2040 projections of population 4 and GDP 5 for the study region, state and the country. Only the flows that used these growth rates were updated. For the remaining flows, the forecast remained unchanged, and a simple interpolation was done using the 2035 and 2060 volumes to obtain 2040 volumes. The rail forecast was developed using a different methodology, because the base year did not use the original Trade and Logistics rail data. The 2009 STB Full Carload Waybill Sample was forecasted following the same methodology used in the Trade and Logistics forecast and using the original and updated growth rates as needed. The Federal Highway Administration Freight Analysis Framework version 3.3 (FAF3.3) database was used to forecast to the year 2040 the base year Trade and Logistics data and the STB Waybill data. The FAF3 is based in 2007, includes 2010 provisional data, and forecasts 3 The study area is comprised of seven counties in the Central Florida region. This area includes Brevard, Lake, Orange, Osceola, Seminole, Sumter, and Volusia counties. 4 The seven-county study region and statewide population forecast source was the University of Florida Bureau of Economic and Business Research (BEBR) forecast. The U.S. population forecast source was the U.S. Census Bureau International Database. 5 The seven-county study region and statewide GDP forecast source was the University of Central Florida Institute for Economic Competitiveness Florida & Metro Forecast (October 2012) adjusted by Cambridge Systematics. The U.S. GDP forecast source was the Florida Office of Economic & Demographic Research (EDR) adjusted by Cambridge Systematics. 16
19 through 2040 in five-year increments. Growth rates were calculated for the FAF3 flows from/to Florida by Origin-Destination, commodity type and mode, and were then applied to the base year data. Adjustments were made to the updated Trade and Logistics forecast and the FAF3-based forecast to better reflect the expected growth or decline of various industries. The Trade and Logistic growth rate for clay, concrete, glass and stone products was reduced by 50% from an average Compound Annual Growth Rate (CAGR) of 3.2% to 1.6%. The FAF3 growth rate for nonmetallic ores and minerals was reduced by 50% from an average Compound Annual Growth Rate (CAGR) of 1.3% to 0.6%. A 4% cap for annual growth was set on the FAF3 growth rate for instruments, photographic and optical goods. The resulting forecasts for each of the three counties in the MetroPlan Orlando region are presented below. 3.2 Orange County In 2010, 132 million tons of freight moved into, out of, within, and through Orange County. Table 3.1 details the freight tonnage by direction and mode. Figures 3.1 and 3.2 present the same information graphically. Approximately 24 million tons (18%) traveled inbound, 12 million tons (9%) traveled outbound, and 2.6 million tons (2%) traveled from one point within the county to another. Through freight accounted for 93 million tons or 71% of the total. The modal breakdown of the tonnage associated with Orange County in 2010 was 97% by truck, and 3% by rail. By 2040, total freight moving across the county is expected to grow to million tons, an increase of 37% 58% depending on the forecast. 17
20 Figure 3.1 Growth in Total Weight of Freight Flows by Direction Orange County Tons (in Thousands) 250, , , ,000 50, (Forecast 1) 2040 (Forecast 2) Inbound Outbound Intracounty Through Source: 2010 FDOT Trade and Logistics data, 2009 Full Surface Transportation Board (STB) Waybill data, 2040 Trade and Logistics New Forecast (Forecast 1) processed by Cambridge Systematics, and 2040 FAF3 Based Forecast (Forecast 2) processed by Cambridge Systematics. Figure 3.2 Growth in Total Weight of Freight Flows by Mode Orange County Tons (in Thousands) 250, , , ,000 50, (Forecast 1) 2040 (Forecast 2) Truck Rail Source: 2010 FDOT Trade and Logistics data, 2009 Full Surface Transportation Board (STB) Waybill data, 2040 Trade and Logistics New Forecast (Forecast 1) processed by Cambridge Systematics, and 2040 FAF3 Based Forecast (Forecast 2) processed by Cambridge Systematics. 18
 to exports (outbound tonnage) and shows that Orange County businesses receive more inbound goods than they ship outbound,")
21 Figure 3.3 highlights the current and future balance of imports (inbound tonnage) to exports (outbound tonnage) and shows that Orange County businesses receive more inbound goods than they ship outbound, translating into a freight trade deficit of 32%. By 2040, the trade deficit is expected to remain constant or decrease slightly to 20%. Increased production of commodities, such as manufactured products, for export in Orange County could reduce the trade deficit and/or lead to more locally produced goods being consumed in the county, potentially reducing overall VMT associated with trucks. Figure 3.3 Imports/Exports by Weight Orange County % 90% 80% 70% 60% 50% 40% 30% 20% 10% 0% 34% 40% 34% 66% 60% 66% (Forecast 1) 2040 (Forecast 2) Import Export Source: 2010 FDOT Trade and Logistics data, 2009 Full Surface Transportation Board (STB) Waybill data, 2040 Trade and Logistics New Forecast (Forecast 1) processed by Cambridge Systematics, and 2040 FAF3 Based Forecast (Forecast 2) processed by Cambridge Systematics. 19
22 Table 3.1 Summary of Orange County Freight Flows by Weight , Tons in Thousands Direction 2010 Truck Rail Total % Change 2040 (Fcst 1) 2040 (Fcst 2) (Fcst 1) 2040 (Fcst 2) (Fcst 1) 2040 (Fcst 2) Total (2010 to 2040 Fcst 1) % Change Total (2010 to 2040 Fcst 2) Inbound 19,609 24,427 28,570 4,269 5,162 4,478 23,878 29,589 33,048 24% 38% From Study Region 7,088 6,542 8, ,088 6,542 8,221-8% 16% Outbound 11,820 19,189 16, ,091 19,626 16,810 62% 39% To Study Region 2,802 4,261 2, ,802 4,261 2,457 52% -12% Intra-county 2,584 3,842 2, ,584 3,842 2,645 49% 2% Through 93, , ,092 N/A a N/A a N/A a 93, , ,092 36% 67% Total 127, , ,616 4,540 5,599 4, , , ,595 37% 58% Source: 2010 FDOT Trade and Logistics data, 2009 Full Surface Transportation Board (STB) Waybill data, 2040 Trade and Logistics New Forecast (Forecast 1) processed by Cambridge Systematics, and 2040 FAF3 Based Forecast (Forecast 2) processed by Cambridge Systematics. a Through rail moves were not included due to the inability to estimate it with the full Surface Transportation Board (STB) Waybill dataset. Therefore, the total through tonnage shown here likely underestimates actual through tonnage due to the lack of through rail data. 20
23 In 2010, about 38.5 million tons of freight moved inbound, outbound, and within Orange County. By weight, nonmetallic minerals, and products made from clay, concrete, glass or stone are the top commodity groups, accounting for 17.8 million tons or 46% of the total tonnage. Warehouse and distribution goods, and food and kindred products are also top commodity groups. By 2040, with the exception of nonmetallic ores and minerals, these commodity groups are expected to have significant growth. Even with the decline or modest growth of nonmetallic ores and minerals, these top four commodity groups are expected to account for 78% to 80% of the shipments (see Figure 3.4). Figure 3.4 Top 10 Commodities by Weight Orange County Farm Products Pulp, Paper or Allied Products Printed Matter Chemicals or Allied Products Petroleum or Coal Products Coal Food and Kindred Products Warehoused Goods Clay, Concrete, Glass, Stone Prod Non-Metallic Ores and Minerals 0 5,000 10,000 15,000 20,000 Tons (in Thousands) 2040 (Forecast 2) 2040 (Forecast 1) 2010 Note: Sum of inbound, outbound, and intracounty freight Source: 2010 FDOT Trade and Logistics data, 2009 Full Surface Transportation Board (STB) Waybill data, 2040 Trade and Logistics New Forecast (Forecast 1) processed by Cambridge Systematics, and 2040 FAF3 Based Forecast (Forecast 2) processed by Cambridge Systematics. 21
24 3.3 Osceola County In 2010, 96.2 million tons of freight moved into, out of, within, and through Osceola County. Table 3.2 displays the 2010 and 2040 freight tonnage by direction and modes. Figures 3.5 and 3.6 illustrate the growth by direction and mode respectively. Approximately 2.6 million tons (3%) traveled inbound, 458,000 tons (less than 1%) traveled outbound, and 12,000 tons (less than 1%) traveled from one point within the county to another. Nearly all freight associated with Osceola County is transported by truck. By 2040, the directional and modal shares are not expected to change significantly and through traffic is expected to account for 97% of all freight associated with Osceola County (93 million tons in 2010 and million tons in 2040). Figure 3.7 highlights the balance of imports (inbound tonnage) to exports (outbound tonnage) and shows that Osceola County businesses receive more inbound goods than they ship outbound, translating into a freight trade deficit of 70%. By 2040, Osceola s trade deficit is expected to range between 60% 77%. Figure 3.5 Growth in Total Weight of Freight Flows by Direction Osceola County Tons (in Thousands) 180, , , , ,000 80,000 60,000 40,000 20, (Forecast 1) 2040 (Forecast 2) Inbound Outbound Intracounty Through Source: 2010 FDOT Trade and Logistics data, 2009 Full Surface Transportation Board (STB) Waybill data, 2040 Trade and Logistics New Forecast (Forecast 1) processed by Cambridge Systematics, and 2040 FAF3 Based Forecast (Forecast 2) processed by Cambridge Systematics. 22
25 Figure 3.6 Growth in Total Weight of Freight Flows by Mode Osceola County Tons (in Thousands) 180, , , , ,000 80,000 60,000 40,000 20, (Forecast 1) 2040 (Forecast 2) Truck Rail Source: 2010 FDOT Trade and Logistics data, 2009 Full Surface Transportation Board (STB) Waybill data, 2040 Trade and Logistics New Forecast (Forecast 1) processed by Cambridge Systematics, and 2040 FAF3 Based Forecast (Forecast 2) processed by Cambridge Systematics. Figure 3.7 Imports/Exports by Weight Osceola County, % 90% 80% 70% 60% 50% 40% 30% 20% 10% 0% 15% 20% 11% 85% 80% 89% (Forecast 1) 2040 (Forecast 2) Import Export Source: 2010 FDOT Trade and Logistics data, 2009 Full Surface Transportation Board (STB) Waybill data, 2040 Trade and Logistics New Forecast (Forecast 1) processed by Cambridge Systematics, and 2040 FAF3 Based Forecast (Forecast 2) processed by Cambridge Systematics. 23
26 Direction 2010 Table 3.2 Summary of Osceola County Freight Flows by Weight , Tons in Thousands Truck Rail Total % Change 2040 (Fcst 1) 2040 (Fcst 2) (Fcst 1) 2040 (Fcst 2) (Fcst 1) 2040 (Fcst 2) Total (2010 to 2040 Fcst 1) % Change Total (2010 to 2040 Fcst 2) Inbound 2,535 2,917 3, ,598 2,974 3,670 14% 41% From Study Region % 5% Outbound % 2% To Study Region % -9% Intracounty % 6% Through 92, , ,872 N/A a N/A a N/A a 92, , ,872 41% 70% Total 95, , , , , ,022 41% 68% Source: 2010 FDOT Trade and Logistics data, 2009 Full Surface Transportation Board (STB) Waybill data, 2040 Trade and Logistics New Forecast (Forecast 1) processed by Cambridge Systematics, and 2040 FAF3 Based Forecast (Forecast 2) processed by Cambridge Systematics. a Through rail moves were not included due to the inability to estimate it with the full Surface Transportation Board (STB) Waybill dataset. Therefore, the total through tonnage shown here likely underestimates actual through tonnage due to the lack of through rail data. 24
27 In 2010, about 3 million tons of freight moved inbound, outbound, and within Osceola County. By 2040, these shipments are expected to grow to about 4 million tons. Nonmetallic minerals, and clay, concrete, glass, and stone products combined account for 2.3 million tons or 74% of total tonnage reflecting the relative strength of the construction industry in the county. By 2040, this share is expected to decrease to 65% to 70% depending on how fast the construction industry picks up over the next 30 years (see Figure 3.8). Figure 3.8 Top 10 Commodities by Weight Osceola County Printed Matter Chemicals or Allied Products Farm Products Lumber or Wood Products Primary Metal Products Petroleum or Coal Products Warehoused Goods Food and Kindred Products Clay, Concrete, Glass, Stone Prod Non-Metallic Ores and Minerals ,000 1,500 2, (Forecast 2) 2040 (Forecast 1) 2010 Tons (in Thousands) Note: Sum of inbound, outbound, and intracounty freight Source: 2010 FDOT Trade and Logistics data, 2009 Full Surface Transportation Board (STB) Waybill data, 2040 Trade and Logistics New Forecast (Forecast 1) processed by Cambridge Systematics, and 2040 FAF3 Based Forecast (Forecast 2) processed by Cambridge Systematics. 25
28 3.4 Seminole County In 2010, 39.5 million tons of freight moved into, out of, within, and through Seminole County. By 2040 these shipments are expected to grow between 26% and 64% to million tons, depending on the forecast scenario. Table 3.3 details the county s freight moves in 2010 and 2040 by direction and mode. Figures 3.9 and 3.10 display the information graphically. Approximately 8 million tons (21%) traveled inbound, 2 million tons (5%) traveled outbound, and 171,000 tons (less than 1%) traveled from one point within the county to another. Through freight accounted for 29 million tons or 73% of the total. About 99% of the freight associated with Seminole County was transported by truck and approximately 1% by rail. In 2040, this mode share is expected to remain constant. Figure 3.11 highlights the balance of imports (inbound tonnage) to exports (outbound tonnage) and shows that Seminole County businesses receive more inbound goods than they ship outbound, thus translating into a freight trade deficit of 60%. Over the next 30 years, the imports/exports balance is expected to remain constant. Figure 3.9 Growth in Total Weight of Freight Flows by Direction Seminole County Tons (in Thousands) 70,000 60,000 50,000 40,000 30,000 20,000 10, (Forecast 1) 2040 (Forecast 2) Inbound Outbound Intracounty Through Source: 2010 FDOT Trade and Logistics data, 2009 Full Surface Transportation Board (STB) Waybill data, 2040 Trade and Logistics New Forecast (Forecast 1) processed by Cambridge Systematics, and 2040 FAF3 Based Forecast (Forecast 2) processed by Cambridge Systematics. 26
 70,000 60,000 50,000 40,000 30,000 20,000 10,000-2010 2040 (Forecast 1) 2040 (Forecast 2) Truck Rail Source:")
29 Figure 3.10 Growth in Total Weight of Freight Flows by Mode Seminole County Tons (in Thousands) 70,000 60,000 50,000 40,000 30,000 20,000 10, (Forecast 1) 2040 (Forecast 2) Truck Rail Source: 2010 FDOT Trade and Logistics data, 2009 Full Surface Transportation Board (STB) Waybill data, 2040 Trade and Logistics New Forecast (Forecast 1) processed by Cambridge Systematics, and 2040 FAF3 Based Forecast (Forecast 2) processed by Cambridge Systematics. Figure 3.11 Imports/Exports by Weight Seminole County % 90% 20% 18% 21% 80% 70% 60% 50% 40% 80% 82% 79% 30% 20% 10% 0% (Forecast 1) 2040 (Forecast 2) Import Export Source: 2010 FDOT Trade and Logistics data, 2009 Full Surface Transportation Board (STB) Waybill data, 2040 Trade and Logistics New Forecast (Forecast 1) processed by Cambridge Systematics, and 2040 FAF3 Based Forecast (Forecast 2) processed by Cambridge Systematics. 27
30 Direction 2010 Table 3.3 Summary of Seminole County Freight Flows by Weight , Tons in Thousands Truck Rail Total % Change 2040 (Fcst 1) 2040 (Fcst 2) (Fcst 1) 2040 (Fcst 2) (Fcst 1) 2040 (Fcst 2) Total (2010 to 2040 Fcst 1) % Change Total (2010 to 2040 Fcst 2) Inbound 8,191 10,650 11, ,474 10,886 12,093 28% 43% From Study Region 3,096 3,550 3, ,096 3,550 3,147 15% 2% Outbound 2,063 2,318 3, ,074 2,333 3,255 12% 57% To Study Region % -21% Intracounty % -24% Through 28,829 36,401 49,302 N/A a N/A a N/A a 28,829 36,401 49,302 26% 71% Total 39,255 49,567 64, ,549 49,819 64,780 26% 64% Source: 2010 FDOT Trade and Logistics data, 2009 Full Surface Transportation Board (STB) Waybill data, 2040 Trade and Logistics New Forecast (Forecast 1) processed by Cambridge Systematics, and 2040 FAF3 Based Forecast (Forecast 2) processed by Cambridge Systematics. a Through rail moves were not included due to the inability to estimate it with the full Surface Transportation Board (STB) Waybill dataset. Therefore, the total through tonnage shown here likely underestimates actual through tonnage due to the lack of through rail data. 28
31 In 2010, about 10.7 million tons of freight moved inbound, outbound, and within Seminole County. In 2040 these shipments are expected to grow 25% 44%, accounting for million tons. Clay, concrete, glass and stone products, combined with nonmetallic minerals account for 6.7 million tons or 63% of total tonnage reflecting the strength of the construction industry in the county. By 2040, this share is expected to decrease to 56%-60% accounting for 8 9 million tons (see Figure 3.12). Figure 3.12 Top 10 Commodities by Weight Seminole County Primary Metal Products Printed Matter Fabricated Metal Products Lumber or Wood Products Food and Kindred Products Chemicals or Allied Products Warehoused Goods Petroleum or Coal Products Non-Metallic Ores and Minerals Clay, Concrete, Glass, Stone 0 2,000 4,000 6,000 8,000 Tons (in Thousands) 2040 (Forecast 2) 2040 (Forecast 1) 2010 Note: Sum of inbound, outbound, and intracounty freight Source: 2010 FDOT Trade and Logistics data, 2009 Full Surface Transportation Board (STB) Waybill data, 2040 Trade and Logistics New Forecast (Forecast 1) processed by Cambridge Systematics, and 2040 FAF3 Based Forecast (Forecast 2) processed by Cambridge Systematics. 29
 Physical, related to the condition or capacity of the transportation infrastructure; 2) Operational, relating to how the transportation system is being utilized; 3) Institutional, relating to the")

. Shippers and receivers generally decide on the appropriate mode to use with consideration for time, cost, convenience and flexibility, and reliability.")
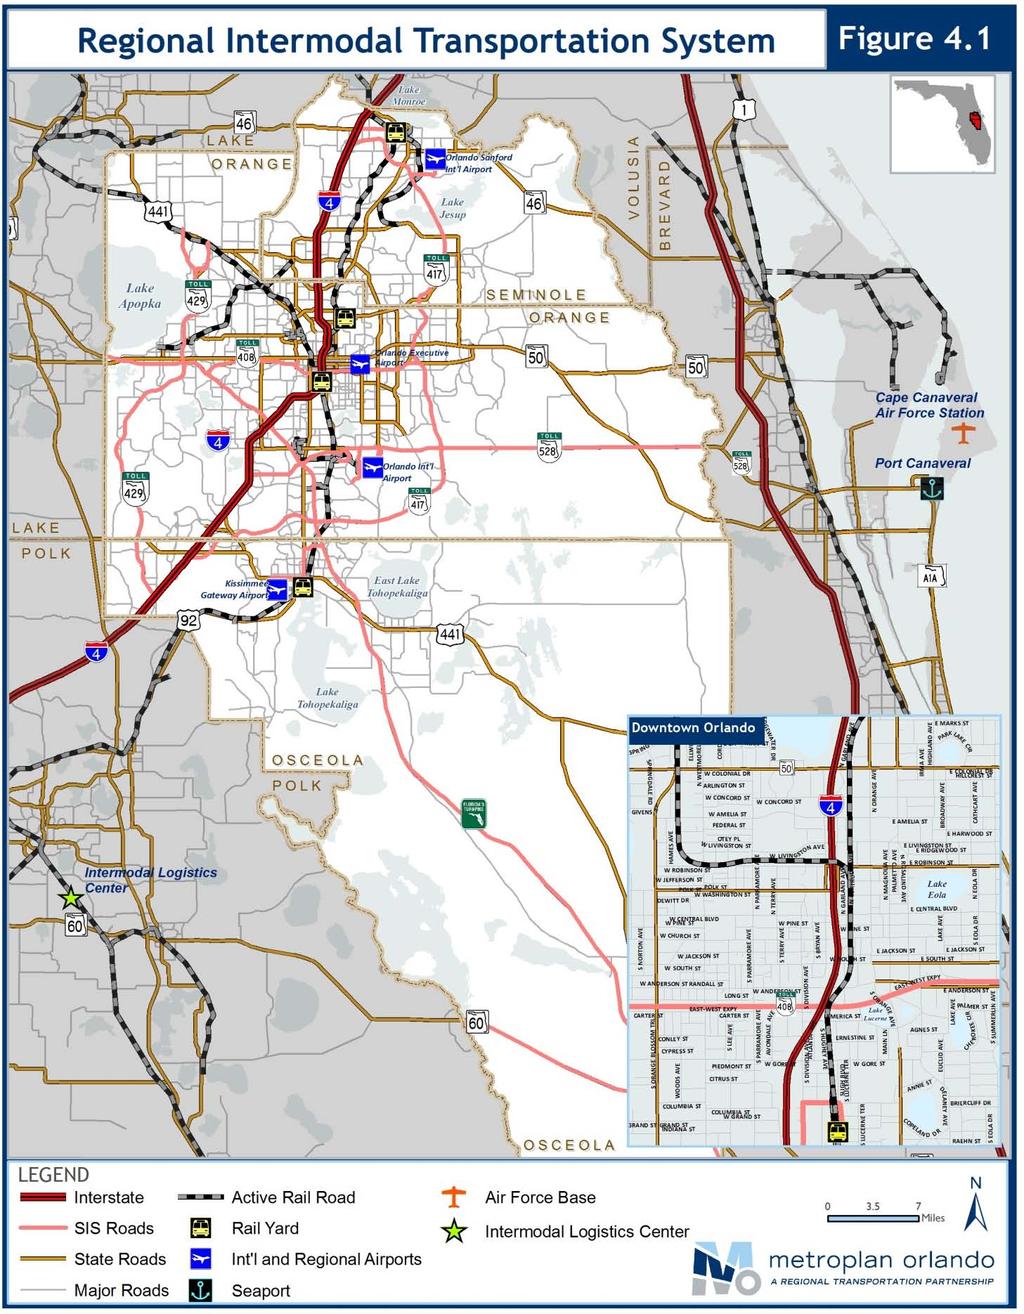
32 4.0 Needs Assessment The purpose of the Needs Assessment is to document existing conditions, forecast future demand, and assess freight transportation deficiencies and bottlenecks in three key areas: 1) Physical, related to the condition or capacity of the transportation infrastructure; 2) Operational, relating to how the transportation system is being utilized; 3) Institutional, relating to the policy and regulatory environment 4.1 Regional Freight System Overview Three main modes of transportation trucks, trains, and airplanes are available to freight users in the MetroPlan region. In addition, the region depends on seaports to accommodate international imports and exports. These transportation modes use existing freight infrastructure, including the region s highways, rail network, airports and support facilities (such as truck to rail transloading facilities and freight-oriented land use). Shippers and receivers generally decide on the appropriate mode to use with consideration for time, cost, convenience and flexibility, and reliability. While some modes have advantages for cost because of the high volume of commodities that can be carried by a single vehicle (i.e., rail or ship), tradeoffs may come in the timeliness of delivery and lack of flexibility at the receiving end. Other modes, such as airplanes, may carry much lower volumes of goods on each flight but can usually assure timely delivery at higher costs. The efficient movement of goods depends on a well functioning transportation infrastructure. Businesses and customers depend on trucks and highways, railroads, and airplanes to connect them to markets and grow the regional economy. Inventorying the freight transportation system in Central Florida and identifying areas of strength and weakness will help planners develop and maintain a system to support economic development. Figure 4.1 displays the MetroPlan region s multimodal freight transportation system. The following sections provide an overview of all modes, including privately owned and operated facilities. 30
33 31
34 4.1.1 Regional Freight Highway Subsystem Generally the most flexible mode of freight transport in the United States, trucks dominate in the MetroPlan region. Shippers can use trucks for short-, medium-, and long-haul trips and to provide the last mile link, connecting commodities carried by other modes from intermediate destinations -- seaports or rail terminals -- to final destinations. Truck movement in the region relies on the interstate system, state and U.S. highways, and local roadways. Freight trucks use the entire roadway system, providing residential areas with garbage collection, offering access to warehousing and distribution, and playing other critical roles for businesses and consumers. Identification of a regional freight subsystem enables investments and policies to focus on improving the facilities where performance matters most to overall regional freight performance. This is desirable because: It fosters better and more sustainable freight service, which in turn promotes economic vitality; It supports productive use of limited public resources by directing them to critical requirements; It leads to greater public safety because freight operations improve on significant routes, and the improvement encourages freight to stay off other roads. An efficient freight subsystem needs to: 1) provide connectivity to the greater Central Florida region and gateways; 2) accommodate goods that pass through the region; and 3) emphasize routes that allow freight to travel efficiently from one part of the region to another. The intra-regional routes are sometimes referred to as cross-town routes, and they correspond to the stem routes that freight carriers use to points and pockets of pickup and delivery. In addition, these routes need to reach the districts where freight is produced and consumed currently and in the future. The primary freight corridors in the MetroPlan region include: I-4 Florida Turnpike SR 528 SR 408 SR 417 Poinciana Boulevard US 192 US US 441 Osceola Parkway SR 60 SR 436 (Semoran Boulevard) SR 423 (John Young Parkway) SR 434 Tradeport Drive SR 520 Landstreet Road Central Florida Parkway Boggy Creek Road SR 15 (Narcoossee Road, Hoffner Avenue, Conway Road) Taft Vineland Road SR 429 SR 19 SR 50 Osceola Polk Line Road 32
35 Major challenges facing the region s highway system from the freight perspective include: The number of functionally obsolete or structurally deficient structures (such as bridges) in the study area is approximately 10% of all structures in Orange, Osceola and Seminole counties. Up to half of all functionally obsolete or structurally deficient structures in the study area may restrict some truck movements. The greatest concentration of crashes involving trucks occurs in the following areas: U.S /441 between SR 50 and Orange/Osceola county line and SR 423 (John Young Pkwy.) between SR 50 and SR 408. Overwhelmingly, the major capacity concern for shippers and carriers of freight in the region is Interstate 4. Many users choose to avoid I-4 and use toll roads with transponder-equipped vehicles to get around the region Railroads The MetroPlan Orlando region is served primarily by CSX Transportation (CSXT) and the Florida Central Railroad (FCEN). CSXT is a Class I railroad that operates 2,800 miles (1,508 route miles) of track in Florida. Both of CSXT s major north-south lines, the A Line and the S Line, terminate in Central Florida, but only the A-line terminates in the MetroPlan region. Currently, there are approximately trains per day operating on the CSXT A Line, including Amtrak passenger trains. The FCEN, a Class III railroad, operates approximately 66 miles of track and interchanges with CSXT in Orlando. The MetroPlan region has limited rail service, which gives rise to the following concerns and challenges for the region s rail network: The existing CSX A-line and the Florida Central line are the only lines that serve the urban population center of the region. Operational changes occurred recently with a portion of the current rail freight traffic re-routed to the CSX S-line and a re-located rail terminal facility in Winter Haven (from Taft) as a result of initiation of the SunRail passenger service on the CSX A-line. Currently, there are approximately trains per day operating on the CSX A-line, including Amtrak passenger trains. Previous studies reported that approximately 42% of the truck traffic in/out of the CSXT Taft facility was destined for the study area market with additional truck traffic passing through the study area. Consequently, it is expected that the relocated rail terminal facility will require longer truck trips on some of the study area s major highway freight corridors. Several stakeholders indicate reliability concerns with rail. One obstacle to making rail freight more competitive with highway is the lack of significant backhaul out of Florida. 33
36 4.1.3 Air Cargo The region s air cargo airports include Orlando International (MCO) and Orlando Sanford International (SFB). These airports handle nearly 190,000 tons of domestic and international air freight annually, most of it loaded in the bellies of passenger carriers. The most prominent airport for air cargo in the region, Orlando International reported 27 separate airlines, providing direct service to 84 domestic destinations and 33 international destinations in MCO currently is targeting Asian and Middle-Eastern markets for direct service, and is directly marketing to several carriers, including: China Air, ANA, Japan Airlines, China Eastern, Cathay Pacific, Air China, Qatar Airways, and Emirates. Air cargo demand in the region is met by current infrastructure. Access to the airports is reported to be very good, compared to competing gateway airports, Atlanta-Hartsfield International and Miami International. Some freight forwarders serving the airports report issues arising once drivers leave the airport, including: eastbound access to I-4 via Tradeport Drive and Taft Vineland Road, at-grade railroad crossings near the airport, congestion at the SR 528 toll both near the junction of SR 436, and the lack of an interchange between the SR 417 Beltway and the Florida Turnpike. Freight Forwarder traffic originating or terminating in the study area is often transited to Atlanta-Hartsfield International or Miami International vs. the region s airports due to such factors as: greater range of destinations, frequency and capacity, block space arrangements with carriers (i.e., guaranteed pre-purchased space on aircraft), greater concentration of support services, and less seasonality/fluctuations of lift capacity. 4.2 Freight Villages The previous Freight Study recommended freight villages within several of the mixed-use areas identified above. Thus, several of the freight villages identified in the 2002 plan that do not have significant existing industrial or commercial use have designated future land uses that indicate a freight need. Table 4.1 provides a summary update on the freight villages identified in the 2002 study, as well as additional freight-intensive areas identified as part of the current effort. 34
37 Table 4.1 Summary Update on Previously Identified Freight Villages and Freight Intensive Land Uses Freight Village Name Jurisdiction Freight Modes Status Established Boundary SIS System Land Use Airport Industrial Park Orlando (AIPO) / Taft / Tradeport City of Orlando/GOAA/Orange County Air, Rail, Highway established None Connectors & OIA & 528 Mixed Use L.B. McLeod Road City of Orlando/Orange County Highway established None I-4 Mixed Use Silver Star Road City of Orlando/Orange County Highway/Rail established None None Mixed Use OIA East City of Orlando/GOAA Highway planned None SR 528 Industrial Oakland City of Oakland Ocoee City of Ocoee Horizon West TownCenter Orange County Highway Retain Potential None SR 429 Mixed Use Hogshead Road City of Apopka Highway/Rail Established None None Industrial Zellwood Orange County Highway/Rail Established None None Industrial Kissimmee Gateway Airport City of Kissimmee Air, Rail, Highway Established Airport Boundary and Airport expansion area SR 417 Southern Extension Osceola County Highway On Hold None Airport, US 17/92 Connector Florida's Turnpike Industrial Mixed Use Poinciana Boulevard Osceola County Highway/Rail Established None None Mixed Use Harmony Research Park Osceola County Highway On Hold None None Mixed Use Yeehaw Transportation Distribution Center Orlando-Sanford International Airport Osceola County Highway Planned Yes City of Sanford Air, Highway, Rail Established Port of Sanford City of Sanford Highway/Rail Established None None Florida's Turnpike, SR 60, Emerging Roadway Airport, Connector SR 417, Connector Mixed Use (mostly warehouse / distribution) Mixed Use mixed use 35
38 Following is a brief description of the primary freight-intensive regions throughout the study region presented by county Orange County The county already has a series of land use policies directed toward industrial uses, but it has not instituted site-specific policies or codes directed at specific locations or development of freight villages. Horizon West A Special Area Plan was recently developed for this area. Although some freight-intensive uses are allowed by code, Horizon West will likely be more of a freight service area for commercial facilities, and the freight village designation should remain to protect those opportunities. There is a potential east/west connector to US 27 that would likely be a toll road and draw additional freight traffic. Figure 5.3 displays the current and future land use for this area. Silver Star This area is fragmented between city and county jurisdiction, making cohesive freight village policies or codes difficult to achieve. There is no Joint Planning Agreement (JPA) in place between the City of Orlando and Orange County that could facilitate developing these types of policies or codes. Silver Star will remain an industrial hub and will likely grow with more industrial and distribution uses (see Figure 5.4). There is potential to consolidate with industrial uses north of SR 50 and with county properties. This area needs more study. Taft/Tradeport and Airport Industrial Park Orlando (AIPO) This area was previously designated as two freight villages in the 2002 Freight Mobility study. For this case study, the entire area is considered as one district with four distinct areas in order to derive differences between the multiple and varied freight-intensive land use patterns. The district has continued opportunities for growth and redevelopment and is an important area in which to identify best practices associated with creating a freight village land use pattern. Previous studies labeled one potential freight village as Landstreet-Vineland or Taft and the other as Boggy Creek Road. Boggy Creek Road was not identified as a separate freight village in the MetroPlan Orlando 2030 LRTP. For the purposes of updating the status of each of these areas and this case study, the names Taft and the AIPO are used. The AIPO is a specific Planned Unit Development designation within the City of Orlando s jurisdiction. The remaining areas within the district are split between Orlando and Orange County with most of the area within unincorporated Orange County. 36
39 Hogshead This area is landlocked and expects to see modest growth in industrial land uses. There are also infrastructure constraints, limiting the ability for increased density and expansion. This area has been annexed by the City of Apopka. Zellwood This area is landlocked and does not expect to see any more growth intensification. Additionally, this area is mostly served by water wells and septic tanks, which also places limits on increasing intensity. L.B. McLeod Road The industrial character and land uses in this area will be preserved. It is a viable potential freight village, although it is mostly small-scale specialty manufacturing. Values are rising in the area, and it is becoming a design destination for small-scale manufacturing. OIA East This area has a new emphasis on industrial development and should be studied as a greenfield freight village potential site Osceola County Kissimmee Gateway Airport This area is basically already a freight village. There is a specific policy associated with Airport Expansion Land Use Designation that includes airport supportive uses and a Floor to Area Ratio (FAR) of up to 0.5. Additional studies are about to get under way. Southwest of the airport is problematic for expanding industrial uses and specific freight policies due to the existing residential development and the fragmented jurisdictions. Some industrial uses within the area would like to see a spur head north from the existing rail line on the SE boundary of the airport. There are multiple road expansions planned and in the works that will increase capacity and access in and around the airport area (Hoagland Blvd. and Martin Luther King Blvd.). The Vine Street overlay district, adopted in 2010, calls for all mixed-use and gives an advantage to the already designated industrial uses in the airport area for attracting future industrial uses away from this corridor. Harmony Research Park The Harmony Research Park is close to the future Southport Connector, an important leg of the overall Osceola County Expressway Authority s master plan for the loop that connects SR 429 to SR 417. The Research Park is an important component of the Harmony Master Planned Community. Based on land uses shown in Figure 5.8, the viability of creating a freight village in the area is questionable and needs more study and consultation with land owners. 37
40 Poinciana Boulevard The county does not want to lose the existing industrial character of the area and is looking at potential expansion for industrial land uses (see Figure 5.9). The area is complex and needs special attention due to the arrival of SunRail, the pressure for residential development, existing industrial expansion plans, and the desire for more freight rail service by existing facilities. This area needs more study, and there has been no effort to remove any industrial land uses. It remains a viable location for a freight village study. Yeehaw Junction The Yeehaw Transportation Distribution Center (YTDC) is located at the intersection of Florida s Turnpike, US 441, and SR 60, an area known as Yeehaw Junction. The roads surround the site and create an island of development potential within rural southeast Osceola County. The area was first identified as a potential freight village in the 2002 Freight Mobility study. This is a strategic location given the intersection of multiple major highways providing a central access point for potential distribution and logistics centers for goods traveling throughout the region Seminole County Port of Sanford Much of the industrial land in this area is transitioning to other uses. The effect of SunRail will likely speed the transition away from industrial. There are still significant freightintensive industrial uses, and some would like to see more industrial and rail access. There currently are no specific policies or codes based on freight-intensive uses for the area. Nor is there a specific boundary. There are enclaves of various jurisdictions in the area that would make it difficult to institute an area-wide freight village designation. A formal freight village would likely disturb the existing residential communities. Orlando-Sanford International Airport Some land south of Lake Mary Boulevard is transitioning away from industrial, and there are no specific policies in place. Depending on the airport s long-term plans, especially if they are planning on increasing freight traffic, there could be a viable freight village in and adjacent to the airport. The Aloma Line runs freight from the Port of Sanford on Tuesdays and Thursdays twice a day. Some users would like more access, but some are already thinking of passenger rail to the airport from the SunRail station. Any freight village policies or codes would require a collaborative effort between Sanford, Seminole County, and the airport. 38
 institutional and regulatory bottlenecks. This report presents solutions to address the needs.")


41 5.0 Regional Solutions and Recommendations The assessment revealed three primary categories of needs and deficiencies: 1) capacity and congestion; 2) community impacts, including air quality and safety; and 3) institutional and regulatory bottlenecks. This report presents solutions to address the needs. Addressing the needs and deficiencies will require multifaceted solutions that include physical infrastructure, operational and institutional recommendations. Physical infrastructure refers to investment in improving and/or expanding the transportation system such as roadways, rail and ports. The improvements may include new facilities, capacity enhancements or reconstruction to existing facilities, and maintenance activities such as repaving. Infrastructure Operational solutions focus on improving the efficiency and velocity of the existing system. Examples include improving signage and way-finding programs, synchronizing traffic signals to maximize flows, altering the time of day traffic is on the roadways to make better use of the infrastructure throughout the day, and providing real-time traffic data and information to dispatchers and drivers. Operations Institutional Institutional solutions focus on policies, regulations and governance issues that can affect goods movements and the communities affected by them. Institutional bottlenecks arise from industry regulations, such as truck size and weight and drivers hours of service rules. Local, regional and state governance over publicly owned assets such as roadways leads to local officials having total responsibility (including funding) for local roads that may have regional, state or even national roles in terms of freight. Other considerations involve public policies, such as how projects are selected and prioritized in the regional, state, and federal planning processes. 5.1 Infrastructure Solutions and Recommendations Following identification of needs on the regional freight highway subsystem, the review process for each location included ground observation, examination of GIS data for existing and future conditions, level of service analysis for existing and future conditions, and GPS truck delay data. Stakeholder interview responses were part of the recommendations development process. A complete list of identified improvements categorized as near-, medium-, and long-term is provided in Table
42 Table 5.1 Regional Freight System Infrastructure Solutions and Recommendations Location/Roadway Improvement Type Improvement Details Timing Notes Orange County US 17/92 near Florida's Turnpike US 17/92 near Florida's Turnpike Operational Signal timing improvements Near term Operational Access management Near term SR 50 at US 17/92 Policy Local and regional planners coordinate with local business owners to designate off-peak freight movement Near term SR 50 at US 17/92 Operational Signal timing improvements Near term SR 50 at SR 408 Operational Signal timing improvements Near term Orlando International Airport Operational TSM / operational strategies (i.e. signal coordination) along Tradeport Dr. Near term Orlando Amtrak / Intermodal Yard Operational Improve directional signage to and from Orlando Amtrak station Near term Orlando Amtrak / Intermodal Yard Operational Preservation of freight land uses. Near term Station to be used for SunRail. Area currently designated for industrial land uses. Location has potential for I-4 Ultimate material shipping and receiving. Orlando Amtrak / Intermodal Yard PLANNED realignment and improvements to accommodate future BRT along Sligh Boulevard Near term 40
43 Orlando Amtrak / Intermodal Yard Operational TSM / operational strategies (i.e. signal coordination) along Tradeport Dr. Near term Taft Center Institutional Add facilities to freight sub-network Near term Connector is Atlantic Ave to Landstreet Rd and Orange Ave, Landstreet Rd, Boggy Creek Tradeport Drive Institutional Request by Local Government Near term Add to freight sub-network Taft-Vineland Road Institutional Request by Local Government Near term Add to freight network; widening to four lanes from US 441 to SR 527 Landstreet Road Institutional Request by Local Government Near term Add to freight sub-network Central Florida Pkwy Policy Enforce weight restrictions Near term Google Maps screen capture shows truck violations; Only weight-restricted roadway in Orange County. Central Florida Pkwy Operational Move weight restriction signage to before bridge allowing heavy trucks the opportunity to turn off the road Near term SR 15 (Narcoossee Rd, Hoffner Ave, Conway Rd) Institutional Request by Local Government Near term Add to freight sub-network Taft Vineland Road Institutional Request by Local Government Near term Add to freight sub-network US 17/92 near Florida's Turnpike Develop alternative routes to OBT including new roadway connections to west of Turnpike (i.e. Landstreet) Mid range SR 50 at US 17/92 Operational Reconstruct intersection plateau Mid range Orlando International Airport Add an exclusive NB right-turn lane on Tradeport Dr at Boggy Creek Rd and Tradeport Dr. Mid range 2010 SIS Connectors Study 41
44 Orlando Amtrak / Intermodal Yard Add an exclusive NB right-turn at Division and Columbia St. Mid range 2010 SIS Connectors Study Orlando Amtrak / Intermodal Yard Add an exclusive WB right-turn at Division and Columbia St. Mid range 2010 SIS Connectors Study US 17/92 near Florida's Turnpike PLANNED improvements/roadway widening's throughout interchange area Interstate 4 at SR 408 Design-build project underway for I-4 Ultimate improvements Edgewater Drive Widening and turn lanes Serves Silver Star freight village John Young Parkway (SR 423) SR 50 at SR 408 Orlando International Airport Widening from SR 50 to Shader Road PLANNED improvements/widening (western widening near Dean Rd currently underway) --- PLANNED development of east airfield. On priority list for County but Construction not funded Recent interchange improvements have also address the issue Orlando International Airport PLANNED Passenger Rail service from SR 528 to Terminal (All Aboard Florida Proposal) along Jeff Fuqua Blvd from airport to SR 528 Orlando International Airport PLANNED widening from 4 lanes to 6 lanes in 2020 on Tradeport Dr from airport to SR SIS Connectors Study Orlando International Airport Add second EB through lane on Boggy Creek Rd at Tradeport Dr. and Boggy Creek Rd SIS Connectors Study 42
45 Orlando International Airport Add second WB through lane on Boggy Creek Rd at Tradeport Dr. and Boggy Creek Rd SIS Connectors Study Orlando Amtrak / Intermodal Yard Add an exclusive NB right-turn lane for EB off-ramp SIS Connectors Study Orlando Amtrak / Intermodal Yard Operational Signalize Division Ave. and Columbia St. (if warranted) Orlando Amtrak / Intermodal Yard Kaley Ave from Division Ave to I-4 - Widen from 4 lanes to 6 lanes Orlando Amtrak / Intermodal Yard PLANNED widening from 2 lanes to 4 lanes in 2020 on Division Ave from Columbia St to Kaley Ave Taft Center Operational Preserve service to the freight yard (service will be shifting to S Line) Taft Center PLANNED area improvements anticipated to pull non-freight traffic thereby preserving the good service of the facility Innovation Way Corridor Model shows significant truck volumes Emerging area for development Innovation Way Corridor Policy Freight use may be incompatible with existing residential LU on existing western portion of roadway Boggy Creek Rd PLANNED improvement identified by County: Widening segments from South Access Road to Weatherbee Road and Osceola County Line to GreeneWay to four lanes Emerging area for development No funding available/identified; Analysis from this report plus stakeholder input pushes a need for the improvement. Funding continues to be an issue. 43
46 Osceola County US 192 at US 17/92 Operational Traffic management strategies Near term Kissimmee Gateway Airport Operational Add a signal at Hoagland Blvd. and 5th St. intersection (if warranted) Near term 2010 SIS Connectors Study Kissimmee Gateway Airport Operational Modify EB shared through and right turn lane to exclusive through and right turn lanes at US 192 and Thacker Rd Near term 2010 SIS Connectors Study Kissimmee Gateway Airport Add second NB left turn lane at Thacker Avenue and US 192 Near term 2010 SIS Connectors Study CR 531/CR 471 Institutional Request by local planners Near term Add to freight sub-network Kissimmee Gateway Airport Add second EB left turn lane and second WB left-turn lane at Thacker Avenue and US 192 Mid range 2010 SIS Connectors Study Kissimmee Gateway Airport Add third WB left turn lane at Osceola Pkwy and Michigan Ave Mid range 2010 SIS Connectors Study Kissimmee Gateway Airport Add second NB through lane at Osceola Pkwy. and Michigan Ave Mid range US 17/92 at Poinciana Blvd PLANNED 17/92 widening to 6L 2010 SIS Connectors Study US 192 at US 17/92 Address capacity constraints by focusing on mass tourist transportation options (i.e. streetcar/trolley) US 192 near Florida's Turnpike PLANNED roadway widening Kissimmee Gateway Airport PLANNED areawide improvements Kissimmee Gateway Airport Add second WB left-turn at US 192 and Hoagland Blvd Modify SB right turn lane at US 192 and Thacker Rd. to shared right and through lane 2010 SIS Connectors Study 44
47 Kissimmee Gateway Airport Add third NB left turn lane at Osceola Pkwy. and Michigan Ave 2010 SIS Connectors Study Kissimmee Gateway Airport Widen Hoagland Blvd from airport to US 17/92 from 2/4 lanes to 6 lanes Kissimmee Gateway Airport Realign Hoagland Blvd Seminole County CSX Transflow Bulk Facility Institutional Add Airport Blvd, Jewitt, MLK to freight sub-system Near term CSX Transflow Bulk Facility Operational Pavement resurfacing on Persimmon Ave. from SR 46 to Amtrak Tracks Near term 2010 SIS Connectors Study Orlando Sanford International Airport and Surrounding Industrial Areas Policy Develop freight policies to guide development of future industrial LU Near term Orlando Sanford International Airport and Surrounding Industrial Areas Policy Preserve industrial lands along Lake Mary Blvd for future industrial economic opportunities Near term Orlando Sanford International Airport and Surrounding Industrial Areas --- Be mindful of incompatible LUs (i.e. residential located against future industrial LU Near term Orlando Sanford International Airport and Surrounding Industrial Areas Operational Modify shared SB right-turn to exclusive lanes ( i.e. add one SB right-turn lane) at Lake Mary CR 427/Sanford Ave Near term 2010 SIS Connectors Study Orlando Sanford International Airport and Surrounding Industrial Areas Policy Limited designated routes for truck access due to residential development surrounding airport support areas. Identify route for truck access. Near term CSX Transflow Bulk Facility Operational Add a new signal at Persimmon Ave. ( if warranted) Mid range 2010 SIS Connectors Study 45
48 CSX Transflow Bulk Facility Operational Improve directional signage for Amtrak station along the connector Mid range 2010 SIS Connectors Study CSX Transflow Bulk Facility Operational TSM /Operational strategies (i.e. signal coordination) Mid range 2010 SIS Connectors Study Orlando Sanford International Airport and Surrounding Industrial Areas Add third EB Left-turn lane, third WB left-turn lane and second NB left-turn lane at Lake Mary CR 427/Sanford Ave Mid range 2010 SIS Connectors Study Orlando Sanford International Airport and Surrounding Industrial Areas Operational Improve directional signage to/from the airport Mid range Interstate 4 at SR 436 PLANNED single point interchange as part of I-4 Ultimate improvements CSX Transflow Bulk Facility PLANNED widening of Persimmons Ave CSX Transflow Bulk Facility Widen Jewitt Lane and improvement pavement/turning radii CSX Transflow Bulk Facility Add second NB left-turn at I-4 NB offramp to WB SR SIS Connectors Study CSX Transflow Bulk Facility Add second WB right-turn at I-4 NB offramp 2010 SIS Connectors Study CSX Transflow Bulk Facility Add third NB left-turn at Town Center Blvd 2010 SIS Connectors Study CSX Transflow Bulk Facility Add third NB left-turn at Rinehart Rd 2010 SIS Connectors Study CSX Transflow Bulk Facility Widen SR 46 from Amtrak to I-4 from 4 lanes to 6 lanes Orlando Sanford International Airport and Surrounding Industrial Areas Look for opportunities for alternative access to separate freight and nonfreight activities 46
49 Orlando Sanford International Airport and Surrounding Industrial Areas PLANNED widening from 4 lanes to 6 lanes in 2020 along Lake Mary Blvd Orlando Sanford International Airport and Surrounding Industrial Areas Add second SB RT at Lake Mary CR 427/Sanford Ave 2010 SIS Connectors Study Orlando Sanford International Airport and Surrounding Industrial Areas Add EB through at Lake Mary CR 427/Sanford Ave 2010 SIS Connectors Study 47
50 5.2 Operational Solutions and Recommendations Input from stakeholders indicated operational solutions should receive priority. Operational improvements represent a critical element of the freight mobility strategy making it possible to get more use out of the existing regional infrastructure by increasing efficiency. This strategy is important, considering financial constraints facing the region. Operational improvements are relatively lower cost with shorter implementation timeframes. Operational strategies can be divided into two categories public sector improvements and private sector initiatives. Key solutions and recommendations, in addition to those noted for specific facilities in the previous section, are discussed below. Recommendation: Prepare a Regional Truck Route Map and Identify Freight Facilities Signage Improvements. Truck routing strategies and restrictions vary by local jurisdictions. Some cities and counties have an extensive truck route system, while others have limited guidance to the trucking industry on preferred routing. It is recommended that Central Florida prepare a Regional Truck Route Map with the priority freight highway subsystem noted as the preferred routing. The map would inform transportation providers and carriers of regional truck routes and restrictions. Many truck drivers are not from the region and, some are first-time visitors. Drivers unfamiliar with the region depend on signage to direct them to designated truck routes and pick-up and deliveries. Insufficient or ineffective signage leads to delays for drivers and increases VMT and VHT. Recommendation: Implement a Freight-User Communications Program. Increasing the use of highway system information from regional traffic management centers (RTMC) has wide appeal among stakeholders. Better use of real-time traffic incident and delay-related information is a tremendous opportunity. Officials at FDOT and private sector freight stakeholders have expressed interest in developing freight specific programs. The District 5 RTMC is co-located with the Florida Highway Patrol Troop D Headquarters and the FDOT District 5 Orlando Urban Office at 133 South Semoran Boulevard, Orlando. This RTMC is the regional hub for the Central Florida Intelligent Transportation Systems (ITS). This system includes hundreds of closed-circuit television cameras, dynamic message signs, and vehicle detector sensors on I-4, I-95, and other arterial state roads. A program that encourages directly sharing information between RTMC staff and dispatchers for major regional freight carriers on stakeholder-identified freight roadways is recommended. These contacts would share information on crashes, construction and general congestion for dispatchers to pass on to truck drivers, in addition to making the data available on the 511 system via a freight specific page. 48
51 Recommendation: Implement an Off-Peak Delivery Pilot Program Promoting Off-Peak Freight Operations in Key Commercial Areas. Building on similar programs by private sector shippers in other U.S. metro regions, a program should encourage off-peak deliveries. Coordination between the MetroPlan Orlando, FDOT staff, and local communities can identify commercial or industrial areas willing to lead the program. A potential proposal is to focus on corridors such as the heavily commercialized sections of SR 50 identified as top truck delay bottlenecks or major facilities like Orlando Health (being examined as a pilot under the FHWA FRATIS program). Upon completion of a pilot program, the usefulness of strategies can be assessed and potentially applied to other areas. Business districts and corridors with dense retail and commercial loading and unloading activity with relatively low proximity to residential areas should be given priority. 5.3 Institutional Solutions and Recommendations Comprehensive goods movement requires a regional approach to planning, public awareness of the challenges and benefits of freight movement, and a planning process that institutionalizes freight needs. These recommendations address the institutional and policy aspects necessary to promote freight mobility. Recommendation: Develop a Performance-Based Process for Implementing and Funding Investments in the Freight System. Perhaps the biggest challenge facing the region is funding the necessary freight improvements. A significant portion of the benefits from the recommended improvements will flow outside the region or to the private sector, which suggests a funding program based on the allocation of benefits received is desirable. The first step in accomplishing a benefit or performance-based funding system is to establish a framework for quantifying and allocating the benefits. The framework must be transparent and replicable while not being resource prohibitive. It will require cooperation between the public and private sectors as well as among levels of governments. For example, because the region plays a significant role in freight flows statewide, the framework should account for benefits that accrue to the state to position the region for federal and state funding. The criteria developed as part of the Central Florida Regional Freight Mobility Study include factors that account for mobility, economic, environmental, safety and community impact benefits. While these follow the goals laid out in FDOT s statewide long range plan, the specific measures are different. FDOT is completing its project prioritization framework for the statewide freight study. Staff for MetroPlan Orlando, local governments and FDOT District 5 should participate in these discussions and share the criteria developed as part of the current effort. In the end, the region s framework needs to combine regional and statewide goals and objectives. 49
52 Recommendation: Provide Local Government Freight-Related Training and Building. The limited exposure of governmental planning staff regarding freight planning principles is a challenge for the region. It is recommended that MetroPlan Orlando continue to train regional transportation planning staff on freight basics. This training should include providing access and notification to national resources available through programs such as NCFRP, FHWA Freight Office research and SHRP; resources available from FDOT; courses and workshops available through NHI, I-95 Freight Academy and FDOT s newly established freight academy; and freight specific conferences and events. Staff charged with managing and overseeing regional plans and studies should have a working knowledge of freight transportation needs and requirements. This can be accomplished by conducting and/or sponsoring required freight planning training sessions and workshops. Recommendation: Incorporate Freight-Specific Measures into Project Prioritization Procedures. It is recommended that MetroPlan Orlando integrate freight and goods movement into the planning process by incorporating freight specific project criteria into project selection and prioritization. The purpose is to evaluate all projects for impact on freight, so that projects improving both passenger and goods mobility will receive additional support. Recommendation: Develop an Ongoing Regional Freight Program. Successful goods movement strategies will require ongoing coordination and management. Establishing a Regional Freight Program between Central Florida s MPOs, TPOs and FDOT District office could provide such functions. Like MetroPlan Orlando, other regions have conducted analyses of regional freight demand, needs and deficiencies. Many developed lists of recommendations and an implementation plan. However, the key to moving from study to action in these regions was formalizing a freight program. While many aspects of freight programs vary depending on regional priorities and characteristics, three elements are common across the most notable programs: An effective Regional Freight Advisory Council; An ongoing regional freight data program; Freight representation in all transportation planning activities. 50
53 Notable Impacts of Freight Advisory Councils Delaware Valley Goods Movement Task Force supports freight mobility improvements in 9 counties, 4 cities, and 353 municipalities in Pennsylvania and New Jersey. In 2003, the FAC influenced decision-makers to obligate approximately $3 million from Congestion Mitigation and Air Quality funds for freight projects, including an automated marine terminal gate, truck rest facility, idling equipment, rail line extension, and transload and cross-dock facilities. Baltimore Freight Movement Task Force focuses on improving communications among public and private sector freight stakeholders; identifying short-term impediments to and recommending improvements for the efficient, effective, environmentally sensitive, and safe movement of freight in Maryland; and providing input into the allocation of long-term transportation resources for freight. Some of its major accomplishments include the completion of a Truck Parking Study along the I-95 corridor in the Baltimore region, development of a new truck traffic-forecasting model, placement of new signage along major freight routes, and intersection improvements to help mitigate freight bottlenecks in the Baltimore region. Source: FHWA Engaging the Private Sector in Freight Planning. Recommendation: Regional Freight Advisory Council A regional freight advisory committee can be invaluable in ensuring that freight transportation needs are met while reducing negative impacts, including safety, emissions, noise, and other neighborhood effects. A freight advisory council normally includes key private and public sector stakeholders with a working knowledge of the region s freight transportation system. Example of potential private sector members include representatives from the region s railroads, Publix distribution, Saddle Creek Logistics, Florida s Natural Cooperative, FedEx Freight, UPS, Freeman Company, Waste Management, and Florida Trucking Association. The freight advisory council assembled for the current effort lays the foundation for an effective group. It is recommended that membership of this group include some of the private sector stakeholders interviewed as part of this study. In addition, the involvement of this group in the transportation planning process could continue by providing input on the impact of all projects for the freight community. Recommendation: Freight Data Program One challenge of freight planning is that data requirements and sources are very different than those of passenger planning. To fully integrate freight into the planning process, MetroPlan Orlando needs a continuous freight data collection program. Much like passenger travel, models and forecasts need to be updated regularly, and data necessary to do those updates for freight are not readily available. A comprehensive data set for the freight subsystem and freight related land use has been developed and delivered as part of the current effort. The region should develop a plan for maintaining and updating the data by assigning roles and responsibilities for gathering, submitting and housing the data set. In addition to the data collected and submitted for the current effort, FDOT has recently 51
54 obtained a comprehensive set of commodity flow data and forecasts at the state and county levels for sharing with the MPOs and districts. Recommendation: Integration of Freight into Regional Planning The MetroPlan Orlando region increasingly relies on freight transportation to support economic development. Public transportation agencies are being challenged to support modern business supply-chain management through investments and policies affecting transportation providers across all modes. To help the region s businesses succeed in global trade, public sector agencies responsible for transportation planning must foster integrated systems by supplying infrastructure that can support responsive, reliable transport for goods and people. There has been growing interest among state and local governments, as well as in the greater business community, regarding the impact of freight movements on economic vitality. and the research points to consequences of inadequate or unreliable transportation systems. However, state and local transportation agencies have struggled to identify, incorporate, and implement freight supportive projects into their planning and project implementation programs. Steps MetroPlan Orlando and local governments can take to integrate freight into planning activities include: Engage a freight stakeholder (or freight advisory council member) on major project advisory committees and technical coordinating committees; Incorporate freight-specific criteria for project evaluation for alternatives analysis and recommendation screening; Reach out to freight stakeholders as part of the public involvement process; Evaluate impact of all projects on freight movement as well as passenger mobility; Increase freight planning training for project managers; Develop freight performance measures to monitor progress; Implement ongoing outreach activities to elected officials and the public on freight transportation needs and impacts. 52
")
55 Source: Federal Highway Administration (FHWA) 53
Central Minnesota. Regional Freight Profile
 Central Minnesota Regional Freight Profile Working DRAFT May 21 Minnesota Department of Transportation The purpose of the Central Regional Freight Profile is to document freight movement trends in the
Chapter 1 Introduction
 Chapter 1 Introduction KEY POINTS The amount and value of freight are critical components of the overall economic health of Missouri. Missouri s multimodal freight system supports the movement of trucks,
2016 Mid-Continent Transportation Research Symposium, October 24-25, Donna Brown-Martin, Director Bureau of Planning and Economic Development
 2016 Mid-Continent Transportation Research Symposium, October 24-25, 2016 Donna Brown-Martin, Director Bureau of Planning and Economic Development Why the State Freight Plan is Important to You Vision,
Dennis Leong, Toni Rice, and Kathleen Spencer March 27, 2013
 Dennis Leong, Toni Rice, and Kathleen Spencer March 27, 2013 Northwoods Rail Transit Commission (NRTC) Why study freight rail in northern Wisconsin? Counties in the study area Photo: Wisconsin State Historical
Morris County Freight Profile
 Morris County Freight Profile 2040 Freight Industry Level Forecasts ABOUT THIS PROFILE The NJTPA has developed a set of alternative freight forecasts to support transportation, land use, and economic development
SWOT Analysis of Commodity Flow Datasets
 SWOT Analysis of Commodity Flow Datasets prepared for FDOT Transportation Statistics Office prepared by RS&H, Inc. 5/6/2015 Background Many users work with commodity flow data Modelers GIS analysts Policy
Florida Freight Supplychain Intermodal Model
 Florida Freight Supplychain Intermodal Model Innovations in Travel Modeling 2014 April 29, 2014 Introduction Support freight plan development Office of Freight Logistics and Passenger Operations Evaluate
Technical Report. Assessment of Existing and Future Freight Issues
 Contract 2012-001 July 24, 2013 Prepared by: HDR Engineering, Inc. 1. Report Summary This report evaluates various issues relative to the freight rail service that the Seminole Gulf Railway (SGLR) currently
Inland Port Cargo Complex
 Inland Port Cargo Complex Regional Approach for Ports A statewide improvement Connects five plus seaports Promotes connectivity utilizing existing transportation network Improves rail efficiencies Relocates
SR 417 Extension. June 2003 INTRODUCTION AND HISTORY PROJECT SCOPE AND PURPOSE STUDY OBJECTIVE STUDY PHASES
 Planning Feasibility Study June 2003 INTRODUCTION AND HISTORY The SR 417 Extension Study was a yearlong effort undertaken by Florida s Turnpike Enterprise to investigate the feasibility of a new toll road
Class I Railroad Statistics
 Class I Railroad Statistics Class I Railroads Class I Railroads are U.S. line haul freight railroads with operating revenue in excess of $266.7 million. Two Canadian railroads, Canadian National Railway
Rail - What Does the Future Bring?
 Rail - What Does the Future Bring? Jeannie Beckett Sr. Dir., Inland Transportation Port of Tacoma Oct 18, 2007 The Rail Networks Railroads Media Blitz Print Ads TV Ads Radio Ads D:\aapa\ RailroadsPSA.wmv
Delaware Department of Transportation Agriculture Supply Chain Study: Transportation Supply Chain Analysis ihs.com
 IHS TRANSPORTATION CONSULTING Delaware Department of Transportation Agriculture Supply Chain Study: Transportation Supply Chain Analysis ihs.com Overview of Findings Delmarva Freight Summit June 24 th,
The Policies section will also provide guidance and short range policies in order to accomplish the goals and objectives.
 4 Goals & Objectives INTRODUCTION The 2015-2040 MTP preserves and promotes the quality of life and economic prosperity of the MAB by providing a transportation system consistent with the regional goals.
Southeast Florida Freight and Goods Movement Update Treasure Coast Regional Planning Council September 16, 2011
 Southeast Florida Freight and Goods Movement Update Treasure Coast Regional Planning Council September 16, 2011 For Questions on this Presentation, Please Contact: Jeff Weidner, Mobility Manager Florida
The Future of Trucking in Virginia: Interstate and Intermodal Strategies
 The Future of Trucking in Virginia: Interstate and Intermodal Strategies Randy Mullett Vice President - Government Relations & Public Affairs, Con-way Inc. Virginia Global Logistics Forum December 7, 2011
The Des Moines Metropolitan Organization. Rail Market Analysis
 The Des Moines Metropolitan Organization Rail Market Analysis January 31, 2014 Table of Contents Project Overview... 1 Market Overview... 1 Overview of Des Moines and Iowa Market... 2 Current Infrastructure...
LATTS II - Freight Investment Decision Principles
 LATIN AMERICA TRADE AND TRANSPORTATION STUDY (LATTS) II Emerging Principles in Freight Investment Decision Abstract An extremely important component to effective transportation planning and to this point
Are We Prepared for the Energy Movements? JEANNIE BECKETT THE BECKETT GROUP ENERGY EXPORT PERMITTING IN THE NW JUNE SEA-TAC CONFERENCE CENTER
 Are We Prepared for the Energy Movements? JEANNIE BECKETT THE BECKETT GROUP ENERGY EXPORT PERMITTING IN THE NW JUNE 16 2014 SEA-TAC CONFERENCE CENTER Topics Capacity existing infrastructure Further rail/port
Canaveral Port Authority: Rail Extension Update
 Rail Extension Update Canaveral Port Authority: Rail Extension Update Thursday, April 30, 2015 5:30 to 6:30 p.m. Port Canaveral Maritime Center John Walsh CEO, Canaveral Port Authority Jim Dubea Speakers
Freight Transportation Megatrends
 Freight Transportation Megatrends Copyright 2006 Global Insight, Inc. Freight Demand Modeling: Tools for Public-Sector Decision Making Conference Paul Bingham Global Insight, Inc. Washington, DC September
Factors Affecting Transportation Decisions. Transportation in a Supply Chain. Transportation Modes. Road freight transport Europe
 Transportation in a Supply Chain Factors Affecting Transportation Decisions Carrier (party that moves or transports the product) Vehicle-related cost Fixed operating cost Trip-related cost Shipper (party
MAINE TRANSPORTATION BY THE NUMBERS:
 MAINE TRANSPORTATION BY THE NUMBERS: Meeting the State s Need for Safe and Efficient Mobility OCTOBER 2012 202-466-6706 www.tripnet.org Founded in 1971, TRIP of Washington, DC, is a nonprofit organization
CTS Freight and Logistics Symposium. Minneapolis, MN November 30, 2007
 CTS Freight and Logistics Symposium Minneapolis, MN November 30, 2007 Freight Analysis Freight Growth = Business Vitality District 7 Freight Project Goals Put in context of Statewide Freight Study (2005)
IOWA TRANSPORTATION BY THE NUMBERS:
 IOWA TRANSPORTATION BY THE NUMBERS: Meeting the State s Need for Safe and Efficient Mobility MARCH 2013 202-466-6706 www.tripnet.org Founded in 1971, TRIP of Washington, DC, is a nonprofit organization
2040 Transportation Policy Plan Conversion to Performance Based Planning Basis. 25 th Annual CTS Transportation Research Conference May 21, 2014
 2040 Transportation Policy Plan Conversion to Performance Based Planning Basis 25 th Annual CTS Transportation Research Conference May 21, 2014 1 About the plan Long-range transportation plan for the Twin
Appendix A: Class I Railroad Subdivisions
 Appendix A: Class I Railroad Subdivisions BNSF Subdivisions KCS Subdivisions UP Subdivisions BNSF Railroad Subdivisions SUBDIVISION: Region, Division Owner Operator Line Heritage Subdivision Route / Mileage
ES-1. Central Florida Freight Corridor (US 27/SR 60) Multimodal Mobility Enhancement Improvements. Project Name
 Multimodal Mobility Enhancement Improvements. Project Name") Project Name Central Florida Freight Corridor (US 27/SR 60) Multimodal Mobility Enhancement Improvements Was a FASTLANE application for this project submitted previously? No If yes, what was the name of
Project Name Central Florida Freight Corridor (US 27/SR 60) Multimodal Mobility Enhancement Improvements Was a FASTLANE application for this project submitted previously? No If yes, what was the name of
CITY OF JACKSONVILLE 2030 MOBILITY PLAN STUDY UPDATE GOALS, OBJECTIVES, AND PERFORMANCE MEASURES PREPARED FOR: CITY OF JACKSONVILLE
 CITY OF JACKSONVILLE 2030 MOBILITY PLAN STUDY UPDATE GOALS, OBJECTIVES, AND PERFORMANCE MEASURES 3.20.2017 PREPARED FOR: CITY OF JACKSONVILLE 55 Railroad Row White River Junction, VT 05001 802.295.4999
Appendix D: Functional Classification Criteria and Characteristics, and MnDOT Access Guidance
 APPENDICES Appendix D: Functional Classification Criteria and Characteristics, and MnDOT Access Guidance D.1 Functional classification identifies the role a highway or street plays in the transportation
DISTRICT OF COLUMBIA FREIGHT PLAN
 Final Report DISTRICT OF COLUMBIA FREIGHT PLAN Prepared for: District Department of Transportation Prepared by: With October 2014 Table of Contents District of Columbia Freight Plan 1.0 Introduction...1
MONITORING IMPLEMENTATION AND PERFORMANCE
 12 MONITORING IMPLEMENTATION AND PERFORMANCE The FAST Act continues the legislation authorized under MAP-21, which created a data-driven, performance-based multimodal program to address the many challenges
Missouri Freight Transportation Economy on the Move. Waterway Freight. Missouri Economic Research and Information Center
 Missouri Freight Transportation Economy on the Move Waterway Freight Waterway Industry Missouri is home to 14 public Port Authorities and over 200 private ports operating on over 1,000 miles of waterways
Osceola County Long Range Transit Plan. Prepared for. Prepared by
 TABLE OF CONTENTS title PAGE Prepared for Prepared by TABLE OF CONTENTS 4.2.5. US 441/Orange Blossom Trail/US 17-92... 23 4.2.6. Lake Toho Parkway (Proposed)... 23 4.2.7. Southport Connector/SR 417 Extension
ORLANDO INTERNATIONAL AIRPORT (OIA) CONNECTOR REFRESH ALTERNATIVES ANALYSIS FINAL REPORT
 CONNECTOR REFRESH ALTERNATIVES ANALYSIS FINAL REPORT") ORLANDO INTERNATIONAL AIRPORT (OIA) CONNECTOR REFRESH ALTERNATIVES ANALYSIS FINAL REPORT Prepared For: Florida Department of Transportation, District Five Prepared By: HDR Engineering, Inc. February 2016
ORLANDO INTERNATIONAL AIRPORT (OIA) CONNECTOR REFRESH ALTERNATIVES ANALYSIS FINAL REPORT Prepared For: Florida Department of Transportation, District Five Prepared By: HDR Engineering, Inc. February 2016
Chapter 4 Future Demand Forecasts
 Chapter 4 Future Demand Forecasts This chapter summarizes the work done under Task 4 to build the Action Plan, which is further described in Tech Memos 4a (Freight Demand) and 4b (System Performance Report).
US 27 Transportation Alternatives Study
 US 27 Transportation Alternatives Study Prepared for: Florida Department of Transportation Systems Planning Office October 2012 Technical Memorandum: Alternative Options and Policy Implications Prepared
Planning Today to Shape Tomorrow: Charting a Course for Page 2. Listen and Collaborate: Reaching Out to the Public...Page 6
 TABLE OF CONTENTS Blueprint 2040...Page 1 Planning Today to Shape Tomorrow: Charting a Course for 2040...Page 2 Listen and Collaborate: Reaching Out to the Public...Page 6 Grow with the Flow: Moving Traffic
U.S. 70 Corridor Economic Assessment
 U.S. 70 Corridor Economic Assessment prepared for U.S. 70 Corridor Commission and NCDOT prepared by Cambridge Systematics, Inc. with Sanford Holshouser Economic Development Consulting March 07, 2014 www.camsys.com
summary report West Texas Rail Feasibility Study Texas Department of Transportation Cambridge Systematics, Inc. HNTB August 2011
 summary report prepared for Texas Department of Transportation prepared by Cambridge Systematics, Inc. with HNTB August 2011 www.camsys.com summary report West Texas Rail Feasibility Study prepared for
Commodity Flow Modeling William R. Black Indiana University INTRODUCTION
 Commodity Flow Modeling William R. Black Indiana University INTRODUCTION The project reported on here was undertaken with the primary objective of creating a database of commodity flows into and out of
Beaver County Freight Profile
 Final Plan County Freight Profile SOUTHWESTERN PENNSYLVANIA REGIONAL FREIGHT PLAN County Freight Profiles Page BE-1 Final Plan County Freight Profile County Freight At-a-Glance County Size: Population
Florida Department of TRANSPORTATION Florida Transportation Plan (FTP) and Strategic Intermodal System (SIS) Strategic Plan Updates
 and Strategic Intermodal System (SIS) Strategic Plan Updates") Florida Department of TRANSPORTATION Florida Transportation Plan (FTP) and Strategic Intermodal System (SIS) Strategic Plan Updates Jim Wood Director, Office of Policy Planning Overview The FTP and the
Florida Department of TRANSPORTATION Florida Transportation Plan (FTP) and Strategic Intermodal System (SIS) Strategic Plan Updates Jim Wood Director, Office of Policy Planning Overview The FTP and the
The Point Intermodal River Port Facility at the Port of Huntington Project Benefit Cost Summary
 The Point Intermodal River Port Facility at the Port of Huntington Project Benefit Cost Summary The Lawrence County Port Authority 216 Collins Avenue South Point, Ohio 45638 P a g e Contents I. Base Case...
Eight County Freight Plan
 Eight County Freight Plan Blackhawk Hills Regional Council 2017 Fall Summit CPCS Team October 27, 2017 Timber Lake Playhouse Project Sponsors 2 Presentation Map The Eight County Freight Plan Work Plan
FREIGHT PERFORMANCE INDICATORS W.E. # C
 JACKFAU-96-527 FREIGHT PERFORMANCE INDICATORS W.E. #9500.04C FINAL REPORT Prepared for: Southern California Association of Governments Prepared by: Jack Faucett Associates In Association with: ICF Kaiser
LOUISIANA FREIGHT MOBILITY PLAN Donald Vary. March 1, 2016
 Donald Vary March 1, 2016 FREIGHT MOBILITY PLAN COMPONENTS Introduction and Plan Summary Strategic Goals and Objectives Economic Context of Freight Freight Policies, Strategies and Institutions Louisiana
TRANSPORTATION 101 Today and Tomorrow. Moving People and Goods
 TRANSPORTATION 101 Today and Tomorrow Moving People and Goods What is the Transportation Commission? An independent, seven-member body of citizens appointed by the Governor for six-year terms and representing
4-Step Commodity Model Freight Forecasting
 Freight Forecasting Neda Masoud (nmasoud@uci.edu) Kate Hyun (khyun1@uci.edu) Professor Ritchie CEE290A University of California Irvine Generation Distribution Mode Split Assignment Total Production and
Strategic Intermodal System
 Strategic Intermodal System Strategic Plan Status Report Florida Transportation Commission December 9 2003 1 Today s Presentation Update on SITAC Activities Strategic Plan Development Progress Public Workshop
To provide an update on the progress of the Peel Goods Movement Task Force and the Peel Goods Movement Strategic Plan.
 9.2-1 REPORT Meeting Date: 2015-11-26 Regional Council For Information DATE: November 10, 2015 REPORT TITLE: REGION OF PEEL GOODS MOVEMENT STRATEGIC PLAN - 2015 STATUS UPDATE FROM: Dan Labrecque, Commissioner
Working with Transportation Concurrency Exception Areas
 Working with Transportation Concurrency Exception Areas September 2006 Presented by the Florida Department of Transportation Working with Transportation Concurrency Exception Areas Volume 1, September
Intermodal Facility Study
 Intermodal Facility Study January 16, 2008 Submitted to: City of Shafter 336 Pacific Avenue Shafter, CA 93263 Prepared by: WZI Inc. 1717 28 th Street Bakersfield, California 93301 1 7 1 7 2 8 th S t r
Billions of dollars per year in: Savings in shipping costs Taxes and purchases that support tens of thousands of additional jobs Avoided highway
 Georgia s Freight Rail Advantage ACCG Transportation Mobile Classroom May 17, 2012 Freight Railroads Are Critical to the Economy Indispensable link connecting markets here and abroad huge global competitive
INTERSTATE CORRIDOR PLANNING
 INTERSTATE CORRIDOR PLANNING Prioritization of Corridor Studies July 29, 2015 Importance of the Interstate System Texas is an integral part of the national interstate system. The interstate system provides
Multimodal Transport Institute Forum. Tom Malloy Thoroughbred Direct Intermodal Services. October 11, 2012 Los Angeles, California
 Multimodal Transport Institute Forum Tom Malloy Thoroughbred Direct Intermodal Services October 11, 2012 Los Angeles, California Topics North American Railroad Industry -Facts & Figures North American
R U S H D O N O T D E L A Y R U S H D O N O T D E L A Y WAREHOUSE WAREHOUSE C/O: FREEMAN TO: EXHIBITOR NAME TO: EXHIBITOR NAME FEBRUARY 18, 2016
 RECEIVING DATE BEGINS: JANUARY 26, 2016 RECEIVING DATE BEGINS: JANUARY 26, 2016 DEADLINE DATE IS: DEADLINE DATE IS: C/O: C/O: WAREHOUSE WAREHOUSE EVENT: AAOS 2016 Annual Meeting EVENT: AAOS 2016 Annual
Florida. Logistics & Distribution Industry Edition. Source: Florida Department of Economic Opportunity, Bureau of Labor Market Statistics
 L a b o r M a r k e t I n d u s t r y P r o f i l e Florida Logistics & Distribution Industry 2017 Edition Source: Florida Department of Economic Opportunity, Bureau of Labor Market Statistics Florida
What is the Future of the Chinese Railways?
 What is the Future of the Chinese Railways? By David Burns 2/19/09 Not a definitive presentation! Railways are Railways the World Over Possible to predict future of Chinese railway by observation of those
South Boston. Transportation Plan. Transportation Planning Division. Virginia Department of Transportation
 2020 Transportation Plan Developed by the Transportation Planning Division of the Virginia Department of Transportation in cooperation with the U.S. Department of Transportation, Federal Highway Administration
final report Binghamton Regional Freight Study Binghamton Metropolitan Transportation Study Cambridge Systematics, Inc.
 final report prepared for Binghamton Metropolitan Transportation Study prepared by Cambridge Systematics, Inc. with Eng Wong Taub & Associates RL Banks & Associates, Inc. Global Insight (USA), Inc. September
Rail Freight and Economic Development. Economic Development
 Rail Freight and Economic Development Glen Weisbrod Economic Development Research Group, Inc. 2 Oliver Street, 9 th Floor Boston, MA 02109 USA www. edrgroup.com 1 Three Themes 1. Underlying Trends: changing
Rail Freight Service Review. Submission of the New Brunswick Department of Transportation
 Rail Freight Service Review Submission of the New Brunswick Department of Transportation Department of Transportation March 25, 2010 Rail Freight Service Review Submission of the New Brunswick Department
TSM&O Consortium Meeting
 TSM&O Consortium Meeting MEETING AGENDA D5 Urban Office 133 S. Semoran Blvd. Orlando, FL Lake Apopka B Conference Room April 7, 2016; 10:00 AM-12:00 PM 1) INTRODUCTIONS AND BUSINESS PROCESS DIMENSION OVERVIEW
OKI Regional Freight Plan August Table of Contents
 Table of Contents OKI Regional Freight Plan EXECUTIVE SUMMARY... I Regional Freight Trends... I Regional Freight Transportation Assets... II Regional Freight Transportation Deficiencies... II The Economic
Chapter 6: Regional Transportation
 Chapter 6: Regional Transportation Continued growth and development throughout the region magnifies the significance of connections to surrounding counties as economic and social interactions continue
To provide an update on the progress of the Peel Goods Movement Task Force and Peel Goods Movement Strategic Plan.
 8.4-1 REPORT Meeting Date: 2014-06-26 Regional Council For Information DATE: June 17, 2014 REPORT TITLE: PEEL GOODS MOVEMENT STRATEGIC PLAN UPDATE 2014 FROM: Dan Labrecque, Commissioner of Public Works
Sunrise Project South I-205 Corridor Improvement Project
 Sunrise Project South I-205 Corridor Improvement Project January 24, 2007 Sunrise and I-205 Project Summary Conclusions Sunrise Scoping Study Key Results South I-205 Scoping Study Key Results South I-205
Technical Memorandum MULTIMODAL NEEDS. Prepared for: Oklahoma Department of Transportation. Prepared by:
 Technical Memorandum MULTIMODAL NEEDS Prepared for: Oklahoma Department of Transportation Prepared by: May 2015 Technical Memorandum The Technical Memos were written to document early research for the
Introduction to North American Rail Transportation
 Introduction to North American Rail Transportation Christopher Barkan Professor & Executive Director Rail Transportation & Engineering Center University of Illinois at Urbana-Champaign Presentation Outline
The Emergence of. Florida s Seaports and Inland Ports. Florida League of Cities - International Relations Committee November 17, 2011
 The Emergence of Florida s Seaports and Inland Ports Florida League of Cities - International Relations Committee November 17, 2011 History of the Global Supply Chain 2 Supply Chain, Circa 1950 Regional
Intermodal Port Strategy AAPA Vancouver Conference November 6, 2013
 Intermodal Port Strategy AAPA Vancouver Conference November 6, 2013 Intermodal industry volume has steadily grown North American Intermodal Volume (1980 2012) Units in Millions Volume has increased more
Revenue Freight Traffic Statistics for the Major North American Railroads. Weekly Railroad Traffic
 Revenue Freight Traffic Statistics for the Major North American Railroads Weekly Railroad Traffic Week 26, Ended June 28, Notes 1. Traffic of Canadian railroads reflects their Canadian and U.S. operations,
Sabbir Saiyed, PhD., P.Eng. Manager, Transportation System Planning
 Sabbir Saiyed, PhD., P.Eng. Manager, Transportation System Planning February 5, 2016 Goods Movement is a Major Part of Peel s Economy Peel is one of Canada s most important freight hubs Close to major
I know that you all understand the critical importance of the freight transportation system
 United States Senate Subcommittee on Surface Transportation and Merchant Marine Infrastructure, Safety and Security Testimony of Michael L. Ducker President and CEO FedEx Freight Corporation April 4, 2017
MAINE TRANSPORTATION BY THE NUMBERS:
 MAINE TRANSPORTATION BY THE NUMBERS: Meeting the State s Need for Safe, Smooth and Efficient Mobility OCTOBER 2016 202-466-6706 tripnet.org Founded in 1971, TRIP of Washington, DC, is a nonprofit organization
Twin Cities Regional Truck Corridors Study. MnDOT Metro Freight Studies Roundup
 Twin Cities Regional Truck Corridors Study MnDOT Metro Freight Studies Roundup February 3, 2017 Study Background Transportation Policy Plan Goal: The regional transportation system supports the economic
Utah s Most Critical Surface Transportation Projects to Support Economic Growth and Quality of Life. March Washington, DC
 Utah s Most Critical Surface Transportation Projects to Support Economic Growth and Quality of Life March 2015 Washington, DC 202-466-6706 Founded in 1971, TRIP of Washington, DC, is a nonprofit organization
FINAL REPORT A METHODOLOGY FOR STATEWIDE INTERMODAL FREIGHT TRANSPORTATION PLANNING. Christopher J. Eatough Graduate Research Assistant
 FINAL REPORT A METHODOLOGY FOR STATEWIDE INTERMODAL FREIGHT TRANSPORTATION PLANNING Christopher J. Eatough Graduate Research Assistant Stephen C. Brich Senior Research Scientist Michael J. Demetsky, Ph.D.
A MODAL COMPARISON OF DOMESTIC FREIGHT TRANSPORTATION EFFECTS ON THE GENERAL PUBLIC EXECUTIVE SUMMARY. November 2007
 A MODAL COMPARISON OF DOMESTIC FREIGHT TRANSPORTATION EFFECTS ON THE GENERAL PUBLIC EXECUTIVE SUMMARY November 2007 Prepared by CENTER FOR PORTS AND WATERWAYS TEXAS TRANSPORTATION INSTITUTE 701 NORTH POST
NJ State Rail Plan. New Jersey Short Line Railroad Association Briefing September 12, 2012
 NJ State Rail Plan New Jersey Short Line Railroad Association Briefing September 12, 2012 Why a Rail Plan? Meets federal mandates Advances rail funding Provides a framework for investment Summarizes and
East Central Florida Corridor Evaluation Study Project Advisory Group Meeting #1 June 9, 2016 Meeting Summary
 Date & Time: Project: Meeting Location: Meeting Purpose: (Thursday) from 1:30 pm 3:30 pm East Central Florida Corridor Evaluation Study FDOT District Five Urban Office Lake Harris Conference Room 133 S.
Overview of America s Freight Railroads
 Overview of America s Freight Railroads Association of American Railroads August 2017 Summary From one end of the country to the other, America is connected by the best freight rail system in the world.
Economic Impact Analysis of Short Line Railroads. Louisiana State University - Research Team Dr. Jared Llorens Dr. Jim Richardson Mr.
 Economic Impact Analysis of Short Line Railroads Louisiana State University - Research Team Dr. Jared Llorens Dr. Jim Richardson Mr. Brendan Buras Background Terminology Short Line Rail Short line (Class
Published by the Palm Beach Metropolitan Planning Organization (MPO) in coordination with Leftwich Consulting Engineers, Inc.
 in coordination with Leftwich Consulting Engineers, Inc.") AMENDMENT #3 + Published by the Palm Beach Metropolitan Planning Organization (MPO) in coordination with Leftwich Consulting Engineers, Inc. Adopted October 16, 2014 by the Board of Directors Palm Beach
AMENDMENT #3 + Published by the Palm Beach Metropolitan Planning Organization (MPO) in coordination with Leftwich Consulting Engineers, Inc. Adopted October 16, 2014 by the Board of Directors Palm Beach
The Indian Nations Council of Governments (INCOG) 2035 Plan: Roadways Element
 2035 Plan: Roadways Element") Roadways The Indian Nations Council of Governments (INCOG) The Indian Nations Council of Governments is the designated regional planning organization for the Tulsa Transportation Management Area (TMA).
Roadways The Indian Nations Council of Governments (INCOG) The Indian Nations Council of Governments is the designated regional planning organization for the Tulsa Transportation Management Area (TMA).
Transform 66 Multimodal Project: Prioritization Process and Evaluation Criteria Approved March 3, 2016
 Transform 66 Multimodal Project: Prioritization Process and Evaluation Criteria Approved March 3, 2016 The Memorandum of Agreement (MOA) for the Transform 66: Inside the Beltway Project directs NVTC to
CONNECTICUT TRANSPORTATION BY THE NUMBERS:
 CONNECTICUT TRANSPORTATION BY THE NUMBERS: Meeting the State s Need for Safe and Efficient Mobility MAY 2017 202-466-6706 tripnet.org Founded in 1971, TRIP of Washington, DC, is a nonprofit organization
INLAND WATERWAYS TRANSPORTATION: Our Competitive Advantage. Delbert R Wilkins Canal Barge Company Big River Moves Leadership Forum April 15, 2013
 INLAND WATERWAYS TRANSPORTATION: Our Competitive Advantage Delbert R Wilkins Canal Barge Company Big River Moves Leadership Forum April 15, 2013 INLAND WATERWAYS TRANSPORTATION: Our Competitive Advantage
Strategic Transportation Plan. Presented to: ECO-Rapid Transit Board of Directors Presented by: Gill V. Hicks, Cambridge Systematics, Inc.
 Strategic Transportation Plan Presented to: ECO-Rapid Transit Board of Directors Presented by: Gill V. Hicks, Cambridge Systematics, Inc. June 11, 2014 1 Local Solutions for all Gateway Cities Communities
LOUISIANA TRANSPORTATION BY THE NUMBERS:
 LOUISIANA TRANSPORTATION BY THE NUMBERS: Meeting the State s Need for Safe, Smooth and Efficient Mobility MARCH 2017 202-466-6706 tripnet.org Founded in 1971, TRIP of Washington, DC, is a nonprofit organization
FREIGHT CORRIDORS AND GATEWAYS: DEVELOPMENT APPROACH AND EVALUATION CRITERIA COMPARISON IN NORTH AMERICA AND THE EUROPEAN UNION
 FREIGHT CORRIDORS AND GATEWAYS: DEVELOPMENT APPROACH AND EVALUATION CRITERIA COMPARISON IN NORTH AMERICA AND THE EUROPEAN UNION Juan Carlos Texas A&M Transportation Institute Introduction International
RURAL RESIDENTIAL COMMUNITY ROLE COUNCIL ROLE RURAL RESIDENTIAL ALL COMMUNITIES
 Orderly and Efficient Land Use Align land use, development patterns, and infrastructure to make the best use of public and private investment. Discourage future development of rural residential patterns
3.6 GROUND TRANSPORTATION
 3.6.1 Environmental Setting 3.6.1.1 Area of Influence The area of influence for ground transportation consists of the streets and intersections that could be affected by automobile or truck traffic to
Regional Transportation Studies Regional Council
 Pima Association of Governments 1 E. Broadway, Tucson, Arizona Santa Rita Conference Room Regional Transportation Studies Regional Council September 28, 2017 I-11 Tier 1 Environmental Impact Statement
CSX Montreal Expansion Ohio Conference on Freight September 2013
 CSX Montreal Expansion Ohio Conference on Freight September 2013 CSX has a 125 year history in Québec Company Overview America s first railroad Founded 1827, headquartered in Jacksonville, FL CSX in Québec
North Carolina Statewide Freight Plan
 Greater Charlotte Regional Freight Peer Exchange North Carolina Statewide Freight Plan Derry Schmidt & Terry Arellano NCDOT Planning Branch NC : Two Phase Process Phase 1 Interim MAP-21 compliant freight
Federal Freight Policy: In Brief
 John Frittelli Specialist in Transportation Policy December 16, 2013 Congressional Research Service 7-5700 www.crs.gov R42764 Contents Freight System Components... 1 The Federal Role in Planning... 2 Federal
GNC Coalition Update. Washington Public Ports Association Trade and Transportation Committee November 18, 2015
 GNC Coalition Update SWOT Analysis of the Great Northern Corridor 11/18/2015 Washington Public Ports Association Trade and Transportation Committee November 18, 2015 PHASE 1 OVERVIEW What is the Great
Logistics Park Kansas City (LPKC) Edgerton, KS. Infrastructure, Development And Transportation. September 30, 2013
 Edgerton, KS. Infrastructure, Development And Transportation. September 30, 2013") Logistics Park Kansas City (LPKC) Edgerton, KS Infrastructure, Development And Transportation September 30, 2013 LPKC Location LPKC Intermodal Facility Progress Photo courtesy of Superior Bowen Asphalt.
Logistics Park Kansas City (LPKC) Edgerton, KS Infrastructure, Development And Transportation September 30, 2013 LPKC Location LPKC Intermodal Facility Progress Photo courtesy of Superior Bowen Asphalt.