National Capital Region Freight Plan
|
|
|
- Loreen Brown
- 6 years ago
- Views:
Transcription
1 2010 National Capital Region Freight Plan National Capital Region Transportation Planning Board Metropolitan Washington Council of Governments 7/21/2010
2 2010 NATIONAL CAPITAL REGION FREIGHT PLAN July 21, 2010 Please submit your comments and/or questions to COG/TPB staff Karin Foster at (Phone), or (Fax) National Capital Region Transportation Planning Board Metropolitan Washington Council of Governments 2
3 TITLE National Capital Region Freight Plan 2010 Date: July 21, 2010 Number of Pages: 90 + Appendices AUTHOR: Karin Foster, MPP, Transportation Planner, Freight Program Manager AGENCY: The Metropolitan Washington Council of Governments (COG) is the regional organization of the Washington area s major local governments. COG is comprised of 21 local governments surrounding our nation's capital, plus area members of the Maryland and Virginia legislatures, the U.S. Senate, and the U.S. House of Representatives. COG works toward solutions to such regional problems as growth, transportation, the environment, economic development, and public safety. The National Capital Region Transportation Planning Board (TPB) conducts the continuing, comprehensive transportation planning process for the National Capital Region under the authority of the Federal Aid Highway Act of 1962, as amended, in cooperation with the states and local governments. ABSTRACT: This report examines freight movement in the National Capital Region. The Freight Plan provides analysis of current and forecast freight conditions and examines land use and environmental issues as well as safety and security concerns. The Plan also contains the National Capital Region Freight Project Database. This Database contains projects beneficial to freight movement in the National Capital Region. A listing of best practices provides goals toward giving freight greater prominence in the region. The Freight Plan concludes with important key findings and recommendations for the region. SUBJECT: To raise awareness on freight conditions in the National Capital Region, highlight freight projects important to goods movement in the region, and integrate freight concerns into the transportation planning process. ORDER COPIES FROM: Metropolitan Information Center Metropolitan Washington Council of Governments 777 North Capitol Street, NE, Suite 300 Washington, DC, (202) COPYRIGHT 2010 Metropolitan Washington Council of Governments 3
4 NATIONAL CAPITAL REGION TRANSPORTATION PLANNING BOARD METROPOLITAN WASHINGTON COUNCIL OF GOVERNMENTS CREDITS Director, Department of Transportation Planning Ronald F. Kirby Systems Management Planning Director Andrew Meese Freight Program Manager and Report Author Karin Foster Acknowledgements Victor Weissberg Freight Subcommittee Chairman Prince George s County Department of Public Works and Transportation Technical Oversight Freight Subcommittee of the Transportation Planning Board 4
5 TABLE OF CONTENTS 1) EXECUTIVE SUMMARY... 9 a) Key Findings b) Recommendations ) INTRODUCTION a) Overview b) Transportation Planning Board Vision c) Defining Freight ) PLANNING CONTEXT a) Freight Plan Context b) Federal Planning Requirements c) Metropolitan Planning Requirements d) National Capital Region Jurisdictional Freight Planning Activities ) TPB FREIGHT PROGRAM a) Freight Program History b) Freight Subcommittee c) Freight Stakeholder Outreach ) CURRENT FREIGHT CONDITIONS a) Regional Freight Picture b) Freight Movement in the National Capital Region by Mode a) Regional Congestion b) Regional Truck Issues ) REGIONAL FREIGHT FORECASTS a) Regional Freight Trends b) Regional Freight Economy c) Forecast by Mode a) CSX National Gateway b) Norfolk Southern ) LAND USE AND THE ENVIRONMENT a) Land Use and Zoning b) Freight Activity Centers c) Freight and the Environment ) SAFETY AND SECURITY a) Regional Overview
6 b) Regional Safety c) Regional Security ) NATIONAL CAPITAL REGION FREIGHT PROJECT DATABASE ) BEST PRACTICES ) KEY FINDINGS/RECOMMENDATIONS a) Key Findings b) Recommendations
7 LIST OF FIGURES Figure 1-1. TPB Member Jurisdiction Map Figure 4-1: Estimated Freight Movement by Tonnage and Value Figure 4-2: ICAT Congestion Bottlenecks in the National Capital Region Figure 4-3: Speed, Density, and LOS Chart Figure 4-4: Percent Truck Overlay on Skycomp Morning Regional Congestion Figure 4-5: Interchange Capacity Bottlenecks on Freeways Used as Urban Truck Corridors Figure 4-6: National Capital Region Truck Routes Figure 4-7: CSX System Map Figure 4-8: Norfolk Southern System Map Figure 4-9: Map of Washington DC Railroads Figure 5-1: Change in Population and Employment Forecasts Figure 5-2. Panamax and Post-Panamax Load Capacity Figure 5-3: CSX National Gateway Figure 5-4: Norfolk Southern Crescent Corridor Intermodal Freight Program Figure 6-1: National Capital Region Freight Clusters Figure 6-2: United States Greenhouse Gas Emissions Truck versus Rail 7
8 LIST OF TABLES Table 4-1: Rankings for Port of Virginia and Port of Baltimore Table 5-1: Truck Jurisdictional VMT by Year ( ) Table 5-2: CSX National Gateway Projects in the National Capital Region Table 8-1: U.S. Hours of Service Rules for Commercial Motor Vehicles 8
9 1) EXECUTIVE SUMMARY Overview This National Capital Region Freight Plan 2010 is an initiative of the Transportation Planning Board s (TPB) Freight Program. 1 The National Capital Region Freight Plan 2010 s aim is to examine freight movement in the region and to summarize current and forecasted freight conditions. Goods movement is made by truck, rail, maritime, air cargo, pipeline, or a combination of these modes. This document focuses on truck, rail, maritime, and air cargo movements, with particular attention given to truck and rail movements in the region. The document also identifies regional freight issues such as land use, environment, safety, and security. A National Capital Region Freight Project Database was compiled in conjunction with this report. The database contains projects beneficial to freight movement within the region. The document concludes with best practices for the region and key findings from the Plan and Recommendations. Freight Planning Context The most recent federal transportation legislation, Safe Accountable Flexible Efficient Transportation Equity Act A Legacy for Users (SAFETEA-LU) enacted in 2005, gives attention to freight planning at the MPO level for the first time. Renewal of this legislation is expected to maintain and perhaps expand upon freight programs. The TPB Freight Program is an outcome of an earlier freight analysis as well as federal encouragement for MPOs to examine freight transportation. Consultant Cambridge Systematics prepared Enhancing Consideration of Freight in Regional Transportation Planning for the TPB in May Its recommendations encouraged TPB to initiate a Freight Program. TPB Freight Program The Freight Program launched the Freight Subcommittee in April The Freight Subcommittee has identified five objectives for itself: 1) To Provide a Voice for Freight in Transportation Planning 2) To Recognize Freight s Role in Economic Development 3) To Recognize Freight s Integrated Role in the Multimodal System 4) To Coordinate Transportation and Land Use Planning 5) To Recognize How Freight Can Reduce Air Quality Impacts Freight Subcommittee meetings are held bimonthly. They generally include one or two freight industry speakers, an update on TPB Freight Program activities, and roundtable 1. The Metropolitan Washington Council of Governments (MWCOG) houses the federally-mandated Metropolitan Planning Organization (MPO), known as the National Capital Region Transportation Planning Board (TPB). 9
10 updates from meeting attendees. Facility tours also have been organized to learn about various operations in the National Capital Region. Current Freight Conditions Freight movement is critical to the economy and quality of life of the National Capital Region. Freight movement is driven by the growing population and its demand for goods. As trucks carry the majority approximately 76 percent of goods to from, and within the region, they face growing congestion. 2 In a survey of freight-related businesses in the National Capital Region, congestion on Interstates 495, 95, and 66 were repeatedly mentioned as significant challenges to doing business in the region. 3 For trucking companies, congestion diminishes productivity and increases the cost of operations, as drivers must be paid for time spent making deliveries as well as time spent stalled or stopped in traffic. The National Capital Region is primarily a through corridor for freight rail, with 95 percent of rail traffic travelling through the region. Two Class One railroads operate in the region, CSX Transportation Inc. and Norfolk Southern Corporation. Through cooperative track sharing agreements, commuter services Maryland Area Regional Commuter (MARC) and Virginia Railway Express (VRE) as well as passenger service Amtrak operate in the region. Air freight commodities are typically high in value, light in weight, and time sensitive. Freight is moved either on dedicated all-cargo planes (e.g. FedEx, UPS) or in the cargo holds of passenger planes. Washington Dulles International Airport (IAD) and the Ronald Reagan Washington National Airport (DCA) are located within the region, and the Baltimore Washington International Thurgood Marshall Airport (BWI) is located just outside the National Capital Region in Anne Arundel County, Maryland. IAD and BWI are the two primary air cargo airports that serve the National Capital Region. Supplemental facilities provided at IAD and BWI, such refrigerated and heated warehouses, help to speed up goods movement through the supply chain to their final destination. A small amount of barge movements occur on the Potomac and Anacostia Rivers. These movements transport petroleum and construction aggregates, such as rock and sand. In the National Capital Region, one million tons of goods, worth $69 million are moved by water annually. 4 Regional Freight Forecasts 2. Cambridge Systematics for MWCOG, Enhancing Consideration of Freight in Regional Transportation Planning, May 2007, p TPB staff Karin Foster, Freight Stakeholder Survey, February, March, April Cambridge Systematics for MWCOG, Enhancing Consideration of Freight in Regional Transportation Planning, May 2007, p
11 Looking to the future, the National Capital Region is among the fastest growing areas in the country. With more people and jobs coming to the area all the time, the impacts on the transportation system are felt by all. With growth comes greater demand for goods. Goods movement drives the global economy. The goods that people demand originate from destinations across the globe, and they often travel via several transportation modes before they reach the customer at the store. These goods need to be delivered to our local groceries, big box retailers, hospitals, offices, and schools daily, and often multiple deliveries each day. Consumers expect their goods to be available where they want when they want. The pending completion of the Panama Canal expansion has potential for significant growth for east coast ports and freight movement. The canal currently has capacity for 5,000 container ships. The expanded Panama Canal will have capacity for 12,000 container ships. The expansion is anticipated to be complete in As West Coast facilities reach capacity, the expanded canal will impact shipper route selection. This is likely to influence the relationship between truck and rail as intermodal movements grow. Between 1980 through 2006, the nation s railroad mode share measured in revenue tonmiles grew from 30 percent to 43 percent. In this same period, intermodal shipments (shipping containers and trucks trailers on rail cars) were the fastest growing segment of traffic on the rail system. 5 Based on the COG/TPB traffic model, heavy truck volumes are projected to increase by 38 percent between 2002 and 2030; medium truck volumes are projected to increase by 47 percent between 2002 and 2030; and the volume of through traffic is projected to increase by 14 percent in the region. This increase in traffic volumes will impact the movement of goods in the region. 6 In anticipation of economic growth, CSX Transportation Inc. is working on the National Gateway, an effort to clear 61 obstructions in six states across the Mid-Atlantic and Midwest, in addition to five new and two upgraded intermodal facilities. Thirteen of these projects fall within the National Capital Region, with the Virginia Avenue Tunnel being the biggest obstruction. Norfolk Southern Corporation has the Crescent Corridor initiative underway. The Crescent Corridor is an effort to link 13 states between Louisiana and New Jersey with track improvements and clearance projects to allow for double-stacked train service and rail efficiencies. All transportation modes are projected to move more tonnage to, from, and within the region by Air cargo tonnage is expected to rise the fastest, growing nearly 500 percent. 7 In 2002, the highest value air cargo commodity moving to, from, and within the region were electronics valued at $3 billion Association of American Railroads, Railroad Facts Draft National Rail Plan Enhancing Consideration of Freight in Regional Transportation Planning, May 2007, p Enhancing Consideration of Freight in Regional Transportation Planning, May 2007, p Enhancing Consideration of Freight in Regional Transportation Planning, May 2007, p
12 Land Use and the Environment The relationship between land use and zoning has a major impact on where to anticipate freight transportation. It is often a challenge to coordinate land use/zoning and transportation decisions because land use and zoning decisions are usually made by the local and county jurisdiction level whereas transportation decisions are usually made at the state and federal level. Departments of Transportation may not be part of state-level action plans and strategy development. Transportation is the second-largest source of greenhouse gas (GHG) emissions in the United States. Passenger modes account for 73 percent of transportation GHG emissions and freight modes account for 27 percent of transportation GHG emissions. Of the 27 percent of GHG freight modes emissions, 21 percent is from trucking, 3 percent is from freight rail. 9 The truck and rail industries have made several advancements toward adopting more sustainable technologies and there is room for additional efficiencies. Idle reductions technologies such as auxiliary power unit (APUs) and truck stop electrification help reduce GHG emissions from trucks. APUs are externally mounted on the truck cab and provide energy to the driver via electricity when the engine is turned off. Additionally, states such as Maryland and Virginia have begun to adapt truck weighin-motion technology to reduce truck idling time at weigh stations. This eliminates the need to pull trucks off the road unless there is a suspected violation. Additionally, CSX and Norfolk Southern promote their respective National Gateway and Crescent Corridor projects as part of the solution to reduce transportation carbon dioxide and GHG emissions. The potential for truck to rail diversions would result in gallons of fuel avoided, shipper cost savings, pavement maintenance savings, accident cost savings, congestion and emission savings, and increased employment. Safety and Security Safety is another important part of transportation planning. The Regional Transportation Safety Report (June 2009) revealed that crashes involving young drivers (26.2%) and crashes at signalized intersections (22.6%) stood out as the two largest safety concerns. In the same year, the analysis showed that crashes involving trucks were seven percent. It is important that truck companies abide by safety precautions because when a truck crash occurs, there is greater potential for damage. Trucks and trains are a potential security threat in the region when under the control of someone with malicious intent. Security experts regard trucks as a highly likely means to deliver destruction in an attack such as on: Federal agencies Federal monuments and landmarks 9. Federal Highway Administration, Office of Planning, Environment, and Realty, Robert Ritter, Freight and Climate Change, presented to FHWA Talking Freight, June 17,
13 Embassies Military facilities District of Columbia critical infrastructure Financial, religious, cultural, and patriotic icons Venues of gathered people The transport of hazardous materials by rail through downtown Washington D.C. is another security concern for the National Capital Region. Freight rail is a common carrier under law, meaning the railroad cannot reject customers (hazardous materials customers). Each year the Class One railroads safely transport thousands of shipments of hazardous material through our region. National Capital Region Freight Project Database The National Capital Region Freight Project Database developed in conjunction with the National Capital Region Freight Plan 2010 lists projects beneficial to freight movement in our region. All projects were gathered from existing plans or reports and comments from the Freight Subcommittee. The Database represents a first milestone toward identifying projects that can strengthen our region s goods movement infrastructure. Best Practices The National Capital Region Freight Plan 2010 includes a list of Best Practices for regional freight transportation. Best Practices are anticipated to be effective in achieving the goal to give greater prominence to freight transportation in the National Capital Region. The following Best Practices have been identified by the Freight Stakeholder Subcommittee: 1. Jurisdictions should have one or more staff persons responsible for freight planning in the jurisdiction. 2. Jurisdictional transportation plans should specifically address freight movement issues. 3. Freight railroads should address passenger freight concerns as they advance freight rail projects. 4. States, jurisdictions, and regional planning activities should work to build on available freight data. 5. Regional freight planning activities should be sustained to assist state and local freight integration efforts. Key Findings/Recommendations 13
14 The Freight Plan concludes with a summary of important key findings and recommendations from throughout the Plan. The key findings represent freight facts summarized from the Plan. The recommendations should help guide the activities of the Freight Program with the integration of freight into the metropolitan transportation planning process. a) Key Findings 1. Freight issues differ from traditional Transportation Planning Board (TPB) activities in the degree to which private companies must be involved. 2. Freight movement is critical to the economy and quality of life in the metropolitan Washington region. 3. Freight demand is driven by population and economic growth. The National Capital Region is among the fastest growing areas in the country. The region is forecasted to grow by 1.2 million people and nearly 1 million jobs between 2010 and 2030 a 22 percent increase in population and a 29 percent increase in employment Sixty percent of truck and rail transportation tonnage and 86 percent of truck and rail transportation value are through trips. 11 However, most trucks visible to the bystander are trucks making shipments to, from, and within the region, and contribute to the region s economy. 5. Trucks carry the majority approximately 76 percent of goods to from, and within the region Congestion was raised as a major concern in a spring 2009 survey of shippers, receivers, and wholesale/distribution centers from various industries in the National Capital Region. Congestion diminishes productivity and increases the cost of operations, as truck drivers must be paid for time spent making deliveries as well as time spent stalled or stopped in traffic. The domestic trucking sector loses an estimated $8 billion per year as a result of clogged roads. 13 Congestion adds to societal costs in the form of increased emissions and indirect impacts on consumer prices. 7. The Class One railroads in the National Capital Region, CSX and Norfolk Southern, have undertaken major initiatives to improve their railway network. CSX s National Gateway is an effort to clear 61 obstructions in six states across the Mid-Atlantic and 10. Constrained Long Range Plan Update 2008, p Cambridge Systematics for MWCOG. Estimates are based on two sources: Inbound, Outbound, and Intraregional numbers are based on 2002 FAF data. Through traffic is based on 2003 estimate in Draft Maryland Freight Profile, Enhancing Consideration of Freight in Regional Transportation Planning, Cambridge Systematics, Bethesda, MD, May 2007, p Environmental Defense Fund, The Good Haul: Innovations that Improve Freight Transportation and Protect the Environment,
15 Midwest, in addition to five new and two upgraded intermodal facilities. Thirteen National Gateway projects fall within the National Capital Region. Norfolk Southern s Crescent Corridor is an effort to link 13 states from Louisiana to New Jersey with track improvements. These projects, when completed, will allow for double-stacked train service and rail efficiencies. 8. Air cargo tonnage to, from, and within the region is expected to grow nearly 500 percent by Air freight commodities are typically high in value, light in weight, and time sensitive. Washington Dulles International Airport and Baltimore Washington International Thurgood Marshall Airport are the two primary air cargo airports that serve the National Capital Region. 9. A small amount of barge movement occurs on the Potomac and Anacostia Rivers. These movements transport petroleum, and construction materials such as rock and sand. In the National Capital Region, one million tons of goods, worth $69 million are moved by water annually The growing global economy demands a transportation infrastructure to support the forecast growth in freight movement. A major expansion of the Panama Canal is scheduled to be complete in The canal currently has capacity for 5,000 container ships. The expanded Panama Canal will have capacity for 12,000 container ships. The expanded canal will impact shipper route selection. This is likely to influence the relationship between truck and rail as intermodal movements grow. 11. Transportation is the second largest source of greenhouse gas emissions (GHG) in the United States. Freight modes contribute 27.4 percent of total transportation greenhouse gas emissions nationally. Of the 27.4 percent, truck transportation contributes 20.5 percent and rail transportation contributes 2.4 percent Though the rate of truck accidents is moderate, there is great potential for danger when they do occur. For safety reasons, the National Capital Region wants to ensure that hours of service rules are followed, parking and service centers are provided, enforcement and inspection is conducted, and speed is controlled. 13. Both truck and rail security issues are important to the National Capital Region. Truck inspections and enforcement are particularly vital. The routing of truck and rail hazardous materials from sensitive areas of the National Capital Region is a key strategy for bolstering security. 14. Freight rail is a United States common carrier. As a common carrier, a railroad cannot choose the cargo that it carries; by law a railroad cannot reject hazardous 14. Enhancing Consideration of Freight in Regional Transportation Planning, May 2007, p Federal Highway Administration, Freight Analysis Framework, 2002 and data from the U.S. Army Corps of Engineers. 16. Federal Highway Administration, Office of Planning, Environment, and Realty, Robert Ritter, Freight and Climate Change, presented to FHWA Talking Freight, June 17,
16 cargo. Each year, CSX and Norfolk Southern safely transport several hundred thousand shipments of hazardous materials through our region. 15. Freight movement has few alternative modes with respect to transporting goods, unlike personal transportation. b) Recommendations 1. Freight transportation planning and the TPB Freight Program should be continued and enhanced, with special emphasis on public safety, security, environmental, congestion related, commuter rail, and service gap issues. 2. The TPB Freight Subcommittee and staff should regularly update the TPB and its subcommittees on freight movement issues. 3. The freight industry requires special outreach efforts that include more out of the office and on-site meetings than other transportation planning subjects. Staff should continue proactive outreach efforts to the freight industry and private sector stakeholders as a key aspect of freight planning. 4. TPB freight staff should coordinate with jurisdictions to help produce jurisdictionlevel freight profiles and encourage enhanced consideration of freight in local planning. 5. The Freight Program should explore new data opportunities, such as data available from the INRIX, Inc. database, with information based primarily on GPS-equipped commercial fleets, in conjunction with the TPB Congestion Management Process. 6. The TPB Freight Program should hold an annual Freight Forum or similar event to raise freight transportation awareness in the National Capital Region. 7. Coordination with our region s rail stakeholders is important to our TPB. The TPB Freight Program should encourage rail stakeholders to coordinate on rail planning and operational issues with the TPB jurisdictions, passenger railroads, and the public. 16
17 2) INTRODUCTION a) Overview The National Capital Region has a strong service based economy. Federal, state, and local government employ 21 percent of the region s population. Professional and business services employ another 21 percent of the region. 17 As such, the region primarily consumes goods rather than produces them. These goods need to be delivered to our local groceries, big box retailers, hospitals, offices, and schools daily, and often multiple deliveries each day. Consumers expect their goods to be available where they want when they want. Freight moves by truck, rail, air, water, or pipeline. The National Capital Region Freight Plan 2010 will focus on the predominant surface transportation modes in our region, truck and rail. 18 As the region coordinates surface transportation projects between the jurisdictions, it is important to consider which projects might be beneficial to the efficient movement of freight in the region. Some projects might reduce highway congestion and make quick efficient movement easier for trucks. A rail project may help to divert truck traffic from the roads, particularly regional through traffic. Freight is an integral part of our overall transportation system, therefore planning for freight movement is critically important. b) Transportation Planning Board Vision The Transportation Planning Board (TPB) is the federally designated Metropolitan Planning Organization (MPO) for the National Capital Region. The MPO s role is to carry out the comprehensive regional transportation planning process under the authority of the Federal-Aid Highway Act of 1962, as amended. The objective of an MPO is to ensure expenditures for transportation projects and programs are part of a continuing, cooperative, and comprehensive planning process. An MPO is required for any urbanized area with a population greater than 50,000. The TPB brings key decision-makers together to coordinate planning for the region s transportation system. The TPB is made up of representatives of 21 local governments, the departments of transportation of Maryland, Virginia, and the District of Columbia, the state legislatures, and the Washington Metropolitan Area Transit Authority (WMATA). See Figure 1-1 for a map of TPB member jurisdictions. References to the National Capital Region in this report refer to the TPB Planning Area. 17. Employment statistics quoted in Enhancing Consideration of Freight in Regional Transportation Planning. Cambridge Systematics, Bethesda, MD, May 2007, p Air Cargo is addressed in the 2008 Washington-Baltimore Regional Air Cargo Study, Metropolitan Washington Council of Governments, National Capital Region Transportation Planning Board, June

18 Figure 1-1. TPB Member Jurisdiction Map 18
19 The Transportation Planning Board (TPB) Vision is a policy document that lays out eight broad goals to guide the region s transportation investments into the 21 st century. The TPB unanimously approved the Vision in October 1998 after three years of public outreach efforts. It is to act as a framework to guide decision-making by various jurisdictions in the TPB region. Goal 2 addresses the importance of an interconnected transportation system. Objective 3 of Goal 2 directly addresses multi-modal transportation connections. Goal 8 speaks directly to developing a freight plan. Issues that indirectly relate to freight transportation (e.g. safety) are included in other Goals. Goal 2: The Washington metropolitan region will develop, implement, and maintain an interconnected transportation system that enhances quality of life and promotes a strong and growing economy throughout the region, including a healthy regional core and dynamic regional activity centers with a mix of jobs, housing, and services in a walkable environment. Goal 2, Objective 3. A web of multi-modal transportation connections which provide convenient access (including improved mobility with reduced reliance on the automobile) between the regional core and regional activity centers, reinforcing existing transportation connections and creating new connections where appropriate. Goal 8, Strategy 5: Develop a regional plan for freight movement c) Defining Freight Freight is defined as goods and cargo transported for pay, whether by water, land, or air. 19 Freight movement (also referred to as goods movement) is a part of everyone s lives. For example, the buildings we work and live in, the food we eat, and our medical systems all depend upon and are supported by freight deliveries. Usually the last mile of delivery is made by truck. Freight carriers deliver goods and haul away unwanted commodities such as trash. The National Capital Region depends on the continuous and efficient movement of goods. Intermodal freight transportation refers to the movement of goods between modes. These movements are made by containers (known as twenty-foot-equivalents, TEU) or truck trailers on rail flat cars. Containers are versatile and can travel by ship, by rail, and by truck in any combination, making them intermodal. Containers are usually not opened until their final destination. 19. Cambridge Dictionary Online, March 9,
20 3) PLANNING CONTEXT a) Freight Plan Context This document aims to build off of two previous studies, Enhancing Considerations of Freight in Regional Transportation Planning, May 2007 and Integrate Freight Report, July This is the first National Capital Region Freight Plan presented to the Transportation Planning Board (TPB). TPB model output and publicly available freight data for the region were reviewed to update current information and freight forecasts for the region. Data collection efforts also included a Stakeholder Survey. The National Capital Region Freight Project Database compiles projects beneficial to freight movement in the region. The National Capital Region Freight Plan 2010 will help provide framework and direction for the future of the Freight Program. The National Capital Region Freight Plan 2010 addresses: Current and forecasted freight conditions; Freight generators/receivers; Land use and the environment; Freight safety and security issues; National Capital Region Freight Project Database; and Best practices for freight transportation. b) Federal Planning Requirements Freight issues are increasingly on the federal radar. The most recent transportation legislation incorporated freight as a metropolitan transportation planning factor for the first time. This legislation, Safe Accountable Flexible Efficient Transportation Equity Act A Legacy for Users (SAFETEA-LU), has a section that provides guidelines on how Metropolitan Planning Organizations (MPOs) should operate. Two parts of Section speak directly to MPOs and freight planning: (4) Increase accessibility and mobility of people and freight; (5) Enhance the integration and connectivity of the transportation system, across and between modes, for people and freight; Additionally, Section 5303(a)1, contains language for MPOs to promote the freight aspect of transportation planning. The language reads: It is in the national interest to encourage and promote the safe and efficient management, operation, and development of surface transportation systems that will serve the mobility needs of people and freight and foster economic growth and development within and between States and urbanized areas, while minimizing transportation-related fuel consumption and air pollution through metropolitan and statewide transportation planning processes 20
21 Freight projects also are eligible to apply for funding under the SAFETEA-LU Subtitle C, Section 1301 Projects of National and Regional Significance program. The freight language reads: Projects of National and Regional significance have national and regional benefits, including improving economic productivity by facilitating international trade, relieving congestion, and improving transportation safety by facilitating passenger and freight movement. Following the September 30, 2009 expiration of SAFETEA-LU, the Congress passed and President Obama signed multiple Continuing Resolutions (CRs) for SAFETEA-LU. The CRs extend funding for all federal programs and includes the extension of transit and highway authorization law. Successor legislation to SAFETEA-LU has not been enacted as of the writing of the National Capital Region Freight Plan Existing requirements that address inclusion of freight considerations in metropolitan planning are expected to remain and perhaps expanded upon in the successor legislation. c) Metropolitan Planning Requirements It is the responsibility of each designated MPO to prepare the Constrained Long Range Transportation Plan (CLRP) and the Transportation Improvement Program (TIP) for the metropolitan planning area. The CLRP identifies all regionally significant transportation projects and programs that are planned in the Washington metropolitan area over a 30-year period. The list of projects is financially constrained, meaning that each project has an anticipated funding source identified. A CLRP will list some projects to be completed in the near future, while others are only in the initial planning stages. A major update of the CLRP is undertaken every four years. The TIP is a six-year transportation plan that describes the schedule for obligating federal funds to state and local projects. The TIP contains detailed funding information for highway projects as well as transit capital and operating costs. State, regional, and local transportation agencies update the TIP program each year to reflect priority projects in the CLRP. CLRP and TIP updates are made through an annual Call for Projects process. Member agencies submit projects or update projects in the CLRP and TIP. The Call is usually made in the fall of each year and projects are then typically due in the beginning of January. Agencies must complete a Project Description Form for each project they submit for the CLRP and TIP (See Appendix A). This form includes several details about each project and how this project benefits the region. Each agency must indicate which of federally required Planning Factors apply to their project. In November 2009, TPB staff updated the Project Description Form to include the Freight Planning Factor. The language reads, will the project increase the accessibility and mobility of freight? With this update regional transportation planners can more easily track where 21
22 improvements are made for freight transportation in the region. Because the CLRP and TIP receive most of their submissions from member jurisdictions, the majority of projects are publicly funded projects. Occasionally a public-private partnership will fund a project. For this reason, the majority of CLRP and TIP projects that can be identified as beneficial to freight transportation in the region are interstate and highway improvement projects that fall along corridors where trucks travel. d) National Capital Region Jurisdictional Freight Planning Activities i) Regional Planning Activities and the National Capital Region Freight Plan The TPB Freight Program staff regularly communicates with the neighboring jurisdictions, departments of transportation, and MPOs to keep current on freight planning activities. Jurisdiction representatives also attend and contribute to the bimonthly Freight Subcommittee meetings (see Section 3b). In addition, the TPB has undertaken freight-related work tasks for some jurisdictions. For example, in fall 2009 TPB staff completed a survey of commercial loading zones for the District of Columbia. ii) District of Columbia Freight Planning Activities The District of Columbia s freight planning activities are addressed primarily through its Department of Transportation Motor Carrier Program. The Motor Carrier Program is made up of three Divisions; (1) Bus; (2) Freight; and (3) Technology and Innovation. The Freight Division covers truck and rail duties. The Truck Group works on policy issues such as developing new rules for commercial curbside loading zones in the District of Columbia. Other truck issues include vehicle permitting, overweight vehicle issues, and enforcement issues. The Rail Group coordinates with Class One railroad CSX on rail activities that impact the District of Columbia. iii) State of Maryland Freight Planning Activities Several major Maryland Department of Transportation (MDOT) efforts address freight. Most statewide and regional freight planning activities are coordinated by the MDOT Office of Planning with support from the Office of Freight Logistics. The Office of Freight Logistics includes staff dedicated to each mode. MDOT completed one of the nation s first state freight plans, the Maryland State Freight Plan in September The document provides a comprehensive overview of the state s current and long-range freight planning activities and investments, and serves as an input to the Maryland Transportation Plan. The Maryland State Freight Plan includes statewide freight goals and objectives, a review of infrastructure important to freight movement, a summary of freight movements in the state by mode and direction, freight industry economic influence, freight policy challenges, and a financially unconstrained list of projects that are prioritized high-medium-low based on specific factors for each mode. The MDOT Office of Planning is also working on the Maryland Statewide Rail Plan. This Plan will include both freight and passenger rail projects that would be beneficial to 22
23 Maryland rail transportation. It is being developed in conjunction with the National Rail Plan, Amtrak Master Plan, and other Class One and Short Line rail plans. Due to the need to have synergy with these plans, as well as to reflect high-speed intercity passenger rail projects, the plan release is scheduled for a future date. iv) Commonwealth of Virginia Freight Planning Activities The Commonwealth s Multimodal Office coordinates the freight planning efforts of several state agencies, including the Virginia Port Authority (VPA), the Virginia Department of Rail and Public Transportation (DRPT), and the Virginia Department of Transportation (VDOT). In the case of TPB, VDOT s Northern Virginia Region office and DRPT are involved with TPB freight planning and coordinating activities. A VTrans 2035 Surface Transportation Plan was completed in March 2010 and a Multimodal Freight Study is expected to be completed in the months beyond publication of this document. The DRPT completed the Virginia State Rail Plan in June This Plan details information on the future needs of Virginia s rail system and provides recommendations to meet those needs. 23
24 4) TPB FREIGHT PROGRAM a) Freight Program History The Transportation Planning Board (TPB) began to include a dedicated freight planning task in its Unified Planning Work Program in fiscal year Prior to that time, freight issues were addressed in overall transportation planning, but to a limited extent. Involvement in freight transportation included participation in freight-related groups, such as the I- 95 Corridor Coalition, and with neighboring Metropolitan Planning Organizations (MPOs), particularly the Baltimore Metropolitan Council (BMC) Freight Movement Task Force. In May 2007, consultant Cambridge Systematics completed a Freight Profile of the National Capital Region entitled Enhancing Considerations of Freight in Regional Transportation Planning. Following upon study recommendations, the TPB s Freight Program was strengthened in November 2007 with the hiring of one dedicated Freight Program staff. In July 2009, the Freight Program presented an Integrate Freight Report to the TPB. This report highlighted regional freight trends and identified steps to incorporate freight into the transportation planning process. Seven steps were identified from a Guidebook for Integrating Freight into Transportation Planning and Project Selection Process (NCHRP #594) and the Freight Program s work toward these steps were detailed in the report. b) Freight Subcommittee A critical activity in order to strengthen the Freight Program is to develop relationships with regional freight stakeholders. The TPB Freight Program works toward doing this through its Freight Subcommittee and outreach activities. Freight Subcommittee meetings are occasions for individuals in the goods movement community to share information and to provide input on the regional transportation planning process. In order to address regional freight transportation concerns, the Freight Subcommittee has identified the following objectives: To Provide a Voice for Freight in Transportation Planning To Recognize Freight s Role in Economic Development To Recognize Freight s Integrated Role in the Multimodal System To Coordinate Transportation and Land Use To Recognize How Freight can Reduce Air Quality Impacts The Freight Subcommittee was established in April Freight Subcommittee meetings are held bimonthly. They are usually located at the Metropolitan Washington Council of Governments offices with an occasional out-of-office location or tour. Each meeting includes one or two invited freight industry speakers and a TPB Freight Program 24

25 update. Following the Freight Program update there is an opportunity for attendees from agencies and industries to share activities and updates. Summaries from Freight Subcommittee meetings and information on upcoming meetings can be found on the Freight Subcommittee Web Site. Freight Subcommittee meeting topics have included: I-95 Corridor Coalition Freight-related Activities Enhancing Consideration of Freight in Regional Transportation Planning Study CSX National Gateway Rail Initiative and Benning Yard/Virginia Avenue Tunnel tour Continuous Airport Systems Planning (CASP) Program Update Washington DC Presidential Inauguration Preparations for Trucks and Buses FedEx National Capital Region Operations and Challenges/Facility Tour Guernsey Office Products National Capital Region Operations and Challenges American Transportation Research Institute, Freight Performance Measures Norfolk Southern Railroad in the National Capital Region Maryland Food Center Authority Operations and Challenges/Tour Regional Anti-Idling Diesel Campaign FedEx Facility Tour District of Columbia Commercial Curbside Loading Zone Implementation Act 2009 Update on the Congestion Management Process c) Freight Stakeholder Outreach In February, March, and April of 2009, TPB staff conducted a Stakeholder Outreach Survey. The objective was to get feedback from shippers, receivers, and wholesale/distribution centers from various industries in the National Capital Region. Survey questions were broken into three parts: (1) Business Characteristics; (2) Business Perceptions of Transportation Challenges; and (3) Business Involvement in Freight Issues. The spectrum of companies interviewed spanned the horizon, including: lumber, concrete, stone, beer wholesalers, grocery warehousing, and a newspaper printer. i) Survey Methodology TPB staff drafted the survey based on an example provided in the Enhancing Consideration of Freight in Regional Transportation Planning study. From there, the survey was refined for the TPB Freight Program s purpose. A draft run-through of the survey was conducted with three companies for feedback and adjustments were made. 25
26 The TPB Freight Program purchased from IHS Global Insight business contact data to conduct the telephone survey. This data is part of the IHS Global Insight Freight Locator Database. The large contact dataset was narrowed down to determine whom to call. The dataset was first sorted by jurisdiction (for those within the TPB planning region), and then sorted by total tonnage for each jurisdiction. TPB staff subsequently attempted to contact the top 15 percent of freight contacts per jurisdiction (pre-sorted by tonnage). Only businesses that were determined to be applicable for our survey questions were contacted. A total of 35 telephone surveys were completed. ii) Survey Results TPB staff found that for many surveyed it was difficult to identify specific transportation recommendations. Most of those surveyed mentioned general concerns about traffic and rush hour congestion in the region as the most significant challenge to doing business. Congestion on the Interstate 495, Interstate 95, and Interstate 66 facilities were repeatedly mentioned as critical to those surveyed. A few respondents were concerned about access to Interstate 66 inside the Beltway and some made suggestions to allow trucks during non-rush hour or to allow smaller trucks. iii) Additional Freight Outreach Additional Freight Program outreach efforts include participation in: MPO Freight Program Participation Freight Program staff participate and make presentations at neighboring MPO meetings such as the Baltimore Metropolitan Council Freight Movement Task Force and the Delaware Valley Regional Planning Commission Goods Movement Task Force. State Freight Activities Freight Program staff maintain correspondence with TPB member state Departments of Transportation to keep knowledgeable of state freight planning initiatives. Federal Highway Administration (FHWA) Talking Freight Seminar Freight Program staff participate in monthly FHWA sponsored net-conference seminars on various freight topics and staff has presented for FHWA Talking Freight. Council of Supply Chain Management Professionals (CSCMP), National Capital Region Chapter Freight Program staff maintains a membership on the CSCMP National Capital Region Roundtable and is a board member. I-95 Corridor Coalition Intermodal Committee Freight Program staff regularly participates in I-95 Corridor Coalition meetings. Transportation Research Board (TRB) TRB Intermodal Committee and TRB Urban Freight Committee Freight Program staff participates in these TRB committees and has participated on review panels to edit papers. 26
27 5) CURRENT FREIGHT CONDITIONS a) Regional Freight Picture A region s industry and employment characteristics play a large role in its freight composition. The National Capital Region is a service driven economy. Federal, state, and local government employs 21 percent of the region. Professional and business services employ another 21 percent of the region. 20 As such, the region primarily consumes goods rather than produces them. To maintain this active consumer economy, it is necessary to have reliable freight deliveries to provide the consistent availability of goods. The supplier, shipper, and consumer all rely on the efficient movement of goods across the transportation network. b) Freight Movement in the National Capital Region by Mode Consultant Cambridge Systematics compiled Federal Highway Administration Freight Analysis Framework data and Maryland Department of Transportation data to come up with a rough estimate of total freight movements that included through trips. 21 The two pie charts in Figure 4-1 reveal that the majority of total freight movements in the region (for all surface transportation modes) by tonnage and by value are through trips. Through trips are defined as having both an origin and destination outside the region. Through trips add to congestion and air quality, with limited contribution to the region s economy. Congestion impacts the automobile driver trying to get to work or home and the local truck driver trying to make area deliveries. 20. Cambridge Systematics for MWCOG, Enhancing Consideration of Freight in Regional Transportation Planning., May 2007, p Ibid. 27
28 Figure 4-1: Estimated Freight Movement by Tonnage and Value Estimated Freight Movement by Tonnage (2002) Estimated Freight Movements by Value (2002) 8% 14% 19% Intraregional Through 7% 3% 4% Intraregional Through Inbound Inbound 59% Outbound 86% Outbound (Source: Cambridge Systematics for MWCOG. Estimates are based on two sources: Inbound, Outbound, and Intraregional numbers are based on 2002 FAF data. Through traffic is based on 2003 estimate in Draft Maryland Freight Profile, 2007.) Approximately 314 million tons of goods travel through the region annually (throughtrips), worth approximately $1.2 trillion. Based on 2002 data, it is estimated that 222 million tons of goods, worth approximately $200 billion were transported to, from, or within the Washington region annually. 22 In the same year, the United States transportation system moved 53 million tons worth $36 billion each day. 23 i) Truck Movement The trucking industry is inextricably linked to the national and regional economy and is greatly affected by economic cycles. Several analyses [and Bureau of Transportation Statistics] have shown a clear relationship between total truck miles traveled and economic growth. 24 Trucks carry the majority approximately 76 percent of the goods to, from, and within the region. 25 Most trucks we see in our communities or on our city streets are making local deliveries to our nearby groceries, offices, hospitals, and so on. In 2002, the top tonnage commodities transported by trucks to, from, and within the region were gravel 22. Enhancing Consideration of Freight in Regional Transportation Planning, Cambridge Systematics, Bethesda, MD, May Freight Facts and Figures 2009, Quoted in American Transportation Research Institute, USDOT FHWA Expenses for Mile for the Motor Carrier Industry and Forecasts through 2005, page Enhancing Consideration of Freight in Regional Transportation Planning, Cambridge Systematics, Bethesda, MD, May 2007, p
29 and waste/scrap. The top value commodities transported to from, and within the region were machinery and textiles/leather. 26 TPB model travel data estimates show that there are 496,800 regional average weekday truck trips in the National Capital Region. About 327,700 are estimated to be medium trucks (2 axle/6 tire) and 169,100 are estimated to be heavy trucks (3+ axle). The combined medium and heavy trucks represent 2.4 percent of total trips made by all vehicles in the region on an average weekday. 27 Although this percent may seem small, one must consider the large number of automobiles on the roads. Furthermore, the percent is for the entire region. Some areas, such as rural areas with fewer automobiles, will have higher percentages of trucks. a) Regional Congestion Truck drivers are aware of the National Capital Region s congestion problems. According to a Texas Transportation Institute Study, the National Capital Region ranked second behind the Los Angeles metropolitan region as the nation s worst congested region, with 62 annual hours of delay per traveler. 28 The following five worst truck bottlenecks 29 are also among the most congested locations for all traffic. I- 95 at VA-7100, Virginia I- 95 at VA-234, Virginia I-95 at I- 495, Maryland I- 495 at American Legion Bridge, Virginia I-495 at I-66, Virginia Long-haul through trucks rarely exit the interstates and calculate how they can avoid the congested periods to get through the region. Despite the number of truck drivers avoiding congestion in the region, many still need to use the roads during peak periods for through traffic and local deliveries. A Transportation Research Board study surveyed motor carriers to quantify the impacts of traffic congestion. Results indicated that motor carriers placed a premium of travel time savings during congested conditions of $144 to $193 per hour. Examples of fixed costs that may increase with congestion include: 1) Idle dock labor awaiting delayed trucks; 2) The need to dispatch additional equipment and drivers to maintain service levels to other customers; 3) The increasing opportunity costs of drivers and equipments that could be generating additional revenue. (Source: Cited in American Transportation Research Institute, An Analysis of the Operational Costs of Trucking Study, December 2008). For trucking companies, congestion diminishes productivity and increases the cost of operations, as drivers must be paid for time spent making deliveries as well as time spent stalled or 26. Federal Highway Administration, Freight Analysis Framework, TPB Transportation Demand Model, Draft Version 2.3, 2005 regional average weekday trip figures. 28. Texas Transportation Institute, Urban Mobility Report 2009, July I-95 Corridor Coalition, Mid-Atlantic Truck Operations study Final Report. Cambridge Systematics, Inc. October DFR1_MATOps_Truck%20Operations%20V3.pdf 29
30 stopped in traffic. The Texas Transportation Institute (TTI) found that the commercial vehicle cost of congestion, in both time and fuel, was $77 per vehicle hour. This figure is derived by computing vehicle hours of delay and TTI s estimate of commercial vehicle time value. 30 Additionally, congestion results in decreased fuel efficiency and increased vehicle maintenance costs resulting from stop-and-go traffic conditions. The domestic trucking sector loses an estimated $8 billion per year as a result of clogged roads. 31 Congestion also contributes to societal costs such as air pollution and increased cost of consumer goods. When faced with congestion, automobile drivers can choose an alternate route or mode, however, there are few alternatives for large trucks. The I-95 Corridor Coalition developed the Integrated Corridor Analysis Tool (ICAT), an interactive web-based geographic information system (GIS) that provides online access to information on the corridor s highway systems, system performance, and forecasts of future travel demand and conditions. In Figure 4-2 below, the blue dots represent current congestion bottlenecks in the region as identified by ICAT. Each blue dot represents bottlenecks, areas with significant annual hours of delay. Annual hours of delay equals the sum of all vehicle hours spent sitting in congestion delay over one year at that location. For example, the bottleneck on the north end of the Capital Beltway at the intersection of Interstate 95 and Interstate 495 registers 9,631,877 annual hours of delay, the largest bottleneck in our region. The second largest ICAT bottleneck in the region is at the south end of the Capital Beltway at the intersection of Interstate 495 and Interstate 395 with 7,344,878 annual hours of delay. 30. Cited in American Transportation Research Institute, An Analysis of the Operational Costs of Trucking, December Environmental Defense Fund, The Good Haul: Innovations that Improve Freight Transportation and Protect the Environment,
31 Figure 4-2: ICAT Congestion Bottlenecks in the National Capital Region (Source: I-95 Corridor Coalition, Integrated Corridor Analysis Tool, ICAT, released December 2009) 31
32 The TPB has contracted with Skycomp, Inc. to conduct regular aerial surveys of regional freeway congestion since Peak period congestion is monitored on a once-everythree-years cycle during the AM and PM peak periods. Level of Service (LOS) is used to indicate the extent of congestion. LOS A reflects generally free-flow conditions, and levels E and F reflects the most severe congestion with extended delays, as illustrated in the following diagram, Figure 4-3. Figure 4-3: Speed, Density and LOS Chart Figure 4-4 below presents Skycomp morning peak period congestion for spring 2008, our most recent data. The Virginia Department of Transportation and Maryland Department of Transportation conduct regular classified traffic counts, which distinguish between vehicle type automobile versus truck. The percent of trucks from this data is overlaid on the Skycomp map. The percent represents the proportion of total vehicles that would be trucks for a given location (note truck counts are two-way averages). The proportion of trucks in Frederick is higher because the community is more rural and relatively fewer private vehicles are on the road. 32
")
33 Figure 4-4: Percent Truck Overlay on Skycomp Morning Regional Congestion 17.9% 6.7% 9.5% 16.5% 8.5%* 10.3% 3%* 11.7% VA* Truck % Key Class 5 Vehicles 10.5%* MD Class 4 Vehicles All %s are two-way averages (Sources: Truck % Data from 2008 MDOT and 2007 VDOT Count Data, Aerial Data from Skycomp, Spring 2008) 33

34 The Federal Highway Administration also prepared a map of capacity bottlenecks on freeways used as urban truck corridors. As apparent in Figure 4-5, most of the interchanges along the Interstate 95 corridor on the eastern seaboard are an interchange capacity bottleneck. The bottleneck locations are indicated by a solid dot. The size of the open circles accompanying each dot indicates the relative annual truck hours of delay associated with the bottleneck. Figure 4-5: Interchange Capacity Bottlenecks on Freeways Used as Urban Truck Corridors (Source: b) Regional Truck Issues Trucks often find it difficult to maneuver dense urban areas such as the District of Columbia. One concern is the availability of commercial loading zones for trucks to make safe deliveries. There are often no commercial loading zones for a truck to park and unload. Sometimes truck drivers must parallel-park to complete their delivery. This becomes a headache for the truck driver who must parallel park as well as the automobiles that are forced to merge into the lanes around the truck when a commercial loading zone is not available. Truck operators in the District of Columbia may view 34
35 potential parking tickets from parallel parking as part of the cost of doing business. For example, FedEx Express Global in the District pays approximately $100,000 a year in parking tickets to the District of Columbia.32 The commercial loading zone issue reveals how important it is to coordinate land use planning and transportation. It is important to accommodate sufficient commercial loading zone space to safely service retail developments. The District of Columbia has taken initial steps to rectify the commercial loading zone shortage. A bill titled the Commercial Curbside Loading Zone Implementation Act was introduced on October 22, The intention of this legislation is to develop a Commercial Curbside Loading Zone Management Plan which will be administered by the District Department of Transportation s Motor Carrier Management Program. This Plan studied options to improve the management and operation of commercial loading zones in the District of Columbia. The District of Columbia will analyze the use of loading zones throughout the city and evaluate size, location and usage. The District will oversee and enforce the use of loading zones to unsure the space is available for carriers to actively load and unload freight. The District is considering a system for fleets to pay for the use of the loading zones to encourage turnover as well. Ultimately, this legislation will result in a comprehensive program that will maximize the use of the loading zone space, reduce double parking, decrease traffic congestion and improve carrier operations. A final decision on approach will be made in the fall of Most heavy trucks that exit the interstates head toward local warehouses near the interstates. The cost of warehousing rose 9.5 percent in 2008 with the economic slump. To increase revenue generation there has been an increase in the number of value added services provided by warehouses, such as label printing, assembly, shrink wrap, and distribution chain consulting. 33 Local cargo deliveries may be made by smaller trucks from the warehouses. Smaller trucks are more flexibility to make individual deliveries to local stores. A National Network for trucks was designated by the Surface Transportation Assistance Act (STAA) of 1982 and remains largely the truck routes of today. The STAA National Network for trucks applies width and length limits. STAA routes include all interstates and a number of United States Highways and State Highways. Figure 4-6 is a map of the National Capital Region STAA Truck Routes. Appendix B includes more detailed maps for the District of Columbia and the Commonwealth of Virginia, both have added additional routes truck routes. The Maryland Truck Route map closely parallels the STAA routes. 32. FedEx Express Global presentation to the March 19, 2009 Freight Subcommittee. 33. Council of Supply Chain Management Professional s Annual State of Logistics Report, June 17,

36 Figure 4-6: Surface Transportation Administrative Act Truck Routes Source: Data compiled from District of Columbia Motor Carrier Program, State of Maryland State Highway Administration, and the Commonwealth of Virginia Department of Transportation, Fall
37 Trucks are banned from Interstate 66 inside the Beltway. In Virginia, a series of High Occupancy Toll (HOT) lane projects are planned for future construction, and some already exist. These HOT lanes are free to carpoolers, buses, and emergency vehicles. All others pay a variable toll to use the lanes. Large trucks will not be able to use HOT lanes. 34 In Maryland, trucks are banned from the Baltimore-Washington Parkway south of Route 175. Trucks will be allowed on the Inter-County Connector (ICC) toll facility that will connect I-270 with I-95, which is expected to be fully operational in The ICC will charge variable rates depending on size of vehicle and time of day. The National Capital Region s designated Parkways also ban trucks. For example, trucks are not allowed to travel on the Rock Creek Parkway, the Clara Barton Parkway, and the George Washington Memorial Parkway. Commercial vehicle weigh stations are an important element of the regional truck infrastructure network. Weigh stations are intended to enforce motor carrier law for the safe movement of commercial vehicles and the traveling public. There are six weigh stations in the National Capital Region. See Appendix C for more information on the National Capital Region weigh stations. ii) Rail Movement By design, railroads usually transport commodities long distances, past state boundaries. As a result, the National Capital Region is an important through corridor for freight rail shipments. Shipments moving to, from, and within the region comprise five percent of total rail shipments. In 2002, the top tonnage commodities transported by rail to, from, and within the region were coal and gravel. The top value commodities transported to, from, and within the region by rail were motorized vehicles and coal. Looking to 2030, rail tonnage is projected to grow by 50 percent from 2002 level. 35 Much of the freight rail infrastructure in the United States is over a century old with geometric and capacity constraints that limit railroads ability to take full advantage of modern rail technologies such as double stacked container trains. As railroads compete for business in the global economy, they race to improve their rail networks. The elimination of clearance obstructions is an example where major efficiencies and transportation time savings can be made for freight rail movement. Additionally, Class One freight rail tracks are often shared with passenger rail service, limiting the number of trains that can use the track at a given time and slowing train speed. Improvements to freight rail tracks, particularly additional sidings where they are shared with passenger rail, ultimately benefit both the freight rail and passenger rail service in the region. 34. VDOT Press Release, April Federal Highway Administration, Freight Analysis Framework,
38 The Surface Transportation Board (the federal agency with jurisdiction over the economic regulation of railroads) classified seven railroads nationally as meeting the Class One standard in 2006, two of these operate in the National Capital Region, CSX Transportation Inc. (CSX) and Norfolk Southern Corporation (NS). Both railroads are working to position themselves for future anticipated growth in the global economy. Congestion also impacts freight and passenger rail service in the region with existing rail bottlenecks. For example, freight trains must queue on either end of the single track single stack Virginia Avenue Tunnel, leading to delays for freight and passenger rail. Such delays impede the efficient flow of all rail movement in the region. The Virginia Avenue Tunnel is a major choke point on the CSX rail line through Washington DC 38
39 CSX rail emerged from the historic Baltimore and Ohio Railroad beginning in Today, CSX has a 21,000-mile network that covers 23 states and serves over two-thirds of the American consumption market. CSX owns significant track mileage in the National Capital Region. At present, an average of trains travel through the CSX Washington DC Corridor daily, the majority of which are MARC, Virginia Railway Express, and Amtrak. Figure 4-7 shows the CSX system map. The Washington DC CSX Virginia Avenue Tunnel (pictured to the right) is one example of a major rail bottleneck. Built in 1905, the Virginia Avenue Tunnel is a single track and single stack tunnel that runs for nine blocks under Virginia Avenue in Southeast Washington. Freight trains traveling from the Southeastern United States to lines running to the Midwest and Northeast must pass through the Virginia Avenue Tunnel. No passenger trains operate through the tunnel because Virginia Avenue Tunnel those trains travel through the First Street Tunnel. At present condition, the tunnel is not able to accommodate double-stack container trains, and with a single track there is limited capacity for trains moving through the region. Trains often queue for long periods of time on either end of the tunnel to wait their turn to pass through the tunnel. The Howard Street Tunnel, although outside the National Capital Region, is a neighboring rail bottleneck in Baltimore City on the CSX Capitol Subdivision Line. Built by the Baltimore and Ohio Railroad between 1890 and 1895, the Howard Street Tunnel is 1.4 miles long underground. Similar to the Virginia Avenue Tunnel, the Howard Street Tunnel is an antiquated single-track tunnel with limited vertical clearance that precludes double-stack trains from passing. 39
")
40 Figure 4-7: CSX System Map (Source: CSX, 2010) 40
41 Norfolk Southern s (NS) railroad spans most states east of the Mississippi. It operates approximately 21,000 route miles in 22 eastern states and the District of Columbia. NS routes through Virginia and Maryland run along the major East Coast interstates. Figure 4-8 shows the NS system map. In the National Capital Region, NS owns and operates double main line tracks between Manassas and Alexandria, Virginia (totaling approximately 25 miles), main line tracks connecting Manassas and Front Royal, Virginia, and main line tracks from Manassas to Danville, Virginia. NS also operates on the Northeast Corridor with trackage rights that extend south of Baltimore to the Washington terminal area, serving industries throughout the Bowie/Landover region. Coal, coke, and iron ore is NS railroads single largest commodity group as measured by revenues, accounting for 29 percent of NS total railroad operating revenue in The growing intermodal market, consisting of moving trailers, domestic and international containers accounted for 19 percent of the NS s total railway operating revenues for the year NS operates freight service and coordinates with Amtrak and commuter passenger operators such as VRE. NS also conducts freight operations over trackage owned by Amtrak and the Maryland Department of Transportation in off-peak hours. 41
")
42 Figure 4-8: Norfolk Southern System Map (Source: Norfolk Southern, 2009) 42
43 Freight railroads are unique in that they maintain their infrastructure, add capacity, host passenger operations, and pay local property taxes on their real estate. Whereas trucks operate on publicly provided highway infrastructure, the transportation services that the rail industry provides occur over its own rights-of-way and through privately funded support service. The Washington DC area rail network represents an overlapping web of freight and passenger railroads. See Figure 4-9 below for a Map of the Washington DC Railroads. The Northeast Corridor is owned by Amtrak. Amtrak passenger service and Maryland Area Regional Commuter (MARC) trains operate along this track. The Capital Subdivision and Metropolitan Subdivision are owned by CSX. The MARC Camden Line operates along the CSX Capital Subdivision and the MARC Brunswick Line operates along the CSX Metropolitan Subdivision. The MARC Penn, Camden, and Brunswick lines serve a daily ridership in excess of 30,000 in eight counties. 36 The Virginia Railway Express (VRE), a commuter rail service, operates two lines via trackage rights agreements with Norfolk Southern. This includes the Fredericksburg Line and the Manassas Line. In addition, the Commonwealth of Virginia has established new intercity passenger rail service, operated by Amtrak on NS track, between Lynchburg and Union Station. NS also retains trackage rights over Amtrak s Northeast Corridor between Washington DC, Baltimore, and Philadelphia. Freight and passenger rail are very much intertwined as passenger operations often operate on freight track and sometimes freight operations operate on passenger track during offpeak hours. In addition to freight rail, passenger and commuter rail is a very important issue to the National Capital Region. Amtrak, MARC, and VRE carry tens of thousands of commuters and passengers each day. As the TPB considered support for the CSX National Gateway and the Norfolk Southern Crescent Corridor projects (discussed in Chapter 5), TPB members were very interested to learn about the passenger rail benefits of each project. It has become increasingly important for freight rail to be able to quantify and enumerate the passenger rail benefits of their projects MARC Growth and Investment Plan, September

44 Figure 4-9: Map of Washington DC Railroads (Source: Greater Greater Washington, September 2009, Matt Johnson.) 44
45 iii) Air Cargo Movement Air freight commodities are typically high in value, light in weight, and time sensitive. Freight is moved either on dedicated all-cargo planes (e.g. FedEx, UPS) or in the cargo holds of passenger planes. There are two air cargo airports within our region, and one just outside the National Capital Region. Washington Dulles International Airport (IAD) and the Ronald Reagan Washington National Airport (DCA) are located within the region, and the Baltimore Washington International Thurgood Marshall Airport (BWI) is located just outside the National Capital Region in Anne Arundel County, Maryland. IAD and BWI are the two primary air cargo airports that serve the National Capital Region. IAD contains four runways that conduct 24-hour operations. IAD houses seven cargo buildings accounting for 540,000 square feet of warehouse space. The facilities include specialized services, such as refrigerated and heated areas to protect sensitive perishable shipments; special handling for live animals; and security areas for short-term storage of high value cargo. IAD is also a designated international airport and accommodates international air cargo shipments. To facilitate this, IAD has permanently assigned staff from U.S. Inside an Air Cargo Plane Department of Homeland Security (DHS) Customs and Border Protection (CBP) to provide continuous security and customs support for air cargo. 37 BWI has five runways that conduct 24-hour operations. 38 There are 14 daily cargo flights on average. This includes cargo planes and in-belly cargo shipments on passenger planes. There are ten cargo buildings accounting for 414,900 square feet of warehouse space. This cargo space is located nearby rail and truck terminals, interstates, and the Port of Baltimore for multimodal transfers. 39 BWI is a designated international airport with permanently assigned DHS CBP staff; however, BWI s primary focus is on domestic air cargo services. BWI has the only U.S. Fish and Wildlife Service (USFWS) inspection gateway in the Mid-Atlantic. The U.S. Department of Agriculture also has onsite inspectors to expedite clearance of plants and vegetable air cargo shipments. 40 The 2008 Washington-Baltimore Regional Air Cargo Study did not include DCA in its air cargo analysis since it does not play a major role in air cargo in the region. As part of 37. Metropolitan Washington Council of Governments, 2008 Washington-Baltimore Regional Air Cargo Study, June 2008, p Maryland Department of Transportation, Maryland State Freight Plan, September 2009, p Ibid, p Ibid, p28. 45
46 the study an accessibility analysis was performed to show those areas accessible from DCA during the morning peak and off-peak for 2010 and The analysis concluded that despite DCA s close proximity to the District of Columbia, only a portion of the District s downtown would have good accessibility from DCA during the morning peak in 2010, and this area is expected to decrease by This demonstrates DCA s relative difficulty in moving cargo compared to IAD and BWI. Nonetheless, DCA does serve a limited air cargo market. 41 For example, FedEx Express receives one plane each morning at DCA with Express packages. The packages are sorted at the New York Avenue FedEx Express facility in Washington DC and delivered later the same day. 42 Air cargo s supplemental facilities such as those at IAD and BWI are essential to maintain an efficient commodity supply chain from origin to destination. The on-site DHS CBP at IAD and BWI and the USFWS and USDA at BWI speed up customs and inspections. The refrigeration/heating warehouses are important to maintain the goods. And 24-hour operations expedite the flow of air cargo through this key transfer point to the next step in the supply chain and ultimately to its final destination. Air cargo is a combination of two freight modes, airplanes and trucks that make the next chain in the delivery, usually to a warehouse or distribution center within the region. The Virginia Department of Transportation VTRANS 2035 study called for a new corridor running from points south of I-66 to points north of the Potomac River to provide improved access to Dulles with freight movement being a component. 43 iv) Maritime Movement A small amount of barge movements occur on the Potomac and Anacostia Rivers. These movements transport petroleum, and construction aggregates such as rock and sand. In the National Capital Region, one million tons of goods, worth $69 million are moved by water annually. 44 The National Capital Region is neighbor to two major ports, the Port of Baltimore and the Port of Virginia at Hampton Roads. A number of the products consumed in the region originate from these ports. Table 4-1 below shows the rank for the Port of Baltimore and Port of Virginia in 2008 total containers moved and in 2007 millions of short tons. The rank is from a list of Top 25 United States ports. 41. Ibid, p David Smith, FedEx Express, Presentation to the Freight Subcommittee of the Transportation Planning Board, March 13, Personal Communication, Leo Schefer, Washington Airports Task Force, March 26, Federal Highway Administration, Freight Analysis Framework, 2002 and data from U.S. Army Corp of Engineers. 46
47 Table 4-1: Rankings for Port of Virginia and Port of Baltimore Top 25 US Rank Containers Tonnage Port of Virginia Hampton Roads 5 18 Port of Baltimore (Source: FHWA, Freight Analysis Framework 2009 and Freight Facts and Figures 2009) Virginia is also home to the Virginia Inland Port (VIP). The on-land VIP is located 70 miles west of Washington DC in Front Royal, Virginia outside the National Capital Region. The VIP is near Interstates 81 and 66 (at Route 522 and Route 340) on a highway corridor to the Northeast United States that is less congested than Interstate 95 and strategically closer to the industrial Midwest. The VIP specializes in the staging and transfer of intermodal (containerized) sea-borne freight. It was designed to alleviate container and associated traffic congestion around a given seaport and move transportation and distribution infrastructure closer to inland commerce. Although the VIP falls outside the National Capital Region geographic boundaries, it is an important freight facility to the broader region. 47


48 6) REGIONAL FREIGHT FORECASTS a) Regional Freight Trends Freight demand is driven by population and economic growth. The National Capital Region is among the fastest growing areas in the country. With more people and jobs coming to the area all the time, the impacts on the transportation system are felt by all. Population and employment are expected to continue to grow over the coming decades. The region is forecasted to grow by more than 1.2 million people and nearly 1 million jobs between 2010 and 2030 a 22 percent increase in population and a 29 percent increase in employment. Forecasts indicate that by 2030, the region will contain 6.4 million people and 4.2 million jobs. 45 The results of this growth pattern will impact our transportation planning decisions. See Figure 5-1 below. Figure 5-1: It is estimated by the Freight Analysis Framework (FAF), produced by the Federal Highway Administration (FHWA), that the Metropolitan Washington Region is projected 45. Constrained Long Range Plan Update 2008, p19. 48
49 to see the amount of total tonnage moving to, from, and within the region to increase by 110 percent and the value to increase by 145 percent between 2002 and b) Regional Freight Economy Moving freight quickly and economically enables our region to be competitive and meet the demands of our people. People want their goods to be readily available. The National Capital Region and the Nation must plan ahead for an efficient transportation system in order to maintain its competitiveness in light of the future demands of a global economy. Despite the 2008 recession, three East Coast ports posted gains in container (twenty-footequivalent, TEU) movements in 2008 over the prior year. These were Norfolk, Savannah, and New York. All other Top Ten United States ports posted declines in container traffic. 47 West Coast ports and particularly Los Angeles/Long Beach are seeing what may be a permanent reduction in traffic levels after decades of dominance on ocean freight activity. At present, four out of every ten containers move through these two West Coast ports. 48 i) Freight and the Global Economy The upcoming Panama Canal expansion has the potential for significant growth for east coast ports and freight movement. As the West Coast facilities reach capacity, the impending opening of the updated Panama Canal will impact shipper route selection. The canal currently has capacity for 5,000 container TEU ships. The expanded future Panama Canal will have capacity for 12,000 container TEU ships. Figure 5-2 illustrates the difference in size of the ships. The Panama Canal Expansion is anticipated to be complete in The East Coast Ports are gearing up in anticipation of the larger ships. For example, the Port of Virginia and private industry have worked to dredge and build port facilities capable of handling the largest container ships on the ocean. Their upgraded facility is currently the deepest on the east coast. The Port of Virginia accommodates 50 foot depth with no air draft obstructions, and includes a mile long wharf Enhancing Consideration of Freight in Regional Transportation Planning, Cambridge Systematics, Bethesda, MD, May 2007, p2-30. A FAF data update is underway by the FHWA with 2007 data. 47. Council of Supply Chain Management Professional s Annual State of Logistics Report, June 17, 2009, sourced from the U.S. Journal of Commerce PIERS Database. 48. Council of Supply Chain Management Professional s Annual State of Logistics Report, June 17, Kevin Abt, Chief Engineer, Port of Virginia, personal communication, January 28,

50 Figure 5-2. Panamax and Post-Panamax Load Capacity The Norfolk Southern railroad Heartland Corridor project is being built in anticipation of the Panama Canal growth. With public support, this project will clear a double-stacked route between Norfolk, Virginia and Columbus, Ohio. It includes a new Rickenbacker Intermodal Terminal near Columbus, Ohio. The Heartland Corridor is scheduled to be complete in the second quarter of c) Forecast by Mode i) Truck Trucks carry the majority approximately 76 percent of the goods to, from, and within the region. In 2002, the top tonnage commodities transported by trucks to, from, and within the region were gravel and waste/scrap. The top value commodities transported to from, and within the region were machinery and textiles/leather. 50 We can expect the relationship between trucking companies and railroads to change as railroad and air cargo intermodal shipments increase. Between 1980 through 2006, the nation s railroad mode share measured in revenue ton-miles grew from 30 percent to 43 percent. 51 In this same period, intermodal shipments (shipping containers and truck trailers on rail flat cars) were the fastest growing segment of traffic on the rail system. 52 Based on COG/TPB traffic model forecasts, heavy truck volumes are projected to increase by 38 percent between 2002 and 2030; medium truck volumes are projected to increase by 47 percent between 2002 and 2030; and the volume of through traffic is projected to increase by 14 percent in the region. This increase in traffic volumes will affect the movement of goods in the region Federal Highway Administration, Freight Analysis Framework, Bureau of Transportation Statistics 2008, Draft National Rail Plan Association of American Railroads, Railroad Facts Draft National Rail Plan Enhancing Consideration of Freight in Regional Transportation Planning,2007, p
51 It is difficult to pinpoint exact truck travel forecasts for specific roads and intersections, however, screenline analyses are useful as a broad tool to forecast truck travel in the region. Transportation Planning Board (TPB) staff defined screenlines for the region in the 1970s. Screenlines are rings and spurs around the region that are associated with major roadways and geographic features such as the Potomac River. Screenline analyses rely on TPB Transportation Demand Model outputs. Staff examines the total volume crossings along various line segments. A screenline can measure many miles in length and cross many intersections. When a vehicle crosses one screenline, that vehicle exits one region and enters another area on the other side of the screenline. Like all transportation modeling, it is important to be cautious with screenline analysis as it is based on numerous assumptions, such as anticipated population and employment growth. See Appendix D for the Regional Screenline Map and Location Table and Appendix E for a table showing Truck Volume Crossing Regional Screenlines. The Appendix E Truck Volume Crossing Regional Screenline table reveals that the majority of truck traffic growth is forecasted to occur in the suburban areas of Washington DC. The inner and outer suburbs are also where the region forecasts the most of its future employment and population growth. It is important to recognize that while screenlines give a broad view of where growth in truck traffic may occur, this does not reflect the proportion of trucks in a region. Proportions of trucks vary greatly by region and area land uses. Table 5-1 presents truck vehicle miles traveled (VMT) for 2005, 2010, 2020, 2030 and the percent change between 2010 and
52 Table 5-1: Truck Jurisdictional VMT by Year ( ) Truck (2 Axle, 6 Tire Trucks and all Combination Trucks) Jurisdictional VMT by Year (2005 to 2030) Jurisdiction Name Change %Change District of Columbia 518, , , , , % Montgomery 1,189,700 1,203,500 1,380,500 1,639, , % Prince George's 1,707,600 1,939,800 2,121,100 2,212, , % Arlington 175, , , ,600 33, % Alexandria 101, , , ,700 18, % Fairfax 1,609,300 1,741,800 2,076,000 2,307, , % Loudoun 345, , , , , % Prince William 680, , ,300 1,132, , % Frederick 1,012,400 1,099,400 1,299,900 1,451, , % Howard 1,100,400 1,165,800 1,440,300 1,537, , % Anne Arundel 841, ,700 1,060,000 1,203, , % Charles 216, , , ,400 71, % Carroll 303, , , ,400 86, % Calvert 92, , , ,700 28, % St. Mary's 81,100 91, , ,300 23, % King George's 100, , , ,500 43, % Fredericksburg 46,900 54,700 69,300 81,500 26, % Stafford 527, , , , , % Spotsylvania 266, , , , , % Fauquier 293, , , , , % Clarke 106, , , ,400 61, % Jefferson 137, , , ,500 46, % Total 11,454,000 12,522,900 14,877,600 16,685,600 4,162, % ii) Rail As with many other modes, the rail industry was experience a downturn in the recent recession. In 2008, intermodal units were down by more than four percent from 2007 and another 14 percent during During the first 10 weeks of 2010, intermodal units increased 8 percent from the same period in 2009, but down 7 percent from the same period in Despite our recent recession, rail tonnage is forecast to grow by 50 percent in 2030 from 2002 levels Federal Railroad Administration, Office of Policy and Communication, Freight Railroads Background, Federal Highway Administration, Freight Analysis Framework,
53 In their efforts to be competitive under the projected future growth forecasts, both Class One railroads in the National Capital Region, CSX and Norfolk Southern, have undertaken major initiatives to improve their railway network. a) CSX National Gateway The CSX National Gateway is an effort to clear 61 obstructions in six states across the Mid-Atlantic and Midwest, in addition to five new and two upgraded intermodal facilities. Thirteen projects fall within the National Capital Region (see Table 5-2). In addition to these projects, a new Baltimore-Washington Intermodal facility will be built. The total cost of the National Gateway Initiative is estimated at $842 million. CSX plans to contribute 50 percent and to receive 25 percent from state partners and another 25 percent from federal funds. CSX sought the support of the TPB for the National Gateway project. CSX made presentations before the Freight Subcommittee, the Technical Committee, and the TPB. Concerns were raised by the TPB about the National Gateway s ability to accommodate additional passenger trains. CSX referred to specific efforts to cooperate with regional passenger rail services to incorporate additional trains in the future. Another TPB concern was that both the TPB and CSX were applying for funds under the American Recovery and Reinvestment Act (ARRA) Transportation Investment Generating Economic Recovery (TIGER) grant program. A TPB letter of support for the National Gateway was adjusted to highlight that although the TPB gave broad support for the project, the TPB had other TIGER grant priorities for the TPB region the TPB Regional Priority Bus Project. On September 16, 2009, the TPB approved a letter of support for the CSX National Gateway. TIGER grant awards were announced on February 17, CSX won $98,000,000 in funds for projects that fall outside the National Capital Region in Ohio, Pennsylvania, and West Virginia. CSX continues with work on the projects that fall within this region with a combination of their own funds, state funds, and future solicitations for federal funds. Public-Private Partnerships (PPPs) are a collaborative effort between public and private sectors to fund large projects. The goal of PPPs is to develop creative infrastructure funding programs that leverage private investment funding. PPP s have received considerable government attention as fuel tax revenues decline and state budgets face shortfalls. The railroad industry has sought and won some of these relationships with major projects across the country such as the Chicago CREATE project. The objective of the Chicago CREATE project is to establish dedicated freight and dedicated passenger rail lines throughout the city of Chicago to eliminate freight and passenger rail interference. 53
54 Table 5-2: CSX National Gateway Projects in the National Capital Region CSX National Gateway Projects in the Washington Region # City, County Project Name Description Cost Historic Designation 1 District of Columbia Virginia Ave. Tunnel Raise/Replace Tunnel Roof, Double Track Double Stack $160,000,000 No Lower Track $5,006,000 No 2 District of Columbia New Jersey Ave. 3 District of Columbia 10th St. Lower Track * No 4 District of Columbia I-395 Ramp Lower Track * No 5 District of Columbia 12th St. SW Lower Track $6,387,000* No 6 District of Columbia Potomac River Bridge $415,000 No Swing Bridge Modification 7 Catoctin, Frederick Catoctin Tunnel Total Arch $2,757,000 No Liner Removal 8 Point of Rocks, Point of Rocks Total Arch $4,522,000 No Frederick Tunnel Liner Removal 9 Germantown, Montgomery Germantown Rd. North Replace Bridge $1,433,500 No 10 Washington Grove, Montgomery Deer Park Drive Replace Bridge $3,749,200 Within Historic District, not 11 Hyattsville, Prince George's 12 Hyattsville, Prince George's 13 Woodbridge, Prince William Baltimore Washington Parkway Rt. 295 on Register Lower Track * No Kenilworth Ave. Lower Track 254,000* No Railroad Ave. Replace Bridge $2,757,000 No TOTAL: $187,280,700 * The cost for #5 includes the cost for #3 and #4. The cost for #12 includes the cost for #11. (Source: Compiled by MWCOG staff with information from CSX, 2009) 54
55 Figure 5-3 CSX National Gateway CSX National Gateway Map (Source: CSX, 2010) 55
56 b) Norfolk Southern The Norfolk Southern Crescent Corridor Intermodal Freight Program is an effort to link 13 states, 2,500 miles, between Louisiana and New Jersey with track improvements and clearance projects to allow for double-stacked train service and rail efficiencies. The Crescent Corridor parallels major north-south interstates. The Crescent Corridor will be built in three stages at a total cost of $2.5 billion. Norfolk Southern has received funding for the Intermodal Freight Program from several state partners. The Commonwealth of Virginia has invested $43 million since 2007 and has pledged an additional $60 million. NS has pledged $264 million in capital improvements by 2013 and will solicit federal funding for the remainder of the project. Figure 5-4 shows the Norfolk Southern Crescent Corridor. Similar to CSX, NS sought the support of the TPB for the Crescent Corridor. NS made presentations before the Freight Subcommittee, the Technical Committee, and the TPB. The TPB raised concerns about the Crescent Corridor s benefit to passenger trains. TPB was also concerned that both the TPB and NS were competing for the same ARRA TIGER grant program. The letter was adjusted to highlight that although the TPB gave broad support for the Crescent Corridor, the TPB had other TIGER grant priorities for the TPB region the TPB Regional Priority Bus Project. On January 20, 2010, the TPB approved a letter of support for the NS Crescent Corridor. TIGER grant awards were announced on February 17, Norfolk Southern was awarded $105,000,000 in funds for projects that fall outside the National Capital Region. One was for a new intermodal terminal in Tennessee and a second new intermodal terminal in Alabama. The TPB Priority Bus Project was awarded $58 million in TIGER funding for the Washington area. $13.6 million for projects located in the District of Columbia; $14.8 million for projects located in the State of Maryland; and $30.4 for projects located in the Commonwealth of Virginia. Of the total funds, $46.5 million will go toward funding for a complete sub-package of priority bus corridor enhancements, $12.3 million in funding for the Takoma/Langley Transit Center in Prince George s County. 56

57 Figure 5-4: Norfolk Southern Crescent Corridor Intermodal Freight Program (Source: Norfolk Southern, 2009) 57

58 iii) Air Cargo Movement As the number of persons, households, and jobs grow in the region, so will the increased demand for air cargo. The June 2008 TPB 2008 Washington Baltimore Regional Air Cargo Study affirms this. Growth leads to increased demand for air cargo services in the region provided principally by Washington Dulles International Airport (IAD) and Baltimore Washington International Thurgood Marshall Airport (BWI). 56 Air cargo is the fastest-growing segment of the nation s freight system; however, it remains the smallest proportion of all modes. Air cargo tonnage to, from, and within the region is expected to grow nearly 500 percent by In 2002, the highest value air cargo commodity moving to, from, and within the region were electronics valued at $3 billion. 58 Accessibility to airports is projected to worsen between 2010 and 2030 due to increased congestion even though regional transportation FedEx Air Cargo Plane improvements will be implemented during the period. The air cargo sector is dependent upon trucks to make initial and final deliveries. Regional congestion is an important issue for area airports. iv) Maritime Movement There are a handful of small scale tug and barge operations in the National Capital Region on the Potomac and Anacostia Rivers. Maritime movement is promoted as dependable (with little waterway congestion), safe, and environmentally friendly. The Maritime Administration (MARAD) endorses maritime movement as a clean alternative to truck, rail, and air cargo movement. Waterway transportation experiences the least number of accidents of any mode. 59 Total marine cargo handling across the nation increased 18 percent between 2001 and On the Potomac and Anacostia Rivers, petroleum and aggregates such as rock, sand, and other building materials are the most common commodities transported. For example, Vane Brothers owns its own tugs and barges to haul petroleum in this region. 61 The Virginia Power Plant is also served by barges that deliver coal. 56. Ibid. 57. Enhancing Consideration of Freight in Regional Transportation Planning, May 2007, p Enhancing Consideration of Freight in Regional Transportation Planning, May 2007, p American Waterway Operators, U.S. Department of Labor, Bureau of Labor Statistics, Quarterly Census of Employment and Wages; available at: Don Browning, Vane Brothers, Personal Communication, March 3,
59 The Norfolk Tug and 64 Express businesses operate out of Norfolk just south of the National Capital region. The Norfolk Tug Company s business spans the Mid-Atlantic region. The predominant commodities towed by Norfolk Tug are petroleum and aggregates such as coal and woodchips. The 64 Express is a tug service on the James River. The 64 Express conducts near coastal ocean tugging. They transport a variety of barge-loaded bulk cargoes such as containers, petroleum, coal, fertilizer, aggregate, woodchips, and construction steel and dredge products Ed Whitmore, Norfolk Tug Company, Personal Communication, February 24,
60 7) LAND USE AND THE ENVIRONMENT a) Land Use and Zoning The relationship between land use and zoning has a major impact on where to anticipate freight transportation. It is often a challenge to coordinate land use/zoning and transportation decisions because land use and zoning decisions are usually made by the local and county jurisdictions level where transportation decisions are usually made at the state and federal level. Departments of Transportation may not be part of state-level action plans and strategy development. Residents may raise environmental justice concerns because of nearby undesirable land uses and this may lead to potential jurisdiction and industry conflicts. It is imperative that coordination takes place among local jurisdictions, regional, state, and federal land use, transportation planning officials, and locating industries. It is also important that outreach takes place with local communities that may be impacted by transportation decisions. Additionally, the decline in available industrial land for freight purposes is a growing concern. Jurisdictional zoning officials find it difficult to juggle land availability for residential or retail use or industrial and freight uses such as truck parking lots which may generate less tax revenue. Shippers are finding it difficult to locate their warehouses. Truckers are finding it difficult to park their trucks. Industrial land and truck parking are a necessary resource for the movement of goods throughout the region. 63 The United States Department of Transportation is working to define Intermodal Connectors both passenger and freight. Intermodal freight connectors are short, averaging less than two miles in length. They are usually local, county, or city streets and generally have lower design standards than mainline National Highway System (NHS) routes. Intermodal connectors serve heavy truck volumes moving between intermodal freight terminals and the NHS, primarily in major metropolitan areas. They typically provide this service in older, industrialized, and other mixed land use areas where there are often physical constraints or undesirable community impacts. 64 Thus far, only passenger intermodal connectors (such as train stations) have been identified for the region. Given the needs and attention for passenger-related projects, little incentive exists for investing in freight projects that appear to primarily benefit only a small segment of the constituent population. b) Freight Activity Centers Freight activity centers are clusters of freight facilities such as warehouses and distribution centers. Freight facilities are areas that generate freight transportation activity. Freight facilities might function to transfer goods, repackage goods, or an intermodal exchange of goods. Figure 6-1 National Capital Region Freight Generators and Freight Clusters reveals the general locations of emerging freight clusters in the region. 63. Gannett Fleming, Truck Parking Partnership Study for Baltimore Metropolitan Council, October US Department of Transportation, Federal Highway Administration, NHS Intermodal Connectors Report to Congress, December
61 The New York Avenue corridor is a freight cluster in Washington DC. New York Avenue is the main highway freight route into and out of the District of Columbia. Goods are typically transported by large trucks to transfer facilities in the vicinity of New York Avenue, where they are loaded onto smaller trucks, box trucks, and step vans, and prepared for distribution to the District s local businesses. For example, FedEx Express is located along New York Avenue. Additionally, the Washington Times newspaper headquarters and printing facility is located at the Maryland/Washington DC border on New York Avenue. Virginia has several freight clusters. They are located at Springfield/Lorton/Newington, Dulles Airport, Manassas, and Fredericksburg. For example, the cargo facilities at Dulles include UPS, Air Cargo, and FedEx. Maryland is home to a large freight cluster at Jessup/Elkridge/Savage Center. This cluster includes the Maryland Food Center Authority (MFCA) campus of food related warehouses and distribution centers. Neighboring the MFCA is the TravelCenters of America Truck Stop along the Interstate 95 corridor. This is a popular privately operated truck stop that offers services to truckers such as showers, lodging, and a barber shop. Additional Maryland freight clusters are located at Beltsville/Laurel, Capitol Heights, Upper Marlboro, Frederick, and just outside the TPB planning region is the Hagerstown cluster. 61

62 Figure 6-1: National Capital Region Freight Generators and Freight Clusters * Cambridge Systematics for MWCOG, Enhancing Consideration of Freight in Regional Transportation Planning, May 2007,
63 c) Freight and the Environment Transportation is the second-largest source of greenhouse gas (GHG) emissions in the United States. The United States highway system produces 1/20 th of the world s carbon dioxide emission. Freight modes contribute 27.4 percent of total transportation greenhouse gas emissions. Figure 6-2 shows the breakdown of U.S. Greenhouse Gas Emissions by Freight Transportation Mode for Figure 6-2 U.S. Greenhouse Gas Emissions by Freight Transportation Mode, 2006 Trucking 20.5% Passenger Modes 72.6% Freight Modes 27.4% Freight Rail 2.6% Ships and Other Boats Domestic 1.5% Pipelines 1.6% Commercial Aircraft Domestic 1.1% (Source: Federal Highway Administration, Office of Planning, Environment, and Realty, Robert Ritter, Freight and Climate Change, presented to FHWA Talking Freight, June 17, 2009) There are four primary strategies to reduce transportation-related GHGs: (1) Raise vehicle energy efficiency; (2) Reduce carbon content of fuels; (3) Reduce vehicle-miles-traveled; and (4) Improve vehicle and system operations. Through a push for increased sustainable policy and updated technologies, incremental advancements are being made in the freight transportation arena. i) Sustainable Truck Policies On May 19, 2009, President Obama announced an aggressive new national policy to increase fuel economy and reduce GHG pollution for all new cars and light duty trucks sold in the United States. The new standard requires a Corporate Average Fuel Economy (CAFÉ) standard of 35.5 to 39 miles per gallon by 2016 for cars and 30 miles per gallon for light trucks and sports utility vehicles. CAFÉ standards represent the average fuel economy for a manufacture s fleet of vehicles in a given model year. Unlike previous legislation, this regulation provides a uniform standard across all states. The new National Program will regulate model year 2012 through
64 There is no current CAFÉ standard for medium and heavy-duty vehicles in the United States. Medium and heavy-duty truck fuel efficiency is being addressed independently on two different fronts. Under the Energy Information and Security Act of 2007, Congress has charged the National Highway Traffic Safety Administration (NHTSA) to finalize a rule to implement a truck fuel efficiency improvement program for medium and heavy trucks by September 18, The U.S. Environmental Protection Agency (EPA), under the authority of the Clean Air Act (CAA), is developing a regulation to set national emissions standards for carbon pollution. This action follows the 2007 U.S. Supreme Court decision in Massachusetts versus EPA which held that GHG pollutants are under the CAA and EPA s formal determination that such GHGs endanger public health and welfare. According to the EPA, a rule may be proposed in fall ii) Sustainable Truck Technologies Several new truck technologies have emerged that reduce the truck s impact on the environment. Most technologies are centered on truck idling emissions. Truck drivers must rest when their hours of service are up, and they often idle their truck to maintain power and access to heating, cooling, and other accessories. Idle reductions technologies such as auxiliary power unit (APUs) and truck stop electrification help reduce GHGs. APUs are externally mounted on the truck cab and provide energy to the driver via electricity when the engine is turned off. Truck stop electrification provides electrical power to trucks from an external source at truck rest stops. Drivers can shut the main engine off and plug into an electrical outlet that provides power to the cab. Trucks need to be equipped with the required internal wiring, inverter system and heating ventilation air condition (HVAC) system, in order to take advantage of truck stop electrification. Truck stop electrification is available at a handful of truck stops in Maryland and Virginia. The amount of idling varies widely among trucks by season, type of operation, and driver practices. The EPA Smartway Transport Partnership estimates a typical long haul combination truck could idle up to 2,400 hours per year, which would use over 1,900 gallons of fuel. Using an APU instead of idling the engine could reduce this fuel use by 75 percent and eliminate over $2,000 in fuel costs plus over $300 in engine maintenance costs each year. 66 Truck weigh-in-motion technology also reduces truck idling time. This technology allows trucks to drive through a weigh station, often the right lane of a road, at 25 miles per hour. The result is a reduction in weigh station idle time, fuel cost, emissions, and an increase in travel efficiency. When weigh-in-motion technology can be installed in the road, this eliminates the need to pull trucks off the road unless there is a suspected violation. Both Maryland and Virginia have adapted weigh-in-motion data collection technology. 65. Ted Scott, American Trucking Association, personal communication, March 25, U.S. Environmental Protection Agency, Office of Transportation and Air Quality, A Glance at Clean Freight Strategies: Idle Reduction, October
65 Several additional technologies are being explored to improve truck efficiencies such as improved aerodynamics, automated tire inflation systems, wide base tires, and driver training. iii) Sustainable Rail Policies Double-stack trains create huge efficiencies for rail. In the early 1980 s, when double-stack container trains were introduced, trailer and container (intermodal) traffic averaged 3.4 million annual loadings. In 2007, intermodal freight substantially increased to 12 million annual loadings. 67 iv) Sustainable Rail Technologies It is estimated that one train is able to haul the equivalent of 280 trucks. 68 The Environmental Protection Agency (EPA) estimates that for every ton-mile, a locomotive emits roughly one-third the nitrogen oxides and particulates of alternative modes of transportation. The Association of American Railroads estimates that if 10 percent of the nation s freight were diverted to rail, fuel savings would approach one billion gallons annually. 69 CSX and Norfolk Southern promote their respective National Gateway and Crescent Corridor projects as part of the solution to reduce transportation carbon dioxide and greenhouse gas emissions. Both of these initiatives have potential for truck to rail diversions, gallons of fuel avoided, shipper cost savings, pavement maintenance savings, accident cost savings, congestion and emission savings, and increased employment. 70 Figure 6-2 Greenhouse Gas Emissions: Trucks versus Trains illustrates the difference in greenhouse gas emissions between these two modes. 67. Federal Railroad Administration, Office of Policy and Communication, Freight Railroads Background, CSX, National Resources Defense Council, National Geographic, How Tomorrow Moves, Leadership Through Environmental Innovation, National Geographic and CSX, How Tomorrow Moves: Leadership Through Environmental Innovation, Cambridge Systematics Inc. for CSX, The National Gateway Benefits Assessment II, June Norfolk Southern, The Crescent Corridor: A Broad Perspective, November

66 Figure 6-2 Greenhouse Gas Emissions: Trucks versus Trains Several rail technologies have been developed to make the railroad operation more environmentally efficient. These include operational efficiencies, rail yard efficiencies, and other technologies. CSX and Norfolk Southern have adopted many of these technologies to reduce GHG emissions. Although locomotive engines being produced today must meet relatively modest emission requirements set in 1997, the railroads have spent a lot to modernize locomotive fleets with new locomotives and to upgrade existing locomotives with emissions reduction technologies Since 1980, railroads have improved train fuel efficiency by more than 80 percent through advances in technology and operation. 71 Auxiliary Power Units (APUs) are available to the rail industry. Similar to truck APUs, rail APU provides power to the locomotive during idling conditions while allowing the main engine to be shut off. The APU is an external attachment to the locomotive. 71. National Geographic and CSX, How Tomorrow Moves: Leadership Through Environmental Innovation,
67 Both CSX and Norfolk Southern also operate GenSet locomotives. GenSets locomotives are high-efficiency switching locomotives. They are used to switch cars within rail yards and are significantly quieter than existing locomotives. GenSets monitor engine idling and switch to a sleep mode after a period of inactivity. The GenSet engine can be restarted in an instant. GenSet locomotives exceed current EPA railroad emission standards and achieve stringent noise level requirements. As a result, GenSet engines reduce GHG emissions by significant proportions. Railroads have also sought alternative off-the-track environmental improvements. For example, many signals are powered by solar energy. 67
68 8) SAFETY AND SECURITY a) Regional Overview Safety and security are an important part of planning for all transportation modes at every level local, regional, state, and national. Every region experiences safety accidents or is at risk to a security attack. The Nation s Capital is particularly prone to terrorist attack as it is home to many National icons and high-profile government officials. This section provides information on safety and security issues regarding truck and rail transportation in the National Capital Region. b) Regional Safety i) Truck Safety Federal law requires every state to prepare a Strategic Highway Safety Plan (SHSP). The SHSPs are meant to identify problem areas and improve safety on the highways. The common goals of the SHSPs for the District of Columbia, Maryland, and Virginia are incorporated into the Constrained Long Range Transportation Plan s Safety Element. The Regional Transportation Safety Report (June 2009) is a combined analysis of data from the three state SHSPs for the National Capital Region. It reveals that there were a total of 82,054 crashes in Crashes involving young drivers (21,514 at 26.2%) and crashes at signalized intersections (18,525 at 22.6%) stood out as the two largest highway safety concerns. That same year there were 6,349 crashes involving trucks at 7.7 percent. Despite lower numbers of truck incidents, truck crashes have the potential be very dangerous and therefore it is important for trucks to comply with safety regulations. The Regional Transportation Safety Report also revealed that there are more average annual crashes per 100,000 people in the District of Columbia than Maryland or Northern Virginia. And intuitively, truck crashes in the District of Columbia are concentrated on the streets with the heaviest truck traffic New York Avenue, North and South Capitol Streets, 14th Street, and Pennsylvania Avenue. 72 On April 3, 2003, Metropolitan Washington Council of Governments hosted a Safety Summit that addressed a wide range of transportation safety issues including truck safety. This Summit was formed in response to a request from United States Congressman Frank R. Wolf to address issues of truck safety relevant to the Washington Metropolitan Area and its local jurisdictions. In making this request, Congressman Wolf had cited a triple-fatality truck-involved crash on US Route 50 near Bowie, Maryland on September 11, The driver of the truck was apparently resting in the parked truck at the time of the crash. The key points made at the meeting were: 1. Technology The data flow between local, state, and federal entities needs to be established so everyone can share pertinent data; 72. MWCOG Safety Subcommittee, The Regional Transportation Safety Picture presentation, Combination of DDOT Traffic Safety Report Statics , State Highway Safety Plan, MHSO County Spreadsheets, VDOT Access data, July
69 2. Enforcement Major enforcement efforts need to concentrate off the interstates (as well as the major media coverage points already targeted on the interstates); and 3. Funding Any sustained efforts to address truck safety issues require a steady funding source (perhaps federal). Federal Motor Carrier Safety Administration trend data shows that over the past 20 years (from 1987 to 2007) there has been a 58 percent increase in registered large trucks and a 70 percent increase in miles traveled by large trucks. Over the same time period, the number of large trucks involved in fatal crashes has declined by 10 percent, and the vehicle involvement rate for large trucks in fatal crashes has declined by 47 percent. 73 Truck parking availability is important for truck drivers when their hours of service are up. The increase in truck traffic and the restrictions on driver operation time create a growing demand for truck parking facilities throughout the country, and particularly along the busy interstate corridors where trucks travel such as Interstate 95. In Maryland, a truckers guide (map) has been developed that pinpoints where drivers are allowed to park. The Hours-of-Service regulations 74 put limits in place for when and how long commercial motor vehicle (truck) drivers may operate. These regulations are designed to ensure commercial truck drivers get the necessary rest to perform safe operations. Table 7-1 below displays the current United States Hours-of-Service Rules for operating a commercial motor vehicle. Table 7-1: Hours of Service Rules for Commercial Motor Vehicles HOURS-OF-SERVICE RULES Property-Carrying CMV Drivers 11-Hour Driving Limit May drive a maximum of 11 hours after 10 consecutive hours off duty. 14-Hour Limit May not drive beyond the 14th consecutive hour after coming on duty, following 10 consecutive hours off duty. Off-duty time does not extend the 14-hour period. 60/70-Hour On-Duty Limit May not drive after 60/70 hours on duty in 7/8 consecutive days. A driver may restart a 7/8 consecutive day period after taking 34 or more consecutive hours off duty. Sleeper Berth Provision Drivers using the sleeper berth provision must take at least 8 consecutive hours in the sleeper berth, plus a separate 2 consecutive hours either in the sleeper berth, off duty, or any combination of the two. (Source: U.S. 49 Code of Federal Regulations Part 395) As raised by the Safety Summit in 2003 following the fatal accident, truck parking demand is greater than supply. When a truck driver s hours-of-service are up, he or she must find a spot off the road. If the truck lots are full, this might be at a large retail parking lot or the side of an interstate. Trucks parked on the sides of the interstate can be deadly when a car drives into the 73. Federal Motor Carrier Safety Administration, Large Truck and Bus Crash Facts 2007, January U.S. 49 Code of Federal Regulations Part
70 back of them. This scenario results in a handful of deaths each year in the region. The nearest National Capital Region truck stop is along the Interstate 95 corridor at Jessup Travel Center of America, a private truck parking facility that offers many services to truckers (there are no truck stops within the National Capital Region). Expanding the availability of truck parking along the Interstate 95 corridor and other major truck routes in the region will increase the safety of our interstates and make our region more attractive to businesses dependent on truck deliveries. ii) Rail Safety The Federal Rail Administration s (FRA) Office of Railroad Safety promotes and regulates safety throughout the Nation's railroad industry. A regional administrator and two deputy regional administrators manage each region, with a supervisory specialist for five of the safety disciplines and several chief inspectors. The five disciplines include: Hazardous Materials Motive Power and Equipment Operating Practices (including drug and alcohol) Signal and Train Control Track Structures The transportation of hazardous materials is an important safety and security issue in the National Capital Region. (Discussed more under Security) c) Regional Security i) Truck Security Trucks are a potential security threat when they are in the hands of someone with malicious intent to do damage. The Motor Carrier Management and Threat Assessment Study for the District of Columbia was conducted by Volpe National Transportation Systems Center in August As mentioned in the Study, the threat of terrorism is clearly not confined to trucks, but security experts regard trucks and a highly likely means to deliver destruction in an attack such as on: Federal agencies Federal monuments and landmarks Embassies Military facilities District of Columbia critical infrastructure Financial, religious, cultural, and patriotic icons Venues of gathered people District of Columbia Department of Transportation has restricted truck access on some streets in the City. Many of these restrictions are to protect critical areas such as those listed above; however, most of these restrictions are the result of residential complaints of truck traffic. The District has also recently finalized a citywide truck route map. 70
71 ii) Rail Security The movement of hazardous materials throughout the railroad industry provides an example of the dynamic interrelationship between shippers, carriers, freight car builders, maintenance and repair companies, and Federal, State, and Tribal governments. Under the authority of the Secretary of Transportation, the FRA Hazardous Materials Division is charged to administer a safety and security program that oversees the movement of hazardous materials, such as petroleum, chemicals, and nuclear products, throughout the Nation s rail transportation system. Under federal hazardous materials transportation law, hazardous materials transport in the United States is governed by regulations that define the requirements for: Hazardous materials carrier registration Placards and packaging Restrictions on unnecessary transport through tunnels, over bridges, or through heavily populated areas Restrictions on the transport of highly dangerous materials, such as explosives and fissionable nuclear materials Detailed and stringent limits on the ability of the state and local governments to restrict hazardous materials transport routing without Federal preemption. Freight rail is a United States common carrier. As a common carrier, a railroad cannot choose the cargo that it carries; it would be illegal for a railroad to reject a hazardous cargo. Each year, CSX and Norfolk Southern safely transport several hundred thousand shipments of hazardous materials through our region. In April 2007, the National Capital Planning Commission completed the Freight Railroad Realignment Feasibility Study. The Study came up with three recommendations that would circumnavigate freight trains around the Washington DC monumental core in an effort to reduce the hazardous material terrorist or accident threat downtown. The large price tags, lack of funding sources, and lack of political backing has stalled pursuit of these alternatives A number of Maryland officials and others registered strong objections to potential realignments and associated actions looked at in the study. 71
72 9) NATIONAL CAPITAL REGION FREIGHT PROJECT DATABASE The National Capital Region Freight Project Database has been developed as part of this National Capital Region Freight Plan. This Database represents a compilation of projects beneficial to freight movement in our region. All projects were gathered from existing or inprogress plans or reports, and Freight Subcommittee nominations. Below is a list of the project sources: Transportation Planning Board National Capital Region Transportation Planning Board, Constrained Long Range Plan, 2009 Update National Capital Region Transportation Planning Board, Draft Ground Access Element, Draft May 2010 Maryland Department of Transportation Maryland Department of Transportation, State Freight Plan, September 2009 Maryland Department of Transportation, Draft State Rail Plan, (Draft as of May 21, 2010) Maryland Department of Transportation, Maryland Transit Administration, Maryland Area Regional Commuter (MARC), MARC Growth and Investment Plan, September 2007 Virginia Department of Transportation Virginia Department of Transportation, Virginia State Rail Plan 2008 Virginia Department of Transportation, VTrans 2035 Surface Transportation Plan, March 2010 Virginia Department of Rail and Public Transportation, Statewide Rail Plan Commonwealth of Virginia Private Railroads CSX Corporation, CSXT National Gateway Norfolk Southern Corporation, Norfolk Southern Crescent Corridor Other I-95 Corridor Coalition, Mid-Atlantic Rail Operations Study (MAROPs), 2002 Draft versions of the National Capital Region Freight Plan 2010 and Freight Project Database were vetted through the TPB Freight Subcommittee, TPB Technical Subcommittee, and finally reviewed by the TPB. CLRP projects are already scheduled to be funded and built. In addition, some states have freight set asides, such as Virginia s Rail Enhancement Fund of $30 million annually for freight and passenger rail. Similarly, Florida has established a dedicated freight budget, the Florida Strategic Intermodal System, where highway, rail, port, and intermodal projects are eligible for $2 billion annually Florida Department of Transportation, Florida Strategic Intermodal System 72
73 All modes of freight movement benefit from a strengthened highway infrastructure. Trucks obviously rely on highway to deliver goods. Rail terminals rely on the surrounding roads and highways for trucks to move cargo to its final destination. Similarly, air cargo must have convenient highway access to be able to receive the trucks necessary to deliver cargo to nearby warehouses and distribution centers. Concern has been expressed by multiple freight stakeholders that a number of logistics companies/warehouses have had to open or consider opening additional satellite distribution centers in the region due to congestion and limited Potomac river crossings. The emergence of HOT lanes in the region where trucks are not permitted may become an issue. The Freight Subcommittee process will develop a Top Ten list of freight projects in the region from the National Capital Region Freight Project Database. This will take place in the fall of The Freight Subcommittee will take appropriate time to develop adequate criteria and to prioritize projects for Top Ten recognition. It should be noted that many projects appear in several source documents. In the case of the Draft Ground Access Element, all of its projects originated from the CLRP. Those projects that would support air cargo movement and access are listed in the Freight Database under only CLRP. For example, the Dulles Airport Access Road and the Intercounty Connector are listed in both the CLRP and the Draft Ground Access Element, however, these projects are listed as in the CLRP under the source column. 73
74 , 2/12/2010 NATIONAL CAPITAL REGION FREIGHT PROJECT DATABASE National Capital Region Freight Project Database Rail Projects # Project Title Limits/Description Cost Estimate Jurisdiction Source Track Owner 1 Virginia Ave. Tunnel Raise, replace tunnel roof for $160,000,000 Washington D.C. CSX-NG/MFP/VA CSX double-stack clearance, construct second track Rail Plan 2 New Jersey Ave. Undercut to lower tracks $5,006,000 Washington D.C. CSX-NG/MFP/VA Rail Plan CSX 3 10th St. Undercut to lower tracks $0 Washington D.C. CSX-NG/MFP/VA Rail Plan 4 I-395 Ramp Undercut to lower tracks $0 Washington D.C. CSX-NG/MFP/VA Rail Plan 5 12th St. SW Undercut to lower tracks $6,387,000 Washington D.C. CSX-NG/MFP/VA Rail Plan 6 Potomac River Swing Bridge Existing bridge modification $415,000 Washington D.C. CSX-NG/MFP/VA Rail Plan 7 Catoctin Tunnel Arch liner replacement $2,757,000 Frederick CSX-NG/MFP/VA Rail Plan 8 Point of Rocks Tunnel Arch liner replacement $4,522,000 Frederick CSX-NG/Draft MDOT-MRP/VA Rail Plan CSX CSX CSX CSX CSX CSX 9 Germantown Rd. Bridge replacement $1,433,500 Montgomery CSX-NG/Draft MDOT-MRP/VA Rail Plan/MFP 10 Deer Park Dr. in Washington Grove 11 Baltimore-Washington Pkwy Kenilworth Ave. in Hyattsville Bridge replacement $3,749,200 Montgomery CSX-NG/Draft MDOT-MRP/VA Rail Plan/MFP Undercut to lower tracks $0 Prince George's CSX-NG/MFP/VA Rail Plan Undercut to lower tracks $254,000 Prince George's CSX-NG/Draft MDOT- MRP/MFP/VA Rail Plan CSX CSX CSX CSX 74
75 13 Railroad Ave. in Woodbrige 14 Northeast Corridor Increase capacity and improve clearences between DC and Baltimore National Capital Region Freight Plan 2010, 2/12/2010 NATIONAL CAPITAL REGION FREIGHT PROJECT DATABASE Bridge replacement $2,757,000 Prince William CSX-NG/MFP/VA Rail Plan CSX MD MFP/VA Rail Plan NS 15 NS Crescent Corridor Add second track in MD MD Draft MDOT- MRP/MAROPs/NS NS 16 NS Crescent Corridor Land Acquisition $50,700,000 MD Draft MDOT- MRP/NS NS 17 NS Crescent Corridor Signal conversions and authoriyt to ABS/TC $2,300,000 MD Draft MDOT- MRP/NS NS 18 Complete MARC Wedge Yard in Washington Complete MARC Wedge Yard in Washington $23,000,000 MD Draft MDOT-MRP CSX 19 Outer Montgomery MARC Station Outer Montgomery MARC Station $20,000,000 Montgomery, MD Draft MDOT-MRP CSX 20 MARC Brunswick Line 3rd Track Rockville-Kensington $50,000,000 MD Draft MDOT-MRP CSX 21 MARC Brunswick Line 3rd Track, Rockville-Derwood $18,000,000 MD Draft MDOT-MRP CSX 22 MARC Brunswick Line 3rd Track, Derwood-Germantown $35,000,000 MD Draft MDOT-MRP CSX 23 MARC Brunswick Line 3rd Track, Germantown-Pepco $50,000,000 MD Draft MDOT-MRP CSX 24 Washington DC Station ADA/SGR Improvements $4,000,000 MD Draft MDOT-MRP CSX 75
76 , 2/12/2010 NATIONAL CAPITAL REGION FREIGHT PROJECT DATABASE 25 MARC Brunswick Line Add 3rd track btwn Silver Spring Montgomery/Frederick MARC/MFP CSX and Point of Rocks 26 MARC Camden Line Add 3rd track btwn Washington D.C. and Dorsey 27 New Rail Bridge over Potomac Adjoining the CSXT Long Bridge to eliminate train conflicts; and third and fourth main track on CSXT feeding into new rail bridge to eliminate train conflicts. Prince George's/Howard MARC/MFP CSX Washington D.C. MAROPs, CSX CSX 28 Regional Rail ATIS Develop Regional Rail Advanced Traffic Information System (ATIS) to exchange information among freight and passenger railroad dispatch and control systems in real time, thereby allowing the railroads to monitor the status and location of all traffic on the rail network, anticipate and compensate for traffic delays, and respond quickly to emergencies. Undertake feasibility studies of other advanced technology and information applications. 29 Northeast Capital Subdivision sidings and clearance projects Siding on Northeast Capital Subdivision and crossovers to Northeast Corridor to improve and reduce CSXT and passenger-train conflicts; CSXT clearance projects (5 locations as listed above by CSXT-NG), 2nd track to serve the VRE L'Enfant Plaza Station, and 3rd track to eliminate CSXT and passengertrain conflicts. Mid-Atlantic Region MAROPs All Washington D.C. MAROPs CSX 76
77 30 Highway-rail grade and track speed improvements National Capital Region Freight Plan 2010, 2/12/2010 NATIONAL CAPITAL REGION FREIGHT PROJECT DATABASE Highway-rail grade and track VA MAROPs CSX speed improvements on CSXT north of Richmond; various upgrades to tracks, signals, and highway crossings on CSXT to serve from Fredericksburg to Washington D.C.; sections of 3rd tack and clearance projects (11 locations) on CSXT south of Washington D.C.. 31 Walkersville, Rebuild tracks 32 MD 355, Rockville Pike Grade Separation Rebuild 2 miles of formerly outof-service track to Class 1 Standards Construct a CSX Railroad gradeseparated crossing and interchange improvements, 2020 $4,700,000 Frederick Draft MDOT-MRP? $132,336,000 Montgomery CLRP CSX 33 MD 450 Annapolis Road Grade Separation Construct a highway-railroad grade-separated crossing and intersection improvements, US 29 Columbia Pike Sligo Creek Parkway to Howard County Line, this project includes grade separations at MD 198, Blackburn Road, Dustin Road, Greencastle Road, Musgrove/Fairland Road, Briggs Chaney Road, Randolph Road, US 15 Interchange at US rd Main Track Projects, 31 miles triple track $74,926,000 Prince George's CLRP? $445,000,000 MD CLRP? Jefferson Tech Park, Grade separated interchange at US 340/US 15 at mile point 9.94, 2010 $10,900,000 MD CLRP? St. Denis to Washington DC $207,200,000 MD MAROPs/Draft MD- CSX/MARC MRP 77
78 37 VA 28 Nokesville Road, Overpass 38 Commuter Rail Improvement Project National Capital Region Freight Plan 2010, 2/12/2010 NATIONAL CAPITAL REGION FREIGHT PROJECT DATABASE Norfolk Southern Railroad B-Line $40,000,000 VA CLRP NS and Wellington Road Overpass. VA 28 will be reconstructed adjacent to its existing alignments as a four-lane divided roadway from the vicinity of Foster, 2013 Improvements to Virginia Railway Express $308,400,000 VA VA Rail Plan CSX 39 Baltimore City, Increase capacity through Howard Street Tunnel 40 Add additional track between New Carrollton and Baltimore/High Level Center Platform/ADA SGR Improvements Increase capacity $2,000,000,000 Baltimore City Draft MDOT- MRP/CSX/MAROPs Penn Line $134,000,000 MD MARC/DRAFT MDOT-MRP/MFP CSX Amtrak 41 Intermodal Container Transfer Facility Near the Port of Baltimore $75,000,000 State Funding 5 * = Cost of Project 5 includes the cost of Project 3 and * = Cost of Project 12 includes the cost of Project = Projects fall outside the NCR but important to region. Anne Arundel County Draft MDOT-MRP CSX 78
79 , 2/12/2010 NATIONAL CAPITAL REGION FREIGHT PROJECT DATABASE DRAFT National Capital Region Freight Project Database Highway Improvement Projects # Project Title Limits/Description Complete Cost Estimate Jurisdiction Source 1 11th St. Bridge (I- 295) and Interchange Reconstruction Anacostia Freeway (Pennsylvania Ave to Howard Rd) to Southeast Freeway (6th St), Replacement and reconfiguration of the existing deteriorating bridges and ramps $475,000,000 2 South Capitol Street Independence Ave to MLK Jr Blvd, transform the South Capitol St into a gateway to Washington DC 2015 $822,500,000 Washington DC Washington DC CLRP CLRP 3 Dulles Airport Access Road 4 Intercounty Connector Dulles Airport to VA 123, Widen from 4 to 6 lanes, safety and operational improvements. Reconstruct/replace bridges as necessary. I-270/I-370 to I-95/US 1, construct a new east-west, multi-modal highway in Montgomery and Prince George's counties. The project will include managed lanes with express bus service connecting to Metrorail stations, currently under construction $40,000,000 VA CLRP 2012 $2,532,190,000 MD CLRP 5 I-270 The I-270/US 15 Multi-Modal Corridor Study is proposing ramp tie-in adjustments to meet the I-270 mainline lane widening through the interchange. The NB exit ramp is proposed for realignment of the initial exit curves to improve the design speed $8,000,000 MD CLRP 6 I-270 Interchange at Watkins Mills Road Construct a new interchange at Watkins Mill Road Extended. This consists of a full diamond interchange connecting I-270 to and from Watkins Mill Road extended. This includes two-lane collector-distributor roads on the I-270 in the northbound and southbound direction $206,000,000 MD CLRP 7 I-66 Improvements US 29 Gainesville to VA 234 Sudley Road, widen from 4 to 8 lanes. During peak periods, the median lane will be restricted and operate as a concurrent flow HOV lane $14,079,000 VA CLRP 79
80 8 I-66 Interchange and US 29 Interchange National Capital Region Freight Plan 2010, 2/12/2010 NATIONAL CAPITAL REGION FREIGHT PROJECT DATABASE I-66 and US 29 Interchange, widen and Construct US 29 and VA 55, reconstruct interchange, may include the addition of exclusive HOV access ramps within the 2014 $185,770,000 VA CLRP interchange or in close proximity to the interchange. 9 I-70 Baltimore National Pike Mt. Phillip Rd to MD 144, the project would upgrade existing I-70 to include the following phased improvements: Phase 1-Provide missing movements at US 15/US 340 interchange (complete). Phase 1A- Construction of missing movements at the I-70/I-270 interchange $206,000,000 MD CLRP/MFP 10 I-95 Contee Road Relocated w/cd Roads, construct a new interchange at Contee Road Relocated with two lane collector-distributor roads both NB and SB at I-95 and Contee Road Relocated 11 I-95 Capital Beltway Newington to VA 123, widen from 6 to 8 lanes. This project will add an additional lane between Rt. 123 and Fairfax County Parkway and will improve the traffic flow considerably. 12 I-95 Reconstruct Interchanges, VA 613, VA I-95/I-495 Arena Drive Interchange 2020 $232,613,000 MD CLRP/MFP 2011 $122,411,000 VA CLRP Reconstructing existing interchanges on I-95 to improve safety and efficiency $40,000,000 VA CLRP MD 202-MD 214, construct operational and safety improvements along I-95/I-495 from MD 214 to MD 202 including conversion of the I-95/I-495 interchange at Arena Drive from a part-time interchange to a full-time interchange to handle the existing and proposed growth $32,245,000 MD CLRP 14 I-95/I-495 Capital Beltway 15 I-95/I-495 Capital Beltway Construct a full interchange along I-95/I-495 at the Greenbelt Metro Station. The existing partial interchange provides access from inner loop Capital Beltway to the Greenbelt Metro Station. MD 5/Branch Ave Metro Station, construct flyover ramp from the inner loop Capital Beltway off-ramp to southbound MD 5, to eliminate current weave condition along MD $68,634,000 MD CLRP 2015 $116,470,000 MD CLRP 80
81 16 MD 201, Kenilworth Ave National Capital Region Freight Plan 2010, 2/12/2010 NATIONAL CAPITAL REGION FREIGHT PROJECT DATABASE Rittenhouse Rd to Pontiac St, widen to six lanes with intersection improvements. Funded and constructed by developers based on Prince George's County's 2020? MD CLRP Adequate Public Facility Ordinance Requirements 17 MD 3 Robert Crain Highway 18 US 15 Catoctin Mountain Highway 19 US 15 James Madison Highway US 50 to Anne Arundel County Line, Study to upgrade MD 3 from US 50 to MD 32 to address safety and capacity concerns. Wide curb lanes and should will accommodate bicycles. Study to develop interchange options at Monocacy Blvd (BRAC related) US 29 to Loudon County Line, widen 2 lane roadway to a 4 lane divided highway. Implement safety and operational improvements. 20 US 15 Rt Bypass VA 773 Edwards Ferry Road, construct interchange. 21 US 15 South King Street Evergreen Mill Rd to SCL of Leesburg, widen to 4 lanes. Implement safety and operational improvements. Reconstruct/replace bridges as necessary. Implement signal coordination $212,659,000 MD CLRP 2015 $84,271,000 MD CLRP 203 $51,700,000 VA CLRP 2020 $25,000,000 VA CLRP 2015 $5,277,000 VA CLRP 22 US 29 Pleasant Valley Drive to WCL of Fairfax, study feasibility of widening 4 to 6 lanes from Pleasant Valley Drive to the Western City Limit of the City of Fairfax $42,805,000 VA CLRP 23 US 29 widen ECL City of Fairfax to I-495 Capital Beltway, widen US 29 between Nutley Street and I-495, to 6 lanes, and study the feasibility of constructing an interchange at US 29 and Gallows Road. 24 US 29 Columbia Pike Sligo Creek Parkway to Howard County Line, this project includes grade separations at MD 198, Blackburn Road, Dustin Road, Greencastle Road, Musgrove/Fairland Road, Briggs Chaney Road, Randolph Road. 25 US 29 Lee Highway WCL of City of Fairfax to ECL of City of Fairfax, widen to 6 lanes. Implement safety and operational improvements. Reconstruct/replace bridges as necessary $56,724,000 VA CLRP 2020 $445,000,000 MD CLRP 2030 $48,208,000 VA CLRP 81
82 26 US 15 Interchange at US US 50 Reconstruct and widen 28 Frederick Douglas Memorial Bridge 29 MD 355, Rockville Pike Grade Separation 30 MD 450 Annapolis Road Grade Separation 31 VA 234 Dumfries Road National Capital Region Freight Plan 2010, 2/12/2010 NATIONAL CAPITAL REGION FREIGHT PROJECT DATABASE Jefferson Tech Park, Grade separated interchange at US 340/US 15 at mile point $10,900,000 MD CLRP I-66 to WCL Fairfax City, widen to 8 lanes, westbound lanes of 50 to 3 lanes between I-66 and Waples Mill Road 2020 $4,252,000 VA CLRP VA 659 Relocated to VA 661 Lee Road, widen to 6 lanes, implement safety and operational improvements as necessary. Reconstruct/replace bridges, as necessary $53,047,000 VA CLRP Construct a CSX Railroad grade-separated crossing and interchange improvements $132,336,000 MD CLRP Construct a highway-railroad grade-separated crossing and intersection improvements 2009 $74,926,000 MD CLRP US 1 to VA 234 Bypass at Limstrong, Study/widen VA 234 from 2 to 4 lanes on a 6 lane right-of-way between US 1 and the VA 234 Bypass, south of the City of Manassas in the vicinity of Limstrong. Construct an interchange at US 1. Implement safety and operational improvements $96,380,000 VA CLRP 32 VA 234 Manassas Bypass VA 234 Dumfries Road at Limstrong to I-66, construct VA 234 Bypass. Construct a 4-lane freeway within a 6- lane right-of-way. Provide a freeway from existing Route 234 south of Manassas westward around the City to I-66. Implement safety and operational improvements, as necessary. Reconstruct/rebuild bridges, as necessary $143,816,000 VA CLRP 33 VA 234 Sudley Road Dorsey Circle to Godwin Drive, widen existing 4 lane roadway to provide a third land northbound within the city limits. Liberia Ave-4 lane and Bridge over Southern Railway complete $2,500,000 VA CLRP 82
83 , 2/12/2010 NATIONAL CAPITAL REGION FREIGHT PROJECT DATABASE 34 VA 236 Pickett Road to I-395, widen VA 236 from 4 to 6 lanes. Implement safety and operational improvements, as necessary. Reconstruct/rebuild bridges, as necessary. Various intersection spot improvements along Route 2020 $58,206,000 VA CLRP 236 from Pickett Road easterly to Lake Dr. 35 VA 267 Dulles Toll Road 36 VA 27, Columbia pike interchange 37 VA 28, widen, relocate utilities VA 674 Hunter Mill Road, implement safety and operational improvements as necessary. Reconstruct/replace bridges, as necessary. VA 244 Columbia Pike, reconstruct interchange Fauquier County Line to WCL Manassas, widen from 2 to 4 lanes from Fauquier County Line to VA 215, and VA 215 to VA 219. Widen from 4 to 6 lanes from VA 219 to Manassas. Replace the existing bridge $1,500,000 VA CLRP 2013 $39,414,000 VA CLRP 2020 $19,193,000 VA CLRP 38 VA 28, upgrade I-66 to VA 7, construct 10 interchanges along VA 28. Widen VA 28 from 6 to 8 lanes. 39 VA 28 Centerville Road VA 7783 New Braddock Road to VA 28 Centerville Road, as a result of many rear end accidents the fright turn from new Braddock into Rte 28 North must be realigned and made to 90 degrees turn. The intersection signalization will be replaced and updated to ensure that the movement of traffic is safe $408,496,000 VA CLRP 2010 $16,300,000 VA CLRP 40 VA 28 Nokesville Road, Overpass Norfolk Southern Railroad B-Line and Wellington Road Overpass. VA 28 will be reconstructed adjacent to its existing alignments as a four-lane divided roadway from the vicinity of Foster $40,000,000 VA CLRP 41 VA 7 Interchange Improvement VA 9 WVA/VA State Line to Market Street, Improve the safety/operation of intersections and/or non-regionally significant segments of VA 7. Reconstruct/replace bridges, retaining walls, and other structures as necessitated by maintenance demands $3,935,000 VA CLRP 83
84 , 2/12/2010 NATIONAL CAPITAL REGION FREIGHT PROJECT DATABASE 42 VA 7 Bypass VA 7 Leesburg Pike West to VA/US 7/15 East, Implement safety and operations improvements and widen the Leesburg Bypass from 4 lane divided to 6- lane divided freeway between the west Business VA 7 interchange and the east Business VA 7/US $43,071,000 VA CLRP interchange. 43 VA 7 Leesburg Pike Deck Replacement and widening, superstructure and substructure repairs, Leesburg Pike $15,610,000 VA CLRP 44 VA 7 Leesburg Pike Seven Corners to Bailey's Crossroads, widen from 4 to 6 lanes $34,318,000 VA CLRP 45 US 40 Reconstruct and widen US 40, US 15 to I-270 MD MFP 46 MD I 270 Reconstruct and widen, English Muffin Way to N. of Grove Road Reconstruct and widen, Montgomery County Line to I I 270 Reconstruct and widen, I-370 to Frederick County Line 49 I 270 Reconstruct and widen, Interstate 495 to Interstate I 495 Reconstruct and widen, Montgomery County Line to I I 95 Reconstruct and widen, South of MD 210 to I495 MD MFP 52 US 50 Reconstruct and widen, DC Line to MD 410 MD MFP 53 I 95 Reconstruct and widen, I-495 to Howard County Line MD MFP 54 US 15 Reconstruct and widen, US 40 to Biggs Ford Road MD MFP 55 I 370 Reconstruct and widen, I-270 to Shady Grove Metro MD MFP 56 I 495 Reconstruct and widen, American Legion Bridge to Prince George's County Line MD MFP 57 I 295 Reconstruct and widen, I-95 to DC Line MD MFP 58 MD 3 US 50 to Anne Arundel County Line MD MFP 59 MD 4 Patauxent River to I-95 MD MFP 60 US 301 Charles County Line to US 50 MD MFP 61 US 50/301 Reconstruct and widen, 0.14 miles East of US 301 to Anne Arundel County Line MD MFP 84 MD MD MD MD MD MFP MFP MFP MFP MFP
85 , 2/12/2010 NATIONAL CAPITAL REGION FREIGHT PROJECT DATABASE CLRP MFP MDOT- MRP MARC CSX NS MAROPs VA Rail Plan Source Legend Constrained Long Range Transportation Plan, 2009 Upate Maryland Department of Transportation, State Freight Plan, September 2009 Maryland Department of Transportation Draft State Rail Plan, May 21, 2010 Draft MARC Growth and Investment Plan, 2007 CSX Transportation Corporation, NG for National Gateway Norfolk Southern Corporation, CC for Crescent Corridor Mid-Atlantic Railroad Operations Study (I-95 Corridor Coalition Study) Virginia Department of Rail and Public Transportation Statewide Rail Plan 85
86 10) BEST PRACTICES The TPB Vision document calls for an interconnected transportation system that addresses multi-modal transportation connections. As required by federal law, freight transportation is gaining prominence as its own element in the Constrained Long Range Transportation Plan (CLRP). In order to achieve the goals of the TPB Vision and the overall goal of strengthening support for freight in the region, the TPB Freight Subcommittee has developed the following series of recommended Best Practices for consideration by the member agencies and jurisdictions. For this document, the term Best Practice is defined as a process or activity anticipated to be especially effective in achieving a desired outcome. Another criterion for a Best Practice, for the purposes of this document, is that designation as a Best Practice should be substantially beyond debate among stakeholders; it must be widely agreed. Overall, agencies can use these Best Practices to help achieve the regional vision, goals, and objectives. Member agencies and jurisdictions may have already fully or partially implemented many of these recommended practices. The Best Practices have potential to give greater prominence to freight transportation in the National Capital Region. Some of these ideas were gathered from efforts taken by other Metropolitan Planning Organization freight programs. Some originate from staff discussions held at Freight Subcommittee meetings and during various outreach events such as the Transportation Research Board annual conference. Additional ideas are modeled after the program activities of other TPB CLRP element areas. 1. Jurisdictions should have one or more staff persons responsible for freight planning in the jurisdiction. a. The jurisdictional staff person(s) assigned to freight should be sufficiently knowledgeable on freight issues to effectively work with their jurisdiction s freight stakeholders. b. Each jurisdiction should identify a freight liaison to coordinate planning with the Transportation Planning Board (TPB) and Freight Subcommittee. c. In addition to one or more point person(s) for freight, jurisdictions should incorporate freight at all levels of the transportation planning process. 2. Jurisdictional transportation plans should specifically address freight movement issues. a. Each jurisdiction should prepare a freight profile to advise further integration of freight into local plans. b. Jurisdictional plans should address development-related freight issues, such as off-road commercial loading facilities, in accordance with published national standards. c. Jurisdictional plans should consider truck movement within the jurisdiction, including consideration of issues such as truck routing, on-street commercial loading zones and delivery space, truck parking, and road obstructions. d. Jurisdictional plans should incorporate truck transportation accommodations in zoning for new construction projects. 86
87 e. Jurisdictions should coordinate jurisdictional-level zoning efforts with state and federal departments of transportation who make decisions on transportation projects. 3. Freight railroads should address passenger rail concerns as they advance freight rail projects. a. Freight railroads should dialogue with local jurisdictions, TPB, and the public as rail projects are being developed, designed, and built. b. Freight railroads should coordinate in a timely fashion with local jurisdictions on operational issues. 4. States, jurisdictions, and regional planning activities should work to build on available freight data. a. Transportation planning activities should conduct regular classified vehicle counts. b. Transportation planning should consider purchasing additional freight data. 5. Regional freight planning activities should be sustained to assist state and local freight integration efforts. a. Coordinate a regional Focus on Freight Forum to draw attention and public awareness to freight issues. b. Prepare a brochure to summarize the Freight Program objectives and to serve as a freight educational handout. c. Continue to analyze regional freight flows in the National Capital Region. 87
88 11) KEY FINDINGS/RECOMMENDATIONS The Freight Plan hereby concludes with a summary of important key findings and recommendations from throughout the Plan. The key findings represent freight facts summarized from the Plan. The recommendations should help guide the future activities of the Freight Program with the integration of freight into the metropolitan transportation planning process. a) Key Findings 1. Freight issues differ from traditional Transportation Planning Board (TPB) activities in the degree to which private companies must be involved. 2. Freight movement is critical to the economy and quality of life in the metropolitan Washington region. 3. Freight demand is driven by population and economic growth. That National Capital Region is among the fastest growing areas in the country. The region is forecasted to grow by 1.2 million people and nearly 1 million jobs between 2010 and 2030 a 22 percent increase in population and a 29 percent increase in employment Sixty percent of truck and rail transportation tonnage and 86 percent of truck and rail transportation value are through trips. 78 However, most trucks visible to the bystander are trucks making shipments to, from, and within the region, and contribute to the region s economy. 5. Trucks carry the majority approximately 76 percent of goods to from, and within the region Congestion was raised as a major concern in a spring 2009 survey of shippers, receivers, and wholesale/distribution centers from various industries in the National Capital Region. Congestion diminishes productivity and increases the cost of operations, as truck drivers must be paid for time spent making deliveries as well as time spent stalled or stopped in traffic. The domestic trucking sector loses an estimated $8 billion per year as a result of clogged roads.80 Congestion adds to societal costs in the form of increased emissions and indirect impacts on consumer prices. 7. The Class One railroads in the National Capital Region, CSX and Norfolk Southern, have undertaken major initiatives to improve their railway network. CSX s National Gateway is 77. Constrained Long Range Plan Update 2008, p Cambridge Systematics for MWCOG. Estimates are based on two sources: Inbound, Outbound, and Intraregional numbers are based on 2002 FAF data. Through traffic is based on 2003 estimate in Draft Maryland Freight Profile, Enhancing Consideration of Freight in Regional Transportation Planning, Cambridge Systematics, Bethesda, MD, May 2007, p Environmental Defense Fund, The Good Haul: Innovations that Improve Freight Transportation and Protect the Environment,
89 an effort to clear 61 obstructions in six states across the Mid-Atlantic and Midwest, in addition to five new and two upgraded intermodal facilities. Thirteen National Gateway projects fall within the National Capital Region. Norfolk Southern s Crescent Corridor is an effort to link 13 states from Louisiana to New Jew Jersey with track improvements. These projects, when completed, will allow for double-stacked train service and rail efficiencies. 8. Air cargo tonnage to, from, and within the region is expected to grow nearly 500 percent by Air freight commodities are typically high in value, light in weight, and time sensitive. Washington Dulles International Airport and Baltimore Washington International Thurgood Marshall Airport are the two primary air cargo airports that serve the National Capital Region. 9. A small amount of barge movement occurs on the Potomac and Anacostia Rivers. These movements transport petroleum, and construction materials such as rock and sand. In the National Capital Region, one million tons of goods, worth $69 million are moved by water annually The growing global economy demands a transportation infrastructure to support the forecast growth in freight movement. A major expansion of the Panama Canal is scheduled to be complete in The canal currently has capacity for 5,000 container ships. The expanded Panama Canal will have capacity for 12,000 container ships. The expanded canal will impact shipper route selection. This is likely to influence the relationship between truck and rail as intermodal movements grow. 11. Transportation is the second largest source of greenhouse gas emissions (GHG) in the United States. Freight modes contribute 27.4 percent of total transportation greenhouse gas emissions nationally. Of the 27.4 percent, truck transportation contributes 20.5 percent and rail transportation contributes 2.4 percent Though the rate of truck accidents is moderate, there is great potential for danger when they do occur. For safety reasons, the National Capital Region wants to ensure that hours of service rules are followed, parking and service centers are provided, enforcement and inspection is conducted, and speed is controlled. 13. Both truck and rail security issues are important to the National Capital Region. Truck inspections and enforcement are particularly vital. The routing of truck and rail hazardous materials from sensitive areas of the National Capital Region is a key strategy for bolstering security. 14. Freight rail is a United States common carrier. As a common carrier, a railroad cannot choose the cargo that it carries; by law a railroad cannot reject hazardous cargo. Each year, 81. Enhancing Consideration of Freight in Regional Transportation Planning, May 2007, p Federal Highway Administration, Freight Analysis Framework, 2002 and data from the U.S. Army Corps of Engineers. 83. Federal Highway Administration, Office of Planning, Environment, and Realty, Robert Ritter, Freight and Climate Change, presented to FHWA Talking Freight, June 17,
90 CSX and Norfolk Southern safely transport several hundred thousand shipments of hazardous materials through our region. 15. Freight movement has few alternative modes with respect to transporting goods, unlike personal transportation. b) Recommendations 1. Freight transportation planning and the TPB Freight Program should be continued and enhanced, with special emphasis on public safety, security, environmental, congestion related, commuter rail, and service gap issues. 2. The TPB Freight Subcommittee and staff should regularly update the TPB and its subcommittees on freight movement issues. 3. The freight industry requires special outreach efforts that include more out of the office and on-site meetings than other transportation planning subjects. Staff should continue proactive outreach efforts to the freight industry and private sector stakeholders as a key aspect of freight planning. 4. TPB freight staff should coordinate with jurisdictions to help produce jurisdiction-level freight profiles and encourage enhanced consideration of freight in local planning. 5. The Freight Program should explore new data opportunities, such as data available from the INRIX, Inc. database, with information based primarily on GPS-equipped commercial fleets, in conjunction with the TPB Congestion Management Process. 6. The TPB Freight Program should hold an annual Freight Forum or similar event to raise freight transportation awareness in the National Capital Region. 7. Coordination with our region s rail stakeholders is important to our TPB. The TPB Freight Program should encourage rail stakeholders to coordinate on rail planning and operational issues with the TPB jurisdictions, passenger railroads, and the public. 90
91 APPENDICIES Appendix A: CLRP Project Description Form Appendix B: National Capital Region Truck Routes Appendix C: National Capital Region Weigh Stations Appendix D: TPB Regional Screenline Location Table Appendix E: TPB Regional Screenline Truck Volume Crossing Regional Screenlines by Year Table Appendix F: References and Links Appendix G: Glossary of Acronyms 91
92 Appendix A: CLRP Project Description Form 92
93 FINANCIALLY CONSTRAINED LONG-RANGE TRANSPORTATION PLAN FOR 2040 PROJECT DESCRIPTION FORM BASIC PROJECT INFORMATION 1. Submitting Agency: 2. Secondary Agency: 3. Agency Project ID: 4. Project Type: _ Interstate _ Primary _ Secondary _ Urban _ Bridge _ Bike/Ped _ Transit _ CMAQ _ ITS _ Enhancement _ Other _ Federal Lands Highways Program _ Human Service Transportation Coordination _ TERMs 5. Category: _ System Expansion; _ System Maintenance; _ Operational Program; _ Study; _ Other 6. Project Name: 7. Facility: 8. From (_ at): 9. To: Prefix Route Name Modifier 10. Description: 11. Projected Completion Date: 12. Project Manager: 13. Project Manager Project Information URL: 15. Total Miles: 16. Schematic: 17. Documentation: 18. Bicycle or Pedestrian Accommodations: _ Not Included; _ Included; _ Primarily a Bike/Ped Project; _ N/A 19. Jurisdictions: 20. Total cost (in Thousands): 21. Remaining cost (in Thousands): 22. Funding Sources: _ Federal; _ State; _ Local; _ Private; _ Bonds; _ Other 93
94 FINANCIALLY CONSTRAINED LONG-RANGE TRANSPORTATION PLAN FOR 2040 PROJECT DESCRIPTION FORM SAFETEA-LU PLANNING FACTORS 23. Please identify any and all planning factors that are addressed by this project: a. _ Support the economic vitality of the metropolitan area, especially by enabling global competitiveness, productivity, and efficiency. b. _ Increase the safety of the transportation system for all motorized and nonmotorized users. i. Is this project being proposed specifically to address a safety issue? _ Yes; _ No ii. If yes, briefly describe (in quantifiable terms, where possible) the nature of the safety problem: c. _ Increase the ability of the transportation system to support homeland security and to safeguard the personal security of all motorized and non-motorized users. d. _ Increase accessibility and mobility of people. e. _ Increase accessibility and mobility of freight. f. _ Protect and enhance the environment, promote energy conservation, improve the quality of life, and promote consistency between transportation improvements and State and local planned growth and economic development patterns. g. _ Enhance the integration and connectivity of the transportation system, across and between modes, for people and freight. h. _ Promote efficient system management and operation. i. _ Emphasize the preservation of the existing transportation system. ENVIRONMENTAL MITIGATION 24. Have any potential mitigation activities been identified for this project? _ Yes; _No a. If yes, what types of mitigation activities have been identified? _ Air Quality; _ Floodplains; _ Socioeconomics; _ Geology, Soils and Groundwater; Vibrations; _ Energy; _ Noise; _ Surface Water; _ Hazardous and Contaminated Materials; _ Wetlands CONGESTION MANAGEMENT INFORMATION 25. Congested Conditions a. Do traffic congestion conditions necessitate the proposed project or program? _ Yes; _ No b. If so, is the congestion recurring or non-recurring? _ Recurring; _ Non-recurring c. If the congestion is on another facility, please identify it: 26. Capacity a. Is this a capacity-increasing project on a limited access highway or other principal arterial? _ Yes; _ No 94
: _ None of the exemption criteria apply to this project a Congestion Management Documentation Form is required _ The project will")
95 FINANCIALLY CONSTRAINED LONG-RANGE TRANSPORTATION PLAN FOR 2040 PROJECT DESCRIPTION FORM b. If the answer to Question 26.a was yes, are any of the following exemption criteria true about the project? (Choose one, or indicate that none of the exemption criteria apply): _ None of the exemption criteria apply to this project a Congestion Management Documentation Form is required _ The project will not use federal funds in any phase of development or construction (100% state, local, and/or private funding) _ The number of lane-miles added to the highway system by the project totals less than one lane-mile _ The project is an intersection reconstruction or other traffic engineering improvement, including replacement of an at-grade intersection with an interchange _ The project, such as a transit, bicycle or pedestrian facility, will not allow private single-occupant motor vehicles _ The project consists of preliminary studies or engineering only, and is not funded for construction _ The construction costs for the project are less than $10 million. c. If the project is not exempt and requires a Congestion Management Documentation Form, click here to open a blank Congestion Management Documentation Form. INTELLIGENT TRANSPORTATION SYSTEMS 27. Is this an Intelligent Transportation Systems (ITS) project as defined in federal law and regulation, and therefore subject to Federal Rule 940 Requirements? _ Yes; _ No a. If yes, what is the status of the systems engineering analysis compliant with Federal Rule 940 for the project? _ Not Started; _ Ongoing, not complete; _ Complete b. Under which Architecture: _ DC, Maryland or Virginia State Architecture _ WMATA Architecture _ COG/TPB Regional ITS Architecture _ Other, please specify: 28. Completed Date: 29. _ Project is being withdrawn from the CLRP. 30. Withdrawn Date: 31. Record Creator: 32: Created On: 33. Last Updated by: 34. Last Updated On: 35. Comments 95
96 Appendix B: National Capital Region Truck Routes The Surface Transportation Administration Act (STAA) of 1982 is a National Network for trucks in the United States. It includes Interstates, United States Highways, and State Highways. According to STAA, states must allow trucks (that do not exceed Federal maximum width and minimum length limits applicable to the National Network) to have reasonable access between the National Network and terminals and facilities for food, fuel, repairs, and rest. Terminals are defined as any location where freight originates, terminates, or is handled in the transportation process. Access must be allowed up to 1 mile from the National Network by the most reasonable and practicable safe route. For access to terminals and service facilities beyond 1 mile from the National Network, the route may be requested from the State. Access must be granted if the vehicle can safely travel the route as determined by a test drive. If a State does not act upon a request within 90 days, access is automatically granted. If access is granted to one vehicle type, it applies to all vehicles of the same type, regardless of carrier. States must also allow access between the National Network and points of loading and unloading to household goods carriers, motor carriers of passengers, and any truck tractor-semitrailer combination in which the trailer or semitrailer has a length equal to or less than 28 feet. District of Columbia Truck Routes In the early months of 2010, the District of Columbia has been undergoing an update of its Truck Route Map. This map identifies proposed loading zone areas, truck restricted areas, and truck routes. The District of Columbia Truck Route Map below represents the Draft Final map at the time of publishing this Freight Plan (few additional changes are anticipated). Maryland Truck Route The Maryland Truck Route closely parallels the STAA National Network of designated routes, as shown in Chapter 5. Virginia Truck Routes Virginia Department of Transportation provided ArcView information on the truck routes and the various levels of restricted highway routes in the state. As part of this document, we decided to recognize the Federal STAA Routes (part of the National Network), the Virginia STAA Routes-VA Designated Routes NOT on the National Network, and VA STAA Routes-VA Designated Routes with no access off the network. These three designations represent the most likely road categories where trucks would travel. Virginia has several additional road designations, such as restricted to eight ton weight limit, restricted-no through tractor trailers, restricted-no through trucks, restricted, no combinations exceeding 65 feet, and restricted-no vehicles with more than four tires. 96

97 Washington DC Truck Routes 97
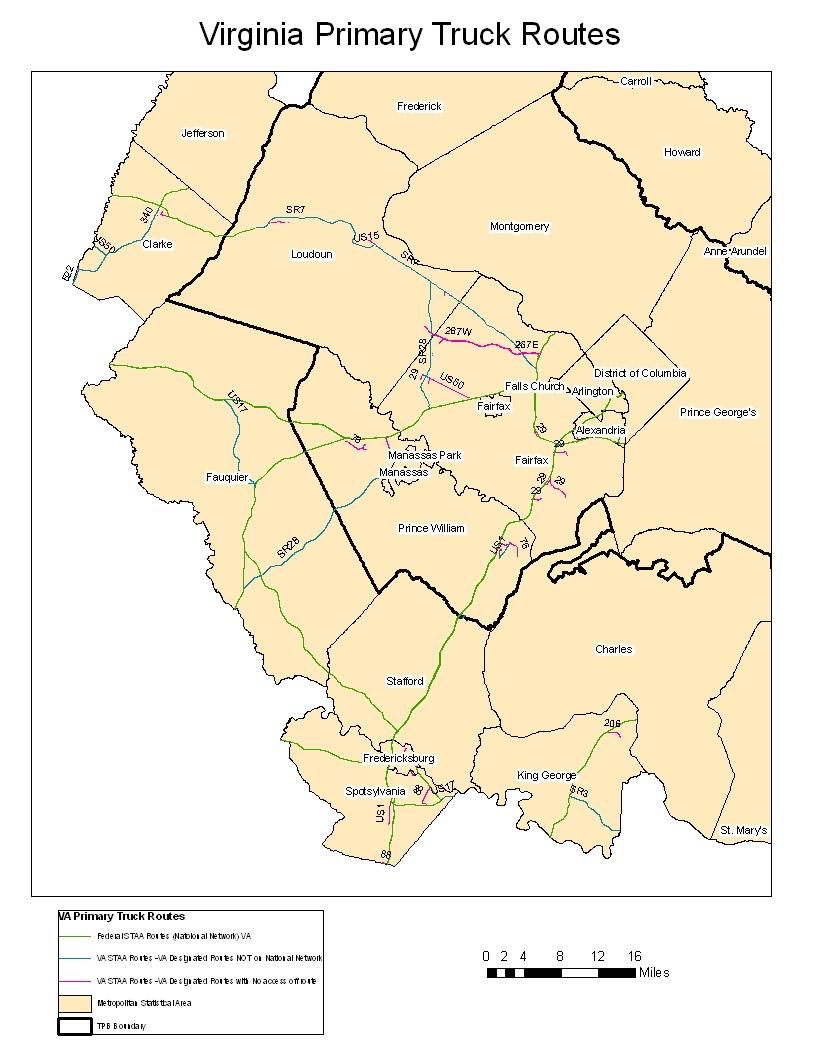
98 98
99 Appendix C: National Capital Region Weigh Stations District of Columbia As of February 2010, a new semi-permanent weigh station in the District of Columbia began operation. The weigh station is located approximately one mile from the Maryland border at the southbound lane on Interstate 295 near the Blue Plains exit. The District of Columbia Department of Transportation coordinates with the Metropolitan Police Department on truck size and weight enforcement at specific locations within the District. In addition, the District has three weigh in motion stations to assist with data collection. These are located on New York Avenue, Sousa Bridge, and Interstate 295 near the District border. Maryland All trucks over five tons must pass through Maryland weigh stations. The Maryland State Highway Administration (SHA) Motor Carrier Division (MCD) in cooperation with the Maryland State Police (MSP) Commercial Vehicle Enforcement Division (CVED), the Maryland Transportation Authority Police (MdTAP) Commercial Vehicle Safety Unit (CVSU) is responsible to enforce motor carrier law for the safe movement of commercial motor vehicles along Maryland highways. The Maryland weigh stations located in the National Capital Region are: 1: Interstate 70 and Route 40, Eastbound, East New Market, Frederick County 2. Interstate-270 Hyattstown, East and Westbound, Frederick County 3. College Park-Park and Ride, Prince George s County 4. Route 301, North and South, Upper Marlboro, Prince George s County Virginia Virginia weigh stations, also known as Motor Carrier Service Centers, monitor trucks for compliance with state and federal statutes pertaining to the size and weight of trucks using the interstate, primary, and secondary roads of the Commonwealth. The Motor Carrier Service Centers also perform infared safety screening which support truck safety inspections, drug checks, dyed fuel checks, and hazardous material monitoring. 1. Interstate 95, North of Route 234, North and Southbound, Dumfries, Prince William County 2. U.S. 50, near Route 15, Eastbound, Gilberts Corner, Loudoun County The region is increasingly integrating technology into weigh station/motor carrier service center data collection. Both Maryland and Virginia have adapted ramp weigh-in-motion data collection technology at various centers. This allows trucks to be weighed on the ramp at 35 miles per hour. This technology helps trucks move through the weigh station and reduces truck idling time and the extra costs associated with fuel and wasted time. 99
100 Appendix D: TPB Regional Screenline Location Table Screenline # Screenline Location 1 Ring 1, Virginia 2 Ring 1, DC 3 Ring 3, Virginia 4 Ring 3, DC 5 Beltway, Virginia 6 Beltway, Maryland 7 Ring 5, Virginia 8 Ring 5, Maryland 9 Ring 7, Virginia 10 Eastern Loudoun Co. 11 US 15, Loudoun / Pr. William Co. 12 Central Montgomery Co. Radial 13 Eastern Montgomery Co. Radial 14 NE. Prince George s Co. Radial 15 Central Prince George's Co. Radial 16 Southern Prince George's Co. Radial 17 Southern Fairfax / Pr. Wm. Radial 18 Central Fairfax Co. Radial 19 VA Route 7 Radial Beltway & 'Inner' Potomac River 20 Crossings 22 Central Mtg./P.G. Radial 23 NE Montgomery Co. Radial Montgomery / Prince George s Co. 24 border 25 Montgomery/ Frederick Co. border 26 Montgomery / Howard Co. border Prince George s / Anne Arundel Co. 27 Border 28 Charles / Prince George s Co. Border 31 Frederick / Carroll Co. Border 32 Western Loudoun Co. Border 33 'Outer' Southwestern Circumferential 34 'Outer' Southeastern Circumferential 35 South of Baltimore City 36 'Outer' Northwestern Radial 37 'Outer' Western Circumferential 38 'Outer' I-95 (South) Radial 100
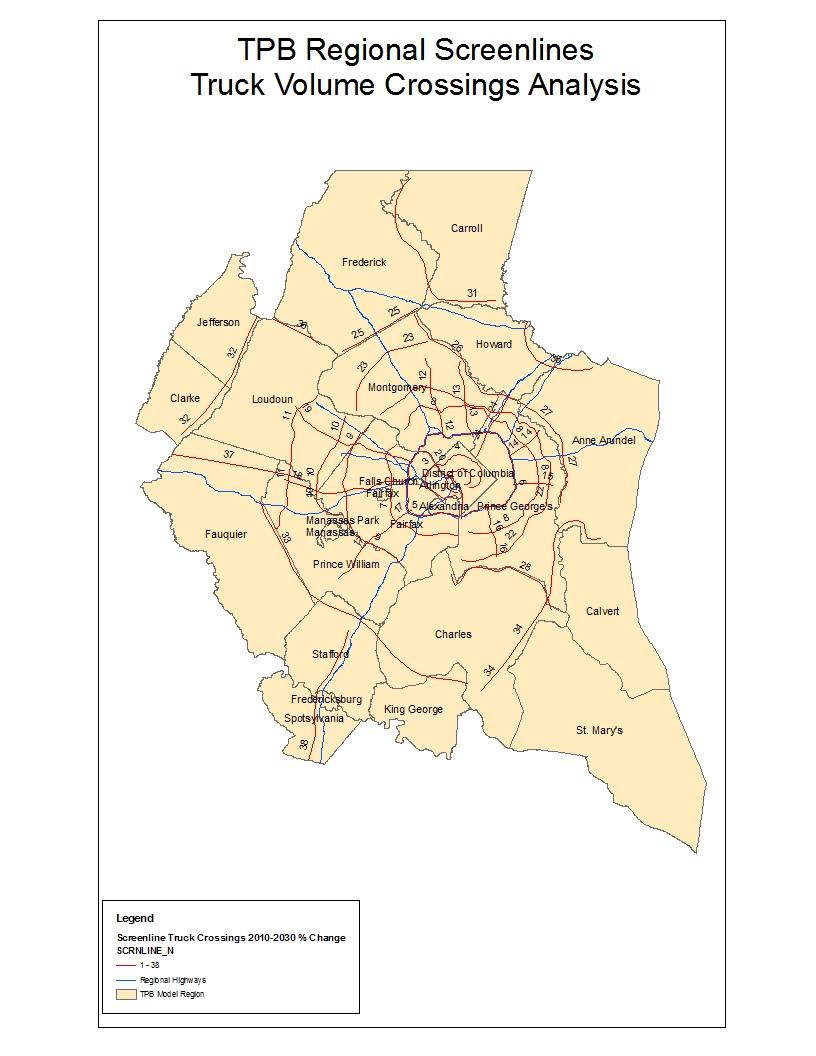
101 101
DRAFT NATIONAL CAPITAL REGION FREIGHT PLAN. July 2016
 DRAFT NATIONAL CAPITAL REGION FREIGHT PLAN July 2016 NATIONAL CAPITAL REGION FREIGHT PLAN Draft: July 14, 2016 ABOUT THE TPB The National Capital Region Transportation Planning Board (TPB) is the federally
MAP 21 Freight Provisions and Seaports
 MAP 21 Freight Provisions and Seaports September 20, 2012 American Association of Port Authorities 703.684.5700 www.aapa-ports.org 3 New Freight Eligibility in Core Highway Formula Programs Surface Transportation
TEXAS FREIGHT MOBILITY PLAN 2017
 TEXAS FREIGHT MOBILITY PLAN 2017 Texas Transportation Commission September 28, 2017 Overview of the Texas Freight Mobility Plan 2016 Plan First multimodal freight mobility plan Identified freight network,
Chapter 1 Introduction
 Chapter 1 Introduction KEY POINTS The amount and value of freight are critical components of the overall economic health of Missouri. Missouri s multimodal freight system supports the movement of trucks,
DISTRICT OF COLUMBIA FREIGHT PLAN
 Final Report DISTRICT OF COLUMBIA FREIGHT PLAN Prepared for: District Department of Transportation Prepared by: With October 2014 Table of Contents District of Columbia Freight Plan 1.0 Introduction...1
Corridors of Statewide Significance: Introduction
 Virginia s Long-Range Multimodal Transportation Plan Corridors of Statewide Significance: Introduction Prepared for: Commonwealth Transportation Board Prepared by: Office of Intermodal Planning and Investment
ATTACHMENT A. Detailed Study Scope. I-66 (Inside) Multi-modal Study Scope
 Multi-modal Study Scope") ATTACHMENT A Detailed Study Scope I-66 (Inside) Multi-modal Study Scope EXECUTIVE SUMMARY The Virginia Department of Transportation (VDOT) seeks consultant assistance in identifying and evaluating a range
ATTACHMENT A Detailed Study Scope I-66 (Inside) Multi-modal Study Scope EXECUTIVE SUMMARY The Virginia Department of Transportation (VDOT) seeks consultant assistance in identifying and evaluating a range
Chapter 1: The 2035 Virginia Surface Transportation Plan 1. Challenges & Opportunities 2 VTrans2035: The Precursor 2 The VSTP and VTrans2035 2
 November 2010 Table of Contents Executive Summary See Summary Map Chapter 1: The 2035 Virginia Surface Transportation Plan 1 Challenges & Opportunities 2 VTrans2035: The Precursor 2 The VSTP and VTrans2035
Central Minnesota. Regional Freight Profile
 Central Minnesota Regional Freight Profile Working DRAFT May 21 Minnesota Department of Transportation The purpose of the Central Regional Freight Profile is to document freight movement trends in the
To provide an update on the progress of the Peel Goods Movement Task Force and the Peel Goods Movement Strategic Plan.
 9.2-1 REPORT Meeting Date: 2015-11-26 Regional Council For Information DATE: November 10, 2015 REPORT TITLE: REGION OF PEEL GOODS MOVEMENT STRATEGIC PLAN - 2015 STATUS UPDATE FROM: Dan Labrecque, Commissioner
TRANSPORTATION 101 Today and Tomorrow. Moving People and Goods
 TRANSPORTATION 101 Today and Tomorrow Moving People and Goods What is the Transportation Commission? An independent, seven-member body of citizens appointed by the Governor for six-year terms and representing
New York State Freight Transportation Plan. NYSAMPO Meeting. NYSAMPO Meeting June 21, 2017
 New York State Freight Transportation Plan NYSAMPO Meeting NYSAMPO Meeting June 21, 2017 Why a Statewide Freight Plan? To understand statewide freight movement dynamics and relationship to economic vitality.
MONITORING IMPLEMENTATION AND PERFORMANCE
 12 MONITORING IMPLEMENTATION AND PERFORMANCE The FAST Act continues the legislation authorized under MAP-21, which created a data-driven, performance-based multimodal program to address the many challenges
Failure to Act. Of current Investment Trends in. Airports, Inland Waterways, and Marine Ports. Infrastructure EXECUTIVE SUMMARY
 Failure to Act The economic impact Of current Investment Trends in Airports, Inland Waterways, and Marine Ports Infrastructure EXECUTIVE SUMMARY EXECUTIVE SUMMARY Air and waterborne transportation infrastructure
NATIONAL CAPITAL REGION TRANSPORTATION PLANNING BOARD
 NATIONAL CAPITAL REGION TRANSPORTATION PLANNING BOARD September 18, 2013 District Department of Transportation Federal Railroad Administration AGENDA Vision History & Background Study Area Purpose & Need
TEXAS FREIGHT MOBILITY PLAN. Greater Houston Freight Committee Kick-Off Meeting
 TEXAS FREIGHT MOBILITY PLAN Greater Houston Freight Committee Kick-Off Meeting July 11, 2016 Overview of Texas Freight Mobility Plan The Freight Plan is TxDOT's first multimodal transportation plan that
Trade & Logistics: Understanding the Industry
 Trade & Logistics: Understanding the Industry 1 Key Initiative of Governor Scott Florida has a once in a lifetime opportunity, with the expansion of the Panama Canal, to transform the state s economy to
IMPORTANCE OF FREIGHT IN VIRGINIA
 IMPORTANCE OF FREIGHT IN VIRGINIA Freight transportation infrastructure in Virginia carries approximately 500 million tons and $481 billion worth of freight through the state each year, and more than 30%
LATTS II - Freight Investment Decision Principles
 LATIN AMERICA TRADE AND TRANSPORTATION STUDY (LATTS) II Emerging Principles in Freight Investment Decision Abstract An extremely important component to effective transportation planning and to this point
Chapter 4: Developing the Recommendations
 Virginia s continued investment in its transportation system is vital to the safe and efficient movement of people and goods and to the entire Commonwealth s economic wellbeing. Every element of Virginia
Rail Solutions and America s Future Prosperity Michael O Malley, July 12, 2008
 1 Rail Solutions and America s Future Prosperity Michael O Malley, July 12, 2008 Freight Railroads Deliver Every Day In 2005, U.S. freight railroads hauled enough: Wheat to make more than 400 loaves of
Morris County Freight Profile
 Morris County Freight Profile 2040 Freight Industry Level Forecasts ABOUT THIS PROFILE The NJTPA has developed a set of alternative freight forecasts to support transportation, land use, and economic development
Eight County Freight Plan
 Eight County Freight Plan Blackhawk Hills Regional Council 2017 Fall Summit CPCS Team October 27, 2017 Timber Lake Playhouse Project Sponsors 2 Presentation Map The Eight County Freight Plan Work Plan
ITEM 9 Action October 18, 2017
 ITEM 9 Action October 18, 2017 Approval of the Air Quality Conformity Analysis of the VDOT and MDOT Off-Cycle Amendment to the 2016 CLRP and Approval of the 2016 Off-Cycle Amendment Staff Recommendation:
INLAND WATERWAYS TRANSPORTATION: Our Competitive Advantage. Delbert R Wilkins Canal Barge Company Big River Moves Leadership Forum April 15, 2013
 INLAND WATERWAYS TRANSPORTATION: Our Competitive Advantage Delbert R Wilkins Canal Barge Company Big River Moves Leadership Forum April 15, 2013 INLAND WATERWAYS TRANSPORTATION: Our Competitive Advantage
To provide an update on the progress of the Peel Goods Movement Task Force and Peel Goods Movement Strategic Plan.
 8.4-1 REPORT Meeting Date: 2014-06-26 Regional Council For Information DATE: June 17, 2014 REPORT TITLE: PEEL GOODS MOVEMENT STRATEGIC PLAN UPDATE 2014 FROM: Dan Labrecque, Commissioner of Public Works
NATIONAL COOPERATIVE FREIGHT RESEARCH PROGRAM Current and Completed Projects
 NATIONAL COOPERATIVE FREIGHT RESEARCH PROGRAM Current and Completed Projects NATIONAL COOPERATIVE FREIGHT RESEARCH PROGRAM Current and Completed Projects For more information, contact William Rogers, TRB,
FREIGHT PLANNING IN THE BALTIMORE REGION AMPO Annual Meeting. October 23, 2013
 FREIGHT PLANNING IN THE BALTIMORE REGION 2013 AMPO Annual Meeting October 23, 2013 Baltimore Regional Transportation Board (BRTB) The Baltimore Regional Transportation Board (BRTB) is the Metropolitan
I know that you all understand the critical importance of the freight transportation system
 United States Senate Subcommittee on Surface Transportation and Merchant Marine Infrastructure, Safety and Security Testimony of Michael L. Ducker President and CEO FedEx Freight Corporation April 4, 2017
Commonwealth Transportation Board Sean T. Connaughton 1401 East Broad Street (804) Chairman Richmond, Virginia Fax: (804)
 Chairman Richmond, Virginia Fax: (804)") Commonwealth Transportation Board Sean T. Connaughton 1401 East Broad Street (804) 786-1830 Chairman Richmond, Virginia 23219 Fax: (804) 786-2940 RESOLUTION OF THE COMMONWEALTH TRANSPORTATION BOARD Made
Commonwealth Transportation Board Sean T. Connaughton 1401 East Broad Street (804) 786-1830 Chairman Richmond, Virginia 23219 Fax: (804) 786-2940 RESOLUTION OF THE COMMONWEALTH TRANSPORTATION BOARD Made
FREIGHT CORRIDORS AND GATEWAYS: DEVELOPMENT APPROACH AND EVALUATION CRITERIA COMPARISON IN NORTH AMERICA AND THE EUROPEAN UNION
 FREIGHT CORRIDORS AND GATEWAYS: DEVELOPMENT APPROACH AND EVALUATION CRITERIA COMPARISON IN NORTH AMERICA AND THE EUROPEAN UNION Juan Carlos Texas A&M Transportation Institute Introduction International
Technical Memorandum MULTIMODAL NEEDS. Prepared for: Oklahoma Department of Transportation. Prepared by:
 Technical Memorandum MULTIMODAL NEEDS Prepared for: Oklahoma Department of Transportation Prepared by: May 2015 Technical Memorandum The Technical Memos were written to document early research for the
Project Overview. A Collaborative Effort
 Project Overview A Collaborative Effort DRPT and FRA are working closely with CSX, which owns and operates the corridor, as well as with passenger operators Amtrak and Virginia Railway Express (VRE), the
TEXAS MEXICO TRANSPORTATION BORDER MASTER PLAN UPDATE
 TEXAS MEXICO TRANSPORTATION BORDER MASTER PLAN UPDATE Border Trade Advisory Committee Footer Text Date Background Information: May 31, 2017 Previous border master plans (2013 / 2014) Primarily focused
HB2 Implementation Policy Guide
 report HB2 Implementation Policy Guide prepared for Commonwealth Transportation Board date March 18, 2015 Table of Contents 1.0 Introduction... 9 1.1 HB2 Legislation Requirements... 10 House Bill 1887...
Delaware Department of Transportation Agriculture Supply Chain Study: Transportation Supply Chain Analysis ihs.com
 IHS TRANSPORTATION CONSULTING Delaware Department of Transportation Agriculture Supply Chain Study: Transportation Supply Chain Analysis ihs.com Overview of Findings Delmarva Freight Summit June 24 th,
CHAPTER 1: INTRODUCTION/ GOALS AND OBJECTIVES
 CHAPTER 1: INTRODUCTION/ GOALS AND OBJECTIVES 1.1: INTRODUCTION ABOUT THE FREDERICKSBURG AREA METROPOLITAN PLANNING ORGANIZATION (FAMPO) Established in 1992, the Fredericksburg Area Metropolitan Planning
The Point Intermodal River Port Facility at the Port of Huntington Project Benefit Cost Summary
 The Point Intermodal River Port Facility at the Port of Huntington Project Benefit Cost Summary The Lawrence County Port Authority 216 Collins Avenue South Point, Ohio 45638 P a g e Contents I. Base Case...
HB2 Implementation Policy Guide
 report HB2 Implementation Policy Guide prepared for Commonwealth Transportation Board date August 1, 2015 Table of Contents 1.0 Introduction... 1 1.1 HB2 Legislation Requirements... 1 1.2 Roles and Responsibilities...
Performance Management & Goals
 Management & The Nevada Freight Plan is a performance-based plan, in compliance with Title 23, Highways, of the United s Code, that defines performance measures and targets for each goal and objective
North Carolina Statewide Freight Plan
 Greater Charlotte Regional Freight Peer Exchange North Carolina Statewide Freight Plan Derry Schmidt & Terry Arellano NCDOT Planning Branch NC : Two Phase Process Phase 1 Interim MAP-21 compliant freight
Rapid City Area Metropolitan Planning Organization OPERATIONS PLAN
 Rapid City Area Metropolitan Planning Organization OPERATIONS PLAN Prepared for the Rapid City Area Metropolitan Planning Organization Endorsed by the Executive Policy Committee of the Rapid City Area
Memorandum. FROM: Jim Ortbal Rosalynn Hughey Barry Ng TO: HONORABLE MAYOR, CITY COUNCIL. DATE: June 16, 2017
 CITY OF SANjOSE CAPITAL OF SILICON VALLEY TO: HONORABLE MAYOR, CITY COUNCIL SUBJECT: TRANSPORTATION POLICY UPDATE REQUIRED BY STATE LAW - LOS TO VMT Memorandum FROM: Jim Ortbal Rosalynn Hughey Barry Ng
Governor Baldacci s Transportation Bond Proposal
 Governor Baldacci s Transportation Bond Proposal Talking Points Highway and Bridge Investment The lifeblood of the Maine economy $100 HF Bond Maine s Bridges are old and getting older - Nearly 10% are
Long Bridge Project. Environmental Impact Statement (EIS) Revised Purpose and Need
 Revised Purpose and Need") Environmental Impact Statement (EIS) Revised Purpose and Need June 23, 2017 1.0 What is the Proposed Action? The consists of potential improvements to the Long Bridge and related railroad infrastructure
Environmental Impact Statement (EIS) Revised Purpose and Need June 23, 2017 1.0 What is the Proposed Action? The consists of potential improvements to the Long Bridge and related railroad infrastructure
2 Purpose and Need. 2.1 Study Area. I-81 Corridor Improvement Study Tier 1 Draft Environmental Impact Statement
 2 Purpose and Need 2.1 Study Area Interstate 81 (I-81) is relied upon for local and regional travel and interstate travel in the eastern United States. It extends 855 miles from Tennessee to New York at
NEW ORLEANS REGION TRANSIT COMPREHENSIVE OPERATIONS ANALYSIS SCOPE OF SERVICES. RPC Project LA90X361
 NEW ORLEANS REGION TRANSIT COMPREHENSIVE OPERATIONS ANALYSIS SCOPE OF SERVICES RPC Project LA90X361 Overview Summary The purpose of the Comprehensive Operations Analysis (COA) is to provide detailed review
Energy Savings by replacing old facility o Energy savings o Emissions
 Dubuque Intermodal Transportation Center Cost / Benefit Analysis Input values used in this analysis are taken from the U.S. Department of Transportation (USDOT) guidance on the preparation of Cost Benefit
- FACT SHEET - THE GUIDING PRINCIPLES
 THE GUIDING PRINCIPLES The General Plan begins with seven ideas that together create a vision for the City s future. When the City approved the General Plan in 1994, these idea were dubbed the Seven Guiding
National Capital Region Congestion Report
 NATIONAL CAPITAL REGION TRANSPORTATION PLANNING BOARD National Capital Region Congestion Report 2nd Quarter 2014 Metropolitan Washington Council of Governments 777 North Capitol Street, N.E., Suite 300,
NEW JERSEY STATE RAIL PLAN NJ TRANSIT New Jersey Department of Transportation
 NJ TRANSIT New Jersey Department of Transportation NJ TRANSIT AND NJDOT TEAM Developing State Rail Plan NJ TRANSIT contract Over the next six months Most planning information already exists Data must be
ITEM 11 - Information January 21, Briefing on Project Submissions for the 2015 CLRP
 ITEM 11 - Information January 21, 2015 Briefing on Project Submissions for the 2015 CLRP Staff Recommendation: Issues: Background: Receive briefing on the major projects submitted for the 2015 CLRP by
USDOT PERFORMANCE BASED PLANNING AND PROGRAMMING (PBPP)
") USDOT PERFORMANCE BASED PLANNING AND PROGRAMMING (PBPP) Eric Randall TPB Transportation Engineer Jane Posey TPB Transportation Engineer MWAQC TAC February 14, 2017 Agenda Item 4 Performance Based Planning
USDOT PERFORMANCE BASED PLANNING AND PROGRAMMING (PBPP) Eric Randall TPB Transportation Engineer Jane Posey TPB Transportation Engineer MWAQC TAC February 14, 2017 Agenda Item 4 Performance Based Planning
CITY OF JACKSONVILLE 2030 MOBILITY PLAN STUDY UPDATE GOALS, OBJECTIVES, AND PERFORMANCE MEASURES PREPARED FOR: CITY OF JACKSONVILLE
 CITY OF JACKSONVILLE 2030 MOBILITY PLAN STUDY UPDATE GOALS, OBJECTIVES, AND PERFORMANCE MEASURES 3.20.2017 PREPARED FOR: CITY OF JACKSONVILLE 55 Railroad Row White River Junction, VT 05001 802.295.4999
2016 Mid-Continent Transportation Research Symposium, October 24-25, Donna Brown-Martin, Director Bureau of Planning and Economic Development
 2016 Mid-Continent Transportation Research Symposium, October 24-25, 2016 Donna Brown-Martin, Director Bureau of Planning and Economic Development Why the State Freight Plan is Important to You Vision,
Inland Port Cargo Complex
 Inland Port Cargo Complex Regional Approach for Ports A statewide improvement Connects five plus seaports Promotes connectivity utilizing existing transportation network Improves rail efficiencies Relocates
Modeling Applications for Freight Tennessee DOT Freight Planning
 Modeling Applications for Freight Tennessee DOT Freight Planning presented to Tennessee Model Users Group presented by Dike Ahanotu Cambridge Systematics, Inc. July 17, 2008 Transportation leadership you
Chapter 10 Goals, Objectives + Policies
 Chapter 10 Goals, + Policies Warehouse on Nestle Way near I-78 114 115 10.1 ESTABLISHMENT OF CONSISTENT GOALS 10.2 NATIONAL FREIGHT GOALS The Lehigh Valley s freight transportation investment decisions
UPDATE ON FEDERAL RULEMAKING AND PERFORMANCE BASED PLANNING & PROGRAMMING
 UPDATE ON FEDERAL RULEMAKING AND PERFORMANCE BASED PLANNING & PROGRAMMING Eric Randall, TPB Transportation Engineer TPB Regional Public Transportation Subcommittee Agenda Item 6 Presentation Items Performance
This plan document is available at: Oklahoma Department of Transportation Planning and Research Division 200 NE 21 st Street Oklahoma City, OK 73105
 The 2010-2035 Oklahoma Long Range Transportation Plan was approved by the Oklahoma Transportation Commission on December 6, 2010. This plan document is available at: Oklahoma Department of Transportation
The Three C s of Urban Transportation Planning
 The Three C s of Urban Transportation Planning Edward G. W etzel Engineer of Transportation Policy Port of New York Authority The need for continuing, comprehensive, urban transportation planning on a
GUIDING PRINCIPLES MEMORANDUM
 M E T R O P O L I TAN TRA NS P O RTATI O N PLAN GUIDING PRINCIPLES MEMORANDUM El Paso Metropolitan Planning Organization INTRODUCTION The guiding principles for development of the El Paso MPO s Destino
Factors Affecting Transportation Decisions. Transportation in a Supply Chain. Transportation Modes. Road freight transport Europe
 Transportation in a Supply Chain Factors Affecting Transportation Decisions Carrier (party that moves or transports the product) Vehicle-related cost Fixed operating cost Trip-related cost Shipper (party
Are We Prepared for the Energy Movements? JEANNIE BECKETT THE BECKETT GROUP ENERGY EXPORT PERMITTING IN THE NW JUNE SEA-TAC CONFERENCE CENTER
 Are We Prepared for the Energy Movements? JEANNIE BECKETT THE BECKETT GROUP ENERGY EXPORT PERMITTING IN THE NW JUNE 16 2014 SEA-TAC CONFERENCE CENTER Topics Capacity existing infrastructure Further rail/port
TRANSPORTATION PLANNING EDITION
 T U E S D A Y 2 6 J U L Y 2 0 1 6 C O L U M B U S, O H I O FAST and Furious: Transportation Planning Edition TRANSPORTATION PLANNING EDITION Matthew Hardy, Ph.D. Program Director for Planning and Performance
Benefit Cost Analysis 2016 TIGER Grant Application Funding Opportunity #: DTOS59-16-RA-TIGER8
 Benefit Cost Analysis 2016 TIGER Grant Application Funding Opportunity #: DTOS59-16-RA-TIGER8 Applicant: Philadelphia Regional Port Authority Packer Avenue Marine Terminal Berth and Crane Rail Enhancement
Challenges and Opportunities for Canada s Freight Railways
 Challenges and Opportunities for Canada s Freight Railways Ninth Annual CILTNA Transportation Outlook Conference Cliff Mackay, President & CEO The Railway Association of Canada May 10, 2010 Ottawa, Ontario
Congestion Management Process 2013 Update
 OVERVIEW OF THE DALLAS-FORT WORTH CONGESTION MANAGEMENT PROCESS Traffic Congestion In The Dallas-Fort Worth Region With the Dallas-Fort Worth (DFW) urban area as its center, the North Central Texas region
National Capital Region Transportation Planning Board
 National Capital Region Transportation Planning Board Evaluating Alternative Scenarios for a Network of Variably Priced Highway Lanes in the Metropolitan Washington Region Final Report February, 2008 FUNDED
MEMORANDUM EXAMPLES FOR ILLUSTRATIVE PURPOSES NEXT STEPS. Item 3 Long-Range Plan Task Force May 17, 2017
 Item 3 Long-Range Plan Task Force May 17, 2017 MEMORANDUM TO: TPB Long-Range Plan Task Force FROM: Kanti Srikanth, TPB Staff Director SUBJECT: Sample list of improvement initiatives for illustrative purposes
A MODAL COMPARISON OF DOMESTIC FREIGHT TRANSPORTATION EFFECTS ON THE GENERAL PUBLIC EXECUTIVE SUMMARY. November 2007
 A MODAL COMPARISON OF DOMESTIC FREIGHT TRANSPORTATION EFFECTS ON THE GENERAL PUBLIC EXECUTIVE SUMMARY November 2007 Prepared by CENTER FOR PORTS AND WATERWAYS TEXAS TRANSPORTATION INSTITUTE 701 NORTH POST
NEW JERSEY DEPARTMENT OF TRANSPORTATION. New Jersey Statewide Strategic Freight Rail Plan
 NEW JERSEY DEPARTMENT OF TRANSPORTATION New Jersey Statewide Strategic Freight Rail Plan OVER-ARCHING PROJECT PURPOSE In short, the plan is intended to: Identify Issues That Constrain Freight Rail Operations
Rail - What Does the Future Bring?
 Rail - What Does the Future Bring? Jeannie Beckett Sr. Dir., Inland Transportation Port of Tacoma Oct 18, 2007 The Rail Networks Railroads Media Blitz Print Ads TV Ads Radio Ads D:\aapa\ RailroadsPSA.wmv
Presentation to DATA on VTrans 2040 / HB2. October 21, 2015
 Presentation to DATA on VTrans 2040 / HB2 October 21, 2015 Life Cycle of a Candidate Project How it s planned. How it s scored. How it s funded. 2 How it s planned. VTrans2040 VTRANS 2040 serves two functions,
PPTA Project Pipeline
 PPTA Project Pipeline Commonwealth of Virginia May 2012 Opening Remarks The Commonwealth of Virginia was developed in the 17 th century as a risky, but ultimately highly successful business venture between
National Capital Region Congestion Report
 Item #6 TPB Technical Committee May 2, 2014 NATIONAL CAPITAL REGION TRANSPORTATION PLANNING BOARD National Capital Region Congestion Report 4th Quarter 2013 (DRAFT) Metropolitan Washington Council of Governments
WM2008 Conference, February 24-28, 2008, Phoenix, AZ. Commodity Flow Study Clark County, Nevada, USA
 Commodity Flow Study Clark County, Nevada, USA - 8402 Sheila Conway, Ph.D. Urban Environmental Research LLC 10100 West Charleston Boulevard Suite 200 Las Vegas, NV 89135 Irene Navis, AICP Planning Manager
Welcome and thank you for your interest in the proposed Baltimore-Washington Superconducting Maglev Project.
 Transcript for Baltimore-Washington Superconducting Maglev Environmental Study Project Process & Information Video October 2017 Slide 1 Welcome and thank you for your interest in the proposed Baltimore-Washington
The Future of Trucking in Virginia: Interstate and Intermodal Strategies
 The Future of Trucking in Virginia: Interstate and Intermodal Strategies Randy Mullett Vice President - Government Relations & Public Affairs, Con-way Inc. Virginia Global Logistics Forum December 7, 2011
Select U.S. Ports Prepare For Panama Canal Expansion
 Select U.S. Ports Prepare For Panama Canal Expansion Port of Jacksonville Grace Wang Associate Professor, Maritime Administration Texas A&M University at Galveston Galveston, Texas Anthony M. Pagano Director,
SmartWay 2.0 February 9, 2009 Buddy Polovick USEPA
 LOGISTICS 2009 February 8-11, 2009 Gaylord Texan Dallas, Texas SmartWay 2.0 February 9, 2009 Buddy Polovick USEPA Outline Energy, Environment, Economy SmartWay Transport Partnership SmartWay 2.0 U.S. Transportation
Technical Report 7: Freight Mobility Final Adopted Plan
 2040 Long Range Transportation Plan Technical Report 7: Freight Mobility Final Adopted Plan January 2016 250 South Orange Avenue, Suite 200, Orlando, FL 32801 407-481-5672 www.metroplanorlando.com MetroPlan
International Inland Port of Dallas (IIPOD): Converting Vision to Reality
: Converting Vision to Reality") International Inland Port of Dallas (IIPOD): Converting Vision to Reality Economic Committee September 18, 2007 1 Purpose To describe the IIPOD vision To show how changing global trade patterns create
International Inland Port of Dallas (IIPOD): Converting Vision to Reality Economic Committee September 18, 2007 1 Purpose To describe the IIPOD vision To show how changing global trade patterns create
Appendix D: Functional Classification Criteria and Characteristics, and MnDOT Access Guidance
 APPENDICES Appendix D: Functional Classification Criteria and Characteristics, and MnDOT Access Guidance D.1 Functional classification identifies the role a highway or street plays in the transportation
Eric Thomas Benchmark River and Rail Terminals
 Eric Thomas Benchmark River and Rail Terminals CORBA s Mission The Central Ohio River Business Association (CORBA) is an alliance of businesses and industry engaged in river commerce on and along the Ohio
TransAction Plan October 2017
 Transportation Action Plan for Northern Virginia TransAction Plan October 2017 TransAction is the multimodal transportation master plan for Northern Virginia. It is a long range plan addressing regional
State of Idaho Profile
 Overview Of s 44 counties, 4 are within 20 miles of the Great Northern Corridor s (GNC) rail backbone. The GNC s multimodal corridor consisting of highways, rail and ports. It represents an east-west artery
Justification Review. Public Transportation Program. Florida Department of Transportation
 Justification Review Public Transportation Program Florida Department of Transportation Report 99-24 January 2000 Office of Program Policy Analysis and Government Accountability an office of the Florida
Business Plan for FY14 FY15
 Business Plan for FY14 FY15 Commissioner s Message May 2013 The Executive Team and I are pleased to present the new Business Plan for FY 2014-15. This plan builds on the key priorities to deliver our mission:
PERSPECTIVES ON THE FAST ACT
 T h u r s d a y, S e p t e m b e r 8, 2 0 1 6 C S G W E S T A N N U A L M E E T I N G C O E U R D A L E N E, I D FAST and Furious Edition: PERSPECTIVES ON THE FAST ACT Matthew Hardy, Ph.D. Program Director
Sustainability. Sustainability Principles. 1. Framework. Spokane Transit s definition of Sustainability is:
 Sustainability Spokane Transit s definition of Sustainability is: Sustainability at Spokane Transit is about providing services in ways that optimize our ability to meet the needs of present and future
Final Regional 2035 Transportation Plan Adopted: January 21, 2010
 Final Regional 2035 Transportation Plan Adopted: January 21, 2010 Paul T. Hamilton, Chief Planner Tri-County Regional Planning Commission Federal Requirement Safe Accountable Fair and Efficient Transportation
PRTC Strategic Plan Recommendations
 PRTC Strategic Plan s September 2017 Strategic Plan Overview Phase I Potential Funding Alternatives Strategies for establishing alternative funding sources Draft report submitted to PRTC in November 2016
Mobility and System Reliability Goal
 Mobility and System Reliability Goal Provide surface transportation infrastructure and services that will advance the efficient and reliable movement of people and goods throughout the state. Background:
TPB Scenario Study Task Force: Proposal for Development and Analysis of Two New Scenarios
 ITEM 15 TPB Scenario Study Task Force: Proposal for Development and Analysis of Two New Scenarios February 20, 2008 Proposal for Two New Scenarios o At its January 16, 2008 meeting, the Scenario Study
Utah s Most Critical Surface Transportation Projects to Support Economic Growth and Quality of Life. March Washington, DC
 Utah s Most Critical Surface Transportation Projects to Support Economic Growth and Quality of Life March 2015 Washington, DC 202-466-6706 Founded in 1971, TRIP of Washington, DC, is a nonprofit organization
Introduction to North American Rail Transportation
 Introduction to North American Rail Transportation Christopher Barkan Professor & Executive Director Rail Transportation & Engineering Center University of Illinois at Urbana-Champaign Presentation Outline
ITEM 8 Action May 17, 2017
 ITEM 8 Action May 17, 2017 Approval of Maryland Department of Transportation (MDOT) Additional Project Submission for the Out-Of-Cycle Air Quality Conformity Analysis for the Amendment to the 2016 CLRP
Special Advertising Section
 Special Advertising Section Vital and Dynamic Trucking Industry Plots Road to Sustainable Future Written by John D. Schulz Trucking is an overlooked national resource, even in the transportation world.
Economic Impact Analysis of Short Line Railroads. Louisiana State University - Research Team Dr. Jared Llorens Dr. Jim Richardson Mr.
 Economic Impact Analysis of Short Line Railroads Louisiana State University - Research Team Dr. Jared Llorens Dr. Jim Richardson Mr. Brendan Buras Background Terminology Short Line Rail Short line (Class