Final Report. Expansion of the Border Crossing Information System. Rajat Rajbhandari, Juan Carlos Villa and Rafael Aldrete-Sanchez
|
|
|
- Alexina Heath
- 6 years ago
- Views:
Transcription

1 Improving the Quality of Life by Enhancing Mobility University Transportation Center for Mobility DOT Grant No. DTRT06-G-0044 Expansion of the Border Crossing Information System Final Report Rajat Rajbhandari, Juan Carlos Villa and Rafael Aldrete-Sanchez Performing Organization University Transportation Center for Mobility Texas Transportation Institute The Texas A&M University System College Station, TX Sponsoring Agency Department of Transportation Research and Innovative Technology Administration Washington, DC UTCM Project # March 15, 2009
2 1. Project No. UTCM Technical Report Documentation Page 2. Government Accession No. 3. Recipient's Catalog No. 4. Title and Subtitle Expansion of the Border Crossing Information System 7. Author(s) Rajat Rajbhandari, Juan Carlos Villa, Rafael Aldrete-Sanchez 5. Report Date March 15, Performing Organization Code Texas Transportation Institute 8. Performing Organization Report No. UTCM Performing Organization Name and Address University Transportation Center for Mobility Texas Transportation Institute The Texas A&M University System 3135 TAMU College Station, TX Sponsoring Agency Name and Address Department of Transportation Research and Innovative Technology Administration th Street, SW Washington, DC Work Unit No. (TRAIS) 11. Contract or Grant No. DTRT06-G Type of Report and Period Covered Final Report 2/1/08-1/31/ Sponsoring Agency Code 15. Supplementary Notes Supported by a grant from the US Department of Transportation, University Transportation Centers Program 16. Abstract There is no reliable system in place to measure and report border crossing times to either commercial trade or travelers planning to cross the U.S.-Mexico border. This research project, in combination with three other already funded and ongoing projects, provides a prototype of such a system. The result is a real-time international border crossing travel time information system prototype. In addition to real-time information, the project serves as a valuable data source for three other important activities: a) estimating the economic impact of border crossing delay and potential improvements, b) validating dynamic cross-border traffic assignment models, and c) long range transportation planning. This project designed the mechanisms to automatically capture border crossing times for commercial vehicles and convert those results to user-friendly formats that can be shared with stakeholders involved in the U.S.-Mexico international border crossing process for operations, planning and research purposes. In order to maximize the effective use of the information, the project began with a comprehensive survey of stakeholder information needs, focused primarily on commercial crossing users. TTI researchers defined the methodology to capture the information for commercial-vehicle crossing time. The best way to present the information to potential users was identified and the systems required to share the information with key stakeholders were developed and tested during this project. 17. Key Word United States-Mexico Border, Crossing times, Real time information, Travel time, Traffic assignment, Commercial vehicles, Research projects 18. Distribution Statement Public distribution 19. Security Classif. (of this report) Unclassified 20. Security Classif. (of this page) Unclassified 21. No. of Pages Price n/a Form DOT F (8-72) Reproduction of completed page authorized
3 Expansion of the Border Crossing Information System Rajat Rajbhandari, Ph.D., P.E. Associate Research Engineer Center for International Intelligent Transportation Research Texas Transportation Institute, Texas A&M University Juan Carlos Villa Program Manager Economics, Trade, and Logistics Program Texas Transportation Institute, Texas A&M University Rafael Aldrete-Sanchez, Ph.D., P.E. Research Engineer Center for International Intelligent Transportation Research Texas Transportation Institute, Texas A&M University Final Report Project March, 2009
4 Disclaimer The contents of this report reflect the views of the authors, who are responsible for the facts and accuracy of the information presented herein. This document is disseminated under the sponsorship of the Department of Transportation, University Transportation Centers Program in the interest of information exchange. The U.S. Government assumes no liability for the contents or use thereof. Acknowledgment Support for this research was provided by a grant from the U.S. Department of Transportation, University Transportation Centers Program to the University Transportation Center for Mobility DTRT06-G The authors would like to acknowledge Crystal Jones (Federal Highway Administration) for providing valuable comments to the project. The authors would also like to acknowledge funds provided by the Center for International Intelligent Transportation Research (CIITR) at the Texas Transportation Institute s El Paso to support several related research projects. 2
5 Table of Contents Executive Summary...11 Chapter 1. Introduction The El Paso Border Crossing Environment Stakeholders Participating in the Border Crossing Process...16 Chapter 2. Stakeholder Needs Stakeholders Information Requirements Pre-Trip Traveler Information Archived Border Crossing Data Centralized Repository of Archived Border Crossing Data Single Portal to Access Pre-Trip Traveler Information Border Crossing Performance Measures External Economic Indicators Data Data Analysis for Planning and Research Innovative Methods of Collecting Border Crossing Data...42 Chapter 3. Information System Requirements Functional Scope Assumptions and Constraints Mapping Stakeholder Needs to BIFA High-Level Functional Requirements Low-Level Functional Requirements...48 Chapter 4. Information System Design and Implementation Background Objectives and Scope of the Prototype Design Principles...53 Chapter 5. Prototype Design and Implementation General Framework Database Schema Data Extraction and Aggregation Processes Information Dissemination and Access to Archived Data CBP Reported Border Wait Times
6 5.6 Homeland Security Threat Level U.S.-Mexico Trade Data Daily Currency Exchange Rate...78 Chapter 6. Future Implementations and Lessons Learned RFID Based Border Crossing Time Bluetooth Based Border Crossing Time Border Crossing Performance Indices Formal Data Exchange Processes Data Fusion and Integration Funding Mechanisms and Stakeholder Support Technologies to Measure Vehicle Crossing Times Goals and Objectives of Integrating with BCIS Test to Integrate BCIS with RFID Technology Test to Integrate BCIS with Bluetooth Technology Conclusions and Lessons Learned from the Tests References
7 List of Figures Figure Passenger Vehicle Crossing from Mexico into the U.S Figure 2. US-Mexico Trade by Truck Figure 3. El Paso Region International Border Crossings Figure 4. Types of Pre-Trip Traveler Information for Commercial and Private Travelers Figure 5. Types of Commercial Vehicle Related Archived Data Figure 6. Types of passenger vehicle related archived data Figure 7. Centralized Repository of Archived Border Crossing Data Figure 8. Current flow of pre-trip traveler information between stakeholders Figure 9. Single window pre-trip traveler information Figure 10. BIFA Equipment Packages to be Provided by the Border Crossing Information System Figure 11. Database-Centric Architecture Showing Separation between User Interface and Database Figure 12. Multi-Tier Architecture Consists of Data Storage, Business Logic and Presentation Tiers Figure 13. Addition of Prototype BCIS Related Data and Business Processes into Existing PDN- RMIS Data Warehouse Figure 14. FACTS and DIMENSIONS Tables in the Prototype BCIS Database Figure 15. Sample FACTS and DIMENSIONS Tables in the Prototype BCIS for Border Crossing Performance Measurement Figure 16. Data Extraction and Aggregation Process in the Prototype BCIS Figure 17. Process to Disseminate Information Through the Internet in the Prototype BCIS Figure 18. Snapshot of PDN-RMIS Website Merged with Border Crossing-Related Information Developed as Part of the Prototype BCIS Figure 19. Prototype BCIS Related Reports Implemented using PDN-RMIS Website Figure 20. Microsoft SQL Server s Reporting Services Architecture (17) Figure 21. Microsoft SQL Server s reporting services to display web-based reports Figure 22. Snapshot of CBP Reported Border Wait Times at Ports of Entry in the El Paso Region Figure 23. CBP Reported Border Wait Times Data Extraction and Relay Process
8 Figure 24. CBP Reported Border Wait Times Data Aggregation and Archiving Process Figure 25. CBP Reported HOURLY Border Wait Times Archived in Prototype BCIS Database Using the Star Schema Figure 26. CBP Reported DAILY Average Border Wait Times Archived in Prototype BCIS Database Using the Star Schema Figure 27. Webpage to Query and Access CBP Reported Hourly Border Wait Times at Different Ports of Entry in the El Paso Area Figure 28. Web-based Report to Query and Access CBP Reported Hourly Border Wait Times of Commercial and Passenger Vehicles at the Bridge of the Americas Port of Entry. 71 Figure 29. Web-based Report to Query and Access CBP Reported Hourly Border Wait Times of Passenger Vehicles at the Paso Del Norte Port of Entry Figure 30. Web-Based Report to Query and Access CBP Reported Hourly Border Wait Times of Commercial and Passenger Vehicles at the Ysleta Port of Entry Figure 31. Web-based Report to Compare Daily Average Commercial Vehicle Border Wait Times Between FAST and Non-FAST Lanes at the BOTA and Ysleta Ports of Entry Figure 32. Web-based Report to Compare Daily Average Passenger Vehicle Border Wait Times at Ysleta, BOTA, and PDN Bridges Figure 33. Department of Homeland Security RSS for Daily Threat Advisory Condition Figure 34. Data Flow Diagram to Illustrate a Process to Extract and Archive Daily Threat Level Provided by DHS Figure 35. Data Flow Diagram to Illustrate a Process to Download and Aggregate Monthly Import-Export Related Data Provided by BTS Figure 36. Monthly Import-Export Data Downloaded from BTS and Archived in the BCIS Prototype using FACTS and Dimensions Table Structure Figure 37. Web-based report to query BTS provided monthly volume of containers entering the U.S. through ports in the El Paso region Figure 38. Web-Based Report Tto Query BTS Provided Monthly Volume of Incoming Trucks and Import Through Ports in the El Paso Region Figure 39. Data Flow Diagram to Illustrate a Process to Extract Daily Currency Exchange Rate
9 Figure 40. Snapshot of a Table with Daily U.S.-Mexican Currency Exchange Rate Figure 41. Data Flow Diagram Showing Application of RFID to Measure and Relay Commercial Vehicle Border Crossing Times Figure 42. Data Flow Diagram Showing Aggregation of RFID Data into Hourly and Daily Average Crossing Times Figure 43. Data flow Diagram Showing Application of Bluetooth to Measure and Relay Passenger Vehicle Border Crossing Times Figure 44. Data Flow Diagram Showing Aggregation of Bluetooth Data into Hourly and Daily Average Crossing Times Figure 45. Input to Estimate Border Crossing Performance Measures Figure 46. Integrating Various Technologies to Measure Border Crossing Information Figure 47. Aerial View of the U.S. Side of the Bridge of the Americas and Location of CBP and DPS Inspection Facilities Figure 48. A Truck Carrying both DPS and CBP Issued RFID Tags Figure 49. Location of Entrance and Exits (and RFID Stations) to the DPS Facility and Typical Path of a Truck Originating from the CBP Facility Figure 50. Set up of RFID Stations on Day 1 at Entrance and Exit of the DPS Facility Figure 51. Set up of RFID Stations on Day 2 at Entrance and Exit of the DPS Facility Figure 52. Physical and Logical Diagram of Communication and Database Setup to Read Tag Identifications from RFID Stations Figure 53. Total Numbers of Transponders Read by RFID Readers at Entrance and Exit of the DPS Facility Figure 54. Total Number of Transponders Read by RFID Readers at Different Times of Day.. 98 Figure 55. Hourly Average Crossing Times of Commercial Vehicles at Different Times of Day Figure 56. Locations of Ports of Entry in the El Paso Region Where Bluetooth Tests Were Performed Figure 57. A Typical Setup of Bluetooth Readers at U.S. and Mexico Sides of the Border Figure 58. TTI Student Conducting Intercept Survey of Motorists Entering the U.S
10 Figure 59. Crossing Times (in Minutes) of Northbound Passenger Vehicles Compared with CBP Reported Crossing Time Figure 60. Segregation of Passenger versus Pedestrian Crossing Times (in Minutes)
11 List of Tables Table 1. List of Stakeholders Operating in and Outside of the Border Table 2. Roles and Responsibilities of Stakeholders Table 3. Stakeholder Needs for Pre-Trip Traveler Information Table 4. Pre-Trip Traveler Information Specifications and Requirements Table 5. Possible Producers of Pre-Trip Traveler Information Table 6. Stakeholder Need for Archived Border Crossing Data Table 7. Existing Scope and Availability of Archived Commercial Vehicle Data Table 8. Existing Scope and Availability of Passenger Vehicle Data Table 9. Existing Scope and Availability of Transit and Pedestrian Data Table 10. Specification and Requirements for Archived Border Crossing Data Table 11. Specification and Requirements for Commercial Vehicle Related Archived Data Table 12. Specification and Requirements for Passenger Vehicle Related Data Table 13. Specification and Requirements for Pedestrian Related Data Table 14. Specification and Requirements for Transit Related Data Table 15. Specification and Requirements for Border Crossing Performance Measure Data Table 16. Specification and Requirements for Economic Indicator Data Table 17. List of User Services and Equipment Packages Table 18. Functional Requirements of ITS Data Repository Equipment Package Table 19. Functional Requirements of Traffic and Roadside Data Archival Table 20. Functional Requirements of On-Line Analysis and Mining Equipment Package Table 21. Functional Requirements of ISP Traveler Data Collection Table 22. Functional Requirements of Basic Information Broadcast Equipment Package Table 23. Functional Requirements of Interactive Infrastructure Information Equipment Package Table 24. Functional Requirements of Personal Basic Information Reception Equipment Package Table 25. Scope of the Prototype BCIS and List of Functions and Capabilities Table 26. List of FACT Tables in the prototype BCIS database
12 Table 27. List of DIMENSIONS Tables in the Prototype BCIS Database Table 28. List of Tables to Store Raw and Aggregated RFID Data Table 29. List of Stored Procedures to Aggregate Raw RFID Data Table 30. Number of Bluetooth Signals Identified by the Readers on U.S. and Mexico Sides of Individual Port of Entry Table 31. Results of Intercept Survey at all Three Ports of Entry
13 Executive Summary The time it takes to cross the border from Mexico into the U.S. for both passenger and commercial vehicles is an important element in making travel and business decisions. Unfortunately, there is no reliable system in place to measure and report border crossing times for either commercial trade or travelers planning to cross the border. Several projects have been directed to start tackling the issue of this lack of reliable information at the border. This research project builds on several ongoing projects as well as previous research developed by the Texas Transportation Institute (TTI). The objective of this research is to develop the specifications for a comprehensive information system for border operations and planning, or the Border Crossing Information System (BCIS). The original scope of this project was to include commercial vehicle information only. However, given the importance of passenger vehicle information, the scope of work for this research was augmented to include passenger as well as commercial vehicles that cross the U.S.- Mexico border. Measuring and reporting border crossing and waiting times are of considerable interest to a wide range of stakeholders that interact at the border between Mexico and the United States. Travel time between origin in Mexico and destination in the U.S. side of the border is of high significance to the trade industry, daily commuters, and traveling public. The research team met with key border crossing stakeholders in the El Paso-Ciudad Juarez region. The objectives of the meetings were to identify stakeholders requirements for a variety of information (real-time and archived) related to border crossings. A comprehensive list of requirements for the border crossing information system (low and high level) was developed in accordance to interview with stakeholders and the Border Information Flow Architecture (BIFA). Based on stakeholder and other system requirements, a prototype information system was designed and implemented. This prototype Border Crossing Information System (BCIS) was designed to provide travelers and freight operators a wide range of real-time pre-trip travel information related to border crossings, including information on road network conditions, border crossing information, incidents, and weather. Based on this information, travelers can select the best departure time, route and modes of travel, or perhaps decide not to make the trip at all. BCIS also provides archived border crossing data for stakeholder agencies through a centralized repository and provides services to analyze and query the archived data. The archived border crossing data includes limited ITS data related to border crossings for planning, safety, operations, and research. The prototype BCIS was implemented using a data warehouse concept to support relational database structure and archive data in a variety of temporal and spatial granularity. Field tests were also performed to test the viability of the information system to integrate with field devices that could collect commercial and passenger vehicle crossing times. 11
14 12
15 Chapter 1. Introduction More than 80 million passenger vehicles crossed from Mexico into the United States in Most of these crossings are done on a regular basis and are important for the local economies on both sides of the border. Nearly half of all passenger vehicle crossings are concentrated at two border crossings San Ysidro and El Paso, with 15.7 million and 14 million crossings, respectively (Figure 1). Number of Passengers Vehicles in Millions Nogales, Arizona Calexico, California Calexico East, California Otay Mesa, California San Ysidro, California Brownsville, Texas Eagle Pass, Texas El Paso, Texas Hidalgo, Texas Laredo, Texas Port of Entry Figure Passenger Vehicle Crossing from Mexico into the U.S. SOURCE: U.S. Department of Transportation, Research and Innovative Technology Administration, Bureau of Transportation Statistics Commercial vehicle crossings at the U.S.-Mexico border play an important role in the border regional economies. Truck trade has been increasing at an annual average growth rate of 7.5 percent for the last decade (Figure 2). 13
16 250 Value in Billions of Dollars Year Figure 2. US-Mexico Trade by Truck SOURCE: U.S. Department of Transportation, Research and Innovative Technology Administration, Bureau of Transportation Statistics The time it takes to cross the border from Mexico into the U.S., for both passenger and commercial vehicles, is an important factor in travel and business decisions. Unfortunately, there is no reliable system in place to measure and report border crossing times for either commercial trade or travelers planning to cross the border. Several projects have been directed to start tackling the issue of lack of reliable information at the border. This research project builds on several ongoing projects as well as previous research developed by the Texas Transportation Institute (TTI). The objective of this research is to develop the specifications for a comprehensive information system for border operations and planning, or the Border Crossing Information System (BCIS). The original scope of this project was to include commercial vehicle information only. However, given the importance of passenger vehicle information, the scope of work for this research was augmented to include passenger as well as commercial vehicles that cross the U.S.- Mexico border. This report is organized in six chapters. The first chapter presents a brief description of the border crossing environment in the El Paso-Ciudad Juarez area followed by a description of the stakeholders in the passenger and commercial border crossing process. The second chapter of the report presents a detailed analysis of stakeholder needs, stratifying and classifying needs. The third chapter of the report presents the information system requirements of the BCIS and the fourth chapter presents the information system design. Chapter Five presents the prototype design and implementation scheme of the BCIS, and chapter Six describes future implementations and lessons learned. 14
, Santa Teresa (New Mexico), and Ciudad Juarez")


 Bridge and Good")


17 1.1 The El Paso Border Crossing Environment The metropolitan area encompassing El Paso (Texas), Santa Teresa (New Mexico), and Ciudad Juarez (Chihuahua) comprises five major ports of entry (POE). Two of these areas comprise the third largest commercial POEs along the U.S. southern border, the Bridge of the Americas (BOTA) and the Ysleta-Zaragoza Bridge. In addition, there are two more POEs located in the downtown area dedicated to non-commercial vehicles, the Paso del Norte (PDN) Bridge and Good Neighbor Bridge (Stanton Street Port). Of the four POEs, BOTA is the only one that it is not tolled; the rest charge a toll for commercial, non-commercial and pedestrian traffic.altogether, the POEs in El Paso have the second highest rate of international passenger traffic. One additional POE, Santa Teresa, is located in New Mexico. The Santa Teresa POE is located 35 miles from downtown El Paso, Texas. Figure 3 presents the border crossing structure in the region. Santa Teresa Paso Del Norte Bridge Good Neighbor Bridge Bridge of the Americas Zaragoza Bridge Figure 3. El Paso Region International Border Crossings. Each POE in the region has a different composition of traffic. A brief description of each crossing follows. Santa Teresa The Santa Teresa POE provides services to commercial, non-commercial, and pedestrian traffic. Santa Teresa is the only port of entry in this region that processes exported used vehicles destined for resale in Mexico. Livestock as well as hazardous material cargo use this facility as it 15
18 is the only POE that allows the movement of this type of freight in the region. This POE is available to non-commercial traffic from 6 AM to 10 PM daily; the commercial cargo facility is available Monday through Friday from 8 a.m. to 6 p.m., and Saturday from 9 a.m. to 2 p.m. 1. The POE has easy access to IH-10, located only 19 miles away. Paso Del Norte Bridge The Paso del Norte Bridge is restricted to non-commercial traffic in the northbound direction. Pedestrian traffic is allowed to cross in both directions. The access through PDN is available 24 hours, seven days a week. The number of pedestrians at this POE is considerably greater than any other POE in El Paso. Good Neighbor Bridge (Stanton Street Bridge) Stanton Street Bridge is used by non-commercial and pedestrian traffic in the southbound direction. The southbound access is available 24 hours, seven days a week for non-commercial vehicle inspection services and pedestrians. The bridge is also used by the Dedicated Commuter Lane (DCL) program for northbound traffic only. The northbound access for the DCL is available Monday through Friday from 6 a.m. to 10 p.m., and Saturday and Sunday from 10 a.m. to 6 p.m.. Bridge of the Americas (BOTA) The BOTA facility is located in the center of the El Paso-Ciudad Juarez metropolitan area with easy access to IH-10, and it is the only non-toll POE in El Paso. Non-commercial vehicle inspection and pedestrian access is available 24 hours, seven days a week. Commercial vehicle inspections operate from 6 a.m. to 6 p.m. Monday through Friday and from 6 a.m. to 2 p.m. on Saturdays. Empty commercial truck traffic prefers to use this toll-free bridge to avoid paying the toll at the Ysleta-Zaragoza Bridge. Ysleta-Zaragoza Bridge The Ysleta-Zaragoza Bridge is located in the southeastern portion of the city of El Paso, with direct access to Loop 375. Its hours of operation for non-commercial vehicle inspection and pedestrians are 24 hours, seven days a week, and for commercial cargo are 8 a.m. to midnight Monday through Friday, and 9 a.m. to 5 p.m. on Saturday. This bridge attracts high commercial volumes in the afternoon and evenings, because the BOTA closes earlier. 1.2 Stakeholders Participating in the Border Crossing Process Measuring and reporting border crossing and waiting times are of considerable interest to a wide range of stakeholders that interact at the border between Mexico and the United States. Travel time between origin in Mexico and destination in the U.S. side of the border is of high significance to the trade industry, daily commuters, and traveling public. 1 Hours of operation at POEs might change. Information included in this report is from November
19 Stakeholders on both sides of the U.S.-Mexico border include federal, state and local governments and agencies, shippers and truckers, bridge authorities, the traveling public, and other private sector companies such as TV, radio stations, internet and cellular phone companies currently transmitting border crossing wait time information. These stakeholders could be divided into two main groups: those that actively participate in the border crossing process and those that physically are not present during the border crossing process, but influence the border crossing operation (Table 1). Table 1. List of Stakeholders Operating in and Outside of the Border Stakeholder U.S. and Mexican Bridge Operations Agency U.S. and Mexican County or Municipal Public Safety Agencies U.S. Federal Motor Carrier Safety Administration (FMCSA) U.S. and Mexican Freight Shippers U.S. and Mexican Commercial Carriers U.S. and Mexican Private Travelers U.S. and Mexican Regional Transit Providers U.S. State Departments of Public Safety State Department of Transportation (DOT) U.S. and Mexican Toll Authorities U.S. Bureau of Transportation Statistics U.S. Customs and Border Protection (CBP) U.S. Department of Homeland Security U.S. Emergency Management Agencies U.S. General Services Administration U.S. and Mexican Municipal Government U.S. and Mexican Regional Transportation Planning Organization U.S. and Mexican Local Media Operating at the Border Operating Outside the Border In order to identify stakeholder needs, it is important first to understand the geography and operation of the border crossing process in the region. The Border Information Flow Architecture or BIFA (1) identified a list of low-level requirements of stakeholders for a typical border crossing information system. It is important to mention that the current version of BIFA was primarily developed for U.S- Canada border regions, but can be adapted for U.S.-Mexico border with careful consideration. Understanding roles and responsibilities of stakeholder agencies also indicates a need for particular types of information. Table 2 consists of stakeholder agencies in the region, along with a description of roles and responsibilities. 17
20 Stakeholder U.S. and Mexican Bridge Operations Agencies U.S. and Mexican County or Municipal Public Safety Agencies U.S. Department of Transportation Federal Motor Carrier Safety Administration (FMCSA) U.S. and Mexican Freight Shippers U.S. and Mexican Local Media U.S. and Mexican Private Commercial Carriers U.S. and Mexican Private Travelers U.S. and Mexican Regional Transit Providers U.S. State Department of Public Safety (DPS) State Department of Transportation (DOT) U.S. and Mexican Toll Authorities U.S. Bureau of Transportation Statistics U.S. Customs and Border Protection (CBP) U.S. Department of Homeland Security (DHS) Table 2. Roles and Responsibilities of Stakeholders Description of Roles and Responsibilities These agencies are responsible for operation of a bridge (or bridges) at the U.S.- Mexico border. These agencies could be private companies, public sector agencies, or public-private partnerships. These agencies include law enforcement and first responders for public safety in the U.S. and Mexico; including City or County Police Departments, Fire, Rescue, and Ambulance services; Sheriff s Department; State Police; Mexican Federal Police. FMCSA s mission is to prevent commercial motor vehicle-related crashes. FMCSA performs commercial vehicle inspections at the U.S.-Mexico border to ensure that Mexico-domiciled commercial vehicles operate safely in the United States. These agents coordinate the logistics of freight transportation across the border and engage in shipment of freight by multiple modes of transportation, including trucks, heavy rail, air, sea, etc. Media outlets include local and regional TV and radio stations, cable operators, print media, etc. These companies include private commercial vehicle operators who dispatch fleets of commercial vehicles. Due to circulation restrictions of Mexican-domiciled trucks beyond the 20-mile commercial zone at the border, most of the carriers handling cross-border trade are drayage companies that haul trailers back and forth at the border. These include motorists and pedestrians crossing the border as commuters and noncommuters. These include private and public agencies that provide transit services at or near the U.S.-Mexico border and have significant international ridership. Texas DPS operates a border safety inspection facility at the Texas-Mexico border to inspect safety of trucks entering the U.S. The State DOT is responsible for managing, operating, and/or maintaining stateowned transportation infrastructure (roads, airports, transit, railways). The Texas Department of Transportation (TxDOT) is responsible for the construction of the Border Safety Inspection Facilities and Texas DPS operates it. These include government agencies and possibly public-private partnerships responsible for the administration, operation and maintenance of bridges, tunnels, turnpikes, and other fee-based roadways. Responsibilities also include setting tolls and managing toll collection using manual and automatic methods. These agencies also operate a clearinghouse of information to share tolling data between various toll authorities and other government agencies. This U.S. government agency is responsible for gathering, analyzing, and distributing cross-border transportation data. Part of the Department of Homeland Security (DHS), this agency is responsible for managing the U.S. borders and ports of entry, preventing the passage of individuals or goods from entering the U.S. unlawfully. DHS has three primary missions: prevent terrorist attacks within the U.S., reduce vulnerability to terrorism, and minimize the damage from potential attacks and natural disasters. DHS includes several agencies operating near the U.S.-Mexican border, including Customs and Border Protection, Transportation Security Administration (TSA), and Immigration and Customs Enforcement (ICE). 18
21 Table 2. Roles and Responsibilities of Stakeholders (continued) Stakeholder Description of Roles and Responsibilities These include county and state agencies that coordinate overall response to large-scale incidents or major disasters. These agencies have mandates to set up emergency U.S. Emergency operations centers to respond to and recover from natural, manmade, and war-caused Management Agencies emergencies and for assisting local governments in their emergency preparedness, response and recovery efforts. GSA secures the buildings, products, services, technology, and other workplace U.S. General Services essentials federal agencies need. Responsibilities include planning and constructing Administration (GSA) infrastructure at border crossings. U.S. and Mexican City and municipal government agencies within the U.S. and Mexico operate and Municipal Government maintain local transportation infrastructure. U.S. and Mexican Metropolitan Planning Organizations (MPOs) in the U.S. and Mexico serve as support Regional Transportation agencies for local governments in developing and administering transportation Planning Organizations planning activities. Adapted from Border Information Flow Architecture (2006) 19
22 Chapter 2. Stakeholder Needs The research team met with key border crossing stakeholders in the El Paso-Ciudad Juarez region. The objectives of the meetings were to identify the stakeholders points of view and concerns on a crossing time measuring system. The key stakeholders that were contacted include: Drayage motor carriers Texas Department of Public Safety (DPS) U.S. Customs and Border Protection (CBP) City of Ciudad Juarez Private media companies 2.1 Stakeholders Information Requirements Drayage Motor Carriers Drayage is usually done by motor carriers established in the border region. The majority of the drayage motor carriers are small carriers with a low number of tractors. The large drayage carriers have global positioning systems (GPS) to track their shipments for security reasons. Before entering the Mexican Customs compound, large Mexican drayage carriers have inspection sites where loaded trucks receive a final security inspection using trained dogs to ensure that shipments are clean of any drugs or other illegal materials. This operation is organized by the truckers on an individual basis and the security inspection procedure adds little delay to the overall northbound crossing process. The research team met with representatives from two of the largest drayage companies representatives in the region (STIL and Fletes Sotelo) as well as with representatives of a Transportation Group (Coalicion de Transportistas) that represents 78 motor carriers working in the El Paso-Ciudad Juarez area. The trucking companies expressed interest in participating in the border crossing time measuring program. Currently most of the drivers communicate back to the base via radio transmitters. The drayage companies recognize the need for an application that could provide more reliable travel and crossing time information, and that information could be available at the dispatching center. Texas Department of Public Safety The Texas Department of Public Safety performs safety inspections of all trucks crossing into Texas. DPS is in the process of developing a safety express lane system at the Border Safety Inspection Facilities (BSIF). The system includes the use of radio frequency identification (RFID) tags on tractors that would allow DPS to verify the truck safety record electronically and define if the truck requires a safety inspection. The system is similar to CBP s Free and Secure Trade (FAST) program that has been implemented for security purposes. The system will have RFID readers at the entrance of the BSIFs and will be tested at the Bridge of the Americas facility in El Paso. DPS has already purchased the RFID tags and has begun distributing them to local motor carriers. 20
23 U.S. Customs and Border Protection CBP performs a security inspection immediately after a commercial vehicle enters the U.S. CBP has implemented the FAST program at most of the commercial border crossings with more than 87,000 drivers enrolled. The FAST program uses RFID technology and CBP has RFID readers at each primary inspection lane, and most of the tractors in the El Paso-Ciudad Juarez region have RFID tags. CBP has expressed interest in obtaining and using border crossing time information from a reliable and systematic procedure. However, CBP officials mentioned that readers could not be installed within the Federal Compound and that the information currently captured by the FAST program could not be shared for security reasons. City of Ciudad Juarez The Instituto Municipal de Investigación y Planeación (IMIP) performs planning activities in Ciudad Juarez. The IMIP has implemented a series of video cameras to monitor passenger-car congestion at the various border crossings in the region. The City of Ciudad Juarez and a local radio station had an agreement by which the radio stations could use the information from the camera system in exchange for maintaining the system. This agreement secures funding for the operation of the system. Radio Stations There are a couple of radio stations in Ciudad Juarez broadcasting the crossing times. Usually the messages are broadcast every 20 to 30 minutes. This is one of the major and most common media used by border commuters to track crossing times. One of the major disadvantages is that travelers cannot access the information in real time; travelers must wait until broadcasting occurs. The broadcast information details a reference landmark such as a monument, school or business where the queue ends, which non-commercial drivers can use to estimate the travel time from the particular landmark to the crossing line. Internet The empleos maquilas website ( posts available vacancies in the manufacturing industry in Ciudad Juarez. This website has a service estimating the approximate travel time at each international bridge. The web pages display a northbound view from the three POEs, estimated crossing time, and a reference landmark where the queue ends. This estimated travel time is based on the location of the end of the queue and previous experience of the observer. 21
24 Television The television companies on both sides of the border broadcast crossing times during the morning news and sporadically throughout the day. There is one local channel from a cable company that specifically broadcasts real-time border images from cameras located at each POE. These cameras are independent from the ones installed by IMIP. The dedicated channel shows current weather conditions and 15-second intervals of video from each bridge, although the channel does not estimate an approximate travel time; commuters use their own criteria to select the best crossing alternative. Cell Phones A local mobile phone company in Ciudad Juarez currently uses cellular phone text messages to distribute crossing times. Users send the word cruce (crossing) to the number and they will receive messages with the approximate crossing times for each of the POEs. This is one of the most promising technologies that can reach a wider range of users in real time. The estimated travel time received via cell phones is relatively similar to the travel time displayed by CBP authorities. Traveling Public The composition of travelers that cross from Ciudad Juarez to El Paso includes students (college and high school students), parents bringing children to school, workers, and business commuters. These travelers make frequent cross-border trips that vary widely and depend on several factors or seasonal effects such as school cycles, holidays, business and others. Accurate crossing time information will provide these stakeholders with data that will allow them to modify or adjust trip characteristics (selecting different routes and international crossings). 2.2 Pre-Trip Traveler Information Private travelers, freight shippers, and carriers use advanced traveler information, particularly pre-trip information, to plan a trip from origin to destination. Once the trip has started, travelers could use information to modify pre-determined routes to adjust to current and predicted travel conditions. Local media outlets relay pre-trip traveler information to the public through traditional means of radio and television. In addition to travelers, public and private agencies operating at the border also use border crossing information to monitor current conditions at and around border crossings for impromptu modification of resources to increase the efficiency of operation. For example, border wait times at international border crossings are relayed by the CBP, which also uses current crossing times to plan and manage its resources for efficient operation of inspection stations. Table 3 identifies stakeholders in the U.S.-Mexico region with needs for pre-trip traveler information as the information user and identifies if a stakeholder is currently producing the information as information producer or has capabilities to collect and produce real-time information in the future. 22
25 Table 3. Stakeholder Needs for Pre-Trip Traveler Information Stakeholder Traveler Information Producer Traveler Information User Bridge Operations Agencies Yes. Some bridge operators are toll collectors and have capabilities to collect volume of entering and exiting traffic in various temporal granularities. U.S. and Mexican County or Municipal Public Safety Agencies Yes. Some agencies have capabilities to relay location of incidents at and around border crossings. FMCSA No. No. U.S. and Mexican Freight Shippers, Private Commercial Carriers Yes. Some carriers have the capability to produce probe vehicle data using real-time tracking system on commercial vehicles crossing the border. U.S. and Mexican Local Media U.S. and Mexican Private Travelers U.S. and Mexican Regional Transit Providers U.S. State Department of Public Safety U.S. State Department of Transportation U.S. and Mexican Toll Operators U.S. Bureau of Transportation Statistics U.S. Customs and Border Protection U.S. Department of Homeland Security U.S. Emergency Management No. No. No. No. Yes. State DOTs relay location of road closures due to construction and major incidents, which could significantly affect trip time of commercial and private vehicles crossing the border. They may also collect data on state roadways around border crossings and can relay travel time, average speed to motorists. Toll operators have capabilities to collect volume of entering and exiting traffic. No. Yes. CBP relays current border crossing times of commercial vehicles, passenger vehicles, and pedestrians, number of inspection lanes open, and bridge closures. Yes. DHS relays threat level advisory, which has significant impact on pre-trip decision making of commercial vehicles crossing the border. No. 23 Yes. These agencies monitor incidents at border crossings and coordinate with law enforcement agencies. Yes. These agencies monitor incident locations around border crossings and monitor status of incident response. Yes. These agencies use border crossing times, incidents, bridge closures, current roadway condition etc. for pre-trip decision making. Yes. Local radio and TV stations relay crossing times and delay at the border, bridge closures, current roadway conditions, incident locations to public. Yes. Travelers use crossing times and delay at the border, bridge closures, and incidents at and around border crossings, current roadway conditions for pre-trip decision making. Yes. Transit providers use crossing times and delay at the border, incidents at and around border crossings, current roadway conditions for pre-trip decision making. Yes. DPS monitors and responds to major incidents on state highways. Yes. State DOTs monitor incidents and current traffic conditions and respond to traffic incidents on state highways around border crossings. Yes. Operators monitor incidents at border crossings and coordinate with law enforcement agencies. No. Yes. CBP monitors current and predicted border crossing times to manage inspection booths. No. Yes. These agencies monitor and respond to major incidents in and around border
26 Stakeholder Traveler Information Producer Traveler Information User Agencies crossings. U.S. General Services Administration No. U.S. and Mexican Municipal Government U.S. and Mexican Metropolitan Transportation Planning Organizations No. No. Yes, designing of future POEs or expansion of existing facilities requires traffic characteristics information. Based on meetings with stakeholders in the region, various types of pre-trip traveler information were identified. Figure 3 illustrates types of pre-trip travel information required by freight carriers and shippers, as well as private travelers. Depending on the type of pre-trip traveler information, not all agencies (listed in Table 3) use the same type of pre-trip traveler information. However, a border crossing information system should provide all types of pre-trip traveler information, as shown in Figure 4. No. No. 24
27 Current and Predicted Conditions of Highway Segments Current and Predicted Border Crossing Times Current and Predicted Travel Time of Segments Entering POE Predicted Travel Time Between Predefined O D Within the Region Pre Trip Traveler Information Current Bridge Closure Information Current Homeland Security Threat Level Incoming and Outgoing HAZMAT Location of Recent Roadway Incidents Figure 4. Types of Pre-Trip Traveler Information for Commercial and Private Travelers. O-D = Origin-Destination Table 4 describes specifications and requirements of individual types of pre-trip traveler information listed in Figure 4. From the list of pre-trip traveler information listed in Table 4, only current threat level, bridge closure information and location of recent roadway incidents are available. Chapter 5 of this report describes the development of a prototype BCIS, including development of a single-portal to access various types of pre-trip traveler information. Specifications and requirements of pre-trip traveler information data include frequency of information collection using traditional and Intelligent Transportation Systems (ITS) methods, relay frequency, and spatial granularities. U.S. and Mexican public agencies are limited to collecting and relaying only the data produced by them. Hence, only private agencies have the capability to integrate data from multiple agencies to produce fused pre-trip traveler information. Table 5 lists agencies that have capabilities or are mandated to collect and produce pre-trip traveler information 25
28 Type of Information Current and Predicted Border-crossing Times Current and Predicted Travel Time of Segments Entering POE Current Homeland Security Threat Level Current Bridge Closure Information Location of Recent Roadway Incidents Predicted Travel Time between Predefined O-D Incoming and Outgoing HAZMAT Current and Predicted Conditions of Highway Segments Table 4. Pre-Trip Traveler Information Specifications and Requirements Required Collection Frequency Instantaneous Averaged over Period of Less Than an Hour Required Display Frequency Hourly Less Than Hourly, Hourly Instantaneous Hourly Country Instantaneous Hourly Port of Entry Instantaneous Minutes Not Applicable Averaged over Period of Less Than an Hour Less Than Hourly, Hourly Required Spatial Granularities for Collection and Relay SENTRI and Non SENTRI Lanes, FAST and Non FAST Lanes, Pedestrian Lanes, Port of Entry FAST, Non FAST, Port of Entry Predetermined Origin and Destination Instantaneous Instantaneous Port of Entry Averaged over Period of Less Than an Hour Less Than Hourly Note: SENTRI = Secure Electronic Network for Travelers Rapid Inspection Type of Data Current and Predicted Border-crossing Times Current and Predicted Travel Time of Segments Entering POE Current Homeland Security Threat Level Current Bridge Closure Information Location of Recent Roadway Incidents Predicted Travel Time between Predefined O-D Incoming and Outgoing HAZMAT Current and Predicted Conditions of Highway Segments Highway Segments Table 5. Possible Producers of Pre-Trip Traveler Information Possible Information Producer Customs and Border Protection produce information on bridge closures and number of inspection lanes open. Private agencies, with capabilities to install ITS devices to collect crossing times at the border and obtain probe data from private vehicles and trucks, could fuse data from multiple sources to estimate and predict border crossing times. Private agencies, with capabilities to install ITS devices to collect crossing times at the border and obtain probe data from private vehicles and trucks, could fuse data from multiple sources to estimate and predict border crossing times. Department of Homeland Security. Private agency can extract data from DHS and fuse with other border crossing data. Customs and Border Protection. Private agency can extract data from CBP and fuse with other border crossing data. U.S. and Mexican law enforcement agencies. Private agency can extract data from local law enforcement agencies and fuse with other border crossing data. Private agencies, with capabilities to install ITS devices to collect crossing times at the border and obtain probe data from private vehicles and trucks, could fuse data from multiple sources to develop web-based functions to provide travel time estimates between origin and destination. Not clear which U.S. or Mexican agencies have the capability to provide HAZMAT information. State DOTs and municipal agencies can produce current and predicted highway conditions. 26
29 2.3 Archived Border Crossing Data Archived border crossing data is used by private and public agencies with responsibilities to plan, operate, and manage border crossing infrastructure. Private travelers, freight shippers, and carriers may use the archived data in limited scope. For example, algorithms to predict future conditions at border crossings require archived data, but are mostly used by an agency that is providing current and future traffic conditions at border crossings and surrounding roadways. Border-crossing and related data collected by ITS and traditional methods are archived in raw and aggregated format in a variety of temporal and spatial granularities. Archived data are then used by agencies, such as metropolitan planning organizations, city agencies, Customs and Border Protection and General Services Administration (GSA) to plan future infrastructure improvements and manage resources to operate border crossings efficiently. In addition to commercial and passenger vehicles, archived data related to pedestrian crossings and transit volume entering U.S. are valuable indicators of border crossing movement. Planning agencies attribute contributions to the local economy and social changes to border crossing movement and vice versa. These studies not only require volume of crossings, but also other external socioeconomic factors that affect border crossing movement. These external factors are currency exchange rate, local economy, major events, and other driving factors. Table 6 provides a list of stakeholders in the U.S.-Mexico region and identifies individual stakeholders as archived data producer or as archived data user. Table 6. Stakeholder Need for Archived Border Crossing Data Stakeholder Archived Data Producer Archived Data User Yes. These agencies can archive total number of passenger U.S. and Mexican Bridge vehicles crossing the border in Operators different temporal aggregation levels. U.S. and Mexican County or Municipal Public Safety Agencies No. U.S. FMCSA No. No. Yes. Carriers can develop U.S. and Mexican Freight capabilities to archive travel time Shippers, Private Commercial of trips between origin and Carriers destinations. U.S. and Mexican Local Media U.S. and Mexican Private Travelers U.S. and Mexican Regional Transit Providers U.S. State Department of Public Safety U.S. State Department of Transportation No. No. No. No. No. Yes. These agencies use border crossing volume trend data to manage, operate, and plan bridges and tolls. No. Yes. Carriers can monitor trends in border crossing times of commercial vehicles and other economic indicators for supply chain management. No. No. Yes. Transit providers use archived data to monitor trends in border crossing times and other demographics for market capture studies and service planning. No. No. 27
30 Stakeholder Archived Data Producer Archived Data User Yes. These agencies can archive total number of passenger U.S. and Mexican Toll vehicles crossing the border in Authorities different temporal aggregation levels. U.S. Bureau of Transportation Statistics U.S. Customs and Border Protection U.S. Department of Homeland Security U.S. Emergency Management Agencies U.S. General Services Administration U.S. and Mexican Municipal Government U.S. and Mexican Regional or Metropolitan Transportation Planning Organizations and Council of Governments Yes. BTS is mandated to collect and publish monthly volume of passenger vehicles, trucks, rails, pedestrians and buses entering U.S. from all international border crossings. Also produces commodity flow indicators. Yes. CBP collects and archives number of passenger vehicles, pedestrians, buses, trucks, and trains entering the U.S. and provides to other federal and state agencies. No. No. No. No. No. Yes. These agencies use border crossing volume trend data to manage, operate, and plan bridges and tolls. No. Yes. CBP uses trends in border crossing times and volume of commercial, passenger vehicles and pedestrians to manage and operate inspection facility at the border. No. No. Yes. GSA uses trends in border crossing times and volume of commercial vehicles, passenger vehicles, and pedestrians to manage and plan expansion of inspection facility at the border. Yes. Local governments use border crossing trends data and other socioeconomic indicators to estimate shortand long-term socioeconomic impact of border delays, and in some regions plan and operate bridge infrastructure. Yes. MPOs use border crossing trends data and other socioeconomic indicators to develop short- and long-range transportation plans for the border region. Based on meetings with stakeholders in the region, various types of archived border crossing data were identified. Figure 5 and Figure 6 illustrate types of archived border crossing data related to commercial and passenger vehicles required by various stakeholders, respectively. Depending on the type of data, not all agencies (listed in Table 6) use the same type of archived data. However, a border crossing information system should archive and provide all types of border crossing data. 28
31 Distribution of Ultimate Origin Destinations of Trucks Border Crossing Times Bridge Closure Information Number of Trips and Average Travel Time of Trips Within the Region Commercial Vehicle Related Archived Data North and Southbound Volume Travel Time of Segments Entering and Exiting POE HS Threat Level Volume of HAZMAT Containers North and Southbound Commodities Volume Figure 5. Types of Commercial Vehicle Related Archived Data. Note: HS Threat Level = Department of Homeland Security Threat Level Advisory 29
32 Border Crossing Time Travel Time of Segments Entering and Exiting POE Passenger Vehicle Related Archived Data Port of Entry Closure North and Southbound Volume Port of Entry Lane Closure Information Figure 6. Types of passenger vehicle related archived data Table 7 through Table 9 describes currently available border crossing-related border crossingrelated archived data from various agencies. Very limited data are archived and maintained by BTS and is available for for public through a website. None of the remaining border crossing data listed in abovementioned tables are archived in a centralized repository. Chapter 5 describes the development of a prototype BCIS, including archival processes of selected data types, including recreation of BTS provided archived data. 30
33 Table 7. Existing Scope and Availability of Archived Commercial Vehicle Data Type of Data Data Producer Data Scope North and Southbound Volume HAZMAT Travel Time of Segments Entering and Exiting POE Number of Trips and Average Travel Time of Trips Within the Region Distribution of Ultimate Origin-Destinations of Trucks Export and Import Value by Origin Port and Destination State Export and Import Volume by Origin Port and Destination State Import and Export Value by Commodity and Mode Bureau of Transportation Statistics Bureau of Transportation Statistics No agencies in either U.S. or MX collect these data No agencies in either U.S. or MX collect these data No agencies in either U.S. or MX collect these data Bureau of Transportation Statistics Bureau of Transportation Statistics Bureau of Transportation Statistics Only northbound monthly and yearly total data for each port of entry starting in 1994 Only northbound monthly and yearly total data for each port of entry starting in 1994 Not available Not available Not available Monthly and yearly total data for each port of entry starting in 1994 Monthly and yearly total data for each port of entry starting in 1994 Monthly and yearly total data for each port of entry starting in 1994 Data Collection and Exchange Mechanism Data can be downloaded from the BTS website Data can be downloaded from the BTS website Not available Not available Not available Data can be downloaded from the BTS website Data can be downloaded from the BTS website Data can be downloaded from the BTS website Table 8. Existing Scope and Availability of Passenger Vehicle Data Type of Data Current Data Producer Current Data Content North and Southbound Volume Travel Time of Segments Entering and Exiting POE Vehicle Occupancy Port of Entry Preference Length of Stay Frequency of Trips Bureau of Transportation Statistics No agencies in either U.S. or MX collect these data No agencies in either U.S. or MX collect these data No agencies in either U.S. or MX collect these data No agencies either in U.S. or MX collect these data No agencies either in U.S. or MX collect these data Only northbound monthly and yearly total data for each port of entry starting in 1994 Not available Not available Not available Not available Not available Data Collection and Exchange Mechanism Data can be downloaded from the BTS website Not available Not available Not available Not available Not available 31
34 Type of Data North and Southbound Volume Trip Purpose Frequency of Trips North and Southbound Volume North and Southbound Bus Passengers Table 9. Existing Scope and Availability of Transit and Pedestrian Data Current Data Producer Bureau of Transportation Statistics No agencies in either U.S. or MX collect these data No agencies in either U.S. or MX collect these data Bureau of Transportation Statistics Bureau of Transportation Statistics Current Data Content Only northbound monthly and yearly total data for each port of entry starting in 1994 Not available Not available Only northbound monthly and yearly total data for each port of entry starting in 1994 Only northbound monthly and yearly total data for each port of entry starting in 1994 Data Collection and Exchange Mechanism Data can be downloaded from the BTS website Not available Not available Data can be downloaded from the BTS website Data can be downloaded from the BTS website Table 10 through Table 14 describes specifications and requirements of individual types of archived border crossing data shown in Figure 5 and Figure 6. None of the border crossing data listed in abovementioned tables are archived in a centralized repository. Chapter 5 describes the development of a prototype BCIS, including archival processes of selected data types. Data specifications and requirements include measurement unit, required temporal and spatial granularities based on which data are archived in a centralized repository. U.S. and Mexican public agencies are limited to collecting and archiving only the data produced by them. Hence, only private agencies have the capability to integrate data from multiple agencies to produce fused border crossing related information. Table 10. Specification and Requirements for Archived Border Crossing Data Measurement Required Temporal Required Spatial Type of Data Unit Granularity Granularity Hourly Average (Raw SENTRI, Non SENTRI, Average), Daily Average, Border Crossing Times Minutes FAST, Non FAST, Pedestrian, Weekend Average, Port of Entry, City, State Weekday Average List of Occurrences, Annual Start and End Bridge Closure Total Number of Closures, Port of Entry, City, State Date Total Days of Closure HS Threat Level Type of Threat Daily National Weather (Temperature, Fahrenheit, miles, Hourly, Daily Average City Visibility, Precipitation) inches 32
35 Table 11. Specification and Requirements for Commercial Vehicle Related Archived Data Type of Data North and Southbound Volume HAZMAT Travel Time of Segments Entering and Exiting POE Number of Trips and Average Travel Time of Trips Within the Region Distribution of Ultimate Origin-Destinations of Trucks Export and Import Value by Origin Port and Destination State Export and Import Volume by Origin Port and Destination State Import and Export Value by Commodity and Mode Measurement Unit Volume Volume Segment Minutes Volume of Trips and Trip Time in Minutes Total Trips between Origin and Destination Temporal Granularity Hourly Total, Peak Hour Total, Off Peak Total, Daily Total, Weekend Total, Weekday Total, Monthly Total, Yearly Total Daily Total, Monthly Total, Yearly Total Hourly Average, Peak Hour Average, Off Peak Hour Average, Daily Average, Weekend Average, Weekday Average Hourly Average, Peak Hour Average, Off Peak Hour Average, Daily Average, Weekend Average, Weekday Average Annual Total of Trips between Ultimate Origin- Destination Spatial Granularity Containers, Trucks, Trains, Truck Containers, Rail Containers, Non FAST Trucks, Non FAST Trucks, Port of Entry, City, State Port of Entry, City, State Lane Type, Port of Entry, City, State Dollar Daily, Monthly Port of Entry Volume Daily, Monthly Port of Entry Dollar Daily, Monthly Port of Entry Predefined origin destinations Predefined origin destinations 33
36 Type of Data North and Southbound Volume Table 12. Specification and Requirements for Passenger Vehicle Related Data Travel Time of Segments Entering and Exiting POE Vehicle Occupancy Port of Entry Preference Frequency of Trips Measurement Unit Volume Segment Minutes Number of Occupants Average Preference Factor Average per Person Temporal Granularity Hourly Total, Peak Hour Total, Off Peak Total, Daily Total, Weekend Total, Weekday Total, Monthly Total, Yearly Total Hourly Average, Peak Hour Average, Off Peak Hour Average, Daily Average, Weekend Average, Weekday Average Hourly Average, Peak Hour Average, Off Peak Hour Average, Daily Average, Weekend Average, Weekday Average Hourly Average, Peak Hour Average, Off Peak Hour Average, Daily Average, Weekend Average, Weekday Average Monthly, Yearly Spatial Granularity SENTRI, Non SENTRI, Passengers in Person, Port of Entry, City, State SENTRI, Non SENTRI, Port of Entry, City SENTRI, Non SENTRI, Port of Entry, City Port of Entry, City City, State Type of Data North and Southbound Volume Frequency of Trips Table 13. Specification and Requirements for Pedestrian Related Data Measurement Unit Volume Average per Person Temporal Granularity Hourly Total, Peak Hour Total, Off Peak Total, Daily Total, Weekend Total, Weekday Total, Monthly Total, Yearly Total Monthly, Yearly Spatial Granularity Pedestrians, Port of Entry, City, State City, State Type of Data North and Southbound Volume North and Southbound Bus Passengers Table 14. Specification and Requirements for Transit Related Data Measurement Unit Volume Volume Temporal Granularity Hourly Total, Peak Hour Total, Off Peak Total, Daily Total, Weekend Total, Weekday Total, Monthly Total, Yearly Total Hourly Total, Peak Hour Total, Off Peak Total, Daily Total, Weekend Total, Weekday Total, Monthly Total, Yearly Total Spatial Granularity Bus Passengers, Buses, Train Passengers, Port of Entry, City, State Port of Entry, City, State 34


37 2.4 Centralized Repository of Archived Border Crossing Data The Bureau of Transportation Statistics (BTS) maintains a centralized repository of border crossing-related data, which can be accessed through a public-domain website. Except for BTS, none of the other agencies listed in Table 6 have published archived data in a public domain or have easy access to archived data. However, data available from BTS are highly aggregated (monthly and annual). For example, border wait times at ports of entry (collected by CBP) available from BTS are averaged monthly (2). From an operational standpoint, monthly averages of border wait times are not useful and lack information such as hourly fluctuations, etc. In addition, agencies such as metropolitan planning organizations that analyze the impact of border crossing trends to plan for short- and long-term infrastructure improvements require highly disaggregated border crossing data in terms of type of transportation modes, vehicle entry programs, etc. Highly aggregated data are not adequate for these agencies to understand hourly and daily border crossing trends at individual border crossings. A centralized repository of archived data would significantly reduce data redundancy, reduce data collection and storage cost, and increase efficiency of data retrieval. A centralized repository would also be responsible for maintaining and updating the data on behalf of all participating stakeholders. As illustrated in Figure 7, a border crossing information system should provide a centralized repository of archived data and enhance the data by aggregating in different spatial and temporal granularity. In addition, users can obtain archived data from a single repository instead of multiple agencies, thereby reducing overall cost and increasing efficiency of data retrieval. Figure 7. Centralized Repository of Archived Border Crossing Data. 35

38 2.5 Single Portal to Access Pre-Trip Traveler Information In addition to previously mentioned archived data needs, stakeholders also need efficient methods to access and retrieve pre-trip traveler information. For example, freight shippers and operators have to access CBP s website to obtain current wait time and delay at border crossings. Incidents on roadways in the El Paso region have to be accessed from the city s website and traffic conditions on state highways and interstates have to be accessed on TxDOT s website. As a traveler (commercial or private), obtaining pre-trip information from multiple sources at the same time is inefficient. In addition, border wait times provided by the CBP are unreliable because of the unscientific method of data collection. There are several methods whereby pre-trip traveler information can be pushed to travelers before leaving the point of origin and while en-route to a destination. This provides travelers with capabilities to choose between border crossings to reduce the overall trip time. Travelers not only use border crossing information, but also information regarding highway and arterial traffic conditions, such as major incidents and lane closures, which could severely impact the overall travel time between origin and destination. At present, freight operators as well as private travelers have to access multiple agency websites to obtain pre-trip travel conditions, as illustrated by Figure 8. From a user s perspective, the most efficient method of accessing all multi-modal advanced traveler information is through one single source rather than from multiple sources or agency websites, as illustrated in Figure 9. Figure 8. Current flow of pre-trip traveler information between stakeholders. 36
.")

39 Figure 9. Single window pre-trip traveler information. Evaluation of traveler information services has shown benefits in improved on-time reliability, better trip planning, and reduced early and late arrivals (3). However, for motorists and freight operators entering the U.S., incorporating border crossing time in day-to-day pre-trip planning is difficult, mostly due to unreliable crossing times reported by CBP. A single window pre-trip traveler information system should also include methods to provide pre-trip border crossing information to motorists and freight operators to estimate overall origin-destination travel time. While en-route, travelers can obtain information regarding traffic condition at border crossings is from local radio stations only. A BCIS should explore and develop alternative methods by which border crossing information can be pushed to motorists and freight operators through personal mobile devices or the travelers can pull the information from the BCIS at the convenience of motorists and freight operators. 2.6 Border Crossing Performance Measures The focus on the border transportation system has identified the possibility of collecting border crossing time-related data to support a set of performance measures and ultimately a performance management process for evaluating and improving international border crossings for freight as well as passenger movement. A set of travel time related performance measures has to be identified for both freight and passenger movement, which would be a basis for establishing common indices to compare performances of border crossings throughout the U.S.- Mexico and U.S.-Canada border, irrespective of characteristics of individual crossings. Such performance measures should be applied to compare border crossing performance nationally, take into account local operation of crossings, derive from a system to provide travel time information to travelers and shippers, 37
40 apply archived travel time data and travel time reliability information, consider causal data that explains the differences in travel time, and reflect changes in operating practices and infrastructure at individual crossings. The following are the goals and objectives for implementing border performance measures: Provide all stakeholder agencies and users with information to assist their operations and make appropriate decisions; Establish a common denominator to estimate the effect of improvements and modifications in operation of border crossings; and Establish indices of performance measure, which can be easily communicated with a non-technical audience and still find the information relevant. The unique elements of the border crossing system mean that the performance measure must satisfy the typical measurement requirements as well as several factors, as described earlier. Given the wide range and diversity of available measures, it is important to have a clear basis for assessing and comparing border crossing performance measures. However, collection and estimation of border crossing performance measurement indices should consider the following: Performance measures should be calculated from operational and policy data that are collected as part of daily operations; Performance measures should be consistent with the procedures used by all three countries at the international border; The levels of performance are perceived differently by shippers, manufacturers, crossing operators and the inspection agencies. It is important that the statistics are relevant for the variety of audiences. This will require that the measurement base lines or comparison standards be evident or easily communicated; Changes in designs, demand, and operating procedures at individual border crossings should be reflected in the performance measure; and Estimation of performance measures should be independent of the data collection technology used to collect travel time related parameters. A tentative list of performance indices are presented below with brief descriptions of how each index is supposed to capture performance of border crossings. It is important to understand that one index cannot explain the performance of all border crossings. Travel Time: The basic element of border crossing performance measurement system is the travel time of roadway segments while entering, crossing, and exiting individual border crossings. From an agency perspective, these data represent the performance of the border crossing system. From public and freight operator perspectives, this travel time is a part of the overall door to door trip time between origin and destination. Base Travel Time: The comparison of travel time between border crossings cannot be accomplished by measuring travel time of segments and comparing travel times to cross the international border. This is because not all border crossings have the same demand and physical characteristics. Hence, a common base line has to be established to define acceptable or base 38
41 condition unique for a particular border crossing. Hence, delay at a border can be estimated by differentiating base travel time from the current travel time. Border Crossing Index: Border-crossing Index is a dimensionless quantity that compares travel time during peak periods to travel time during off-peak conditions. For example, a BCI of 1.20 would indicate that a trip that takes 20 minutes to cross the border during off-peak periods would take 24 minutes during the peak period (20 percent longer). The BCI reflects travelers perceptions of travel time while crossing the border. Buffer Index: Freight shippers and manufacturers are also concerned about travel time variability (the variation in travel time) and reliability (which relates to reaching destinations at expected times). Longer travel times are an important issue, but the assembly process can be adjusted to accommodate them; it is more difficult to accommodate variable travel times. These impacts may be more varied and require automated data collection mechanisms. As more extensive operating and monitoring mechanisms are deployed, reliability and variability statistics should be collected to assist local operators and shippers. The Buffer Index is a measure of trip reliability that expresses the amount of extra buffer time needed to be on time for 95 percent of the trips (e.g., a late shipment on one day per month). The Buffer Index can be calculated for each segment or particular system element. Border Planning Index: Border Planning Index (BPI) is the total travel time that should be planned for crossing a border when an adequate buffer time is included. BPI can be used in an index form to improve the ability to compare across a range of routes and conditions. The Border Planning Index differs from the Buffer Index in that it includes typical delay as well as unexpected delay. Thus, the Border Planning Time Index compares border crossing times during near-worst condition to off-peak conditions. For example, BPI of 1.60 means that, for a 20- minute trip during off-peak period, the total time that should be planned for the trip is 32 minutes (20 minutes 1.60 = 32 minutes). The Border Planning Time Index is useful because it can be directly compared to the Border-crossing Index on similar numeric scales. The Border Planning Time Index is computed as the 95th percentile of border crossing time divided by travel time during off-peak condition. Total Delay: Total Delay at individual border crossing can be expressed as a summation of delay (current travel time minus travel time during off-peak conditions) for each truck or passenger vehicle. Hence, total delay can be expressed either as truck-hours or as vehicle-hours. Total delay in a system is calculated as the sum of individual segment delays, and this could include any of the several links in the border crossing chain of events. Delay per Vehicle: The amount of extra time spent by a truck or a passenger vehicle while crossing the border can be useful in communicating to non-technical audiences. Delay per vehicle is estimated by dividing the total delay by number of vehicles during the same time. This normalizes the total delay value and is important to compare delay at border crossings. Based on the understanding of each performance index, Table 15 provides specifications and requirements of individual performance indices in terms of required temporal and spatial granularity. 39
42 Table 15. Specification and Requirements for Border Crossing Performance-Measure Data Type of Data Total Delay Delay per Vehicle Border-crossing Index Border Planning Index Buffer Index Measurement Unit Vehicle-Hours Minutes/Hours Ratio Ratio Ratio Temporal Granularity Hourly Total, Daily Total, Monthly Total, Yearly Total Hourly Total, Daily Total, Monthly Total, Yearly Total Hourly, Daily Average, Monthly Average, Yearly Average Hourly, Daily Average, Monthly Average, Yearly Average Hourly, Daily Average, Monthly Average, Yearly Average Spatial Granularity Lane Type, Port of Entry Lane Type, Port of Entry Lane Type, Port of Entry Lane Type, Port of Entry Lane Type, Port of Entry 2.7 External Economic Indicators Data Local and national economic conditions significantly affect the volume of border crossings (passenger vehicles, commercial vehicles, and pedestrians). Individual choice decisions to cross the border are affected by currency exchange rates, local commodity price, and employment opportunities; while commercial truck volumes are affected by exchange rates, trade opportunities, gross domestic products, etc. Indicators that represent these economic trends can be used to forecast border crossings, which can then be applied for planning and policy level decisions. Impact on commuters because of higher delay affects the access to labor pool by employers (4) and hence, change in local labor market. In addition, passenger vehicles affect consumption at the destination, which is affected by the currency exchange rate. In the case of commercial vehicles, delay at the border increases cost of distance related expenses, impact on just-in-time delivery of goods and services, and impact on the overall supply-chain of manufactured goods to markets. The affects of commercial border crossing volumes (both directions) due to change in U.S. gross domestic product (GDP), Canadian GDP, currency exchange rates, and value of Canadian trade were significant in a study performed for the U.S.-Canada border; while the currency exchange rate was found to have a significant effect on passenger border crossings in both directions (5). Table 16. Specification and Requirements for Economic Indicator Data Type of Data Measurement Unit Temporal Granularity Spatial Granularity Currency Exchange Rate Ratio Daily Country Commodity Price Dollars Monthly Average City 40
43 2.8 Data Analysis for Planning and Research Archived border crossing data can be applied in operations, planning, and management of border crossing-related infrastructure as well as in short- and long-term planning. Border-crossing related data also provide insights into social and economic development of surrounding communities and regions. Using data mining applications, archived border crossing information and other related variables (economic indicators, weather, trade volume, etc.), hidden relationships between variables can be revealed. The extent to which changes in economic activity, relative prices, and exchange rates impact merchandise trade flows play an important role in border economics. Hence, the following sections describe some of the applications of archived data in understanding external factors that influence cross-border transportation, local and regional socioeconomics. Fullerton and Tinajero (2002) studied analysis of empirical regularities associated with monthly cargo vehicle flows from Ciudad Juarez, Chihuahua, in Mexico to El Paso, Texas, USA (6). The study was conducted using time series data that characterized the behavior of international trucking through border crossings in the El Paso region. The functions estimated in this study involved several independent variables used as exogenous variables. Monthly maquiladora (manufacturing) employment estimates for Ciudad Juarez are employed as a proxy for this source of demand. To account for local business conditions, monthly total nonagricultural employment for El Paso was selected as an economic variable. Fullerton et al. (2003) performed a study to examine the possibility of successfully modeling cross-border trade flows and analyze the merchandise trade growth between the two cities in the El Paso region (7). Data for this research were obtained using the publication North American Transborder Freight Data ( from the U.S. Department of Transportation Bureau of Transportation Statistics. This publication reports the number of exports and imports of merchandise trade through the El Paso customs district to Mexico on a monthly basis. The authors also used the monthly peso/dollar exchange rate, wholesale price index, as well as the industrial production index published by the International Monetary Fund ( The IBI Group (2008) developed modeling tools to forecast demand for determining need and location for a new crossing in the Detroit-Windsor region (8). Annual northbound and southbound passenger and commercial vehicle volume (from 1972 to 2007) was used to understand the traffic volume trends. In addition to passenger vehicle volume, the study also analyzed change in gross-domestic product of U.S. and Canada, value of Canadian dollar, value of U.S. dollar, fuel price, and 24-hour origin-destination travel surveys, travel time surveysc. Goodchild (2008) analyzed the characteristics and influence of border operations, especially delay at the Western Cascadia border, on regional supply chain. The study analyzed daily 41
44 average delays for commercial vehicles and found that typical delays are not problematic for trucks enrolled in CBP s FAST program. Fitzroy et al. (2008) performed a study to determine the economic consequences of delay at the U.S.-Canada border, including impacts at specific border facilities or regions, macroeconomic effects for entire border, and impacts of policy alternatives (9). The researchers utilized the travel time and variability costs, the operating costs (fuel, capital, maintenance, labor, etc.), as well as the administrative costs. For the cost effect, the key variables directly affected were identified as the passenger (commute, leisure, on the clock), the freight carriers (own-account, for-hire, common carriers), and the freight shippers (bulk, mixed freight, small package, JIT firms). As per the possible responses to costs, the study involved the vehicle (mode/ route/ timeof-day), the firm (inventory management/production technology/site location), and the household (tourism, employment, residential location) information. 2.9 Innovative Methods of Collecting Border Crossing Data Border wait times at the U.S.-Mexico border are collected by the CBP using visual methods and interview of motorists at the international bridge. This data collection method misrepresents the actual wait times of passenger and commercial vehicles, which in reality begin at the start of the queue in Mexico. Due to jurisdictional limitations of CBP to collect wait times on the Mexican side of the international border, and the inability of Mexican authorities due to lack of funding, all along the U.S.-Mexican border scientific methods of collecting border wait times have not been implemented. Several pilot projects have been planned to deploy vehicle identification technologies, including RFID, Bluetooth, License Plate Recognition, and measure accurate border wait times. A project is being funded by the Federal Highway Administration (FHWA) to deploy RFID to measure wait times of commercial vehicles at the Bridge of the Americas in El Paso, Texas. CBP posts current wait times at all ports of entry on its public domain website. CBP does not have an online subscription process to send data to users and external agencies. Using multinational efforts, scientific data collection methods, such as RFID, Bluetooth technologies can be deployed to measure the actual length of queue and border wait times. Data collected can be relayed using Real Simple Syndication (RSS) or using point to point transfer techniques between data producer and users. RSS is a family of web feed formats used to publish frequently updated works, such as blog entries and news headlines in a standardized format. An RSS document includes full or summarized text and metadata in the form of extended markup language (XML) file format. Users can either subscribe or connect to the RSS s internet address to obtain timely updates from the data source. RSS is widely used by news organizations for readers to subscribe to current events and news. CBP also updates its website regarding closure of a port of entry. Bridge closure could be part of the border crossing times RSS. DHS has a RSS service that is updated daily through which external sources can retrieve current threat level. In early April 2008, CBP met with FHWA to discuss current initiatives on standardizing wait time measurement methods and determine procedures for expanding port of entry technologies to monitor wait times at the border. Crossing times at the U.S.-Mexico border are collected by CBP 42
45 using manual survey of motorists waiting to enter the U.S. Stakeholders and even CBP have expressed concerns about the accuracy of such a method. Hence, CBP has outlined the following objectives toward development of a border crossing time measurement system (10): Develop standards and implement a system that would enable crossing times to be measured more easily and precisely. Deploy a technology to accurately monitor and measure the time required for passenger and commercial vehicles to traverse the crossing. Collect a base line dataset for cross-border travel times for planning and policy applications. Tie measurements to distribution solution: U.S. Department of Transportation Traffic Management Centers, variable message signs, web sites, radio, etc. FHWA is conducting various projects designed to quantify crossing and delay times at major U.S. land ports of entry between Canada and Mexico. Current studies undertaken by FHWA are focused on measuring border delays and crossing time for freight traffic. CBP hopes to align with FHWA and Canadian and Mexican counterparts to identify and develop a technology that can be applied to measure border crossing times of passenger vehicles. The Texas Transportation Institute, along with its partner agencies is assisting FHWA in identifying technologies to measure commercial vehicle crossing times and is deploying Radio Frequency Identification technology at two international crossings along the U.S.-Mexico border. With an objective to identify cheaper technology, TTI funded an experiment to use Bluetooth signal detection technology to measure passenger vehicle crossing times at three border crossings in the El Paso area (11). The enhanced border crossing information should provide platform and framework to integrate newer technologies to measure crossing times and other border related data. A clear statement of requirements that meets stakeholder needs is crucial in designing a concept of operations for the proposed system. It is also important to make sure that all relevant stakeholders are impacted by the proposed system. Stakeholder needs have been broadly categorized into pre-trip traveler information and archived border crossing information. In terms of pre-trip traveler information, stakeholders require efficient mechanisms to obtain border crossing-related information as well as current information around border crossings, such as location of major incidents, lane closures, travel speeds, weather conditions, etc. Hence, any border crossing information system should be able to provide a much broader range of travel related information and not be limited to border crossings only. It is important to note that the archived data should not be limited to the data collected by ITS at the border, but should also include data collected using intercept survey and other traditional methods. Stakeholders in the U.S.-Mexico region have also identified a need for efficient mechanisms to archive and retrieve data and be able to pull and push information. From the perspective of stakeholders, an efficient border crossing information system should include the following services and components: A broad range of pre-trip traveler information related to border crossings and beyond, which could influence traveler s overall trip time. An archive of border crossing data including real-time data collected using ITS and other traditional data collection methods. 43
46 A centralized repository of archived data through which border crossing information can be retrieved for planning, operations, and decision making. A single portal to relay pre-trip traveler information to pull and push the information to private and commercial vehicle operators. Methodologies to measure and compare performance of border crossings. A centralized repository of external indicator data that is known to influence the flow of passengers and vehicles across the border. Ability to perform simple and complex data analysis over archived data for planning and research purposes. Efficient and innovative methods to gather border crossing data, most importantly crossing times of commercial and private vehicles. 44
47 Chapter 3. Information System Requirements 3.1 Functional Scope The Border Crossing Information System (BCIS) should be designed to provide pre-trip travel information service for travelers and freight operators to access a wide range of real-time travel information related to border crossings, including information on road network conditions, border crossing information, incidents, weather, and transit services. Based on this information, travelers can select the best departure time, route and modes of travel, or perhaps decide not to make the trip at all. BCIS should also provide archived border crossing data for stakeholder agencies through a centralized repository and provide services to analyze and query the archived data. The archived border crossing data should include all relevant ITS data related to border crossings for planning, safety, operations, and research. In border regions, motorists and commercial vehicle operators have to access several different sources to gather pre-trip travel information, due to lack of a single window of information. For example, a commercial vehicle operator would like to have information on current border wait times on one or more than one bridge, threat level advisory, and location of incidents and traffic conditions. Because these three sets of information are produced and relayed by different agencies (U.S. Customs and Border Protection, U.S. Department of Homeland Security and U.S. State Department of Transportation or Municipal Traffic Management Center, respectively), a traveler has to access three different websites to gather the information that could significantly affect travel times between origin and destinations. In addition to pre-trip traveler information and archived border crossing data service, BCIS should also develop methodologies to compare performances of border crossings and provide services to perform complex analysis of data for planning, operation, and research purposes. BCIS should also provide a platform and environment to collect ITS data at the border. Hence, objectives of BCIS should be derived from abovementioned stakeholder needs. 3.2 Assumptions and Constraints A successful implementation of BCIS depends on existence of a formal data exchange mechanisms between the BCIS and data producing agencies (federal/state/local agencies and private data producers). This is will provide BCIS a reliable source of border crossing data, which can then be converted into information and archived efficiently. This also requires data producers be committed to providing the raw data to BCIS and recognize the necessity to do so. In the absence of the formal data exchange mechanisms, the agency might have to resort to alternative processes to extract information from data producers, which may not be efficient and reliable. Implementation of BCIS also raises the need to collect and archived border crossingrelated data such as hourly and daily volume of incoming passenger vehicles, which is not available in public domain. Hourly and daily data will open up possibilities to analyze border crossing data at an operational level instead of planning level. 45
48 It is assumed that BCIS will be integrated (or share data constantly) with systems that collect raw data at borders, such as passenger and commercial vehicle crossing times. The prototype BCIS, described in Chapter 5, is integrated to a system being developed by FHWA (with Battelle and TTI), which utilizes radio frequency identification technology to measure crossing times of commercial vehicles at Bridge of the Americas in El Paso, Texas. The BCIS will then aggregate the raw data, archive the data and establish a relationship with other border crossing data (such as number of inspection lanes open) for cross-tabular analysis and data mining. Because BCIS may not produce the entire set of real-time and aggregated border crossing data, it has to rely on commitment from agencies to distribute data either through the formal exchange mechanisms or by sharing the data through public domain repositories. Some of the practical constraints of extracting border crossing data while implementing a prototype BCIS are discussed in this document. 3.3 Mapping Stakeholder Needs to BIFA The Border Information Flow Architecture supports the planning, development, and implementation of ITS and other technology-based solutions at the U.S.-Canada border. BIFA identifies agencies at or near the border and mapping information flows between them. A key feature of BIFA is that its definition of ITS projects includes technologies used by nontransportation stakeholders such as U.S. and Canadian customs agencies. Even though the current version of BIFA ( supports ITS architecture for border regions in U.S. and Canada, information from the architecture can be easily applied to the U.S.-Mexico border regions. In addition to BIFA, the National ITS Architecture (12) has also been used to obtain appropriate user services and functional requirements necessary for BCIS. The BIFA can be used to categorize services to be provided by the BCIS. The architecture includes two main user services, which are archived data management service and pre-trip traveler information service, as shown in Figure 10. These user services include a variety of equipment packages appropriate for the implementation of border crossing information system. Providing these user services and equipment packages are considered as high-level functional requirements. Subsequent sections describe low-level functional requirements and data specifications under individual equipment packages. 46
49 Border Crossing Information System Archived Data Management Service Pre Trip Traveler Information Service ITS Data Repository Traffic and Roadside Data Archival Online Analysis and Mining ISP Traveler Data Collection Basic Information Broadcast Interactive Information Personal Basic Information Reception Figure 10. BIFA Equipment Packages to be Provided by the Border Crossing Information System. 3.4 High-Level Functional Requirements Functional requirements specify what a system must do. Statements to define functional requirements should use formal shall language and specify a function in terms that the stakeholders, particularly the system implementers, will understand. In the National ITS Architecture, functional requirements have been defined for each equipment package that focus on the high-level requirements that support regional integration. The high-level functional requirements consist of several user service and corresponding equipment packages that are relevant to any border crossing information system. These services and equipment packages are extracted from the National ITS Architecture. User services document what the system should do from the user s perspective. The system considers mainly two primary groups of users. The first group consists of motorists and freight carriers that use pre-trip traveler information services. The second group consists of planners and decision makers that use archived mobility data for planning, design and decision making. User services, including the corresponding user service requirements were derived from the National ITS Architecture. Equipment Packages group similar processes of a particular subsystem together into an implementable package. The grouping also takes into account the user services and the need to accommodate various levels of functionality. A list of user services and equipment packages that are relevant to the border crossing information system is provided in Table
50 Service Archived Data Management Pre-Trip Traveler Information Table 17. List of User Services and Equipment Packages National ITS Architecture Equipment Package ITS Data Repository Traffic and Roadside Data Archival On-Line Analysis and Mining ISP Traveler Data Collection Basic Information Broadcast Interactive Infrastructure Information Personal Basic Information Reception Adapted from National ITS Architecture (2006) Requirements Collect and maintain data and data catalogs from one or more data sources. May include quality checks, error notification, and archive coordination. Collect and archive traffic and environmental information directly from the roadside for use in off-line planning, research, and analysis. Provide advanced data analysis and mining features to support discovery of information, patterns, and correlations in large archives. Collect traveler information from other centers, consolidate and refine the collected data, and make these data available to traveler information applications. Collect, process, store, and broadcast traffic, transit, maintenance and construction, border crossing information, event, and weather information to traveler interface systems. Collect, process, store, and disseminate personalized traffic, transit, maintenance and construction, border crossing information, event, and weather information to traveler interface systems upon request. Provide personal traveler interface that provides formatted traffic advisories, transit, border crossing information, special events, and other traveler information, as well as broadcast alerts. Devices include personal computers and personal communication devices such as mobile phones. 3.5 Low-Level Functional Requirements The low-level functional requirements consist of specific and detail functions under individual equipment packages. Table 18 through Table 24 provides lists of specific functions that should be provided by the BCIS. These specific functions are adapted from the Border Information Flow Architecture as well as National ITS Architecture and are self-explanatory. Since functions in BIFA and National ITS Architecture refer to center to represent implementation agencies and traffic management centers, individual functional requirement has been described by using the phrase the center shall.. Hence, readers should not be confused with the use of the phrase, which means an agency implementing the border crossing information system. Table 18. Functional Requirements of ITS Data Repository Equipment Package ID Functional Requirement 1 The center shall collect data to be archived from one or more data sources. The center shall collect data catalogs from one or more data sources. A catalog describes the data contained in the collection of archived data and may include descriptions of the schema or structure of 2 the data, a description of the contents of the data; e.g., time range of entries, number of entries; or a sample of the data. The center shall store the archived data in a focused repository that is suited to a particular set of data 3 users. 4 The center shall include capabilities for performing quality checks on the incoming archived data. 48
51 ID Functional Requirement 5 The center shall include capabilities for error notification on the incoming archived data. 6 The center shall include capabilities for archive-to-archive coordination. The center shall support a broad range of archived data management implementations, ranging from simple data marts that collect a focused set of data and serve a particular user community to large-scale 7 data warehouses that collect, integrate, and summarize transportation data from multiple sources and serve a broad array of users within a region. 8 The center shall perform quality checks on received data. The center shall provide the capability to execute methods on the incoming data such as cleansing, 9 summarizations, aggregations, or transformations applied to the data before storing in the archive. The center shall respond to requests from the administrator interface function to maintain the archive 10 data. When data or a catalog of data are received from the archive, the center shall generate the requested data 11 product for the user s systems. Note: The column ID represents identification numbers of functions requirements in the BIFA. Adapted from Border Information Flow Architecture (2005) and National ITS Architecture (2006) Table 19. Functional Requirements of Traffic and Roadside Data Archival ID Functional Requirement The center shall manage the collection of archive data directly from collection equipment located at the 1 roadside. 2 The center shall collect traffic sensor information from roadside devices. The center shall respond to requests from the Archive Data Administer to input the parameters that 3 control the collection process. The center shall send the request for data and control parameters to the field equipment where the 4 information is collected and returned. 5 The center shall record the status about the imported traffic and roadside data. 6 The center shall use the status information to adjust the collection of traffic and roadside data. Adapted from Border Information Flow Architecture (2005) and National ITS Architecture (2006) 49
52 Table 20. Functional Requirements of On-Line Analysis and Mining Equipment Package ID Functional Requirement The center shall support the interface with Archive Data User Systems for requests for analysis of the 1 archive data. The center shall provide the capability to perform activities such as data mining, data fusion, summarizations, aggregations, and recreation from archive data. This may include multidimensional 2 analysis, selective summarization and expansion of data details, and many other advanced analysis services. The center shall receive the user s systems requests and develop the request to retrieve the data from the 3 archive. The center shall respond to user s systems requests for a catalog of archived data analysis products 4 available. For archive analysis and data mining products requiring financial payment, the center shall process the 5 financial requests and manage an interface to a Financial Institution. Adapted from Border Information Flow Architecture (2005) and National ITS Architecture (2006) Table 21. Functional Requirements of ISP Traveler Data Collection ID Functional Requirement The center shall collect, process, and store traffic and highway condition information, including incident 1 information, detours and road closures, event information, recommended routes, and current speeds on specific routes. The center shall collect, process, and store maintenance and construction information, including 2 scheduled maintenance and construction work activities and work zone activities. 3 The center shall collect, process, and store weather information. 4 The center shall collect, process, and store event information. The center shall collect, process, and store traffic and highway condition information, including incident 5 information, detours and road closures, event information, recommended routes, current speeds on specific routes, and border queues and wait times. Adapted from Border Information Flow Architecture (2005) and National ITS Architecture (2006) Table 22. Functional Requirements of Basic Information Broadcast Equipment Package ID Functional Requirement The center shall collect, process, store, and disseminate traffic and highway condition information to 1 travelers, including incident information, detours and road closures, event information, recommended routes, and current speeds on specific routes. The center shall collect, process, store, and disseminate maintenance and construction information to 2 travelers, including scheduled maintenance and construction work activities and work zone activities. The center shall collect, process, store, and disseminate transit routes and schedules, transit transfer 3 options, transit fares, and real-time schedule adherence information to travelers. 4 The center shall collect, process, store, and disseminate weather information to travelers. 5 The center shall collect, process, store, and disseminate event information to travelers. 6 The center shall provide the capability to support requests from the media for traffic and incident data. The center shall provide the capability for a system operator to control the type and update frequency of 7 broadcast traveler information. The center shall collect, process, store, and disseminate traffic and highway condition information to 8 travelers, including incident information, detours and road closures, event information, recommended routes, current speeds on specific routes, and border queues and wait times. Adapted from Border Information Flow Architecture (2005) and National ITS Architecture (2006) 50
53 Table 23. Functional Requirements of Interactive Infrastructure Information Equipment Package ID Functional Requirement The center shall collect, process, store, and disseminate customized traffic and highway condition 1 information to travelers, including incident information, detours and road closures, recommended routes, and current speeds on specific routes upon request. The center shall collect, process, store, and disseminate customized maintenance and construction 2 information to travelers, including scheduled maintenance and construction work activities and work zone activities upon request. The center shall collect, process, store, and disseminate customized weather information to travelers 6 upon request. The center shall collect, process, store, and disseminate customized event information to travelers upon 8 request. The center shall collect, process, store, and disseminate customized air quality information to travelers 9 upon request. The center shall provide all traveler information based on the traveler s current location or a specific 10 location identified by the traveler, and filter or customize the provided information accordingly. The center shall accept traveler profiles for determining the type of personalized data to send to the 11 traveler. The center shall provide the capability to exchange information with another traveler information service 14 provider current or predicted data for road links that are outside the area served by the local supplier. The center shall manage updates of digitized map data and provide updates to traveler interface systems 15 upon request. 16 The center shall provide the capability to support requests from the media for traffic and incident data. The center shall provide the capability for a system operator to control the type and update frequency of 17 traveler information. Adapted from Border Information Flow Architecture (2005) and National ITS Architecture (2006) Table 24. Functional Requirements of Personal Basic Information Reception Equipment Package ID Functional Requirement The personal traveler interface shall receive traffic information from a center and present it to the 1 traveler. 2 The personal traveler interface shall receive event information from a center and present it to the traveler. The personal traveler interface shall provide the capability for digitized map data to act as the 3 background to the information presented to the traveler. 4 The personal traveler interface shall support traveler input in audio or manual form. The personal traveler interface shall present information to the traveler in audible or visual forms, 5 consistent with a personal device. Adapted from Border Information Flow Architecture (2005) and National ITS Architecture (2006) 51
54 Chapter 4. Information System Design and Implementation 4.1 Background The scope of the prototype border crossing information was limited to development of a conceptual framework for an enhanced border crossing information system and a working prototype with selected functions requirements. A full-scale design and implementation of enhanced border crossing information system requires a much larger resource. The prototype was developed by using the Paso Del Norte Regional Mobility Information System (PDN-RMIS) as the platform. This reduced the need for the development of a separate database and other necessary front and back end applications and processes for the prototype. PDN-RMIS already includes necessary information infrastructure to archive a wide range of transportation related data and to relay pre-trip traveler information. Border-crossing related archived data and pre-trip traveler information were seamlessly integrated with the PDN-RMIS. This facilitated the integration of non-border crossing related transportation data with border crossing data. Similarly, border crossing-related pre-trip traveler information was added to the existing website developed as part of the PDN-RMIS that provides traffic information in the El Paso region. Hence, travelers commuting between U.S. and Mexico have access to pre-trip travel information through a single portal rather than multiple agency websites. PDN-RMIS was designed to be a highly flexible and scalable system to add data similar in scope with the mobility data. Hence, data collected as part of the border crossing information was easily integrated to the existing PDN-RMIS database. In addition, existing business processes were also replicated. These processes were developed to filter, aggregate, geo-code, and process individual tables in the database. Access to BCIS data will be provided by adding web-based reports to the existing PDN-RMIS website. This reduces a significant amount of design and development of the prototype BCIS. 4.2 Objectives and Scope of the Prototype The scope of this research was to develop a working prototype system, including development of pre-trip traveler information and archived border crossing data. These services include pre-trip traveler information and archived data management of border crossing-related information for the El Paso region. Pre-trip traveler information includes collection and distribution of real-time traffic conditions in addition to current conditions of border crossings for commercial vehicle operators, motorists, pedestrians, and buses entering the United States. The objectives of developing a prototype BCIS are the following: Identify components necessary for the implementation of enhanced border crossing information system. Demonstrate benefits of implementing an information system with centralized repository of border crossing-related archived data. 52
55 Demonstrate benefits of implementing an information system to relay pre-trip traveler information at the border through a single window (website). Demonstrate benefits of integrating border crossing information with the overall mobility information (especially for border regions). The above objectives were achieved by developing a working prototype of an enhanced border crossing information system. Chapter 4 describes functions of a fully-fledged BCIS based on stakeholder needs of agencies in the border region. The prototype BCIS, however, includes design and implementation of selected functions and capabilities. The scope of individual functions and capabilities implemented in the prototype is listed in Table 25. The prototype also includes limited border crossing-related archived and pre-trip traveler information data. Table 25. Scope of the Prototype BCIS and List of Functions and Capabilities Function and Capabilities Develop a single portal to access all archived border crossing-related data. Develop a central repository and a warehouse to store border crossing data. Provide data in a variety of temporal and spatial aggregation levels for planning, management, and operation of border crossing infrastructure. Provide web-based tools to analyze the data, including cross-table and other statistical analysis. Perform data mining to understand the impact of border crossing times on local and regional economy and vice versa. Provide border crossing and other data in raw and aggregated forms. Provide a single portal to relay pre-trip traveler information including current border crossing information. Scope This was achieved by adding web pages (to query and access border crossing data) to web pages designed to access mobility information developed as part of the PDN- RMIS. Hence, users can the access the archived border crossing and mobility data. This was achieved by storing all border crossing-related data in a single relational database in the data warehouse framework. The prototype includes limited categories of border crossing data aggregated at various temporal and spatial levels for ports of entry in the El Paso region. The prototype does not include web-based tools to analyze cross-tabular data. However, the database implementation includes snowflake schema whereby data from different tables are connected using common dimensions. Not included in the prototype, however, commercial software packages can be developed to perform complex data mining tasks. Using the prototype, users can easily download the bordercrossing data from the website. Users can access the PDN-RMIS website, which also includes pre-trip traveler information related to border crossings. The information includes current wait times at the border for passenger and commercial vehicles as posted by CBP, number of inspection lanes open, Homeland Security threat level advisory, and camera images of the queue entering the U.S. from the Mexico side. 4.3 Design Principles Data Warehouse A data warehouse is defined as a subject-oriented, integrated, non-volatile, and time-variant collection of granular data (13). A data warehouse provides information about one or more 53
56 subjects instead of ongoing business operations. Data are gathered into the data warehouse from a variety of sources and merged into a coherent whole. Data are obtained from multiple and disparate sources, filtered, aggregated, summarized, and fed into the data warehouse. The most important feature of a data warehouse concept is the integration of data, which is the most important objective of BCIS to integrate border crossing and other transportation data from multi data producers. Hence, archived data management service should be designed based on a concept of data warehouse, due to the following: Archived data user service should not only provide granular view of the border crossing data but also a single view of the system in the form of summarized or aggregated data. The data warehouse concept is built upon the need to provide granular as well as single view or image of the data typically by using data extracted from disparate and potentially incompatible sources. Data archived in the data warehouse are time variant, which implies that every record in the data warehouse represents a moment in time. In this prototype, every record in a table is time-stamped. For example, raw data records are stamped with the time when the data were generated. Aggregated or summarized data are stamped with the time-period the data represent. Designing and implementing a prototype as a data warehouse provides several advantages and disadvantages, which are relative to an agency s business needs to either process voluminous data by a small group of users or small transactions by a large group of users. A data warehouse should be designed to archive large and voluminous data that are queried less frequently and should not be designed for frequent processing of transaction data. Users can query and extract a large number of records, but on a less frequent basis from a data warehouse. Hence, archiving voluminous data fits perfectly into a data warehouse model. This is because archived data have a much smaller user base that access the data less frequently than real-time transaction users. Because data warehouse stores voluminous and highly granular data, agencies may be overwhelmed by the amount of archived data in terms of cost of maintaining the system without realizing the value of stored data. Building a data warehouse is an iterative process and evolves constantly as user requirements, volume of data, and business process change over time. Agencies may not have access to a continuous source of funding to maintain and update a data warehouse to archive highly granular data. Database Centric Architecture Database-centric architecture was used to design the prototype, in which database is a core component. The characterization of a database architecture as database-centric refers to the fact that data are stored in a relational database structure, as opposed to customized file-based data structures. In a prototype, all data are stored in a relational database structure and business logics are built into the data warehouse as stored procedures and services. The primary benefit of database-centric architecture is that the development of application user interface is independent of the core database, since most of the business processes are implemented in database objects, as shown in Figure 11. This allows migration from one user interface platform to another. In 54
57 addition, by using database-centric architecture, fewer interactions between user interface and core database are required, resulting in less load on the database. Data Tables Business Logics Data Filtering and Aggregation Data Update and Maintenance Predefined Analysis Processes User Interface Figure 11. Database-Centric Architecture Showing Separation between User Interface and Database. Multi-Tier Architecture Multi-Tier Architecture (commonly known as Three-Tier architecture) is a client-server architecture in which the user interface ( PRESENTATION TIER ), functional processes ( BUSINESS LOGIC ), and data storage ( DATA STORAGE TIER ) are implemented as independent modules, most often on separate platforms. The Three-Tier architecture is intended to allow any of the tiers to be upgraded or replaced independently when required (14). The Three-Tier architecture was used in development of the prototype, which is illustrated in Figure 12. Each tier in the architecture is described briefly as follows: The DATA STORAGE TIER consists of a series of data tables (represented by smaller cylinders in the figure below), which stores archived ITS data in a relational database model. It also consists of temporary tables to hold real-time data, which are used to display advanced traveler information; 55
58 The BUSINESS LOGIC TIER consists of a series of stored procedures and server agents, which extract data from multiple sources, parse, filter, aggregate, and estimate performance indices; and The PRESENTATION TIER consists of mechanisms to disseminate archived ITS data and advanced traveler information to users through intranet, internet, and standalone applications. Extract Traffic and Border Crossing Data from Diverse Data Sources TIER 1 DATA EXTRACTION Archived Data Management Services Planners, Engineers, Researchers Pre Trip Traveler Information Service Motorists, Freight Carriers and Shippers TIER 2 DATA FUSION TIER 3 DATA DISSEMINATION Figure 12. Multi-Tier Architecture Consists of Data Storage, Business Logic and Presentation Tiers. 56
59 Chapter 5. Prototype Design and Implementation 5.1 General Framework The data warehouse framework designed for the implementation of PDN-RMIS was used as the platform to implement the prototype. The prototype was designed and implemented as a separate data mart in the PDN-RMIS data warehouse. During the implementation of PDN-RMIS, several business processes were developed to extract and aggregate ITS and non-its data. Prototype BCIS uses similar business processes to aggregate and archive the border crossing data. In PDN-RMIS, archived data are accessed by users through web-based reports that query data from the database. A similar method was used to provide access to users for archived border crossing data. In general, prototype BCIS was implemented by adding data marts and business processes to already existing database infrastructure developed for PDN-RMIS, as shown in Figure 13. Paso Del Norte Regional Mobility Information System Data Tables Add BCIS database to existing PDN RMIS framework BCIS Database Business Logics Data Filtering and Aggregation Data Update and Maintenance Predefined Analysis Processes Add BCIS related business processes to existing PDN RMIS framework User Interface Figure 13. Addition of Prototype BCIS Related Data and Business Processes into Existing PDN- RMIS Data Warehouse. 57
60 5.2 Database Schema The border crossing database consists of numerous FACTS and DIMENSIONS tables in a Star Schema. The database includes tables representing monthly volume of shipments, passengers, passenger vehicles, quantity of incoming freight by mode and commodity, hourly and daily average border wait times reported by CBP, and Homeland Security daily threat advisory levels, as shown in Figure 14. Tables in the database are related to DIMENSIONS tables using one or more clustered and non-clustered indexes. Temporal dimensions include a separate table consisting of calendar dates, and spatial dimensions include variables such as name of port district, name of port of entry, etc. Using common dimensions, information can be retrieved from one or more fact tables without physical relationships between fact tables. Border Crossing Database Hourly Border Wait Times at BOTA Hourly Border Wait Times at PDN Daily HS Threat Level Advisory Hourly Border Wait Times at Ysleta Daily Exchange Rate Daily Average Border Wait Times at Ysleta Dimensions Tables Monthly Incoming Passenger Volume Daily Average Border Wait Times at BOTA Monthly Incoming Vehicle Volume Daily Average Border Wait Times at PDN Monthly Import Export Volume By Commodity Monthly Incoming Freight Volume Monthly Import Export Volume By Mode Figure 14. FACTS and DIMENSIONS Tables in the Prototype BCIS Database. Obviously, a full-scale deployment of the border crossing information system would include additional tables with logical and physical architecture much different than the one described here. Table 26 provides descriptions of FACTS tables in the prototype BCIS, and Table 27 provides descriptions of DIMENSIONS tables in the database. 58
61 PK FK1,U1 FK1,U1 PK FK1,U1 FK1,U1 PK DHSThreatLevel IncomingPassengers UniqueID PassengerPersonalVehicles BusPassengers Pedestrians TrainPassengers BorderRegion Month Year IncomingVehicles UniqueID UniqueID FK1,U1 Year FK1,U1 Month FK1,U1 Day ThreatLevel Trucks Trains PersonalVehicles Buses BorderRegion Month Year PK FK1,U1 FK1,U1 FK1,U1 DailyExchangeRate Date PK Year Month Day ExchangeRateMexico Dates DateID Year Month Day Hour PK DailyAverageDelayYSLETA FK1,U1 FK1,U1 FK1,U1 PK DailyAverageDelayPDN FK1,U1 FK1,U1 FK1,U1 Date Year Month Day AvgCommStdDelay MinCommStdDelay MaxCommStdDelay AvgCommFASTDelay MinCommFASTDelay MaxCommFASTDelay AvgPsgStdDelay MinPsgStdDelay MaxPsgStdDelay AvgPsgSENTRIDelay MinPsgSENTRIDelay MaxPsgSENTRIDelay Date Year Month Day AvgPsgStdDelay MinPsgStdDelay MaxPsgStdDelay PK FK1,U1 FK1,U1 FK1,U1 DailyAverageDelayBOTA Date Year Month Day AvgCommStdDelay MinCommStdDelay MaxCommStdDelay AvgCommFASTDelay MinCommFASTDelay MaxCommFASTDelay AvgPsgStdDelay MinPsgStdDelay MaxPsgStdDelay Figure 15. Sample FACTS and DIMENSIONS Tables in the Prototype BCIS for Border Crossing Performance Measurement. 59
62 Table 26. List of FACT Tables in the prototype BCIS database Physical Table Name Logical Table Name Description IncomingFreight Monthly Incoming Freight Stores monthly total freight containers Volume entering U.S. by various modes of ImportExport_ByMode ImportExport_ByCommodity DHSThreatlevel IncomingPassengers IncomingVehicles DailyAverageDelayYSLETA DailyAverageDelayBOTA DailyAverageDelayPDN CrossingBOTA Monthly Import-Export Volume by Mode Monthly Import-Export Volume by Commodity Daily DHS Threat Level Advisory Monthly Incoming Passenger Volume Monthly Incoming Vehicle Volume Daily Average Border Wait Times at Ysleta Daily Average Border Wait Times at BOTA Daily Average Border Wait Times at PDN Hourly Border Wait Times BOTA transportation. Stores monthly total trade value and weight with origin as Mexico and destination states in U.S. by mode of transportation. Stores monthly total trade value and weight with Mexico by commodity. Stores daily color-coded value of threat level issued by Department of Homeland Security. Stores monthly total passengers entering U.S. through various border regions in the state of Texas. Stores monthly total vehicles entering U.S. by various modes of transportation. Stores 24 hour average wait times at Ysleta Bridge collected from CBP website. Stores 24 hour average wait times at Bridge of the Americas collected from CBP website. Stores 24 hour average wait times at Paso Del Norte Bridge collected from CBP website. Stores wait times at Bridge of the Americas collected from CBP website every 20 minutes. CrossingPDN Hourly Border Wait Times PDN Stores wait times at Paso Del Norte Bridge collected from CBP website every 20 minutes. CrossingYsleta Hourly Border Wait Times Ysleta Stores wait times at Ysleta Bridge collected from CBP website every 20 minutes. DailyExchangeRate Daily Exchange Rate Stores daily exchange between U.S. Dollar and Mexican Peso. 60
63 Table 27. List of DIMENSIONS Tables in the Prototype BCIS Database Physical Table Name Logical Table Name Description DEPE Port Code Stores codes for ports of entry and port districts. DISTRICTCODE District Code Stores name and code for port districts. TRDTYPE Trade Type Stores codes for type of trade (import or export). COMMODITY Commodity Type Stores commodity codes, which are based on the Harmonized Tariff Schedule of the U.S ( CONTCODE Container Code Stores codes for containerized and non-containerized shipments. DISAGMOT Transportation Mode Stores codes to identify transportation modes for shipments entering and exiting the U.S. COUNTRY Partner Country The country field in this dataset is either Canada or Mexico. The codes are derived from the International Standards Organization (ISO) list of countries ( DATES Dates Stores disaggregated calendar date (year, month, day, and hour). 5.3 Data Extraction and Aggregation Processes The objectives of data extraction and aggregation processes are to obtain border crossing data from multiple agencies and aggregate the data based on various temporal and spatial granularities. Data extraction processes include several autonomous applications (executables) that run at predefined time intervals to extract data from agency websites and RSS feeds. For example, border crossing-related data are extracted by grabbing information from agency websites (traffic incidents, border wait times), through RSS links provided by agencies (DHS daily threat level, hourly weather information), and by downloading raw data sets from agency websites or a file transfer protocol repository (BTS provided border crossing-related trading volume, incoming passenger and freight volume, etc.). This process is illustrated in Figure 16. In addition, extracted data are parsed, geo-coded, and converted to XML format for display over the internet. One of the challenges of the prototype BCIS is to fuse disparate and diverse set of border crossing-related data relayed by agencies. Since, there are no formalized data transfer processes between agencies and prototype BCIS, the only mechanism to extract data from these sources is to grab data from agency web pages, RSS feeds, and download data from the website. One of the main disadvantages in grabbing data from agency web pages and RSS feeds is that every time agencies change the format of data display in their web page, the application that grabs the data has to be modified as well. Hence, formal data exchange mechanisms between data producing agencies and the BCIS would eliminate such shortcomings. 61
64 Figure 16. Data Extraction and Aggregation Process in the Prototype BCIS. Archived data user service provided by the prototype includes formal rules and procedures (as part of business logics) to control the quality and quantity of data. Subjective editing procedures for identifying and imputing missing or invalid data are highly discouraged, since the effects of such adjustments are unknown and frequently bias the results (15). The prototype BCIS does use filtering techniques to reduce the quantity of the border crossing-related data to limit to the El Paso region. Automated filtering is required while receiving data from sensor devices, such as RFID and Bluetooth based measurement of commercial and passenger vehicle border crossing times. In BCIS, border crossing-related data are stored in various granularities (hourly, daily, monthly, etc.) and automated procedures aggregate the data and are stored in separate tables. 5.4 Information Dissemination and Access to Archived Data Pre-trip traveler information service enables the traveling public to make informed decisions about trips. PDN-RMIS provides pre-trip information to motorists and the traveling public by extracting travel related data from multiple sources and displaying travel conditions using a single window website. A similar approach was used to extract border crossing-related data from agencies (such as CBP, DHS), converted to XML format, and read by the prototype BCIS web page to be displayed over the internet. The entire process is illustrated in Figure 17 using a data flow diagram. Figure 18 shows a snapshot of the overall PDN-RMIS website merged with border crossing-related information developed as part of the prototype BCIS. 62


65 Figure 17. Process to Disseminate Information Through the Internet in the Prototype BCIS. Figure 18. Snapshot of PDN-RMIS Website Merged with Border Crossing-Related Information Developed as Part of the Prototype BCIS. Static and interactive reports developed as part of the prototype BCIS have been categorized as Border Crossing Information System, as shown in Figure 19, including other mobility information related reports developed as part of the PDN-RMIS. Several web-based reports are included to provide multi-granular views (temporal and spatial) of border crossing information. For example, users can view hourly and daily variation of border wait times reported by CBP and compare the border wait times at different ports of entry in the El Paso region. The website 63
, is that web-based reports (static and interactive) are stored in a central repository in a server using")
66 also provides reports to access border trade related data, such as incoming freight volume, trade data, etc. Figure 19. Prototype BCIS Related Reports Implemented using PDN-RMIS Website. One of the unique features of the prototype BCIS (that is also implemented in PDN-RMIS), is that web-based reports (static and interactive) are stored in a central repository in a server using Microsoft SQL Reporting Service Architecture, illustrated in Figure 20. The SQL Server Reporting Services is a comprehensive, server-based solution that enables the creation, management, and delivery of both traditional, paper-oriented reports and interactive, web-based reports (16). An integrated part of the Microsoft Business Intelligence framework, Reporting Services combines the data management capabilities of SQL Server and Microsoft Windows Server with familiar and powerful Microsoft Office System applications to deliver real-time information to support daily operations and drive decisions. 64

.")


67 Figure 20. Microsoft SQL Server s Reporting Services Architecture (17). These reports are connected to tables in the data warehouse using predefined stored procedures, and web pages encapsulate the reports to provide access to users, as illustrated in Figure 21. This mechanism of creating a central repository of reports facilitates a server-based creation, management, and delivery of reports. Figure 21. Microsoft SQL Server s reporting services to display web-based reports. 5.5 CBP Reported Border Wait Times Customs and Border Protection posts current border wait times at all ports of entry and all modes of transportation on its public website, as shown at Border wait times information includes wait times of commercial and passenger vehicles, pedestrians, number of inspection lanes open, and capacity in terms of maximum number of inspection lanes. The 65
. A snapshot of the CBP website showing the current wait times at ports of entry in the El Paso region is shown in Figure 22.")
68 information also includes border wait times segregated by different CBP administered programs, such as Fast and Secure Trade Program and Secure Electronic Network for Travelers Rapid Inspection (SENTRI). A snapshot of the CBP website showing the current wait times at ports of entry in the El Paso region is shown in Figure 22. Figure 22. Snapshot of CBP Reported Border Wait Times at Ports of Entry in the El Paso Region. An autonomous application reads the CBP web page and extracts columns of information using keyword search (in this case use El Paso). The application parses the data to appropriate format and stores the information in a temporary XML file and in a table in the BCIS database. The XML file is constantly updated (hourly) with data extracted by the application and is read by the website for display as part of the pre-trip traveler information. As part of the prototype BCIS, hourly border wait times and related information are stored in tables separated for individual ports of entry. Procedures have been developed to determine daily average border wait times for individual ports of entry and by programs and stored in separate tables in the database. These procedures reside within the database and can be run whenever required to aggregate the data. This process is illustrated in Figure 23 and Figure
69 Figure 23. CBP Reported Border Wait Times Data Extraction and Relay Process. Note: A represents continuation point to Figure 24. Figure 24. CBP Reported Border Wait Times Data Aggregation and Archiving Process. Hourly border wait times for three ports of entry in the El Paso region are stored in three separate tables (as FACTS tables), which are connected to a table consisting of dates (as DIMENSIONS table) using aggregated key structure, as illustrated in Figure 25. Descriptions of attributes used in these tables are as follows: RetrievedTS Time stamp the data were retrieved Hour Date the record was captured ComMaxLanes Maximum number of lanes available for inspection of commercial vehicles CommStdTime Hour value of the time stamp (Non-FAST Lanes) CommStdDelay Hourly border wait times of commercial vehicles using standard (Non-FAST) lanes CommStdLanesOpen Number of lanes open for inspection of commercial vehicles (Non- FAST) CommFstTime Hour value of the time stamp (FAST Lanes) 67
70 CommFstDelay Hourly border wait times of commercial vehicles using FAST lanes CommFstLanesOpen Number of lanes open for inspection of commercial vehicles (FAST) PsgMaxLanes Maximum number of lanes available for inspection of passenger vehicles PsgStdTime Hour value of the time stamp (Non-SENTRI Lanes) PsgStdDelay Hourly border wait times of passenger vehicles using standard (Non-SENTRI) lanes PsgStdLanesOpen Number of lanes open for inspection of passenger vehicles (Non-SENTRI) PsgSentTime Hour value of the time stamp (SENTRI Lanes) PsgSentDelay Hourly border wait times of passenger vehicles using SENTRI lanes PsgSentLanesOpen Number of lanes open for inspection of passenger vehicles (SENTRI) Figure 25. CBP Reported HOURLY Border Wait Times Archived in Prototype BCIS Database Using the Star Schema. Daily average border wait times for three ports of entry in the El Paso region are stored in three separate tables (as FACT tables), which are connected to a table consisting of dates (as Dimensions table) using aggregated key structure, as illustrated in Figure 26. Along with daily average of border wait times, minimum and maximum values of wait times during the day are also determined. Descriptions of attributes used in these tables are as follows: AvgCommStdDelay Daily average of border wait time for commercial vehicles using Non- FAST lanes MinCommStdDelay Minimum border wait time for commercial vehicles using Non-FAST lanes MaxCommStdDelay Maximum border wait time for commercial vehicles using Non-FAST lanes 68
71 AvgCommFASTDelay Daily average of border wait time for commercial vehicles using FAST lanes MinCommFASTDelay Minimum average of border wait time for commercial vehicles using FAST lanes MaxCommFASTDelay Maximum average of border wait time for commercial vehicles using FAST lanes AvgPsgStdDelay Daily average of border wait time for passenger vehicles using Non-SENTRI lanes MinPsgStdDelay Minimum average of border wait time for passenger vehicles using Non- SENTRI lanes MaxPsgStdDelay Maximum average of border wait time for passenger vehicles using Non- SENTRI lanes AvgPsgSENTRIDelay Daily average of border wait time for passenger vehicles using SENTRI lanes MinPsgSENTRIDelay Minimum average of border wait time for passenger vehicles using SENTRI lanes MaxPsgSENTRIDelay Maximum average of border wait time for passenger vehicles using SENTRI lanes DailyAverageDelayBOTA1 PK Date PK DailyAverageDelayYSLETA1 FK1,U1 FK1,U1 FK1,U1 Date Year Month Day AvgCommStdDelay MinCommStdDelay MaxCommStdDelay AvgCommFASTDelay MinCommFASTDelay MaxCommFASTDelay AvgPsgStdDelay MinPsgStdDelay MaxPsgStdDelay AvgPsgSENTRIDelay MinPsgSENTRIDelay MaxPsgSENTRIDelay FK1,U1 FK1,U1 FK1,U1 Year Month Day AvgCommStdDelay MinCommStdDelay MaxCommStdDelay AvgCommFASTDelay MinCommFASTDelay MaxCommFASTDelay AvgPsgStdDelay MinPsgStdDelay MaxPsgStdDelay PK Dates1 DateID Year Month Day Hour DailyAverageDelayPDN1 PK FK1,U1 FK1,U1 FK1,U1 Date Year Month Day AvgPsgStdDelay MinPsgStdDelay MaxPsgStdDelay Figure 26. CBP Reported DAILY Average Border Wait Times Archived in Prototype BCIS Database Using the Star Schema. Several server-based reports (static and interactive) were developed and stored in a central repository inside the database. These reports are connected to tables in the data warehouse using predefined stored procedures and web pages encapsulate the reports to provide access to users. 69

72 These web-based reports have simple querying capabilities, mostly to limit the scope of queried data. In addition, web-based reports are available either through the internet or through local intranet. Several reports to query and access archived CBP reported border wait times were developed whereby a user selects the port of entry and date, as shown in Figure 27. Certainly, the report can include much more complex query options. Figure 27. Webpage to Query and Access CBP Reported Hourly Border Wait Times at Different Ports of Entry in the El Paso Area. Server-based reports were created to query and access average daily wait times using month of the year as a query parameter, as shown in Figure 28 through Figure 30. For example, Figure 31 shows daily border wait-time of commercial vehicles on Non-FAST and FAST lanes and passenger volumes on Non-SENTRI lanes at the Bridge of the Americas port of entry in El Paso. Similarly, Figure 32 shows daily average border wait-time of passenger vehicles at Ysleta, Bridge of the Americas, and Paso Del Norte ports of entry in the El Paso region. Certainly, the reports can include much more complex query options. 70

73 Figure 28. Web-based Report to Query and Access CBP Reported Hourly Border Wait Times of Commercial and Passenger Vehicles at the Bridge of the Americas Port of Entry. Figure 29. Web-based Report to Query and Access CBP Reported Hourly Border Wait Times of Passenger Vehicles at the Paso Del Norte Port of Entry. 71
74 Figure 30. Web-Based Report to Query and Access CBP Reported Hourly Border Wait Times of Commercial and Passenger Vehicles at the Ysleta Port of Entry. Several server-based reports were also created to query and compare average daily border wait times between different inspection programs and modes, as shown in Figure 31and Figure 32. For example, Figure 31 shows comparison of daily average border wait-time of commercial vehicles at Ysleta and Bridge of the Americas ports of entry in the El Paso region. Similarly, Figure 32 shows comparison of daily average border wait-time of passenger vehicles at Ysleta, Bridge of the Americas, and Paso Del Norte ports of entry in the El Paso region. Certainly, the report can include much more complex comparison methods. 72


75 Figure 31. Web-based Report to Compare Daily Average Commercial Vehicle Border Wait Times Between FAST and Non-FAST Lanes at the BOTA and Ysleta Ports of Entry. Figure 32. Web-based Report to Compare Daily Average Passenger Vehicle Border Wait Times at Ysleta, BOTA, and PDN Bridges. 5.6 Homeland Security Threat Level The Department of Homeland Security provides current threat level advisory using public real simple syndicate feeds. A snapshot of the RSS is shown in the Figure 33. The current threat 73


76 level is important to commercial vehicle operators who experience increased security inspection during high alert levels and hence longer than normal wait times at the border. The current threat level is read by an autonomous application in the prototype BCIS every hour and sent to a table in the database for storage. The application also converts the data into appropriate format to be displayed in the BCIS website along with other border crossing-related information, as illustrated in Figure 34. Figure 33. Department of Homeland Security RSS for Daily Threat Advisory Condition. Note: RSS = Real Simple Syndication Figure 34. Data Flow Diagram to Illustrate a Process to Extract and Archive Daily Threat Level Provided by DHS. 5.7 U.S.-Mexico Trade Data The Bureau of Transportation Statistics maintains a repository of data related to trade activities (import and export) between the U.S. and Mexico. Trade related data consists of import and export value and volume of various commodities identified by the specific port of entry, mode of transportation, etc. Import and export volume can also provide a clear indication of how a specific port of entry compares to other ports of entry. Hence, there is a significant value in integrating trade data with 74
77 other border crossing-related data (such as border wait times, daily threat level, etc.). The only caveat with integrating BTS provided trade data with other border crossing data is that the BTS data are available in monthly granularity, while other data are available in hourly and daily granularity. This limits the analysis of the integrated data using monthly values only. Aggregating border wait times into monthly averages reduces the significance of operational value of the data. Trade data from the BTS website was downloaded only for the El Paso Port District. The list of data obtained from the BTS is described in Tables 26 and 27. The raw data obtained from BTS was recreated and reformatted for storage in the relational database model, as illustrated in Figure 35. Figure 35. Data Flow Diagram to Illustrate a Process to Download and Aggregate Monthly Import-Export Related Data Provided by BTS. Data tables were arranged in a relational database format using FACT and Dimension table structure, as shown in Figure 36. Figure tables shown in orange (and shaded) are dimension tables and the remaining tables are fact tables that store monthly trade data, such as import-export by commodity, volume of incoming freight, import-export by mode. By storing data in relational database models, users can query data using multiple variables (provided by DIMENSION tables). This level of query is not provided from the BTS website. 75
78 Figure 36. Monthly Import-Export Data Downloaded from BTS and Archived in the BCIS Prototype using FACTS and Dimensions Table Structure. Figures 37 and 38 shows snapshots of web-based reports to query various data archived in the BCIS. These reports can be tailored to stakeholder needs. Figure 37 shows an annual trend of monthly volume of containers entering the U.S. through ports in the El Paso region and Figure 38 shows monthly volume of incoming trucks and import through ports in the El Paso region. 76

79 Figure 37. Web-based report to query BTS provided monthly volume of containers entering the U.S. through ports in the El Paso region. 77

80 Figure 38. Web-Based Report Tto Query BTS Provided Monthly Volume of Incoming Trucks and Import Through Ports in the El Paso Region. 5.8 Daily Currency Exchange Rate The exchange rate of currencies between the U.S. and Mexico has a significant effect on travel between the two countries. The archived data of currency exchange rate integrated with daily and monthly inbound and outbound passenger and freight volume will provide enough information to study such an effect. The agency website ( provides RSS of the daily exchange rate between the two countries. An autonomous application reads the exchange rate everyday from the RSS and stores it in a table in the prototype BCIS database. Figure 39 illustrates the data flow diagram to extract and store the daily currency exchange rate between the U.S. and Mexico. Figure 40 shows a snapshot of a table to store daily U.S. and Mexican currency exchange rates. 78


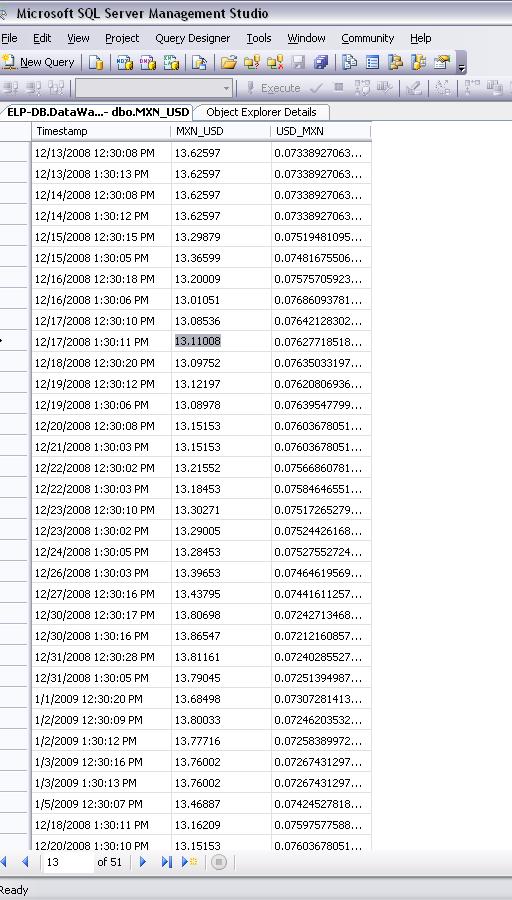
81 Figure 39. Data Flow Diagram to Illustrate a Process to Extract Daily Currency Exchange Rate. Figure 40. Snapshot of a Table with Daily U.S.-Mexican Currency Exchange Rate. 79
82 Chapter 6. Future Implementations and Lessons Learned The following sections describe likely constraints while implementing a fully fledged border crossing information system for the U.S.-Mexico border region. The lessons learned while designing and implementing the prototype information system are also described in the following sections. 6.1 RFID Based Border Crossing Time Commercial vehicle border crossing times at ports of entry along the U.S.-Mexico border are gathered and relayed by Customs and Border Protection. Border-crossing times are estimated by surveying drivers with visual observations of how long the queue is on the Mexico side. The Federal Highway Administration awarded the Measuring Border Delay and Crossing Times at the U.S.-Mexico Border project to the Battelle/TTI team in September This project consists of two phases Phase 1 involved an analysis of technologies that could support the installation of a border crossing time measurement system, while Phase 2, which is currently taking place, involves the selection of a technology and the actual implementation of the system. The objective of Phase 2 of the project is to measure border crossing times of commercial vehicles entering the U.S. from Mexico and providing the information in near real-time to regional transportation agencies for dissemination to the public. It was determined that for this project an RFID system will be the technology implemented and the Bridge of the Americas at El Paso, Texas / Ciudad Juarez, Mexico, will be the port of entry at which the RFID pilot test will occur. Border-crossing times of commercial vehicles, obtained from the abovementioned project, will be relayed and archived in a BCIS database. The archived border crossing time data are an invaluable component of the prototype BCIS and will be integrated with other border crossingrelated information. The project includes installation of a RFID reader station at the entrance of the commercial vehicle inspection station on the Mexico side of BOTA and another station at the exit of the Department of Public Safety inspection station on the U.S. side. The RFID readers are calibrated to read a variety of tags carried by the trucks, including the ones issued by CBP and other Mexican agencies. The commercial vehicles will pass an RFID reader station at a point sufficiently ahead of the end of any queue on the Mexico side. The RFID tags on the trucks will be read as they pass the reader station. The tag query process will recover a unique identifier for each vehicle. The reader station will time stamp the tag read and forward the resulting data record to a central location (in this case BCIS database) for further processing via a data communication link. A detailed flow of data between various tables and processes is illustrated in Figure 41. Commercial vehicle border crossing times are converted to hourly averages, which are archived for future use and relayed to the public using BCIS website as part of the pre-trip border crossing information. Preliminary and detail designs including stakeholder needs and system requirements are provided in the report presented to FHWA by Battelle/TTI (18). 80
83 Figure 41. Data Flow Diagram Showing Application of RFID to Measure and Relay Commercial Vehicle Border Crossing Times. Note: Dashed lines represent future data flow, tables and applications. SSIS = SQL Server Integration Services Figure 42. Data Flow Diagram Showing Aggregation of RFID Data into Hourly and Daily Average Crossing Times. 81
84 6.2 Bluetooth Based Border Crossing Time Passenger vehicle border crossing times at ports of entry along the U.S.-Mexico border are gathered and relayed by CBP. Border-crossing times are estimated by surveying drivers with visual observations of how long the queue is on the Mexico side. There is no instrumentation in place to accurately measure length of queue or crossing time of passenger vehicles. In comparison to commercial vehicle border crossing times, measuring passenger vehicle crossing times is more challenging due to high volume of vehicles and lanes entering the U.S., which requires large-scale installation of expensive ITS devices such as license plate recognition, floating cars. Several tunnels along the U.S.-Canada border have been fitted with Bluetooth sensing devices, which have proven to be a much cheaper alternative to ITS data collection methods mentioned earlier. These sensors read Bluetooth signals from mobile devices and passenger vehicles before and after exiting the tunnel and match unique identification and estimate crossing time of individual vehicles (for passengers carrying Bluetooth enabled mobile devices). TTI undertook a project in 2008 to test if Bluetooth sensing devices can be deployed along the U.S.-Mexico border in the El Paso region. Hand-held Bluetooth sensing devices were deployed at each side of the border at three ports of entry in the El Paso region. Unique identifications were matched from both sides and passenger-vehicle crossing times were collected. For detailed results of the project, readers should refer to the presentation made by TTI to the stakeholders of the Cross Border Mobility (19). The project concluded that there was enough matching unique identification to estimate average passenger vehicle crossing times at three ports of entry. Based on the results from the project and meeting with the stakeholders, TTI was asked to develop a framework for a full-fledged implementation at one of the ports of entry in El Paso, which is illustrated in Figure 43. The City of El Paso is highly interested in implementing the system at all three ports of entry. The aggregation and storage of passenger vehicle crossing times is illustrated in Figure 44. If implemented, the Border Crossing Information System will be the platform to extract, aggregate, relay, and archive passenger vehicle crossing times. 82
85 Figure 43. Data flow Diagram Showing Application of Bluetooth to Measure and Relay Passenger Vehicle Border Crossing Times. Processed Data Table with Disaggregated Data Disaggregated Crossing Times Data Stored Procedures or SSIS Packages Running in BCIS Database to Determine Hourly Average Passenger Vehicle Crossing Times Hourly Average Crossing Times Hourly Average Crossing Times Table to Archive Hourly Average Passenger Vehicle Crossing Times at BOTA Hourly Average Crossing Times Hourly Average Crossing Time Data Table to Archive Hourly Average Passenger Vehicle Crossing Times at PDN Table to Archive Hourly Average Passenger Vehicle Crossing Times at Ysleta Hourly Average Crossing Time Data Hourly Average Crossing Time Data Stored Procedure Running as a Scheduled Job in BCIS Database to Aggregate Hourly Crossing Times to Daily Average Stored Procedure Running as a Scheduled Job in BCIS Database to Aggregate Hourly Crossing Times to Daily Average Stored Procedure Running as a Scheduled Job in BCIS Database to Aggregate Hourly Crossing Times to Daily Average Daily Average Crossing Times Table to Archive Daily Average Passenger Vehicle Border Crossing Times at BOTA Daily Average Crossing Times Table to Archive Daily Average Passenger Vehicle Border Crossing Times at PDN Daily Average Crossing Times Table to Archive Daily Average Passenger Vehicle Border Crossing Times at Ysleta Figure 44. Data Flow Diagram Showing Aggregation of Bluetooth Data into Hourly and Daily Average Crossing Times. 83
86 6.3 Border Crossing Performance Indices A set of border crossing performance measures (indices), described in Chapter 4 can be developed with successful implementation of technologies to measure border crossing-related data. Ultimately, a performance management process for evaluating and improving international border crossings for freight as well as passenger movement can be developed and implemented. Inputs to estimate performance measurement indices include archived border crossing times of individual or group of vehicles, Homeland Security threat levels, number of inspection lanes open, bridge closure information, and entering volume of passenger and commercial vehicles. Figure 45 clearly illustrates inputs and outputs to estimate border crossing performance measures. Border Crossing Times Homeland Security Threat Level Inspection Lanes Open Border Crossing Volume Processes to Estimate Border Crossing Performance Measures Total Delay Delay Per Vehicle Border Crossing Index Border Planning Index Buffer Index Figure 45. Input to Estimate Border Crossing Performance Measures. One of the challenges to measure performance of border crossings is to determine a common denominator that is applicable to all border crossings, understanding the fact that every border crossing operates differently. Further research is required to identify those common denominators. The other challenge is implementing technology to gather input variables in real time at every U.S.-Mexico border. Commercial and passenger vehicles queue on the Mexico side of the border. Hence, investing capital to equip Mexican roadways leading up to the border will require commitments from agencies in both countries. 84
87 6.4 Formal Data Exchange Processes The prototype BCIS was developed without any formalized data transfer processes between agencies and the system. Hence, an alternative mechanism was developed to extract or grab data from agencies websites. One of the main disadvantages in grabbing data from agency web pages and RSS feeds is that every time agencies change the format of data display in their web page, the application that grabs the data has to be modified as well. This mechanism is inefficient, and while data formats can change that makes BCIS to extract, parse, and store the information difficult. For example, during this project CBP s website has been showing construction related information for one of the ports of entry in El Paso. The autonomous application was not able to parse the information correctly due to a change in the structure/format in the web page. Hence, a formal data exchange mechanism between CBP and BCIS would have eliminated such a problem. Real Simple Syndication is a growing phenomenon widely used by news agencies to update latest events. Users subscribe to RSS feeds to get up to date information provided by the agency. The Department of Homeland Security s RSS is a very efficient method to obtain information, since the data are provided in a standard XML format. Customs and Border Protection can implement similar RSS to relay border crossing-related information. An alternative method is to establish a formal and exclusive data exchange mechanism between the CBP and the BCIS, whereby CBP would agree to send data packets to BCIS at predefined time intervals. In the absence of formal data exchange mechanisms and an agency to provide data, BCIS should be able to acquire data using its own resources. For example, one of the data required by BCIS is to obtain large-scale events that attract a large number of traffic across the border. Hence, BCIS has to obtain the information of these events from news sources, concert venues, and event organizers, such as University of Texas at El Paso and feed the information into the database. 6.5 Data Fusion and Integration U.S.-Mexico s trade related data are provided by the Bureau of Transportation Statistics. The data are available as monthly totals or monthly average. This limits the integration of trade related data with other border crossing-related data to analyze operational performance of the border crossing, even though monthly data can be used for planning purposes and to understand the long-term effect of border crossing on the socioeconomics of border regions. The need for shorter granularity data, such as hourly entering volume of passenger and commercial vehicles is even more significant to analyze the operational performance of border crossings. Bridge and toll operators and CBP should develop mechanisms to send hourly or less than hourly volume of traffic data to BCIS. These data are crucial in developing performance measure of border crossings. Similarly, some commercial vehicle operators have real-time tracking capabilities, using global positioning system. Trucking companies can create an anonymous version of the data to share with BCIS, which can estimate current crossing 85
88 times and archive the data. However, trucking companies are highly reluctant to provide such data due to competing business practices. Hence, the future implementation of BCIS should take into consideration unavailability of border crossing-related data in appropriate spatial and temporal granularity. BCIS should also develop mechanisms whereby agencies feel less reluctant to share data primarily by increasing the value of the data provided by these agencies. 6.6 Funding Mechanisms and Stakeholder Support Implementation and maintenance of a border crossing information system requires considerable support of stakeholders mainly because BCIS will not produce all the data and it will still need to obtain data from some stakeholder agencies. Most importantly, adding value to data provided by stakeholder agencies, especially public agencies, is the best approach to guarantee continuous support from the agencies. An agency responsible for operating and maintaining BCIS should explore methods to fund the project through various mechanisms, including commercializing the information provided by the system to commercial vehicle operators, news providers, and private motorists. 6.7 Technologies to Measure Vehicle Crossing Times Radio Frequency Identification Technology Radio Frequency Identification technology operates by transmitting data using radio waves for communication between a tag and a reader, and communication to a database. A typical RFID system consists of four main components: tags (or transponders), an encoder, readers, and a central data processing unit. An RFID tag is a device used for the purpose of identification using radio waves. RFID tags come in three general types: passive, active, or semi-passive (also known as battery-assisted). Semi-passive and active tags require a power source, usually a small battery. Passive tags require no internal power source; they are only active when a reader is nearby to power them. The small amount of electrical current induced in the antenna by the incoming radio frequency signal provides enough power for an integrated circuit in the tag to power up and transmit a response, which is an identification number of the tag. The RFID tags have a practical read distance of a few feet within line of sight of the tag reader. Passive RFID lack an onboard power supply, hence can be conveniently small and inexpensive. RFID technology is widely used in electronic toll collection systems and is used by Customs and Border Protection and DPS to read commercial vehicle (driver and trailer) information from tags. A large number of trucks entering the U.S. carry tags issued by the CBP as part of the FAST program and in some cases, trucks carry toll tags from Mexico. DPS has also started issuing tags to read driver information to expedite the inspection process. Application of RFID technology to measure commercial vehicle crossing times includes deployment of RFID readers on both sides of the border, which read the identification number of 86
89 tags on trucks crossing the border. The readers send the unique identification of the tags along with time-stamp to a central server via cellular data connection. The server then extracts matching identification and determines average commercial vehicle crossing times. Bluetooth Technology Bluetooth is a short-range communications technology intended to exchange data packets between devices. The technology was originally intended to replace cables connecting portable and/or fixed devices while maintaining high levels of security. Key features of Bluetooth technology are robustness, low power, and low cost. Bluetooth enabled devices can communicate with other Bluetooth enabled devices anywhere from 3 to 300 feet range, depending on the class of radio attached to the device. The operating range depends on the radio attached to the device, as follows: Class 3 has a range of up to 1 meter, or 3 feet; Class 2 most commonly found in mobile devices and has a range of 10 meters, or 33 feet; and Class 1 used primarily in industrial use cases and has a range of 100 meters, or 300 feet. The Bluetooth specification defines a uniform structure for a wide range of devices to connect and communicate with each other. The Bluetooth specifications are developed and licensed by the Bluetooth Special Interest Group (SIG). The Bluetooth SIG consists of companies in the areas of telecommunication, computing, networking, and consumer electronics. Bluetooth technology has achieved global acceptance such that any Bluetooth enabled device, almost everywhere in the world, can connect to other Bluetooth enabled devices in proximity (20). Bluetooth technology operates in the unlicensed industrial, scientific, and medical band at 2.4 to GHz, using a spread spectrum, frequency hopping, full-duplex signal at a nominal rate of 1600 hops/sec. The 2.4 GHz ISM band is available and unlicensed in most countries. Bluetooth technology s adaptive frequency hopping (AFH) capability was designed to reduce interference between wireless technologies sharing the 2.4 GHz spectrum. AFH works within the spectrum to take advantage of the available frequency. This is done by detecting other devices in the spectrum and avoiding the frequencies that are being used. This adaptive hopping allows for more efficient transmission within the spectrum, providing users with greater performance even if using other technologies along with Bluetooth. The signal hops among 79 frequencies at 1 MHz intervals to give a high degree of interference immunity. Bluetooth technology is widely used to establish point-to-point communication between electronic devices. The technology has been used at international ports of entry on the U.S.-Canada border to measure crossing times of passenger vehicles. However, this technology has not been used on the U.S.-Mexico border. Application of this technology to measure crossing times of passenger vehicles includes deployment of Bluetooth signal reader on both sides of the border and read signals emitted by mobile devices of motorists. The readers send the unique identification of Bluetooth signals along with time-stamp to a central server via cellular data connection. The server then extracts matching identification and determines average crossing times. 87
90 6.8 Goals and Objectives of Integrating with BCIS One of the goals of the Border Crossing Information System is to provide a platform and methodology to measure performance of border crossings in real time and improve future operations based on analysis of archived data. Objectives of BCIS are to provide real-time border crossing information to motorists and freight operators and to archive data for applications, such as determination of border crossing performance indices. While it is convenient to presume that one technology will measure performance of border crossings, the reality is different. However, standardization of communication between devices has facilitated easy integration of technology to exchange data. The subsequent sections will prove that measurement of commercial vehicles crossing times can be easily achieved by deploying RFID technology. However, measuring crossing times of passenger vehicles is much more challenging due to the high volume of vehicles entering the U.S., which requires large-scale installation of ITS devices such as license plate recognition, floating cars, etc. Bluetooth can provide much cheaper alternatives to measure passenger vehicle crossing times, while RFID can be utilized to efficiently measure commercial vehicle operation at the border. In spite of technologies being chosen to measure border crossing performance, a border crossing information system should integrate a wide variety of measurement technologies. In addition, the BCIS should also encompass entire hardware and communication setup and the database to archive real-time data, in spite of technologies (RFID, Bluetooth, etc.) that can be potentially deployed to measure operational parameters of border crossings, as illustrated in Figure 46. A full-fledged deployment of technologies at the border should be as seamless as possible and should operate under a centralized information system. Figure 46. Integrating Various Technologies to Measure Border Crossing Information. 88
91 This chapter describes lessons learned while testing and integrating two border crossing time measurement technologies with the BCIS. RFID technology was tested and successfully integrated with BCIS to relay and archive commercial vehicle crossing times. The test also identified potential problems during full-fledged deployments at the Bridge of the Americas and other locations along the U.S. Mexico border funded by FHWA. TTI also conducted tests to analyze the feasibility of deploying Bluetooth technology at the U.S.-Mexico border to measure crossing times of passenger vehicles. Even though the objective of the test was not to integrate Bluetooth technology with BCIS, results from the test confirmed that such integration is possible. The test also identified several issues that could arise while undertaking full-fledged deployments at ports of entry along the border. 6.9 Test to Integrate BCIS with RFID Technology This section describes testing of RFID technology to measure commercial vehicle crossing times at the Bridge of the Americas and describes successful integration with BCIS to relay and archive commercial vehicle crossing times. However, the objective of the test was to identify potential problems during full-fledged deployment at the Bridge of the Americas, which is being funded by FHWA. Test at DPS Facility at Bridge of the Americas Commercial vehicles exit the Mexican border facility, cross the Rio Grande River and enter the CBP facility. The vehicles then exit the facility and drive to their final inspection point inside the DPS facility. The roadway between the Customs facility and the DPS facility is one lane and thus ideal for single antenna, side of the road data collection as shown in Figure 47. It was determined that the field operational test would be conducted to measure the travel time while entering and exiting the DPS facility. 89

92 Customs and Border Protection Facility Department of Public Safety Facility Figure 47. Aerial View of the U.S. Side of the Bridge of the Americas and Location of CBP and DPS Inspection Facilities. The DPS inspection facility was visited prior to data collection to gain an understanding of the facility operations, discuss plans and objectives with DPS staff, receive safety briefings, and experiment with basic data collection (tag reading). The commercial vehicles passing through the DPS facility may display a FAST tag and/or a DPS tag, as shown in Figure 48. Other RFID tags could be present (e.g., toll road tags) but the test was concentrated on just these two categories of tags. A cursory examination of trucks passing through the facility revealed that the vast majority of trucks (unscientifically estimated at approximately 85 percent) display FAST tags, while a much lower percentage display DPS tags. The finding indicated that reliably reading FAST tags would be required to ensure success of the project. Sample FAST tags were not available prior to the test; therefore, the tag reader could not be preprogrammed to read them. Experimentation at the DPS facility found an acceptable reader setting to recover both types of tags and the equipment was reprogrammed on site. The FAST tags are located on the driver s side bottom area of a truck s windshield. This mounting favored a side of the road reader antenna located on the driver s side and disfavored a reader located on the passenger side. 90

93 Figure 48. A Truck Carrying both DPS and CBP Issued RFID Tags. Field Equipment Setup and Tests The entrance and exit to the DPS facility is easily accessed and had sufficient room for the data collection equipment. Figure 49 shows the DPS facility, two selected RFID station locations, and path of trucks entering the DPS facility from CBP. TTI staff conducted the tests on 10/08/2008 and 10/09/2008. For the first day of data collection, the solar powered trailer was parked at the exit of the DPS inspection facility near the actual running inspection location. This location was ideal in that the distance between the reader antenna and the windshield tags was very short, the reader antenna was on the FAST tag side of the windshield, and the trucks were moving very slowly through the detection zone. 91
 to the DPS Facility and Typical Path of a Truck Originating from the CBP Facility.")
.")

94 Exit from the DPS facility Truck Path Entrance to the DPS Facility Figure 49. Location of Entrance and Exits (and RFID Stations) to the DPS Facility and Typical Path of a Truck Originating from the CBP Facility. The electronic equipment for two RFID stations was acquired and back panels (with necessary communication devices) were built as per the detailed design submitted for this project. The back panels were fully tested to ensure the system would detect the DPS windshield tags (windshield sample tags were used for testing). In addition to tag reading, the testing exercised the wireless system and provided sample data for the central system data collection and processing system in El Paso. Upon completion of panel testing, both back panels and supporting equipment and tools were shipped to El Paso for scheduled tests. A solar-powered trailer was outfitted with a traditional traffic signal cabinet with the assembled back panel. The cabinet is very similar to the ones used in the actual field deployment of RFID stations. The antenna and reader unit was mounted on the exterior telescoping pole on the trailer. Again, this equipment will be mounted outside in the final deployment. The outfitted trailer was used as a stand-alone RFID station and was positioned in a manner to read tags from the side of the road. The final border crossing design utilizes reader antennas mounted over the travel lane 92

95 but there were no facilities available for a safe, temporary overhead mounting for this demonstration. The second operational back panel was placed in the back seat of a pick-up truck and powered by the vehicle s cigarette lighter adapter. The associated reader antenna was mounted external to the vehicle on either a simple pole or a roadside fixture. The RFID station (attached to a pick-up truck) was set up along the entrance road into the DPS inspection facility. The vehicle was parked near the edge of the road on the passenger side of the inbound trucks. This positioning was not ideal to read the FAST tags but the area did not allow vehicle access on the driver s side of the road. Subsequently, the entrance location would read a smaller percentage of the tags on passing trucks. Figure 50 shows location of RFID readers for the first day of data collection. Figure 50. Set up of RFID Stations on Day 1 at Entrance and Exit of the DPS Facility. The tag reading equipment positions were reversed during the second day of data collection, with the solar trailer located at the facility entrance and the vehicle occupying the exit location. The same conditions exist for tag reading and thus the exit location read a higher percentage of tags than the entrance. Figure 51 shows the second day tag reading set up. The RFID stations performed well during the demonstration. Cellular service was very good in each location and there were no problems maintaining contact with the central system in the El Paso TTI office. The solar panels easily powered the station during the collection period (both days were sunny). No abnormal operation or interruptions were observed during the entire demonstration period. 93

96 Figure 51. Set up of RFID Stations on Day 2 at Entrance and Exit of the DPS Facility. Centralized Database and Communication Setup RFID readers send data to a process in a database server using a cellular modem. The entire physical and logical arrangement of cellular modems, database server, and arrangement of database tables is illustrated in Figure 52. A process running inside the database server detects data packets on the incoming port, reads data packets and associates a time-stamp. The process also invokes a stored procedure, which inserts the data into a table. A trigger is fired whenever any new data are inserted into the raw data table. This trigger verifies if the data are coming from a valid combination of reader. If a valid combination is detected, then the tag number is parsed out of raw data and the tag number and associated time-stamp are inserted in the processed data table. If the combination is not valid then the raw data and time-stamp are inserted into the error data table. 94
97 Server with static IP address RFID database and other components are part of the BCIS Raw data Append time stamp to raw data Write raw data + Cell Modem RFID Readers Is data from a valid reader IP address? Yes No Write raw data with timestamp Write tag number and timestamp Raw Data Error Data Processed Data Aggregate Data Process runs every 15 minutes Compute difference in timestamp for matching tag numbers for both readers for last one hour Count the number of unique tag numbers read by each reader for the past 15 minutes Reading Count Write number of tags read by each reader RFID Database Write average crossing time Figure 52. Physical and Logical Diagram of Communication and Database Setup to Read Tag Identifications from RFID Stations. Several aggregation processes run on the database server every 15 minutes. One of the processes computes the average time difference between the readings for matching tag numbers between the two readers for all tags read in the last one hour. In addition, this process counts the number of tags read by each reader in the last 15 minutes. In addition, the process records all the tag numbers with their entry and exit time-stamps that were used to compute the average time difference. Several tables were created in the server database to store raw and aggregated data from RFID test stations, which are listed in Table 28. In addition to tables, several stored procedures were developed to aggregate the raw data periodically to determine crossing times. These stored procedures are listed in Table
98 Table Name AggregateData AggregationDetails Bridges ErrorData ProcessedData RawData ReaderPairs Readers ReadingCount Stored Procedure and Trigger Name sp_aggregatedata sp_writedata(sdata, sdatetime, sreaderip) trig_processdata Analysis of RFID Test Data Table 28. List of Tables to Store Raw and Aggregated RFID Data Description This table is used to store the average time difference in seconds between readings at the readers specified in the ReaderPairs table. This table is used to store the tag identification (ID) for all the tags considered for aggregation at any given instance. This table stores the bridge information for all bridges under consideration. This table stores all the data that are considered as invalid. Data are valid only if the source is from a specific reader ID with the specified internet protocol (IP) address and in a specific format. This table stores all valid tag IDs and the time stamp at which they arrived and the identification of reader which read those tags. This table stored all the data that are read by the computer along with the IP address of the sender and the reader ID of the reader, which read the data. This table is used to specify the reader IDs between which we need to get the time difference. This table is used to list all the valid reader IDs along with their IP addresses. This table is used to store the count of tags read by each reader for the specified time duration. Table 29. List of Stored Procedures to Aggregate Raw RFID Data Description This stored procedure is executed every 60 minutes. It computes the average time difference between the readings for a specific tag number between the reader pair specified in ReaderPairs table. Also, this procedure counts the number of tags read by each reader within the specific time interval and stores it in the ReadingCount table. This procedure is called from the front end and writes the input data to the RawData table. This is triggered when any data are inserted in the rawdata table. It checks if the data inserted in RawData are in a valid format. If it is valid the tag number is extracted from the incoming data and stored in the processed data table along with the time-stamp. If the incoming data are invalid then it is stored in the errordata table. An offline analysis of the raw and aggregated RFID data was performed to understand discrepancies between readers, total number of tags read by individual reader stations, and number of matching tags within a specified time-period, etc. The exploratory analysis of the matched tag IDs found that the RFID station at the DPS facility read more tags than the station at the entrance of the facility did for both test days, as shown in Figure 53. The reader at the exit read about 900 tags during the 8-hour test period in both days, while the reader at the entrance read only half that. The only possible explanation for this discrepancy is that the reader at the entrance of the DPS facility was not able to read tags on the driver side, since readers were positioned on the side of the road instead of an overhead location. 96

99 Figure 53. Total Numbers of Transponders Read by RFID Readers at Entrance and Exit of the DPS Facility. A further examination of the total number of transponders read by RFID readers and the fact that the hardware setup was switched between entrance and exit locations proved that the discrepancy was due to the location of the readers (on the side of the road) and not due to reader malfunction. Figure 54 shows the total number of transponders read by RFID stations (during test performed on 10/08/2008 and 10/09/2008) at different times of day, which does not indicate any systematic failure of readers. 97
100 Figure 54. Total Number of Transponders Read by RFID Readers at Different Times of Day. A stored procedure identified matching transponders. The procedure ran every 15 minutes and identified the number of matching transponders, and determined average crossing times. Figure 55 shows hourly average crossing times, which are reported every 15 minutes, at different times of day. The graphs also show total number of matching tags that were used to determine average crossing times. The test showed that on average, tags were matched within a given hour, which is adequate to determine crossing times with sufficient statistical significance. 250 est ate: Crossing Time in Seconds :45 12:00 12:15 12:30 12:45 13:00 13:15 13:30 13:45 14:00 14:15 14:30 14:45 15:00 15:15 16:15 16:45 17:15 17:45 18:00 18:15 18:30 NumberOfMatchingTagsRead Time of Day Hourly Average Crossing Time 98
101 250 Crossing Times in Seconds :15 11:30 11:45 12:00 12:15 12:30 12:45 13:00 13:15 13:30 13:45 14:00 14:15 14:30 14:45 15:00 15:15 15:30 15:45 16:00 16:15 16:30 16:45 17:00 17:15 17:30 17:45 18:00 18:15 Time of Day NumberOfMatchingTagsRead Hourly Average Crossing Time Figure 55. Hourly Average Crossing Times of Commercial Vehicles at Different Times of Day. It was observed that few tags crossed the readers more than once a day (possibly tags on drayage trucks). Initially this resulted in inaccurate average crossing times due to a bug in the algorithm that calculates travel time by matching same tag identifications. This issue was resolved by considering only the tag numbers that were read in the last one hour, as it was unlikely that the same tag numbers would cross more than once in an hour. Some time difference for some tag numbers was considerably large as compared to the average time difference. This is due to the secondary inspection of trucks. This issue can be resolved by filtering the outliers Test to Integrate BCIS with Bluetooth Technology This section describes testing of Bluetooth technology to measure passenger vehicle crossing times at three ports of entry in the El Paso area and describes results from the study that will influence integration with BCIS while relaying and archiving passenger vehicle crossing times. TTI collaborated with Turnpike Global (TG) to perform the test to apply Bluetooth technology for measurement of border crossing time of passenger vehicles at international ports of entry. It is worthwhile to mention that this experiment was the first of its kind along the U.S.-Mexico border and was intended to integrate with BCIS to measure passenger vehicle crossing times. The test identified the number of Bluetooth signals transmitted by mobile phones from drivers and passengers while crossing the international border and the ability of Bluetooth readers to measure crossing time of passenger vehicles. Bluetooth readers used in the experiment read identification of Bluetooth signals originating from Bluetooth enabled devices. By matching identification of signals from readers located on Mexico and U.S. sides, travel times of vehicles crossing the border can be estimated. 99

102 Tests at Ports of Entry in El Paso The test was conducted at all three ports of entry in the El Paso area, including the Bridge of the America, Ysleta, and Paso Del Norte. Figure 56 shows locations of ports of entry in the El Paso region. The test started on July 29, 2008, and ended on August 20, At each port of entry, data were collected for five consecutive weekdays from 7 AM to 11 AM. A Bluetooth signal reader was placed on each side of the U.S.-Mexico border. In addition to the Bluetooth readers, the volume of passenger vehicles entering the U.S. was manually counted. Bridge of the Americas Paso Del Norte Ysleta Figure 56. Locations of Ports of Entry in the El Paso Region Where Bluetooth Tests Were Performed. Field Equipment Setup and Tests Bluetooth enabled devices can communicate with other Bluetooth enabled devices anywhere from 1 meter to about 100 meters range depending on class of radios attached to the device. The Bluetooth protocol uses an electronic identifier in each device called a Media Access Control address, or MAC address for short. Bluetooth readers are able to search for nearby devices using a refresh rate defined by the software running inside the reader and obtain MAC addresses of Bluetooth enabled devices along with the time-stamp. Because each MAC address is unique, traditional matching algorithms analogous to those used for license plate, cellular, or toll tag tracking can be used to estimate travel time along a freeway or arterial. MAC addresses are not directly associated with any personal information of users. The MAC address of mobile phones or other electronic devices is not linked to a specific person through any type of central database, thus minimizing privacy concerns. Additionally, users with privacy concerns can turn off the Bluetooth Discovery Mode in their device. 100
103 Each Bluetooth reader is embedded with software, which constantly issues a Bluetooth discovery request within a predefined range. According to the standard Bluetooth protocol, a Bluetooth device set to Discoverable mode must respond to the discovery request by transmitting its unique Bluetooth identifier (12 hex digits) and device class (6 hex digits). Our scanner constantly issues the same discovery request, and constantly records the presence of the various devices it encounters (along with the date and time of each distinct instance a device was discovered). Potential locations of readers were determined based on conversation with U.S. and Mexican customs and bridge operators. A typical setup of Bluetooth readers and communication with a server is illustrated in Figure 54. The location of readers were also selected to capture the maximum number of vehicles entering and exiting ports of entry considering the fact that the omni-directional range of readers was 300 feet. Mexico United States Bluetooth Reader Bluetooth Reader Cellular Modem Central Processor At Global Turnpike Office Figure 57. A Typical Setup of Bluetooth Readers at U.S. and Mexico Sides of the Border. In addition to the collection of Bluetooth signals, an intercept survey was performed (a snapshot of a TTI student interviewing motorists is shown in Figure 58). The survey included questionnaires to determine percentage of motorists entering the U.S. with Bluetooth enabled mobile devices. 101
 monitors for any incoming data.")
104 Figure 58. TTI Student Conducting Intercept Survey of Motorists Entering the U.S. Centralized Database and Communication Setup Bluetooth readers send data to a central server using a cell modem. A process inside the server (at the Global Turnpike office) monitors for any incoming data. When the process detected any data packets on the incoming port, it read the data packets and added a time-stamp to the raw data. One difference between this and the RFID test was that the data obtained from Bluetooth readers were not analyzed in real time. Global Turnpike provided the raw data for analysis at the end of the test day. Analysis of Bluetooth Test Data An offline analysis of the raw and aggregated data was performed to understand discrepancies between readers, total number of unique signals read by readers, number of matching identifications within a specified time-period, etc. The exploratory analysis of the data found that the reader on the Mexico side identified more Bluetooth devices than the reader on the U.S. side, as shown in Table 30. A possible explanation for this discrepancy is that the reader on the U.S. side either was positioned incorrectly or was positioned on the side of the roadway instead of at an overhead location. Another possibility for this discrepancy is that the Bluetooth readers are able to read signals more effectively from vehicles on the Mexico side, which have much lower speed (while waiting in queue) than on the U.S. side where vehicles have higher speeds after exiting the inspection booth. However, the percentage of matching identifications (on both sides) from total entering vehicles is statistically significant to estimate average crossing times. 102
2009 CIITR RESEARCH BRIEF Northbound Freight Traffic Trends at the U.S.-Mexico Border
 2009 CIITR RESEARCH BRIEF Northbound Freight Traffic Trends at the U.S.-Mexico Border AUGUST 2009 Northbound Freight Traffic Trends at the Mexico-U.S. Border Recent negative changes in the global economy
2014 CIITR RESEARCH BRIEF U.S.-Mexico Border Freight Traffic Trends
 2014 CIITR RESEARCH BRIEF U.S.-Mexico Border Freight Traffic Trends RESEARCH BRIEF SERIES, 2015 2 CIITR RESEARCH BRIEF BORDER FREIGHT TRAFFIC TRENDS U.S.-Mexico Border Freight Traffic Trends SUMMARY This
TIME SAVINGS BENEFITS ASSESSMENT FOR SECURE BORDER TRADE PROGRAM PHASE II
 TIME SAVINGS BENEFITS ASSESSMENT FOR SECURE BORDER TRADE PROGRAM PHASE II by Roberto Macias Project performed by In cooperation with El Paso County Report Number: 186054-00002 Project Number: 186054-00002
Advances in Truck Crossings at Texas Mexico Border. Physical. Problem Identification. Identification. Technical Requirements
 Advances in Truck s at Texas Mexico Presented at ITS Texas November 16, 2006 Bill Stockton Texas Model Problem Identification Technical Requirements Identification Status Check Animation (absent from PDF)
Sketch Planning Methodology to Quantify Emissions Impacts at Border Crossings
 Sketch Planning Methodology to Quantify Emissions Impacts at Border Crossings Suggested Approach Reducing queuing delays when crossing the border northbound can potentially have significant emissions and
Border Information Flow Architecture
 Border Information Flow Architecture Final Report Fleet and Freight Management Commercial Vehicle Administration Intermodal Container Commercial Vehicle Check Prepared by the National ITS Architecture
Data Requirements in Transportation Reauthorization Legislation Operations & Security
 Data Requirements in Transportation Reauthorization Legislation Operations & Security 1. Introduction This conference will identify and refine the data issues associated with the programs stipulated in
Dashboard Tool to Communicate Delays and Economic Cost of Delays at International Border Crossings
 Dashboard Tool to Communicate Delays and Economic Cost of Delays at International Border Crossings Rajat Rajbhandari, Swapnil Saman, Sharada Vadali, and Don Kang The development of a dashboard tool to
Oklahoma. Oklahoma Statewide Intelligent Transportation Systems (ITS) Strategic Plan
 Strategic Plan") Oklahoma Statewide Intelligent Transportation Systems (ITS) Strategic Plan Oklahoma Department of Transportation In Coordination With: U.S. Department of Transportation April 2005 Oklahoma Statewide Intelligent
Oklahoma Statewide Intelligent Transportation Systems (ITS) Strategic Plan Oklahoma Department of Transportation In Coordination With: U.S. Department of Transportation April 2005 Oklahoma Statewide Intelligent
TRANSMIT: Travel-Time System for Border Crossings in Ontario s Niagara Region. Stephen Erwin, P.Eng., Ministry of Transportation of Ontaro
 TRANSMIT: Travel-Time System for Border Crossings in Ontario s Niagara Region Stephen Erwin, P.Eng., Ministry of Transportation of Ontaro Paper prepared for presentation at the Traffic Operations: What
Traffic Safety Measures Using Multiple Streams Real Time Data
 CAIT-UTC-055 Traffic Safety Measures Using Multiple Streams Real Time Data FINAL REPORT January 2017 Submitted by: Mohsen Jafari Professor of Industrial and Systems Engineering Center for Advanced Infrastructure
Regional Mobility Authorities in Texas
 Regional Mobility Authorities in Texas Testimony of Ginger Goodin, P.E., Senior Research Engineer and Director, TTI Transportation Policy Research Center John Overman, Research Scientist for Transit Mobility
GUIDING PRINCIPLES MEMORANDUM
 M E T R O P O L I TAN TRA NS P O RTATI O N PLAN GUIDING PRINCIPLES MEMORANDUM El Paso Metropolitan Planning Organization INTRODUCTION The guiding principles for development of the El Paso MPO s Destino
Proactive Approaches. To Minimize. Supply Chain Security. Breaches in the Rail, Air, Ocean and Land Environment
 Proactive Approaches To Minimize Supply Chain Security Breaches in the Rail, Air, Ocean and Land Environment Top Eight Rail Principles Track and monitor pulls on a 24 hour basis to determine location and
Texas Transportation Institute The Texas A&M University System College Station, Texas
 1. Report No. TX-01/50-1XXA3038 2. Government Accession No. 3. Recipient's Catalog No. 4. Title and Subtitle TRUCK TRANSPORTATION THROUGH BORDER PORTS OF ENTRY: ANALYSIS OF COORDINATION SYSTEMS Technical
Evaluation Study of Port Authority of New York and New Jersey s Time of Day Pricing Initiative
 FHWA/NJ-2005-005 Evaluation Study of Port Authority of New York and New Jersey s Time of Day Pricing Initiative FINAL REPORT March 2005 Submitted by Dr. José Holguín-Veras * Dr. Kaan Ozbay ** Dr. Allison
BORDER DELAYS AND ECONOMIC IMPACT TO THE FREIGHT SECTOR: AN EXPLORATION OF THE EL PASO PORTS OF ENTRY
 BORDER DELAYS AND ECONOMIC IMPACT TO THE FREIGHT SECTOR: AN EXPLORATION OF THE EL PASO PORTS OF ENTRY by Sharada R. Vadali, Ph.D. Dong Hun Kang, Ph.D. Karen Fierro Project performed by Report No: 186041-00005
Supply Chain Security IGTLC
 Supply Chain Security IGTLC CONVERGENCE: CARGO-CYBER CRIME Mix of Physical and Cyber Tactics to Set-up Fraudulent Pick-ups Phone spoofing Criminals calling airlines to gather intelligence on freight arrival
TEXAS FREIGHT MOBILITY PLAN 2017
 TEXAS FREIGHT MOBILITY PLAN 2017 Texas Transportation Commission September 28, 2017 Overview of the Texas Freight Mobility Plan 2016 Plan First multimodal freight mobility plan Identified freight network,
Nashville Area. Regional ITS Architecture. Regional ITS Deployment Plan. June Prepared by:
 Regional ITS Architecture Regional ITS Deployment Plan Prepared by: 069223006 Copyright 2010 by Kimley-Horn and Associates, Inc. All rights reserved. TABLE OF CONTENTS REGIONAL ITS DEPLOYMENT PLAN 1. INTRODUCTION...
North Dakota Statewide ITS Architecture
 430 IACC Building Fargo, ND 58105 Tel 701-231-8058 Fax 701-231-6265 www.atacenter.org - www.ugpti.org North Dakota Statewide ITS Architecture Final Report March 2005 Prepared for: North Dakota Department
MONITORING IMPLEMENTATION AND PERFORMANCE
 12 MONITORING IMPLEMENTATION AND PERFORMANCE The FAST Act continues the legislation authorized under MAP-21, which created a data-driven, performance-based multimodal program to address the many challenges
Operations in the 21st Century DOT Meeting Customers Needs and Expectations
 Operations in the 21st Century DOT Meeting Customers Needs and Expectations 1 Purpose of this Meeting: Share Thoughts & Discuss Challenges brought about by the changing transportation environment and public
3.6 GROUND TRANSPORTATION
 3.6.1 Environmental Setting 3.6.1.1 Area of Influence The area of influence for ground transportation consists of the streets and intersections that could be affected by automobile or truck traffic to
Executive Summary. Overview
 Executive Summary Overview The Genesee-Finger Lakes Diversion Route Initiative identifies the most suitable diversion routes for Principal Arterial roads in the nine-county Genesee-Finger Lakes Region.
ASSESSING THE IMPACT OF SECURITY MEASURES AT GATES OF SEAPORTS ON TRAFFIC OPERATION
 ASSESSING THE IMPACT OF SECURITY MEASURES AT GATES OF SEAPORTS ON TRAFFIC OPERATION Dr. Arun Chatterjee Professor Emeritus Dept of Civil & Environmental Engineering The University of Tennessee Knoxville,
MULTIMODAL NEEDS ASSESSMENT
 6. FREIGHT INTRODUCTION Transportation systems not only move people throughout a region, but they also support the movement of goods in the form of freight, which is a vital component of the region s economy
Forecast and Capacity Planning for Nogales Ports of Entry
 Forecast and Capacity Planning for Nogales Ports of Entry Rene Villalobos, Arnie Maltz*, L.J. Xue, Octavio Sanchez Industrial Engineering Department * Supply Chain Department Arizona State University October
Improved Road Condition Reporting
 SD2001-15-X Connecting South Dakota and the Nation South Dakota Department of Transportation Office of Research Improved Road Condition Reporting Study SD2001-15 Executive Summary Prepared by University
INTERSTATE CORRIDOR PLANNING
 INTERSTATE CORRIDOR PLANNING Prioritization of Corridor Studies July 29, 2015 Importance of the Interstate System Texas is an integral part of the national interstate system. The interstate system provides
Origin-Destination Trips and Skims Matrices
 Origin-Destination Trips and Skims Matrices presented by César A. Segovia, AICP Senior Transportation Planner AECOM September 17, 2015 Today s Webinar Content Matrix Estimation Data sources Florida Application
USDOT Connected Vehicle Research Program Vehicle-to-Vehicle Safety Application Research Plan
 DOT HS 811 373 October 2011 USDOT Connected Vehicle Research Program Vehicle-to-Vehicle Safety Application Research Plan DISCLAIMER This publication is distributed by the U.S. Department of Transportation,
 WEBB COUNTY CITY OF LAREDO REGIONAL MOBILITY AUTHORITY 7917 McPherson Road, Suite 203 Laredo, Texas 78045 956-723-9841 November 30, 2016 The Honorable Anthony R. Foxx Secretary U.S. Department of Transportation
Port of Entry Inspections Process Improvements
 Port of Entry Inspections Process Improvements Gail Lewis Director, Office of P3 Initiatives and International Affairs Arizona Department of Transportation February 2017 Project Background - Problem Statement
IRRIS. White Paper GeoDecisions. Your Eye on Military Logistics and Transportation Security
 IRRIS White Paper 10. 21. 2004 GeoDecisions Your Eye on Military Logistics and Transportation Security Table of Contents 1 Introduction... 3 2 History of IRRIS... 4 3 IRRIS Components... 4 3.1 Geospatial
SIEMENS CONCERT: City of Seattle
 SIEMENS CONCERT: City of Seattle Use of ATMS to Enhance and Extend Signal Operations Abstract: Today s signal systems are part of a complex environment that includes varied and disparate data sources and
RFid based Toll Collection System
 For more Project details visit: http://www.projectsof8051.com/rfid-based-highway-toll-tax-collection-system/ Code Project Title 1515 RFid Based Highway Toll Tax Collection System Synopsis for RFid based
Innovations in Central Data Management for Truck Compliance and Mobility - Vehicle Information in Motion
 Michael Wieck International Road Dynamics, Inc. 7908 South Niagara Way, Centennial, CO 80112 303.905.7008 michael.wieck@irdinc.com Abstract Truck Compliance monitoring has matured in the US and elsewhere
Current Trends in Traffic Congestion Mitigation
 Current Trends in Traffic Congestion Mitigation April 24, 2009 NCSL Spring Forum Washington, DC Jeff Lindley Associate Administrator, Office of Operations Federal Highway Administration U.S. Department
TxDOT Harnesses IoE Capabilities to Improve Communication and Reduce Accident Levels
 TxDOT Harnesses IoE Capabilities to Improve Communication and Reduce Accident Levels EXECUTIVE SUMMARY Objectives Proactively communicate I-35 construction issues and traffic-flow status to general public
AGENCY: Federal Railroad Administration (FRA), Department of Transportation
, Department of Transportation") This document is scheduled to be published in the Federal Register on 03/22/2018 and available online at https://federalregister.gov/d/2018-05786, and on FDsys.gov 4910-06-P DEPARTMENT OF TRANSPORTATION
This document is scheduled to be published in the Federal Register on 03/22/2018 and available online at https://federalregister.gov/d/2018-05786, and on FDsys.gov 4910-06-P DEPARTMENT OF TRANSPORTATION
EXISTING AND FUTURE FREIGHT GOODS MOVEMENT ASSESSMENT
 Technical Memorandum EXISTING AND FUTURE FREIGHT GOODS MOVEMENT ASSESSMENT Prepared by: April 2014 TABLE OF CONTENTS 1. Introduction... 3 1.1 Study Purpose... 3 1.2 Data Reference List... 3 2. Data sources...
I know that you all understand the critical importance of the freight transportation system
 United States Senate Subcommittee on Surface Transportation and Merchant Marine Infrastructure, Safety and Security Testimony of Michael L. Ducker President and CEO FedEx Freight Corporation April 4, 2017
SMART WORK ZONE SOLUTIONS
 SMART WORK ZONE SOLUTIONS JAMLOGIC WHY USE JAMLOGIC IN SMART WORK ZONES? IN US WORKZONES, THERE WERE: 669 47,758 FATALITIES IN 2014 41% INJURIES IN 2013 OF FATAL CRASHES WERE REAR-END COLLISIONS IN 2014
REGIONAL ITS ARCHITECTURE FOR METROPOLITAN BOSTON
 Commonwealth of Massachusetts REGIONAL ITS ARCHITECTURE FOR METROPOLITAN BOSTON Metropolitan Boston Mitt Romney Governor Kerry Healy Lieutenant Governor IMPLEMENTATION PLAN MARCH 2005 1. Report No. OTP-ITS-05-009
Classifying California Truck Activity Using Loop Sensors
 Classifying California Truck Activity Using Loop Sensors Innovations in Freight Data Workshop: Technologies for Monitoring, Tracking, and Data Collection Andre Tok May 17th, 2017 Trailer Configurations
US 75 Integrated Corridor Management System Using Technology and Partnership to Maximize Transportation System Capacity
 US 75 Integrated Corridor Management System Using Technology and Partnership to Maximize Transportation System Capacity Ahmad Sadegh, Ph.D. Schneider Electric US 75 Corridor Networks Freeway with continuous
SR 99 Incident Response After- Action Plan
 SR 99 Incident Response After- Action Plan Background On June 10, 2014 at 1:52 PM, a pickup truck and a passenger car collided on southbound SR 99 (E Marginal Way S), just south of S Spokane St. The SDOT
Safety. Introduction. Total System
 Safety Introduction Ohio is the 35 th largest state in the nation based on geographic size, however it carries the 5 th largest total traffic volume and the 4 th largest truck traffic volume. With such
Preparing our Roadways for Connected and Automated Vehicles. 70th Annual Ohio Transportation Engineering Conference Bob Edelstein
 Preparing our Roadways for Connected and Automated Vehicles 70th Annual Ohio Transportation Engineering Conference Bob Edelstein Agenda Overview Intelligent Network Management Emerging Vehicle Technology
International Supply Chain Security. Sean Moon Office of Policy Development Cargo, Maritime & Trade
 International Supply Chain Security Sean Moon Office of Policy Development Cargo, Maritime & Trade June 19, 2008 Creating a Context What is Security Infrastructure? The fundamental structure of security
PRELIMINARY REVIEW COPY
 PRELIMINARY REVIEW COPY 1. Report No. FHWA/TX-06/0-5176-S Technical Report Documentation Page 2. Government 3. Recipient s Catalog No. Accession No. 4. Title and Subtitle Conversion of Volunteer-Collected
NATMEC June 30, 2014 Anita Vandervalk, PE, PMP
 NATMEC June 30, 2014 Anita Vandervalk, PE, PMP Agenda 1. Florida s MPM Program 2. Research Efforts and Progress 3. Source Book 4. Transitioning to Real Time Data 5. Next Steps Importance of Mobility Providing
AVL and 511PA in Winter and Incident Management. National Winter Maintenance Peer Exchange September 12, 2017 Pittsburgh, Pennsylvania
 AVL and 511PA in Winter and Incident Management National Winter Maintenance Peer Exchange September 12, 2017 Pittsburgh, Pennsylvania PennDOT Winter Operations Includes all PennDOT Districts and Executive
Concept of Operations
 Concept of Operations Monitoring Traffic in Work Zones: The icone System September 30, 2009 Prepared for: Minnesota Department of Transportation Prepared by: SRF Consulting Group, Inc. Project No. 6845
APPENDIX A: SHORT-TERM PROJECT DEPLOYMENTS
 APPENDIX A: SHORT-TERM PROJECT DEPLOYMENTS Page 1 of 15 ST-01: I-95 ITS DEPLOYMENT (DE STATE LINE TO AIRPORT) PROJECT DESCRIPTION AND SCOPE: Project will address gaps in ITS device coverage on I-95 from
INTELLIGENT TRANSPORTATION SYSTEMS SUMMARY
 Genesee County Shaping our Transportation Future Together 2035 Long Range Transportation Plan INTELLIGENT TRANSPORTATION SYSTEMS SUMMARY What is an Intelligent Transportation System? An Intelligent Transportation
Intelligent Transportation Systems Master Plan
 Space Coast Transportation Planning Organization Intelligent Transportation Systems Master Plan April 15, 2014 Version 1.0 Prepared for: Space Coast Transportation Planning Organization 2725 Judge Fran
March 4, Noticed of Proposed Rulemaking Hours of Service for Drivers (Docket No. FMCSA )
") March 4, 2011 Docket Management Facility (M 30) U.S. Department of Transportation West Building Ground Floor Room W12 140 1200 New Jersey Avenue, SE Washington, DC 20590 0001 RE: Noticed of Proposed Rulemaking
March 4, 2011 Docket Management Facility (M 30) U.S. Department of Transportation West Building Ground Floor Room W12 140 1200 New Jersey Avenue, SE Washington, DC 20590 0001 RE: Noticed of Proposed Rulemaking
Washington Metropolitan Area Transit Authority Board Action/Information Summary
 Washington Metropolitan Area Transit Authority Board Action/Information Summary Action Information MEAD Number: 200617 Resolution: Yes No TITLE: Incident Management and Communications Update PRESENTATION
TEXAS MEXICO TRANSPORTATION BORDER MASTER PLAN UPDATE
 TEXAS MEXICO TRANSPORTATION BORDER MASTER PLAN UPDATE Border Trade Advisory Committee Footer Text Date Background Information: May 31, 2017 Previous border master plans (2013 / 2014) Primarily focused
Presentation Outline VISION. Leveraging Electronic Technology to Improve HM Transportation Safety & Security
 Leveraging Electronic Technology to Improve HM Transportation Safety & Security Ryan F. Paquet, PG Assist. International Standards Coordinator, Pipeline and Hazardous Materials Safety Administration (PHMSA)
Greater Charlotte Regional Freight Mobility Plan
 1 Greater Charlotte Regional Freight Mobility Plan Identifies key regional issues and transportation system constraints; Recommends projects, programs, and policies; and Establishes a regional collaborative
PAG REGIONAL TRANSPORTATION SECURITY PLAN
 PAG REGIONAL TRANSPORTATION SECURITY PLAN 2017 The purpose of this plan is to provide an overview of transportation security in the Tucson metropolitan region, and to discuss security-related issues and
Solution Overview : The IBM Government Industry Framework
 Meng Tay Software Consultant IBM Vietnam Solution Overview : The IBM Government Industry Framework 2010 IBM Corporation Challenges governments face in this economic environment Reduce costs Virtualization
WISCONSIN DOT PUTTING RESEARCH TO WORK
 Freight Model Improvement Project for ECWRPC Jessica Guo, Ph.D., Walt Raith, Qi Gong, and Jason Bittner University of Wisconsin-Madison WisDOT ID no. 0092-10-14 CFIRE ID no. 03-08 August 2011 Research
2015 ATSSA Traffic Expo Report
 2015 ATSSA Traffic Expo Report February 8-10, 2015 Tampa, Florida By: Victor Lund, St. Louis County Traffic Engineer Submitted: February 11, 2015 Sunday, February 8, 2015 Power Talk Grassroots Advocacy:
California TRU Guidance
 California TRU Guidance California Air Resources Board Guidance for Brokers, Forwarders, Shippers, Receivers, and Drivers - Chris Burroughs TIA Senior Government Affairs Manager TIA White Paper Series
Ontario Québec Smart Corridor Corridor Intelligent. Concept of Operations Stakeholder Workshop Series II October 2011
 Agenda Segment Arrivals Duration Introductions 9:30-9:45 What We have Heard So Far 9:45-10:15 Stakeholder/Inventory Validation 10:15-11:00 Break 11:00-11:15 Operational Concepts 11:15-11:30 User Views
Connected/Autonomous Vehicles in a
 Connected/Autonomous Vehicles in a Freight Corridor: Implementation Issues and Assumptions presented to ITS 3C Summit 2014 Mobile, AL presented by Cambridge Systematics, Inc. Kenny Voorhies, PE, PTOE September
Data processing. In this project, researchers Henry Liu of the Department of Civil Engineering and
 Data mining of transit vehicle location, passenger count, and fare collection databases for intelligent transportation applications Supporting efficient transit service by maximizing the use of available
Travel Time Reliability in the SLOCOG Region. October 27, 2014 San Luis Obispo Council of Governments Transportation Education Series
 Travel Time Reliability in the SLOCOG Region October 27, 2014 San Luis Obispo Council of Governments Transportation Education Series 1 Transportation Education Series - Agenda Grab Some Free Lunch!! Introductions
Niagara s Transportation Strategy 1. Introduction:
 Niagara s Transportation Strategy May 8, 2002 Niagara s Transportation Strategy 1. Introduction: Transportation is of pivotal importance in the development of Niagara. This, Niagara s first comprehensive
Congestion Management Plan Update. Public Works and Infrastructure Committee. General Manager, Transportation Services
 PW1.4 STAFF REPORT ACTION REQUIRED Congestion Management Plan 2014-2018 Update Date: December 9, 2014 To: From: Wards: Reference Number: Public Works and Infrastructure Committee General Manager, Transportation
Border & Port of Entry Transit of In-Bond Container Current Operations
 Border & Port of Entry Transit of In-Bond Container Current Operations CBSA authorizes Acme Shipping ocean vessel to be loaded in Rotterdam with containers that are destined for New Yorkand will pass through
An Application of ITS for Incident Management in Second-Tier Cities: A Fargo, ND Case Study
 30 MID-CONTINENT TRANSPORTATION SYMPOSIUM 2000 PROCEEDINGS An Application of ITS for Incident Management in Second-Tier Cities: A Fargo, ND Case Study SHAWN BIRST AND AYMAN SMADI Congestion on urban freeways,
Trade Transformation. CBP Initiatives for 21 st Century Trade. September 2012
 Trade Transformation CBP Initiatives for 21 st Century Trade September 2012 1 Evolving our Mission 2 A Day at the U.S. Border CBP protects more than: 5,000 miles of border with Canada 1,900 miles of border
TRAFFIC INCIDENT MANAGEMENT SYSTEM (TIMS)
") TRAFFIC INCIDENT MANAGEMENT SYSTEM (TIMS) GUIDELINES 1. Purpose A. Ensure that an Ohio Turnpike and Infrastructure Commission (OTIC) Guideline exists to manage traffic backups and travel delays. B. Ensure
TRAFFIC INCIDENT MANAGEMENT SYSTEM (TIMS) GUIDELINES 1. Purpose A. Ensure that an Ohio Turnpike and Infrastructure Commission (OTIC) Guideline exists to manage traffic backups and travel delays. B. Ensure
Dallas Integrated Corridor Management (ICM) Update
 Update") Dallas Integrated Corridor Management (ICM) Update North Central Texas Council of Governments Surface Transportation Technical Committee April 26, 2013 What is ICM? The integrated management of freeway,
Dallas Integrated Corridor Management (ICM) Update North Central Texas Council of Governments Surface Transportation Technical Committee April 26, 2013 What is ICM? The integrated management of freeway,
Understanding Big Data in Freight Transportation Task Force Mission, Goals, Findings
 Understanding Big Data in Freight Transportation Task Force Mission, Goals, Findings Transportation Research Board Annual Meeting Donald Ludlow, MCP, AICP January 10, 2017 Presentation Map What is Understanding
ADVANCED TRAVELLER INFORMATION SYSTEM FOR CHANDIGARH CITY USING GIS
 ADVANCED TRAVELLER INFORMATION SYSTEM FOR CHANDIGARH CITY USING GIS Bhupendra Singh 1, Ankit Gupta 2 and Sanjeev Suman 3 1 Former M.Tech. Student, Transportation Engineering, Civil Engineering Department,
Regional ITS Deployment Plan
 Regional ITS Architecture and Deployment Plan -Douglas County Region Regional ITS Deployment Plan Prepared by: April 25, 2008 069214001 Copyright 2008 by Kimley-Horn and Associates, Inc. All rights reserved.
National Capital Region Congestion Report
 NATIONAL CAPITAL REGION TRANSPORTATION PLANNING BOARD National Capital Region Congestion Report 2nd Quarter 2014 Metropolitan Washington Council of Governments 777 North Capitol Street, N.E., Suite 300,
WM2008 Conference, February 24-28, 2008, Phoenix, AZ. Commodity Flow Study Clark County, Nevada, USA
 Commodity Flow Study Clark County, Nevada, USA - 8402 Sheila Conway, Ph.D. Urban Environmental Research LLC 10100 West Charleston Boulevard Suite 200 Las Vegas, NV 89135 Irene Navis, AICP Planning Manager
1.1 Purpose of Study. Lower Rio Grande Valley Tamaulipas Border Master Plan
 Chapter 1. Introduction Border master plans as defined and supported by the U.S./Mexico Joint Working Committee (JWC) 1 on Transportation Planning and Programming, the Federal Highway Administration (FHWA),
for Law Enforcement KVE Developed by the Kentucky Transportation Center University of Kentucky in cooperation with the
 A Checklist for Law Enforcement Fire & Rescue EMS CRASH SITE Towing KYTC KVE Emergency Management Developed by the Kentucky Transportation Center University of Kentucky in cooperation with the Kentucky
Factors Affecting Transportation Decisions. Transportation in a Supply Chain. Transportation Modes. Road freight transport Europe
 Transportation in a Supply Chain Factors Affecting Transportation Decisions Carrier (party that moves or transports the product) Vehicle-related cost Fixed operating cost Trip-related cost Shipper (party
Smart Public Safety: Advanced Sensors, Automation and the Internet of Things (IoT) in NG9-1-1
 in NG9-1-1") Smart Public Safety: Advanced Sensors, Automation and the Internet of Things (IoT) in NG9-1-1 May 16, 2017 Bill Mertka Sr. Product Planning Consultant, Next Gen Public Safety Technologies The Need for
Smart Public Safety: Advanced Sensors, Automation and the Internet of Things (IoT) in NG9-1-1 May 16, 2017 Bill Mertka Sr. Product Planning Consultant, Next Gen Public Safety Technologies The Need for
Congestion Mitigation
 Congestion Mitigation Programs and Strategies By Craig Mizera October 12, 2007 Midwest Transportation Consortium Fall Scholars Conference Craig Mizera ii ABSTRACT Highway congestion impacts society, freight,
TEXAS FREIGHT MOBILITY PLAN. Greater Houston Freight Committee Kick-Off Meeting
 TEXAS FREIGHT MOBILITY PLAN Greater Houston Freight Committee Kick-Off Meeting July 11, 2016 Overview of Texas Freight Mobility Plan The Freight Plan is TxDOT's first multimodal transportation plan that
TEXAS FREIGHT MOBILITY PLAN IMPLEMENTATION. AAMPO Technical Advisory Committee (TAC)
") TEXAS FREIGHT MOBILITY PLAN IMPLEMENTATION AAMPO Technical Advisory Committee (TAC) October 7, 2016 Overview of Texas Freight Mobility Plan The Freight Plan is TxDOT's first multimodal transportation plan
TEXAS FREIGHT MOBILITY PLAN IMPLEMENTATION AAMPO Technical Advisory Committee (TAC) October 7, 2016 Overview of Texas Freight Mobility Plan The Freight Plan is TxDOT's first multimodal transportation plan
University of Kentucky 1 Southeastern Transportation Center Safety Performance in a Connected Vehicle Environment. FIGURE 1: V2V and V2I Connectivity
 PROBLEM STATEMENT The US Department of Transportation has advised planning agencies across the country to begin considering how their local transportation systems will function in a connected vehicle environment.
Tioga. NCFRP14 Truck Drayage Practices Preliminary Findings
 NCFRP14 Truck Drayage Practices Preliminary Findings The Group, Inc. Center for Transportation Research, Univ. of Texas, Austin University of South Carolina Transportation Research Board Summer Meeting
Twin Cities Regional Truck Corridors Study. MnDOT Metro Freight Studies Roundup
 Twin Cities Regional Truck Corridors Study MnDOT Metro Freight Studies Roundup February 3, 2017 Study Background Transportation Policy Plan Goal: The regional transportation system supports the economic
North America s SuperCorridor Coalition, Inc. Tri-national, non-profit, multi-modal trade and transportation coalition for the efficient and secure
 North America s SuperCorridor Coalition, Inc. Tri-national, non-profit, multi-modal trade and transportation coalition for the efficient and secure movement of freight NASCO s Mission & Purpose Mission:
Maximize Transportation System Capacity
 US 75 Integrated Corridor Management System Using Technology and Partnership to Using Technology and Partnership to Maximize Transportation System Capacity What is ICM? The integrated management of freeway,
U.S. 101 / San Mateo County Smart Corridor Project
 Department of Transportation District 4 - Traffic Operations October 1, 2013 U.S. 101 / San Mateo County Smart Corridor Project www.dot.ca.gov California Department of Transportation (Caltrans) Overview
Automated Permitting and Routing for OS/OW. GIS-T, 2010 Session Jay Adams - Oklahoma DOT
 Automated Permitting and Routing for OS/OW GIS-T, 2010 Session 4.3.1 Jay Adams - Oklahoma DOT Agenda Business Problem Project Background and Goals High-Level Needs Project Approach Expected Benefits Solution
The Cost Savings Potential of Sustainability Practices
 The Cost Savings Potential of Sustainability Practices The Sustainability Triple Bottom Line The Triple Bottom Line (TBL) means addressing Environmental, Economic and Social Equity dimensions of a project
Fleet Optimization with IBM Maximo for Transportation
 Efficiencies, savings and new opportunities for fleet Fleet Optimization with IBM Maximo for Transportation Highlights Integrates IBM Maximo for Optimizes asset life-cycle Can result in better up-time,