FORECASTING FUTURE FREIGHT GROWTH
|
|
|
- Marilyn Madeline Scott
- 6 years ago
- Views:
Transcription

1 Technical Memorandum FORECASTING FUTURE FREIGHT GROWTH Prepared by: June 2014
2 TABLE OF CONTENTS 1. Purpose and Data Sources Purpose Data Sources FAF LEHD Disaggregation Methodology Disaggregation Inputs Zonal Data FAF Version 3 Data LEHD and CBP Data Other Data Sources Disaggregation Procedure Development of Regression Equations Development of Expansion Factors Disaggregation Outputs Truck Imports/Exports Rail Imports/Exports Water Imports/Exports Air Imports/Exports APPENDIX A: Commodity Codes APPENDIX B: Acronyms i
3 Table of Contents LIST OF TABLES Table 2-1: 2011 Mode Values Table 2-2: 2040 Mode Values Table 2-3: Percent Change between 2011 and Table 3-1: Top 10 Commodity by Tonnage by Truck (2011) Table 3-2: Top 10 Commodity by Tonnage by Truck (2040) Table 3-3: Top 10 Export Trade Partners by Tonnage by Truck (2011) Table 3-4: Top 10 Import Trade Partners by Tonnage by Truck (2011) Table 3-5: Top 10 Internal Trade Partners by Tonnage by Truck (2011) Table 3-6: Top 10 Export Trade Partners by Tonnage by Truck (2040) Table 3-7: Top 10 Import Trade Partners by Tonnage by Truck (2040) Table 3-8: Top 10 Internal Trade Partners by Tonnage by Truck (2040) Table 3-9: Top 5 Commodity by Tonnage by Rail (2011) Table 3-10: Top 5 Commodity by Tonnage by Rail (2040) Table 3-11: Top 10 Export Trade Partners by Tonnage by Rail (2011) Table 3-12: Top 10 Import Trade Partners by Tonnage by Rail (2011) Table 3-13: Top 5 Internal Trade Partners by Tonnage by Rail (2011) Table 3-14: Top 10 Export Trade Partners by Tonnage by Rail (2040) Table 3-15: Top 10 Import Trade Partners by Tonnage by Rail (2040) Table 3-16: Top 5 Internal Trade Partners by Tonnage by Rail (2040) Table 3-17 : Total Water movement by tonnage, 2011 and Table 3-18 : Top Domestic Port Origins Table 3-19 : Total Air Movement by Tonnage, 2011 and LIST OF FIGURES Figure 1-1: Analysis Zones Used in FAF Figure 1-2: Overview of the FAF3 Freight Flow Matrix Construction Process... 3 Figure 1-3: Level of Population and Employment Concentration in the Study Area... 4 Figure 2-1: CORE MPO Travel Demand Model Traffic Analysis Zones... 7 Figure 2-2: Freight Districts of the Study Area... 8 Figure 2-3: FAF Disaggregated CSA Analysis Zone... 9 Figure 3-1: Truck Tons from the Study Area (2011) Figure 3-2: Truck Tons to the Study Area (2011) Figure 3-3: Rail Tons from the Study Area (2011) Figure 3-4: Rail Tons to the Study Area (2011) ii
4 1. PURPOSE AND DATA SOURCES 1.1 Purpose The Coastal Region Metropolitan Planning Organization (CORE MPO) Freight Transportation Plan will provide a road map for enhancing freight mobility within and outside of the study area (Bryan, Chatham and Effingham Counties) in an effort to improve the study area s economic competitiveness. It is critical to understand the freight movements coming into, out of, within, and through the study area. The lack of locally available data makes it necessary to consider other data sources such as the Freight Analysis Framework (FAF). However, the FAF is not reflective of movements at the county level. In FAF s existing format, the study area is part of an analysis zone consisting of Bryan, Chatham, Effingham, Liberty, and Long Counties. To draw meaningful conclusions using the FAF, it is necessary to divide the Savannah FAF analysis zone into freight districts by disaggregating the FAF database. These districts are a collection of Traffic Analysis Zones (TAZs) from the CORE MPO travel demand model. This technical memorandum details the disaggregation process. 1.2 Data Sources FAF The FAF is a Federal Highway Administration (FHWA) database to help users understand how the movement of freight affects the transportation system and where problems with the transportation system could affect the flow of freight. FAF Version 3 (FAF3) provides freight flow information for tonnage, value, and domestic ton-miles by region of origin and destination, commodity type, and mode for the baseline year of 2007, for 2011, and for five-year increments projected through The FAF analysis zones consist of 123 domestic areas that are divided into metro regions, state remainders and entire states. Metro regions consist of 74 metropolitan areas. The state remainders represent each of the state s territory outside of the metropolitan areas. Entire states are the 16 regions that do not have a metropolitan region. Figure 1-1 shows the analysis zones used in the FAF3. The FAF3 has a number of improvements to the commodity flow matrix over previous versions including: A roughly doubling of the number of U.S. shipping establishments sampled as part of the 2007 U.S. Commodity Flow Survey (CFS) from approximately 50,000 establishments in 2002 to approximately 100,000 establishments surveyed in 2007; 1
; Incorporation of additional federal datasets within an improved FAF3 log-linear modeling/iterative proportional fitting algorithm, as well as the development of estimates of flows for")
5 Purpose and Data Sources The use of Port Import/Export Reporting Service (PIERS) data 1 to support improved allocations of imports and exports to FAF domestic zones of freight origins (for U.S. exports) and destinations (for U.S. imports); Incorporation of additional federal datasets within an improved FAF3 log-linear modeling/iterative proportional fitting algorithm, as well as the development of estimates of flows for commodities that were out-of-scope for the 2007 CFS; Greater use of U.S. inter-industry input-output coefficients in estimating commodity flows that were out-of-scope for the 2007 CFS; and The FAF3 provides an origin-destination (O-D) specific treatment of natural gas products, which were evaluated only at the level of national or broad regional activity totals in the FAF2. Figure 1-1: Analysis Zones Used in FAF3 Source: Freight Analysis Framework,
 and commodity (43 Standard Classification of Transported Goods (SCTG)) definitions")
6 Purpose and Data Sources Figure 1-2 shows the FAF3 freight flow matrix construction process. The matrix construction begins with the data from the 2007 CFS, and uses the same geography (123 FAF domestic zones) and commodity (43 Standard Classification of Transported Goods (SCTG)) definitions as the CFS but uses a modified version of the CFS modal definitions. Figure 1-2: Overview of the FAF3 Freight Flow Matrix Construction Process LEHD Source: Freight Analysis Framework, The Longitudinal Employer Household Dynamics (LEHD) database is the result of a partnership between the U.S. Census Bureau and the States to provide high quality local labor market information and to improve the Census Bureau's economic and demographic data programs. The LEHD data is based on census data, government surveys, and different administrative sources. These administrative sources include Unemployment Insurance (UI) earnings data and Quarterly Census of Employment and Wages (QCEW) data. The point data in the LEHD summarizes employment for specific industry types by race, gender, and age; however, it is only available at the census block and the 2 digit North American Incorporation Census State (NAICS) code level. The intent of the file is to reflect the high employment locations for 3

7 Purpose and Data Sources specific industry types in the area. The LEHD data will provide information for both the economic analysis and the validation of the existing and forecasted FAF3 data. Produced by the U.S. Census Bureau, Figure 1-3 shows the combined level of activity of population and employment in the Savannah Metropolitan Area. For instance, the darker blue color would indicate a high concentration of employment and/or households in a particular area. Figure 1-3: Level of Population and Employment Concentration in the Study Area Source: LEHD, U.S. Census Bureau 4
8 2. DISAGGREGATION METHODOLOGY This section provides a description of the FAF disaggregation methodology, which utilizes the relationship between employment by industry and the commodities which those industries produce and consume. While the FAF3 data is available only at regional level, the employment data by industry is more readily available at smaller levels of geography. The U.S. Census Bureau provides County Business Patterns (CBP), a publicly available database that provides employment data by county by NAICS industry. Commercial and state data sources may also provide employment by NAICS or comparable industry classifications at smaller levels of geography. The employment data by industry would be aggregated and subsequently used in mathematical equations to ultimately estimate the commodity flow (i.e., freight tonnage) to and from a FAF3 analysis zone and the units of smaller geography in that FAF3 analysis zone. The equation represents a relationship between the FAF3 commodity shipments to and from a FAF3 analysis zone and the employment by industry in that FAF3 analysis zone. Essentially, the share of the smaller units of geography tonnage to the regional tonnage is used to disaggregate the freight flows from FAF3 analysis zones to the smaller units of geography within those FAF3 analysis zones. Therefore, the method described herein is suitable for disaggregating the FAF3 regional flows to derive flows to and from the counties and TAZs in the Savannah Combined Statistical Area (CSA) 2. The Savannah FAF 3 analysis zone (Savannah FAF Region in short) covers the same geographic area as the Savannah CSA - Bryan, Chatham, Effingham, Liberty, and Long Counties. The FAF3 database covers all 50 states including non-metropolitan areas. The FAF3 contains freight flow information for 2011 and for forecasts at five-year intervals from 2010 to 2040 using 2007 as the base year. The base year for the purposes of this analysis is It must be noted that the best way to understand freight flows is to collect local information via establishment surveys and other primary data collection methods, and the disaggregation methodology only provides a substitute for local data. Many researchers have noted that there may be weak relationships between commodity production/consumption and the economic indicator data, which are often used in the disaggregation procedure. For example, industry-specific employment is often used as an indicator variable for consumption or production within an industry. Outcomes have 2 A Combined Statistical Area (CSA) is a grouping of adjacent metropolitan and/or micropolitan statistical areas (MSAs). The United States Office of Management and Budget (OMB) defines combined statistical areas based on social and economic ties measured by commuting patterns between adjacent MSAs. The areas that combine retain their own designations as metropolitan or micropolitan statistical areas within the larger combined statistical area. The primary distinguishing factor between a CSA and an MSA is that the social and economic ties between the individual MSAs within a CSA are at lower levels than between the counties within an MSA. The Savannah CSA includes all of Bryan, Chatham, and Effingham Counties, along with small portions of Liberty and Long Counties. This report will illustrate and discuss the area in Section and Figure
9 Disaggregation Methodology found that for certain commodities there is not a strong correlation between the quantities of goods produced in an industry and the number of people employed in that industry. 2.1 Disaggregation Inputs The FAF disaggregation is a relationship between employment and commodities. The primary steps of disaggregation include linking freight activities with economic activities, the actual disaggregation of the FAF3 database to the district level, and the estimation of average shipment distance by mode on the multimodal network systems. The following sections describe the primary inputs to the disaggregation process Zonal Data As previously mentioned, the geographic portion of the FAF disaggregation used TAZs from the travel demand model. The TAZs have employment data as part of the socio economic attributes of the model. These TAZs were aggregated into common areas, which were referred to as freight districts. The freight districts have common industry types and employment characteristics, as well as some geographic boundaries. The freight districts were limited by political boundaries, major roadways such as interstates, or physical features such as rivers. Clustering smaller TAZs would increase the reliability of the disaggregation and its eventual results. The CORE MPO travel demand model has 796 internal TAZs populated by the 2010 base year socioeconomic data. The model area includes Chatham, Effingham, and Bryan Counties. Figure 2-1 illustrates the model TAZs. After aggregating the TAZs with input from the CORE MPO staff, the FAF disaggregation will have 48 freight districts in the study area. Figure 2-2 illustrates these freight districts. However, the federal CSA Boundary for Savannah (the same as the Savannah FAF Region) contains all of Bryan, Chatham, and Effingham Counties, along with small portions of Liberty and Long Counties. Figure 2-3 shows the freight districts of the study area as well as the portions of Long and Liberty Counties in the Savannah CSA. These districts the 48 freight districts for the three-county study area and the two additional counties will be used in the analysis as reflected in Section 3. 6

10 Disaggregation Methodology Figure 2-1: CORE MPO Travel Demand Model Traffic Analysis Zones Source: CORE MPO 7
11 Disaggregation Methodology Figure 2-2: Freight Districts of the Study Area Source: CDM Smith 8

12 Disaggregation Methodology Figure 2-3: FAF Disaggregated CSA Analysis Zone Source: CDM Smith 9
13 Disaggregation Methodology FAF Version 3 Data The FAF integrates data from a variety of sources to create a comprehensive picture of freight movement among states and major metropolitan areas by all modes of transportation. With data from the 2007 CFS and additional sources, the FAF3 provides estimates for tonnage, value, and domestic ton-miles by region of origin and destination, commodity type, and mode for 2007, 2011, and forecasts through One of the FAF3 metro regions is Savannah CSA 3 (Savannah FAF Region in short), which will be used in the disaggregation process and relate to all other regions throughout the nation. The FAF3 data currently shows a heavy truck influence in the Savannah FAF Region for The imports from 2011 data included coal not-elsewhere-classified (n.e.c.), crude petroleum and fuel oils. In contrast, exports included nonmetallic minerals, newsprint/paper and meat/seafood. Truck transportation was the heaviest used mode for both imports and exports. Table 2-1 and Table 2-2 show the kilotons (KTons) and millions of dollars (in the 2007 base year) for each domestic mode as the freight enters, exits, and stays within the Savannah FAF Region for the various years. Table 2-3 shows the percent change between the previous two tables by mode for tonnage and value Table 2-1: 2011 Mode Values Into Savannah FAF Out Of Savannah FAF Internal Region Region KTons $M KTons $M KTons $M Truck 37, , , , , ,878.6 Rail 7, , , , Water 3, , Air , Multiple modes & other 15, , , , , ,478.1 Source: Freight Analysis Framework, Table 2-2: 2040 Mode Values Into Savannah FAF Out Of Savannah FAF 2040 Region Region Internal KTons $M KTons $M KTons $M Truck 85, , , , , ,468.0 Rail 11, , , , , Water 2, , Air 6.5 1, , , ,305.0 Multiple modes & other 35, , , , , ,132.0 Source: Freight Analysis Framework, 3 The Savannah CSA Metro Region in FAF3 includes Bryan, Chatham, Effingham, Liberty and Long Counties. 10
14 Disaggregation Methodology Table 2-3: Percent Change between 2011 and 2040 Into Savannah FAF Out Of Savannah FAF 3. Mode/Pct Change Region Region Internal KTons $M KTons $M KTons $M Truck 126.0% 167.6% 111.6% 164.2% 87.3% 129.7% Rail 49.0% 94.3% 100.5% 189.6% 120.8% 111.9% Water -21.7% -22.0% 197.1% 12.5% 196.2% 214.3% Air 195.5% 172.6% 210.5% 213.3% - - Multiple modes & other 131.4% 203.7% 135.8% 199.1% 73.9% 36.9% As will be discussed in more detail within the modal sections, the majority of this tonnage for water and air are international movements coming into the Savannah FAF Region and moving out via other modes once the freight is off loaded domestically. For the purposes of the analysis, these international tons are captured in the truck and rail movements domestically. Domestic movements can be defined as having both origin and destination in the U.S LEHD and CBP Data The employment data used in the disaggregation is from the LEHD and the CBP. The LEHD is only available at the census block and the 2 digit NAICS code level. The CBP is available at 3 digit NAICS code level but does not go below the county level. Therefore, given the need to disaggregate the FAF database to the freight district level which is smaller than the county level, it is necessary to obtain the 3 digit NAICS at the FAF district level. To obtain the 3 digit NAICS at the freight district level, this freight study used the following process. First, the LEHD workplace characteristics information was aggregated from the census block to the freight district. This step provided 2 digit NAICS employment information at each of the freight district. The next step was to obtain the distribution of 3 digit NAICS employment in each 2 digit NAICS employment category for the counties in the study area. As a result, a listing of the distribution of 3 digit NAICS by 2 digit NAICS was obtained for each county. The distribution from the previous step was applied to each freight district 2 digit NAICS to obtain 3 digit NAICS employment information at each freight district. The resulting dataset was then used for disaggregation Other Data Sources The CBP does not provide the complete information for agricultural employment. To provide comprehensive information, the U.S. Department of Agriculture (USDA) data was used as the source of agricultural employment. For coal consumption, coal powered electric plants were used as the source for obtaining the megawatt-hours (MWh) of electricity generated from coal. This information was obtained from the Energy Information Agency (EIA) of the U.S. Department of Energy (DOE). 11
15 Disaggregation Methodology 3.2 Disaggregation Procedure The first step of disaggregation is to determine employment at the three digit NAICS for each FAF freight district, and the process to do so is detailed in Section The next step is to build a bridge between the employment information and the commodities in the FAF 3 report using the two digit SCTG and three digit NAICS. These relationships identify industries by disaggregating the origin and destination of freight shipments. The methodology develops regression equations for the 2011 FAF 3 SCTG commodity flows against NAICS employment for the 123 FAF 3 analysis zones. These regressions guide the development of factors for each commodity for the disaggregation of freight flow productions and attractions. For planning purposes, the grouping of the data into commodities will not be necessary, but more detailed information about SCTG commodity flows at the county level will be needed. The use of the factors developed with the regression equations will ensure that the disaggregation is consistent with observed data. The share of the origin and destination tonnage by industry for each of the counties within a specific FAF 3 analysis zone is applied to the reported FAF 3 regional tonnage, to obtain the disaggregated FAF 3 origin-destination (O-D) database Development of Regression Equations Regression equations were developed for each of the 42 commodity types. The commodity tonnage is the dependent variable. The independent variables include 2011 employment by three digit NAICS, total employment, 2011 population, and 2011 farm acreage and livestock information from the National Agricultural Statistics Service (NASS) database. The employment by three digit NAICS and total employment were derived from the 2011 CBP data. For a number of equations related to farming, the production and attraction equations fit poorly against farm employment, therefore farm acreage was used in those situations instead. Such a variable was originally derived from NASS database and then acres of farmland by county were aggregated to FAF 3 analysis zones. Linear regressions were developed using the origin tonnages (produced) and destination tonnages (attracted) and the employment by industry in each of the 123 FAF 3 analysis zones as the data for the regressions. The linear regressions were calculated using zero intercepts since it is assumed that an analysis zone with zero employment in an industry would not produce/attract any freight in the commodities associated with those industries. The complete 123 zones in FAF 3 were chosen because it was felt that the confidence in the relationships would be greater for the 123 data points as opposed to the single data point available for only the Savannah FAF Region. It was assumed that the regressions for each commodity group developed with the national data would be applicable to the Savannah area. Where needed, exceptions are noted. The equations were fitted to the observed annual tonnage for each of the 42 commodity groups. In all of these equations, the sample size is the number of FAF 3 analysis zones in the U.S. which is 123. The Make-Use table from the Bureau of Economic Analysis' Input-Output Model was used as guidance in the selection of independent 12
16 Disaggregation Methodology variables. After testing several variables, a final model was constructed on the basis of statistical significance, and sensible and logical judgment. For some commodities, it was decided to aggregate them in order to obtain a statistically significant industry category that is realistically involved in the production or attraction of the specific commodity. In addition, each coefficient's statistical significance (t-stat) is also given. The format for reading the equations are as follows: Productions (Commodity Group) = Coefficient1*Variable1 + Coefficient2*Variable2 + Coefficient3*Variable3 Attractions (Commodity Group) = Coefficient1*Variable1 + Coefficient2*Variable2 Most of the production of commodities in a region is a function of the employment in the industry directly associated with that commodity. For example, the production of paper shipments from a region is directly associated with the employment in the paper industry in that region. The attraction industries are different in that they are associated with the industries that consume that commodity. With some exceptions, only those employment categories that were statistically significant at the 95% confidence level was included as independent variables in the regression. In addition to NAICS 2-digit or NAICS 3-digit employment data, NASS data, population and total employment, the following aggregations of employment were also tested as independent variables in the regressions: Transportation (NAICS 481 to 499) Non-durable Manufacturing (NAICS 321 to 327) Durable Manufacturing (NAICS 331 to 339) The coefficients in the regression equations can be considered to be the annual thousands of tons produced, or consumed, by an employee in that industry. For some commodity groups, the relationship between the production/attraction of freight tonnage and the producing and consuming industries was quite strong. An example of this is the relationship between the origin (production) of nondurable goods tonnage and nondurable manufacturing employment, and the destination (attraction) of nondurable goods tonnage and consumer manufacturing and wholesale industry employment. Another example is that mixed freight is attracted to rail yards, airports (Transportation) and warehouses (Wholesale). Many of these relationships are supported by known relationships between production industries, consumption industries, and commodities as reflected in economic input-output models. 13
17 Disaggregation Methodology Development of Expansion Factors For use in disaggregating freight in the Savannah FAF Region 4, the production and attraction equations are applied to the region to estimate the thousands of tons that are produced or attracted. The estimates for FAF freight districts are summed to the Savannah FAF Region including counties. The ratio of county production or attraction to FAF 3 zone production or attraction is applied to the 123 by 123 zone FAF 3 origin-destination database to expand that FAF 3 zonal database to a 172 by 172 zone database including the 48 CORE MPO FAF freight districts as individual zones and two partial counties. The steps to this expansion are detailed below for each commodity group. Estimate the annual tonnage of each commodity produced P FDIST (i) or attracted A FDIST (j) for each Freight District (FDIST) using the production and attraction equations; Aggregate the FDIST productions P FDIST (i) and attractions A FDIST (j) to the Savannah FAF Region to create P FAF (i) and A FAF (j); Expand the FAF 3 Region matrix, FAF(k,l), to CORE MPO FDIST matrix, FDIST (i,j), as follows : If both origin i and destination j are in the Savannah FAF Region then FDIST(i,j)=[FAF(k,l)*PFDIST(i)/PFAF(i)* AFDIST(j)/ AFDIST(j)] If origin i is in the Savannah FAF Region but destination l is out of this region, then FDIST(i,l)=[ FAF(k,l)*PFDIST(i)/PFAF(i)] If origin k is out of the Savannah FAF Region but destination j is in this region, then FDIST(k,j)=[ FAF(k,l)*AFDIST(j)/AFAF(j)] This methodology was applied to the truck and rail modes. With the rail mode, it was assumed that rail terminals are available only at certain FDISTs and not applied region wide. For air and water, since the airport and port are in only one Freight District respectively (14 for air and 8 for water), it was assumed that all air and water movements coming into the Savannah FAF Region come to those freight districts and it was not disaggregated further. 4 Savannah FAF Region or Savannah FAF Analysis Zone includes Bryan, Chatham, Effingham, Liberty and Long Counties, as shown in Figure
18
19 4. DISAGGREGATION OUTPUTS The results of the disaggregation are a series of tables showing the commodity flow into and out of each FAF freight district by truck, rail, water, and air by commodity for 2011 and The top districts, commodities, and origin-destination pairs are shown in the following sections. 4.1 Truck Imports/Exports Truck transportation represents the largest mode share for freight to and from the Savannah FAF Region 5. Table 4-1 and Table 4-2 describe the trends in imports and exports by product by truck for the existing conditions (data from 2011) and for projected future conditions (data from 2040), respectively. Table 4-3 through Table 4-8 display the top trade partners (origin and destination pairs) of the total commodities moved for 2011 and 2040 by truck. Table 4-1 and Table 4-2 examine the Savannah FAF Region s economy, showing the top 10 commodities for imports and exports that occur within the area boundary via truck movement. Total imports increase from 37,663.7 KTons in 2011 to 85,123.1 KTons in 2040 using truck as the domestic mode choice. Nonmetallic Minerals remains the largest import (by tonnage) to use truck. From 2011 to 2040, it increases in its share of total import from 12.0 percent to 23.8 percent. The increase may suggest developing industries since other commodities continue to grow in total tonnage as well. Table 4-1: Top 10 Commodity by Tonnage by Truck (2011) Import Export Commodity KTons % of total Commodity KTons % of total Nonmetallic minerals 4, % Coal-n.e.c. 5, % Logs 3, % Mixed freight 3, % Nonmetal min. prods. 3, % Nonmetal min. prods. 1, % Waste/scrap 2, % Other foodstuffs 1, % Newsprint/paper 2, % Machinery 1, % Fertilizers 2, % Waste/scrap 1, % Gasoline 2, % Fuel oils % Fuel oils 1, % Nonmetallic minerals % Basic chemicals 1, % Newsprint/paper % Coal-n.e.c. 1, % Base metals % 5 Savannah FAF Region or Savannah FAF analysis zone includes Bryan, Chatham, Effingham, Liberty and Long Counties, as shown in Figure
20 Disaggregation Outputs Table 4-2: Top 10 Commodity by Tonnage by Truck (2040) Import Export Commodity KTons % of total Commodity KTons % of total Nonmetallic minerals 20, % Other foodstuffs 9, % Nonmetal min. prods. 7, % Nonmetal min. prods. 9, % Newsprint/paper 6, % Coal-n.e.c. 8, % Waste/scrap 6, % Mixed freight 8, % Logs 3, % Nonmetallic minerals 5, % Meat/seafood 3, % Machinery 5, % Plastics/rubber 3, % Newsprint/paper 4, % Gasoline 3, % Waste/scrap 3, % Basic chemicals 2, % Chemical prods. 3, % Fertilizers 2, % Furniture 3, % Total exports increase from 42,243.3 KTons in 2011 to 89,371.6 KTons in 2040 using truck as the domestic mode choice. Coal and petroleum products are the largest export (by tonnage) to use truck in 2011, as shown in Table 4-1; however, it only increases from 5,059.9 KTons to 8,824.9 KTons between 2011 and This commodity is outpaced by the rise of other foodstuffs (such as dairy products, sugar, oils, and coffee), whose export increases from 1,244.8 to 9,656.9 KTons, and nonmetal mineral products (such as ceramic and glass products) whose export increases from 1,835.4 to 9,312.0 KTons between 2011 and Table 4-3 and Table 4-4 show tonnage of the goods by origin and destination. Exports travel from the Savannah FAF Region and imports travel to the Savannah FAF Region. The freight districts are shown as origin and destination pairs to allow for a finer level of detail within the Savannah FAF Region. Please refer back to Figure 2-2 for an illustration of the freight districts. Table 4-3: Top 10 Export Trade Partners by Tonnage by Truck (2011) Origin Destination KTons Freight District 08 Atlanta, GA Freight District 16 Houston, TX Freight District 16 Atlanta, GA Freight District 16 State of Georgia Freight District 08 State of Georgia Freight District 14 Houston, TX Freight District 10 Atlanta, GA Freight District 10 Houston, TX Liberty County State of Georgia Freight District 10 State of Georgia
21 Disaggregation Outputs Table 4-4: Top 10 Import Trade Partners by Tonnage by Truck (2011) Origin Destination KTons Atlanta, GA Liberty County State of Georgia Liberty County Newark, NJ (New York) Liberty County State of Georgia Freight District State of Georgia Freight District State of South Carolina Liberty County State of South Carolina Freight District State of Georgia Freight District Atlanta, GA Freight District Newark, NJ (New York) Freight District Perhaps most notable in Table 4-4 are the common origins of Districts 08, 10, and 16 along with the common destinations of Atlanta and the rest of Georgia as major freight destinations for trucks. As we will discuss later, Freight District 08 is home to the port activities in the Savannah FAF Region. The O-D pairs in the table likely reflect the offloading of freight through the port onto truck for domestic delivery. This table begins to highlight a heavy truck movement from the Savannah FAF Region via I-16 WB and potentially I-95 SB. Liberty County, part of the Savannah FAF Region, was disaggregated as part of the process to make sure tonnages were properly associated with the county and not the freight districts in the threecounty study area. As shown in Table 4-5, Liberty County is a major destination for some truck movements from Atlanta, the rest of Georgia, South Carolina, and Newark. Table 4-5: Top 10 Internal Trade Partners by Tonnage by Truck (2011) Origin Destination KTons Liberty County Liberty County Freight District 08 Liberty County Freight District 16 Freight District Freight District 16 Freight District Freight District 08 Freight District Freight District 08 Freight District Freight District 10 Freight District Freight District 18 Liberty County Freight District 10 Freight District Freight District 14 Freight District Part of this freight equation includes analysis of the internal truck movements for the Savannah FAF Region, particularly between the freight districts in the three-county study area. Table 4-5 reflects the freight carried by trucks that originates in the Savannah FAF Region, and is also delivered within the 18
22 Disaggregation Outputs region. There are some intra-county and even intra-district O-D pairs in this table. Some freight will originate from Freight District 08, home to the port activities, and terminate in the other freight districts within the Savannah FAF Region. Tables 3-6 through 3-8 show the growth and change in trade partners in Perhaps most notable in Table 4-6 are the common origins of Districts 08, 10, and 16 (as mentioned in the analysis for 2011) along with the common destinations of Atlanta and the rest of Georgia as major freight destinations for trucks. Important items to note here are: 1) The increase of port movement to Atlanta, from KTons in 2011 to 2,413.2 KTons in 2040, and 2) The rise of Houston, TX as an export trade partner in future years. Table 4-6: Top 10 Export Trade Partners by Tonnage by Truck (2040) Origin Destination KTons Freight District 08 Atlanta, GA 2,413.2 Freight District 16 Houston, TX Freight District 16 Atlanta, GA Freight District 14 Houston, TX Freight District 08 State of Georgia Freight District 10 Atlanta, GA Freight District 10 Houston, TX Liberty County Atlanta, GA Liberty County State of Georgia Freight District 14 Atlanta, GA The major imports for the Savannah FAF Region will increasingly originate from the north in Newark, NJ metropolitan region ( Table 4-7). Trucks will take I-95 south to enter the Savannah area. This could reflect not only a potential need on the roadway aspect of this movement, but also an opportunity for the Port of Savannah as much of this freight may be originating from the Port of New York/New Jersey and be trucked down the coast. Table 4-8 reflects the freight carried by trucks that originates in the Savannah FAF Region and is also delivered within the region. The O-D pairs between the freight districts within the region for 2040 are similar to This table also reflects the potential growth of Liberty County in the region. Though the disaggregation process involves analysis for the whole Savannah FAF Region, the CORE MPO s Freight Transportation Plan focuses on freight movements in the three-county study area (Bryan, Chatham and Effingham). Figure 4-1 and Figure 4-2 show the truck tons into and out of the three-county study area for
23 Disaggregation Outputs Table 4-7: Top 10 Import Trade Partners by Tonnage by Truck (2040) Origin Destination KTons Newark, NJ (New York) Liberty County 3,654.8 Newark, NJ (New York) Freight District 14 1,557.2 Newark, NJ (New York) Freight District 16 1,467.3 Newark, NJ (New York) Freight District 10 1,169.7 Atlanta, GA Liberty County Newark, NJ (New York) Freight District Newark, NJ (New York) Freight District Newark, NJ (New York) Freight District State of Georgia Liberty County State of Georgia Freight District Table 4-8: Top 10 Internal Trade Partners by Tonnage by Truck (2040) Origin Destination KTons Liberty County Liberty County Freight District 08 Liberty County Freight District 08 Freight District Freight District 16 Freight District Freight District 16 Freight District Freight District 08 Freight District Freight District 18 Liberty County Freight District 16 Liberty County Freight District 10 Liberty County Freight District 10 Freight District
24 Disaggregation Outputs Figure 4-1: Truck Tons from the Study Area (2011) Source: CDM Smith 21
 Source: CDM Smith 22")
25 Disaggregation Outputs Figure 4-2: Truck Tons to the Study Area (2011) Source: CDM Smith 22
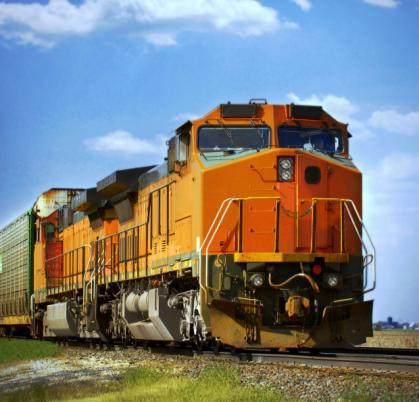
26 Disaggregation Outputs 4.2 Rail Imports/Exports Truck transportation represents the largest mode share for freight to and from the Savannah FAF Region. However, rail transportation provides another important mode. Table 4-9 and Table 4-10 describe the trends in imports and exports by product by rail for existing conditions (data from 2011) and for projected future conditions (data from 2040), respectively. Table 4-11 through Table 4-16 display the top origin and destination pairs of the total commodities moved for 2011 and 2040 by rail. Table 4-9 and Table 4-10 examine the Savannah FAF Region s economy by showing the top five commodities for imports and exports that occur via rail movement. Total imports increase from 7,731.6 KTons in 2011 to 11,516.8 KTons in 2040 using rail as the domestic mode choice. Fertilizers and Newsprint/paper supplies are the top two commodities imported in both years. Table 3-9 shows 2,681.8 KTons of Fertilizers were imported in 2011, accounting for 34.7 percent of the total. While the 2040 import tonnage for Fertilizers remains similar (2,787.0 KTons), its share decreases to 24.3 percent. From 2011 to 2040, newsprint and paper supplies will double in import tonnage from 1,464.5 KTons in 2011 to 2,861.7 KTons in 2040, with its share of import increased to 24.9 percent. Table 4-9: Top 5 Commodity by Tonnage by Rail (2011) Import Export Commodity KTons % of total Commodity KTons % of total Fertilizers 2, % Newsprint/paper % Newsprint/paper 1, % Coal-n.e.c % Nonmetallic minerals % Basic chemicals % Gravel % Other foodstuffs % Basic chemicals % Nonmetallic minerals % Table 4-10: Top 5 Commodity by Tonnage by Rail (2040) Import Export Commodity KTons % of total Commodity KTons % of total Newsprint/paper 2, % Other foodstuffs 1, % Fertilizers 2, % Newsprint/paper 1, % Gravel 1, % Basic chemicals % Nonmetallic minerals 1, % Nonmetallic minerals % Basic chemicals % Chemical prods % Total exports increase from 2,926.4 KTons in 2011 to 5,866.8 KTons in 2040 using rail as the domestic mode choice. Newsprint/paper is the largest export commodity (by tonnage) to use rail in However it only increases from KTons to 1,293.0 KTons between 2011 and This commodity is outpaced by the rise of other foodstuffs (such as dairy products, sugar, oils, and coffee), which increases from to 1,574.1 KTons between 2011 and This is a similar occurrence to projected exports for truck in Table
27 Disaggregation Outputs Table 4-11 and Table 4-12 show tonnage of the goods by origin and destination. Exports travel from the Savannah FAF Region and imports travel to the region. The freight districts are shown as origin and destination pairs to allow for a finer level of detail within the Savannah FAF Region. Please refer back to Figure 2-2 for an illustration of the freight districts. Table 4-11: Top 10 Export Trade Partners by Tonnage by Rail (2011) Origin Destination KTons Freight District 08 Atlanta, GA Freight District 22 Atlanta, GA Freight District 16 Atlanta, GA Freight District 08 Houston, TX 81.3 Freight District 22 Houston, TX 80.3 Freight District 08 Minneapolis, MN 80.1 Freight District 22 Minneapolis, MN 74.2 Freight District 08 State of Georgia 54.7 Freight District 16 Houston, TX 54.1 Freight District 27 Atlanta, GA 51.3 Table 4-12: Top 10 Import Trade Partners by Tonnage by Rail (2011) Origin Destination KTons Baton Rouge, LA Freight District Baton Rouge, LA Freight District Baton Rouge, LA Freight District New Orleans, LA Freight District State of Virginia Freight District New Orleans, LA Freight District New Orleans, LA Freight District State of Georgia Freight District State of Georgia Freight District State of Florida Freight District Perhaps most notable in Table 4-11 are the common origins of Districts 08, 16, and 22 along with the common destinations of Atlanta and Houston as freight destinations for rail. As mentioned previously, Freight District 08 is home to the port activities in the Savannah FAF Region. The O-D pairs in the table likely reflect the offloading of freight through the port onto rail for domestic delivery. Likewise, Table 4-12 shows similar origins of Baton Rouge, New Orleans, and Georgia (non-atlanta) that are moving freight to the Savannah FAF Region via rail. Many of these imported goods are going to the same Freight Districts of 08, 16, and
28 Disaggregation Outputs Table 4-13 shows only the top five O-D pairs from freight district to freight district since the distance within the region is not great enough to make rail a viable mode for intra-study area movements. Most of the internal movements are between the yard areas of Freight District 02, 16, and 22, along with the port-based Freight District 08. District 02 contains warehouse and industrial plants, such as BASF and Conoco-Phillips, which produce tons of freight for distribution, mainly by rail. Table 4-13: Top 5 Internal Trade Partners by Tonnage by Rail (2011) Origin Destination KTons Freight District 02 Freight District Freight District 02 Freight District Freight District 08 Freight District Freight District 08 Freight District Freight District 02 Freight District Table 4-14 shows the projected 2040 top export O-D pairs for rail freight movements. While the origins are similar to 2011, as shown in Table 4-11, the destinations change slightly with the rise of Tennessee as a top destination for the Savannah FAF Region s freight. The overall export growth in all O-D pairs is reflected evenly. Table 4-14: Top 10 Export Trade Partners by Tonnage by Rail (2040) Origin Destination KTons Freight District 08 Atlanta, GA Freight District 22 Atlanta, GA Freight District 08 Houston, TX Freight District 22 Houston, TX Freight District 08 State of Tennessee Freight District 22 State of Tennessee Freight District 08 Minneapolis, MN Freight District 16 Atlanta, GA Freight District 22 Minneapolis, MN Freight District 16 Houston, TX Table 4-15 shows the projected 2040 top import O-D pairs for rail freight movements. This table is very similar to Table 4-12 in both O-D pairs and tonnage. Most notable here though is the growth of rail freight moving out of Virginia and into the Savannah FAF Region, specifically to Freight District 16. In 2040, KTons will move by rail from Virginia to the Savannah FAF Region. This almost doubles the KTons in Table 4-16 shows only the top 5 O-D pairs of rail freight movements for 2040 between freight districts. 25
29 Disaggregation Outputs As mentioned before, the CORE MPO s Freight Transportation Plan focuses on freight movements in the three-county study area (Bryan, Chatham and Effingham). Figure 4-3 and Figure 4-4 show the rail tons into and out of the study area for Table 4-15: Top 10 Import Trade Partners by Tonnage by Rail (2040) Origin Destination KTons Baton Rouge, LA Freight District Baton Rouge, LA Freight District Baton Rouge, LA Freight District State of Virginia Freight District State of Georgia Freight District State of Georgia Freight District New Orleans, LA Freight District New Orleans, LA Freight District New Orleans, LA Freight District State of Georgia Freight District Table 4-16: Top 5 Internal Trade Partners by Tonnage by Rail (2040) Origin Destination KTons Freight District 02 Freight District Freight District 02 Freight District Freight District 08 Freight District Freight District 08 Freight District Freight District 02 Freight District
30 Disaggregation Outputs Figure 4-3: Rail Tons from the Study Area (2011) Source: CDM Smith 27
31 Disaggregation Outputs Figure 4-4: Rail Tons to the Study Area (2011) Source: CDM Smith 28
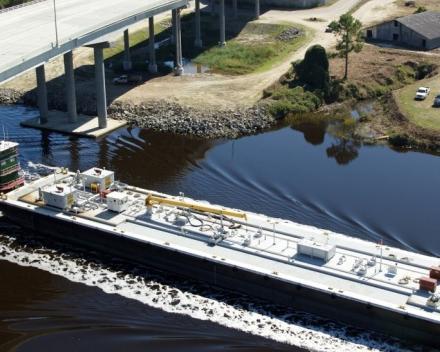
32 Disaggregation Outputs 4.3 Water Imports/Exports Waterborne freight is a major economic engine for not only the Savannah FAF Region, but also the State of Georgia. Savannah s port is a top five port nationally for capacity and freight movement 6. For this study, all water activity is located within Freight District 8, which is the location of all port terminals. For 2011, 31,561.6 KTons of freight came into the Port of Savannah while 19,238.6 KTons shipped out of the port to other destinations, as shown in Table The major import (approximately 40 percent) is Coal (SCTG #19) via North and South American markets, as well as Africa. The principal exports from the Savannah area are nonmetallic materials and Newsprint/paper at 33 and 24 percent respectively of all exports. In 2040, the international imports are expected to be surpassed by the exports in the Savannah FAF Region. Total imports are expected to be 70,097.0 KTons while exports are projected to reach 67,997.5 KTons. The principal commodities are the same, but Furniture is an emerging import while waste/scrap is a growing export commodity group. Table 4-17 : Total Water movement by tonnage, 2011 and 2040 Freight Movement Total Change Annual Growth International Import 28, , % 3.02% Export 19, , % 4.45% Domestic Import 3, , % -0.83% Export % 3.85% Total Import 31, , % 2.79% Export 19, , % 4.45% The vast majority of this tonnage was international freight movements coming into the port and moving out via other modes once the freight is off loaded domestically. For this study, these international tons are captured in the truck and rail movements domestically. Domestic water movements are actual O-D pairs between two U.S. locations of the origins and destinations. Overall, the port growth is projected to increase three percent annually on imports and approximately 4.5 percent on exports. This is driven by the port s international movements to foreign markets, but it is important to note the decrease in domestic imports to the port. Domestic imports to the Port of Savannah s terminal locations totaled slightly over 3,000 KTons in The largest domestic imports include coal shipments from Beaumont, TX (Port of Beaumont) and Delaware (likely the Port of Wilmington). However, each of these origin-destination pairs is projected to decrease out to 2040, as shown in Table The port does project a small increase in domestic imports of paper products from Florida (12 KTons)
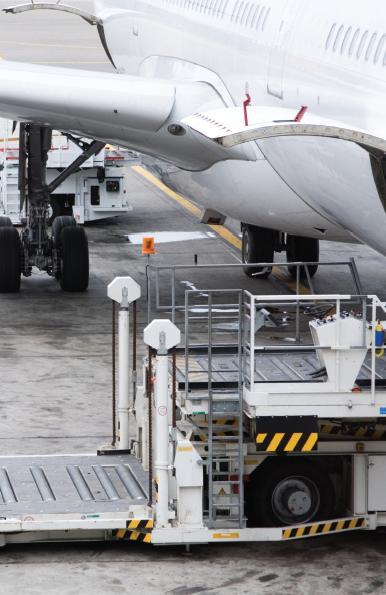
33 Disaggregation Outputs Table 4-18 : Top Domestic Port Origins Origin Top Commodities Shipped Beaumont, TX Coal and petroleum products 2, ,083.2 State of Delaware Coal and petroleum products State of Florida Pulp, newsprint, paper, and paperboard Domestic exports from the port are smaller in scale. Freight is primarily moved out of the port to other local areas (via barge perhaps). The major export destination is Honolulu, HI. Coal and petroleum products are shipped out of the port and carried west. In 2011, this movement totaled only 0.12 KTons. This shows that the vast majority of exports are staying in the Georgia area. Most of these exports are nonmetallic minerals (at an estimate 5.3 KTons in 2011) and nonmetallic mineral products (1.3 KTons in 2011). These commodity groups and trade partners are projected to continue through Exports of nonmetallic minerals are projected to increase to 17.5 KTons, more than triple the tonnage of Nonmetallic mineral products will double in export to 2.6 KTons by Air Imports/Exports The Savannah / Hilton Head International Airport (SAV) is the center for commuter air travel in the Coastal Empire of Georgia, the Golden Isles and South Carolina s Low Country 7. It is also a major air freight destination for the Savannah FAF Region. The physical carriage of goods in this mode occurs on dedicated, cargo configured aircraft or in the belly or luggage compartments of passenger aircraft. Aside from the five commuter carriers that service the airport, the SAV has small firms and major industry providers (such as FedEx and DHL) who serve the airport too. For this study, all air cargo activity is located within Freight District 14, which is the location of the airport. For 2011, 4.1 KTons of air cargo came into the Savannah FAF Region while 5.8 KTons flew out of SAV to other destinations, as shown in Table Compared to other modes, air products are typically time sensitive, smaller, lighter and more expensive than the bulk items. This explains the small tonnages and the commodity mix. Domestic air cargo has many O-D pairs between SAV and the other U.S. airports. The largest import region for SAV s air freight is Pennsylvania, while the greatest export partner for SAV in 2011 was Massachusetts. The commodity to Massachusetts was Base Metal in Primary or Semi-Finished Forms and in Finished Basic Shapes, accounting for one-third of SAV s export tonnage. The principal international import is other agricultural products, which are items such as vegetables and nuts and fresh cut flowers, at 0.8 KTons. The international export is machinery, such as pumps and refrigeration units, at 0.6 KTons
EXISTING AND FUTURE FREIGHT GOODS MOVEMENT ASSESSMENT
 Technical Memorandum EXISTING AND FUTURE FREIGHT GOODS MOVEMENT ASSESSMENT Prepared by: April 2014 TABLE OF CONTENTS 1. Introduction... 3 1.1 Study Purpose... 3 1.2 Data Reference List... 3 2. Data sources...
Disaggregate State Level Freight Data to County Level
 Disaggregate State Level Freight Data to County Level October 2013 Shih-Miao Chin, Ph.D. Ho-Ling Hwang, Ph.D. Francisco Moraes Oliveira Neto, Ph.D. Center for Transportation Analysis Oak Ridge National
Central Minnesota. Regional Freight Profile
 Central Minnesota Regional Freight Profile Working DRAFT May 21 Minnesota Department of Transportation The purpose of the Central Regional Freight Profile is to document freight movement trends in the
PROJECTS. The KIPDA MPO s Central Location
 PROJECTS Freight The economy of the Louisville KY-IN) Metropolitan Planning Area MPA), similar to that of the United States as a whole, is largely dependent on the efficient, reliable, and safe movement
Missouri Freight Transportation Economy on the Move. Waterway Freight. Missouri Economic Research and Information Center
 Missouri Freight Transportation Economy on the Move Waterway Freight Waterway Industry Missouri is home to 14 public Port Authorities and over 200 private ports operating on over 1,000 miles of waterways
Eight County Freight Plan
 Eight County Freight Plan Blackhawk Hills Regional Council 2017 Fall Summit CPCS Team October 27, 2017 Timber Lake Playhouse Project Sponsors 2 Presentation Map The Eight County Freight Plan Work Plan
CORE MPO Freight Transportation Plan. Project Advisory Committee
 CORE MPO Freight Transportation Plan Project Advisory Committee May07 07, 2014 Agenda 9:30 9:45 Welcome Introductions 9:45 10:15 Why are you here? What is the Freight Transportation Plan Why are YOU Important
SWOT Analysis of Commodity Flow Datasets
 SWOT Analysis of Commodity Flow Datasets prepared for FDOT Transportation Statistics Office prepared by RS&H, Inc. 5/6/2015 Background Many users work with commodity flow data Modelers GIS analysts Policy
Failure to Act. Of current Investment Trends in. Airports, Inland Waterways, and Marine Ports. Infrastructure EXECUTIVE SUMMARY
 Failure to Act The economic impact Of current Investment Trends in Airports, Inland Waterways, and Marine Ports Infrastructure EXECUTIVE SUMMARY EXECUTIVE SUMMARY Air and waterborne transportation infrastructure
Chapter 1 Introduction
 Chapter 1 Introduction KEY POINTS The amount and value of freight are critical components of the overall economic health of Missouri. Missouri s multimodal freight system supports the movement of trucks,
Morris County Freight Profile
 Morris County Freight Profile 2040 Freight Industry Level Forecasts ABOUT THIS PROFILE The NJTPA has developed a set of alternative freight forecasts to support transportation, land use, and economic development
Modeling and Assessing the Cost of Delays on an Heavily Trafficked Intercity Truck Corridor
 Modeling and Assessing the Cost of Delays on an Heavily Trafficked Intercity Truck Corridor Frank Southworth & Denise A. Smith School of Civil & Environmental Engineering Georgia Institute of Technology
The Economic Impacts of Virginia s Maritime Industry
 The Economic Impacts of Virginia s Maritime Industry PORT COMMERCE Million Tons of Cargo Moved 0,00 Jobs $. Billion In Wages $. Billion In Spending $. Billion In State/Local Taxes.% of Virginia Gross State
Delaware Department of Transportation Agriculture Supply Chain Study: Transportation Supply Chain Analysis ihs.com
 IHS TRANSPORTATION CONSULTING Delaware Department of Transportation Agriculture Supply Chain Study: Transportation Supply Chain Analysis ihs.com Overview of Findings Delmarva Freight Summit June 24 th,
BHJ Freight Study. Ohio Conference on Freight
 BHJ Freight Study presented to Ohio Conference on Freight presented by Mike Paprocki, Brooke-Hancock-Jefferson Metropolitan Planning Commission Barb Sloan, Cambridge Systematics, Inc. September 20, 2011
The Point Intermodal River Port Facility at the Port of Huntington Project Benefit Cost Summary
 The Point Intermodal River Port Facility at the Port of Huntington Project Benefit Cost Summary The Lawrence County Port Authority 216 Collins Avenue South Point, Ohio 45638 P a g e Contents I. Base Case...
Subtask Report - Review of Sub-National Commodity Flow Data Development Efforts and National Freight-Related Data Sets.
 NCFRP 20: Developing Sub-National Commodity Flow Data Subtask Report Subtask Report - Review of Sub-National Commodity Flow Data Development Efforts and National Freight-Related Data Sets literature review
Florida Freight Supplychain Intermodal Model
 Florida Freight Supplychain Intermodal Model Innovations in Travel Modeling 2014 April 29, 2014 Introduction Support freight plan development Office of Freight Logistics and Passenger Operations Evaluate
Technical Report 7: Freight Mobility Final Adopted Plan
 2040 Long Range Transportation Plan Technical Report 7: Freight Mobility Final Adopted Plan January 2016 250 South Orange Avenue, Suite 200, Orlando, FL 32801 407-481-5672 www.metroplanorlando.com MetroPlan
MANUFACTURING IN IOWA
 MANUFACTURING IN IOWA NOVEMBER 2011 INSIDE: SECTOR SIZE 2 KEY INDUSTRIES EARNINGS 4 EXPORTS 5 JOB TRENDS 6 GDP TRENDS 7 COUNTY DEPENDENCE 3 8 OVERVIEW Iowa s competitive strengths in manufacturing emerged
Freight Analysis Framework for Major
 Report No. K-TRAN: KU-08-4 FINAL REPORT Freight Analysis Framework for Major Metropolitan Areas in Kansas Erin Wurfel Yong Bai, Ph.D., P.E. Luke Huan, Ph.D. Vince Buhr The University of Kansas Lawrence,
The State of the Logging Workforce in the Southern United States
 The State of the Logging Workforce in the Southern United States Dana Mitchell 1 and Erin J. Huffaker 2 Abstract There is a need to understand the current state of the logging industry. Many U.S. woods
INLAND WATERWAYS TRANSPORTATION: Our Competitive Advantage. Delbert R Wilkins Canal Barge Company Big River Moves Leadership Forum April 15, 2013
 INLAND WATERWAYS TRANSPORTATION: Our Competitive Advantage Delbert R Wilkins Canal Barge Company Big River Moves Leadership Forum April 15, 2013 INLAND WATERWAYS TRANSPORTATION: Our Competitive Advantage
AAPA Facilities Engineering Seminar & Expo
 AAPA Facilities Engineering Seminar & Expo Wade M. Battles New Orleans Nov 9, 2011 Opportunities for Port Growth Through Marine Highway Development ATKINS Who we are Global, full-service professional planning,
Regional Competitive Industry Analysis
 Regional Competitive Industry Analysis Baker, Union, and Wallowa Counties October 2017 Union Wallowa Baker Michael Meyers, Economist (503) 229-6179 michael.meyers@oregon.gov Jill Cuyler, Research Analyst
THE TRANSSHIPMENT PROBLEM IN TRAVEL FORECASTING: TOUR STRUCTURES FROM THE ONTARIO COMMERCIAL VEHICLE SURVEY
 THE TRANSSHIPMENT PROBLEM IN TRAVEL FORECASTING: TOUR STRUCTURES FROM THE ONTARIO COMMERCIAL VEHICLE SURVEY University of Wisconsin Milwaukee Paper No. 09-3 National Center for Freight & Infrastructure
Is This The New Normal?
 Is This The New Normal? Seventeenth Annual Freight and Logistics Symposium Minneapolis, MN December 6, 2013 Rosalyn Wilson r.wilson@delcan.com 703-587-6213 8618 Westwood Center Drive, Tysons, VA 22182
Estimating the Monetary Benefits of Reducing Delays on Heavily Trafficked Truck Freight Corridors in Georgia
 Estimating the Monetary Benefits of Reducing Delays on Heavily Trafficked Truck Freight Corridors in Georgia Contract # DTRT12GUTC12 with USDOT Office of the Assistant Secretary for Research and Technology
ST. LOUIS REGIONAL FREIGHT STUDY EXECUTIVE SUMMARY
 ST. LOUIS REGIONAL FREIGHT STUDY EXECUTIVE SUMMARY Components 2 Introduction 3 Why This Study Matters 4 Key Project Drivers 7 Regional Land Use and Transportation Context 9 Policy Recommendations 9 Freight
PORT INLAND DISTRIBUTION NETWORK SOUTH JERSEY SITE EVALUATION AND FEASIBILITY DEVELOPMENT STUDY. EXECUTIVE SUMMARY July 2003
 PORT INLAND DISTRIBUTION NETWORK SOUTH JERSEY SITE EVALUATION AND FEASIBILITY DEVELOPMENT STUDY NEW JERSEY DEPARTMENT OF TRANSPORTATION AND THE DELAWARE VALLEY REGIONAL PLANNING COMMISSION EXECUTIVE SUMMARY
Waterborne Commerce Statistics Center
 Waterborne Commerce Statistics Center Amy Tujague, Special Requests Project Manager Waterborne Commerce Statistics Center Navigation & Civil Works Decision Support Center USACE 30 March 2016 US Army Corps
The Port of Savannah Logistics Cluster Author: Dr. Jean Paul Rodriguez
 The Port of Savannah Logistics Cluster Author: Dr. Jean Paul Rodriguez 1. The Emergence of the Savannah Gateway: The port of Savannah is under the jurisdiction of the Georgia Ports Authority (GPA) and
4-Step Commodity Model Freight Forecasting
 Freight Forecasting Neda Masoud (nmasoud@uci.edu) Kate Hyun (khyun1@uci.edu) Professor Ritchie CEE290A University of California Irvine Generation Distribution Mode Split Assignment Total Production and
Dennis Leong, Toni Rice, and Kathleen Spencer March 27, 2013
 Dennis Leong, Toni Rice, and Kathleen Spencer March 27, 2013 Northwoods Rail Transit Commission (NRTC) Why study freight rail in northern Wisconsin? Counties in the study area Photo: Wisconsin State Historical
APPENDIX H: TRAVEL DEMAND MODEL VALIDATION AND ANALYSIS
 APPENDIX H: TRAVEL DEMAND MODEL VALIDATION AND ANALYSIS Travel demand models (TDM) simulate current travel conditions and forecast future travel patterns and conditions based on planned system improvements
Chapter 5 Oklahoma Economic Conditions and Freight Transportation
 2010 2035 Oklahoma Long Range Transportation Plan Chapter 5 Oklahoma Economic Conditions and Freight Transportation Background Economic Information Overview of Oklahoma Economy The Oklahoma economy has
Rail - What Does the Future Bring?
 Rail - What Does the Future Bring? Jeannie Beckett Sr. Dir., Inland Transportation Port of Tacoma Oct 18, 2007 The Rail Networks Railroads Media Blitz Print Ads TV Ads Radio Ads D:\aapa\ RailroadsPSA.wmv
Assessment of Houston Commodity Flows for Supply Chain Analyses
 This document provides an assessment of 29 commodity flows to assist with the identification of 10 supply chains for more detailed investigation as part of the Ports Area Mobility Study. The intent is
The Transportation dividend
 Prepared by AECOM Technical Appendices report February 2018 The Transportation dividend Transit investments and the Massachusetts economy Technical Appendix A economic Benefits Methodology and Results
Dynamics of Wheat and Barley Shipments on Haul Roads to and from Grain Warehouses in Washington State
 Dynamics of Wheat and Barley Shipments on Haul Roads to and from Grain Warehouses in Washington State Michael L. Clark Research Associate Eric L. Jessup SFTA Project Director and Kenneth L. Casavant SFTA
ALABAMA S DISTRIBUTION, LOGISTICS & TRANSPORTATION INDUSTRY OVERVIEW
 ALABAMA S DISTRIBUTION, LOGISTICS OVERVIEW Ace, Dollar General, Home Depot, Target, SYSCO, and Wal-Mart are among the nationally known companies with major distribution operations in the state. Alabama
CREATING A BLUEPRINT FOR CARGO-ORIENTED DEVELOPMENT
 Photo Credit: zman z28/flickr Creative Commons License CREATING A BLUEPRINT FOR CARGO-ORIENTED DEVELOPMENT IN THE MINNEAPOLIS M ST. PAUL REGION Metropolitan Council Meeting of the Whole, June 21 ABOUT
Context. Case Study: Albany, New York. Overview
 Case Study: Albany, New York Overview The Capital District, a four-county region surrounding Albany, New York, has experienced dramatic growth in vehicle-miles of travel (VMT) in recent years, which has
ECONOMIC IMPACT OF SC S FOREST PRODUCTS EXPORT CLUSTER
 ECONOMIC IMPACT OF SC S FOREST PRODUCTS EXPORT CLUSTER 1 Economic Impact of South Carolina s Forest Products Export Cluster (March 2018) Prepared by Dr. Eric McConnell Assistant Professor Louisiana Tech
CTS Freight and Logistics Symposium. Minneapolis, MN November 30, 2007
 CTS Freight and Logistics Symposium Minneapolis, MN November 30, 2007 Freight Analysis Freight Growth = Business Vitality District 7 Freight Project Goals Put in context of Statewide Freight Study (2005)
Industrial Energy Efficiency as a Resource by Region
 Industrial Energy Efficiency as a Resource by Region Garrett Shields and Robert D. Naranjo, BCS Incorporated Sandy Glatt, U.S. Department of Energy ABSTRACT The energy intensity of specific manufacturing
INCORPORATING TRUCK FLOWS INTO THE STATE-WIDE PLANNING TRAFFIC MODEL. December 2004 JHR Project 02-1
 INCORPORATING TRUCK FLOWS INTO THE STATE-WIDE PLANNING TRAFFIC MODEL December 2004 JHR 04-299 Project 02-1 Lisa Aultman-Hall Feng Guo Christopher O Brien Patrycja Padlo Brian Hogge This research was sponsored
Turnover and Output Measurement. for Freight Transport by Road. in Canada. Fred Barzyk
 Turnover and Output Measurement for Freight Transport by Road in Canada Fred Barzyk 21st Voorburg Group Meeting Wiesbaden, Germany October 9th to October 13th 2006 Background Transportation Division Responsible
Rail Solutions and America s Future Prosperity Michael O Malley, July 12, 2008
 1 Rail Solutions and America s Future Prosperity Michael O Malley, July 12, 2008 Freight Railroads Deliver Every Day In 2005, U.S. freight railroads hauled enough: Wheat to make more than 400 loaves of
Regional Competitive Industry Analysis
 Regional Competitive Industry Analysis Marion, Polk, and Yamhill Counties June 2017 Yamhill Polk Marion Michael Meyers, Economist (503) 229-6179 michael.meyers@oregon.gov Jill Cuyler, Research Analyst
Corridors of Statewide Significance: Introduction
 Virginia s Long-Range Multimodal Transportation Plan Corridors of Statewide Significance: Introduction Prepared for: Commonwealth Transportation Board Prepared by: Office of Intermodal Planning and Investment
Darrell Wilson AVP Government Relations The Future of Freight Panel August 26 th, 2014
 Darrell Wilson AVP Government Relations The Future of Freight Panel August 26 th, 2014 Railroads - Safe & Getting Safer RR Safety Trends: 2000-2013* Train accident rate Employee injury rate Grade crossing
Ohio Maritime Study. Ohio Transportation Engineering Conference (OTEC) October 10, 2017 Columbus, OH
 October 10, 2017 Columbus, OH") Ohio Maritime Study Ohio Transportation Engineering Conference (OTEC) October 10, 2017 Columbus, OH Presentation Map Context the Great Lakes Region Ohio Maritime Transportation Study What Overview Comes
Ohio Maritime Study Ohio Transportation Engineering Conference (OTEC) October 10, 2017 Columbus, OH Presentation Map Context the Great Lakes Region Ohio Maritime Transportation Study What Overview Comes
CALIBRATION OF THE GRAVITY MODEL FOR TRUCK FREIGHT FLOW DISTRIBUTION
 Research Report No. UVACTS-5-14-14 August 2002 CALIBRATION OF THE GRAVITY MODEL FOR TRUCK FREIGHT FLOW DISTRIBUTION by Shaohui Mao Dr. Michael J. Demetsky II A Research Project Report For the Mid-Atlantic
Trends in U.S. Tobacco Farming
 United States Department of Agriculture TBS-257-02 November 2004 Electronic Outlook Report from the Economic Research Service Trends in U.S. Tobacco Farming www.ers.usda.gov Tom Capehart Abstract Tobacco
Port of Baltimore and Economic Development
 Port of Baltimore and Economic Development Presentation to the National Conference of State Legislatures Fiscal Analysts Seminar Department of Legislative Services Office of Policy Analysis Annapolis,
TEXAS FREIGHT MOBILITY PLAN 2017
 TEXAS FREIGHT MOBILITY PLAN 2017 Texas Transportation Commission September 28, 2017 Overview of the Texas Freight Mobility Plan 2016 Plan First multimodal freight mobility plan Identified freight network,
TEXAS FREIGHT MOBILITY PLAN. Greater Houston Freight Committee Kick-Off Meeting
 TEXAS FREIGHT MOBILITY PLAN Greater Houston Freight Committee Kick-Off Meeting July 11, 2016 Overview of Texas Freight Mobility Plan The Freight Plan is TxDOT's first multimodal transportation plan that
Economic Contributions of Agriculture, Natural Resources and Food Industries in Polk County, Florida
 Economic Contributions of Agriculture, Natural Resources and Food Industries in Polk County, Florida Sponsored Project Report to Polk County, Florida Farm Bureau Alan W. Hodges, Ph.D., Extension Scientist
This plan document is available at: Oklahoma Department of Transportation Planning and Research Division 200 NE 21 st Street Oklahoma City, OK 73105
 The 2010-2035 Oklahoma Long Range Transportation Plan was approved by the Oklahoma Transportation Commission on December 6, 2010. This plan document is available at: Oklahoma Department of Transportation
TRUCKING DANGEROUS GOODS IN CANADA, 2004 to 2012 Sagal Searag, Gregory Maloney and Lawrence McKeown Statistics Canada
 TRUCKING DANGEROUS GOODS IN CANADA, 2004 to 2012 Sagal Searag, Gregory Maloney and Lawrence McKeown Statistics Canada Introduction Recent events have heightened public awareness concerning the transportation
Methodological Appendix Infrastructure Jobs Update
 Methodological Appendix Infrastructure Jobs Update Note: Methods used to classify infrastructure jobs, including specific occupations and industries, are described at greater length in Beyond Shovel-Ready:
Terminology. Supply Chain Resilience Transportation Interests
 Tim Snow Terminology Supply Chain Resilience Transportation Interests Supply Chain The sequence of processes involved in the production and distribution of a commodity Agricultural Supply Chain Resiliency
The Local and Regional Economic Impacts of the Port of Vancouver Marine Terminals
 The Local and Regional Economic Impacts of the Port of Vancouver Marine Terminals Prepared for: PORT OF VANCOUVER 3103 NW Lower River Road Vancouver, WA 98660 (360) 693-3611 Prepared by: MARTIN ASSOCIATES
NJ State Rail Plan. New Jersey Short Line Railroad Association Briefing September 12, 2012
 NJ State Rail Plan New Jersey Short Line Railroad Association Briefing September 12, 2012 Why a Rail Plan? Meets federal mandates Advances rail funding Provides a framework for investment Summarizes and
TECHNICAL MEMORANDUM #2
 t TECHNICAL MEMORANDUM #2 Existing Conditions and Trends with Regina Villa Associates Portscape, Inc March 2017 Technical Memorandum 2 EXISTING CONDITIONS AND TRENDS Massachusetts Freight Plan prepared
Final Recommendations Identification of Improvements, Strategies, and Solutions
 Identification of Improvements, Strategies, and Solutions Prepared by: December 2015 TABLE OF CONTENTS 1. Introduction... 1 1 2. Freight Policy Recommendations... 2 1 3. Freight Infrastructure Recommendations...
Appendix A NAICS Codes and Titles
 Appendix A NAICS Codes and Titles The current analysis of the US economy uses a classification system that is based on the 6-digit North American Industry Classification System (NAICS) introduced in year
RDC Economic Data. Data available from the MU Research Data Center
 RDC Economic Data Data available from the MU Research Data Center A Branch of the Kansas City RDC and a unit of the Federal Statistical Research Data Centers (FSRDC) MU Population, Education and Health
Overview of America s Freight Railroads
 Overview of America s Freight Railroads Association of American Railroads August 2017 Summary From one end of the country to the other, America is connected by the best freight rail system in the world.
A MODAL COMPARISON OF DOMESTIC FREIGHT TRANSPORTATION EFFECTS ON THE GENERAL PUBLIC EXECUTIVE SUMMARY. November 2007
 A MODAL COMPARISON OF DOMESTIC FREIGHT TRANSPORTATION EFFECTS ON THE GENERAL PUBLIC EXECUTIVE SUMMARY November 2007 Prepared by CENTER FOR PORTS AND WATERWAYS TEXAS TRANSPORTATION INSTITUTE 701 NORTH POST
The Economic Impact of Privately-Owned Forests in the United States
 The Economic Impact of Privately-Owned Forests in the United States The Economic Impact of Privately-Owned Forests in the United States Prepared for: National Alliance of Forest Owners Contact: Gretchen
Federal surface transportation legislation, which emphasized freight as a factor that states must consider in the transportation planning process;
 1.0 Introduction Over the last decade, the incorporation of freight issues into the transportation planning activities of state departments of transportation has received significant focus from Federal
STATEWIDE ANALYSIS MODEL (SAM-V3) June 5, 2014 Janie Temple
 June 5, 2014 Janie Temple") STATEWIDE ANALYSIS MODEL (SAM-V3) June 5, 2014 Janie Temple Introduction Brief SAM History Intro to SAM-V3 functionality Past and Current SAM projects Future additions to SAM Suggestions from model users
STATEWIDE ANALYSIS MODEL (SAM-V3) June 5, 2014 Janie Temple Introduction Brief SAM History Intro to SAM-V3 functionality Past and Current SAM projects Future additions to SAM Suggestions from model users
Preparing for the Future in Troup County, Georgia
 Preparing for the Future in County, Georgia Assessment Report 2008 Business Development Produced for County and the Cities of LaGrange, West Point, and Hogansville PREPARING FOR THE FUTURE IN TROUP COUNTY,
ENGINE ELECTRICAL EQUIPMENT A Manufacturing Opportunity in Georgia
 Project B-209 ENGINE ELECTRICAL EQUIPMENT A Manufacturing Opportunity in Georgia Prepared for The Georgia Department of Industry and Trade Jack Minter, Director 100 State Capitol Atlanta, Georgia by Harvey
Transportation, Logistics & Distribution
 New Jersey s Transportation, Logistics & Distribution Industry Cluster Prepared by: New Jersey Department of Labor & Workforce Development Office of Research & Information Bureau of Labor Market Information
Economic Composition & Change Analysis
 Quad-Cities Region Economic Composition & Change Analysis December 2016 This study was prepared under contract with the University of Illinois, with financial support from the Office of Economic Adjustment,
Massachusetts Freight Plan
 Massachusetts Deval L. Patrick, Governor Timothy P. Murray, Lieutenant Governor Jeffrey B. Mullan, Secretary & Chief Executive Officer prepared for Massachusetts Department of Transportation prepared by
total 2011 tonnage. The total value of Illinois domestic internal commodity movements was over $21.2 billion.
 Illinois The state of Illinois borders or contains over 1,000 miles of the inland waterway system. The state s western border is defined by 580 miles of the upper River. The Illinois Waterway flows for
CLASS I RAIL CSX & Norfolk Southern
 INDUSTRIAL PARK ±2,700 Acres CLASS I RAIL CSX & Norfolk Southern PORT OF SAVANNAH Rail & Highway Access Industrial Park & Logistics Hub Highlights & Services SAVANNAH GATEWAY INDUSTRIAL HUB Savannah Gateway
Modeling Applications for Freight Tennessee DOT Freight Planning
 Modeling Applications for Freight Tennessee DOT Freight Planning presented to Tennessee Model Users Group presented by Dike Ahanotu Cambridge Systematics, Inc. July 17, 2008 Transportation leadership you
Identifying an efficient feed distribution system in the Midwest
 Identifying an efficient feed distribution system in the Midwest Marty J. McVey AGRI Industries West Des Moines, Iowa Phone: 515-223-5162 Fax: 515-223-7770 E-mail: marty@agri-industries.com C. Phillip
Southern Alberta: Growth of Import and Export Opportunities for West Coast Ports
 Southern Alberta: Growth of Import and Export Opportunities for West Coast Ports Stakeholders for the Study Port of Prince Rupert Province of Alberta Calgary Regional Partnership Calgary Economic Development
LATTS II - Freight Investment Decision Principles
 LATIN AMERICA TRADE AND TRANSPORTATION STUDY (LATTS) II Emerging Principles in Freight Investment Decision Abstract An extremely important component to effective transportation planning and to this point
Nebraska PROFIT OPPORTUNITIES FOR FOOD MANUFACTURING
 Nebraska PROFIT OPPORTUNITIES FOR FOOD MANUFACTURING Table of Contents EXECUTIVE SUMMARY...1 PART A THE FOOD MANUFACTURING INDUSTRY I. Industry Characteristics and Trends... 3 II. Industry Structure...
Bayport, Texas August 27, 2012
 Panama Canal Stakeholder Working Group Bayport, Texas August 27, 2012 Texas Ports - VALUE TO THE NATION Col. Christopher W. Sallese Commander, Galveston District U.S. Army Corps of Engineers This briefing
U.S. Department of Transportation Maritime Administration
 U.S. Department of Transportation Maritime Administration Organization of American States Hemispheric Conference on Inland Ports, Waterways, and Dredging: Inland Transport as an Engine for Competitiveness
FREIGHT PERFORMANCE INDICATORS W.E. # C
 JACKFAU-96-527 FREIGHT PERFORMANCE INDICATORS W.E. #9500.04C FINAL REPORT Prepared for: Southern California Association of Governments Prepared by: Jack Faucett Associates In Association with: ICF Kaiser
Billions of dollars per year in: Savings in shipping costs Taxes and purchases that support tens of thousands of additional jobs Avoided highway
 Georgia s Freight Rail Advantage ACCG Transportation Mobile Classroom May 17, 2012 Freight Railroads Are Critical to the Economy Indispensable link connecting markets here and abroad huge global competitive
F MI SUMMIT. Understanding the Trucking Labor Market. Dr. Kristen Monaco
 F MI SUMMIT 20 12 Understanding the Trucking Labor Market Dr. Kristen Monaco Agenda The Trucking Industry Deregulation s impact on industry structure Evolution of the labor market Labor Market Conditions
Advanced Freight Forecasting Models
 Advanced Freight Forecasting Models Prepared for: Innovations in Travel Modeling Workshop Prepared by: Maren Outwater April 30, 2012 Advanced Freight Forecasting Models 3 Types Emerging 1. Supply Chain
U.S. Cotton Distribution Patterns,
 United States Agriculture Economic Research Service U.S. Cotton Distribution Patterns, Statistical Bulletin Number 769 1986/87 Edward H. Glade, Jr. Mae Dean Johnson SALES INFORMATION Additional copies
Accessing Statistics Canada s Agri-Business Data for Research
 Accessing Statistics Canada s Agri-Business Data for Research Canadian Centre for Data Development and Economic Research (CDER) Afshan Dar-Brodeur Economic Analysis Division January 11, 2017 Outline 1.
Company Report. Matson Logistics Inc. Kevin Browning 3/9/13
 Company Report Matson Logistics Inc. Kevin Browning 3/9/13 Matson Logistics Inc. History Matson Logistics Inc. started back in 1882 when Captain William Matson sailed his ship from San Francisco to Hawaii.
Freight Transportation Megatrends
 Freight Transportation Megatrends Copyright 2006 Global Insight, Inc. Freight Demand Modeling: Tools for Public-Sector Decision Making Conference Paul Bingham Global Insight, Inc. Washington, DC September
Local Employment Dynamics: Partnership, Public-Use Data, and Innovative Web Tools
 Local Employment Dynamics: Partnership, Public-Use Data, and Innovative Web Tools Earlene Dowell LEHD Program Center for Economic Studies U.S. Census Bureau Outline What is LED and why should I care? LED
IOWA DEPARTMENT OF TRANSPORTATION. Request for Proposal
 IOWA DEPARTMENT OF TRANSPORTATION Request for Proposal for PHASE II DEVELOPMENT OF A STATEWIDE TRAVEL DEMAND MODEL for THE STATE OF IOWA Table of Contents I. GENERAL... 3 A. Introduction... 3 B. Project
USDA s Perspective on Agricultural Transportation Priorities
 Bruce Blanton Director, Transportation Services Division USDA s Perspective on Agricultural Transportation Priorities Ag Transportation Summit August 4, 2015 Rosemont, IL Why Are We At This Summit? Transportation
Benefit Cost Analysis 2016 TIGER Grant Application Funding Opportunity #: DTOS59-16-RA-TIGER8
 Benefit Cost Analysis 2016 TIGER Grant Application Funding Opportunity #: DTOS59-16-RA-TIGER8 Applicant: Philadelphia Regional Port Authority Packer Avenue Marine Terminal Berth and Crane Rail Enhancement