1. INTRODUCTION AND BACKGROUND
|
|
|
- Cecilia Shepherd
- 5 years ago
- Views:
Transcription
1
2 1. INTRODUCTION AND BACKGROUND Transportation planning has focused on moving people efficiently and safely. Freight demand modeling and assignment have received limited attention with little or no integration into major regional planning efforts. Although the heavy vehicle component of highway flows is relatively small ( generally less than 15% ), it is predominant in affecting both the condition of roads and traffic flow. An important limitation for major freight planning efforts has been the scarcity of comprehensive data sources. The complexity of freight transportation comes in the large number of private shippers, arrangers, transporters, and recipients. Most often, no single party knows all the players and modes that were involved in moving the shipment from a shipper to its ultimate destination. Compiling a database for all movements is an enormous undertaking and hence, there has not been sufficient research in commodity movement prediction. The Commodity Flow Survey (CFS), a major partnership effort between the United States Department of Transportation and the Bureau of the Census, is the first comprehensive effort since the mid seventies, to learn where and how goods are shipped (1). This database contains commodity flow within and between states classified in terms of the type of freight and mode of shipment. Today, many analyses such as vehicle emission studies or pavement deterioration assessment, require a high degree of accuracy for vehicle volumes on links. Sufficient research on predicting the number of passenger cars has been done. A procedure for doing the same with trucks will be necessary and the CFS for 1993 is a good starting point. Geographic information systems (GIS) can be described as a decision support system involving the integration of spatially referenced data in any problem solving environment. GIS are useful analysis and presentation tools in the field of transportation planning, engineering and management. Use of GIS technologies in freight transport planning will enhance conformity with recent efforts and methodologies in other areas of transportation planning and provide the flexibility for understanding the spatial effects of commodity flow. The primary objective of this research is to develop a GIS-based approach for distributing and assigning freight flows in Massachusetts. An intermediate goal is to develop a quantitative methodology for estimating freight traffic on major roads in Massachusetts from newly released inter-state commodity flow data. The following section discusses the implementation of GIS using TransCAD (2) in developing a procedure for assigning freight movements on the major highway corridors in Massachusetts. 2. METHODOLOGY The basic framework for this analysis consisted of dividing Massachusetts into smaller regions and apportioning the freight flow from the neighboring states to these regions using a socio-economic indicator variable. The statewide freight flow data was extracted from the CFS for 1993 and corresponds to tons (in '000s) of commodity shipped by truck between the New England States, New York (NY), New Jersey (NJ) and the rest of the United States as shown in table 1. During analysis, flows corresponding to the rest of the United States into and from Massachusetts (MA) were combined with that of NY. This was because NY separates MA from the rest of United States and flows going into and out of MA have to pass through it. A quantitative procedure was used to convert weights into truck numbers. An origindestination (O-D) matrix for the number of daily trucks between the internal origins ( centroids of the regions created ) and exit points from Massachusetts was constructed. This O-D matrix was then assigned over the major highways in the state and the resulting link volumes were validated against an extrapolated Highway Performance Monitoring Services (HPMS) survey 1
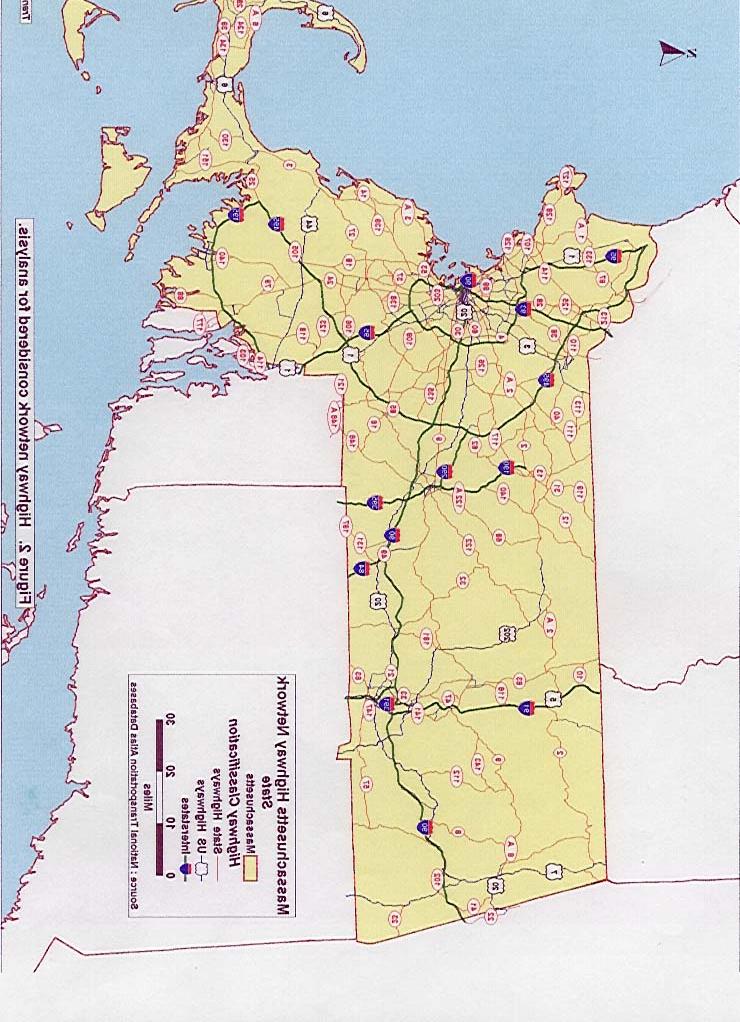
3 count (3). The different assignments considered were All or Nothing, Capacity Restraint and User Equilibrium. In All-or-Nothing assignment, all traffic flow between an O-D pair is assigned to the shortest path connecting the pair. This model is unrealistic in that only one path between every O-D pair is utilized even if there is another path with almost similar travel costs. Also, traffic is assigned without consideration for whether or not there is adequate capacity. Ignorance of highway capacity is advantageous when freight data in tons (000's) needs to be assigned over the network directly. The O-D matrix representing tons of freight flow, when assigned over the network, will result in the weight of commodity on the various links. The Capacity Restraint method attempts to approximate an equilibrium solution by iterating between All-or-Nothing traffic loadings and recalculating link travel times based on the congestion function shown in equation 1 (4). where, v t = t f 1+ α c t = congested link travel time. t f = link free-flow travel time. v = link volume. c = link capacity. α,β = parameters (α = 0.15, β = 4.00). β (1) The Capacity Restraint assignment method does not converge for all links and has the additional problem that results are highly dependent on the number of iterations. User Equilibrium utilizes an iterative process to achieve a convergent solution in which no traveler can improve his/her travel time by shifting routes. TransCAD formulates the User Equilibrium problem as a mathematical program using the Frank-Wolf solution method (5). In each iteration, network link flows are computed, which incorporate link capacity restraint effects and flow dependent travel times using equation 1. A pictorial representation of the analysis procedure is shown in figure 1. A more complete discussion of these steps is presented in the following sections Constructing the highway network. The highway network was extracted from the National Transportation Atlas Databases (NTAD) and consisted of the National Highway Planning Network State, US, and Interstate highways in Massachusetts. The spatial network is shown in figure 2. Because different types of traffic assignments were to be evaluated on this network, attributes such as travel time and capacity were calculated from existing information about the various links. The All-or-Nothing assignment procedure requires only the travel time attribute on the various links, whereas the other two methods require the capacity of the links as well. Travel time was calculated as the estimated time of travel at the speed limit over a highway link. Capacity of the link was calculated from the number of lanes, lane width, grade, and mix of vehicles. The method adopted for this calculation was derived from the 1985 Highway Capacity Manual (6). 2
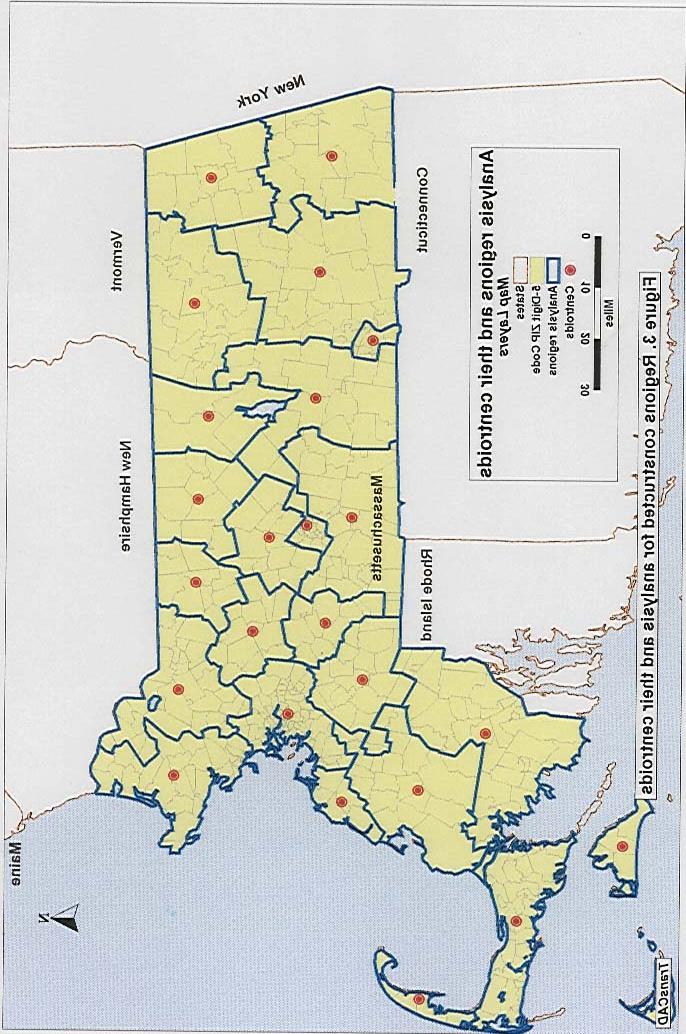
4 2.2. Division of Massachusetts into smaller districts. The freight data from the CFS for 1993 is aggregated to the state level. Because the intention was to estimate the flows on different links within the state, Massachusetts was divided into smaller regions created by aggregating 5 digit zip-code regions. Using 3 digit zip-code regions proved too large for the analysis and 5 digit zip code regions considered individually would have made it very data intensive. Hence, using 3 digit zip-code boundaries as a guide, 5 digit zip-code regions were combined to create appropriately sized areas. The geographic centroids of these regions were joined to the network with centroidal connectors which allow for flow in a single direction only. The regions considered for analysis and their centroids are shown in figure Commodity aggregation Owing to the heterogeneity of freight, the initial intention was to divide commodity into different categories based on Standard Industrial Classifications (SIC), such as farming, forestry and fisheries, mining, and all other sectors combined into one, and to perform the analyses on each. For such analyses, it would be necessary to apportion flows (as described in the next section), for each category which would involve calculating independent distribution ratios for them. Though these ratios were determinable, the origin-destination matrices for each SIC commodity category was not completely extractable from the CFS for A majority of commodity flow data for the farming, fisheries and forestry, and mining categories were either withheld to avoid disclosure or unavailable due to not meeting publication standards caused by high sampling variability. The other sectors category consisted of upto 95% of all the commodities data and the individual analyses conducted showed that they dominated the results. Hence, all commodity categories were combined and a single analysis procedure was adopted Apportioning the flows between the districts. The statewide flow has to be partitioned to the smaller districts created. Previous research has shown that economic indicator variables such as employment, employment density, and floor space, are good measures for assessing the amount of commodity entering or leaving a given area (7,8 and 9). As an initial indicator total employment was used as shown in equation 2. d i = ei 25 (2) e i= 1 where, d i = Distribution ratio for district i e i = Total Employment (all sectors) for district i As mentioned in section 2.3, individual employment ratios corresponding to different SIC groupings were not necessary for the analysis Construction of Origin-Destination matrix. The centroids of the districts constitute the internal origins and destinations for the matrix. External origins and destinations correspond to intersections of highways with the state border. Because many highways connect any two states, it was necessary to apportion the flow on the various highways based on their propensity and level of service characteristics. As i 3
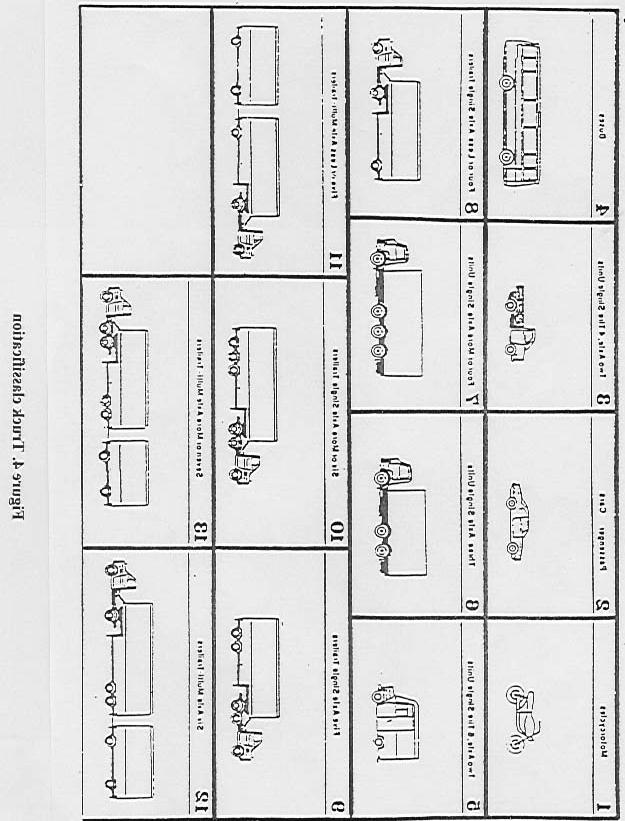
5 distance to a given entry/exit point increased, probability of using that highway decreased, while interstates were given a higher priority than state and US highways. O-D matrices representing the freight movement in tons between centroids and exit points and vice-versa can be assigned to the highway network. Such assignments were conducted but no source existed for validating the results obtained. Hence, it was imperative that freight tons be converted to truck loads as number of trucks. An O-D matrix with truck volumes, when assigned over the network, will result in the truck flows on the various links. These results can be checked against existing survey counts. Formulae for converting commodity weight into number of annual trucks are given in equations 3 and 4. where, N = ρ N = W i= 13 (3) pv avg i i i= 3 i 4 i= 13 i= 3 i W pw( 1 p ) i i ei N = Total number of all types of trucks for a given commodity weight W. W = Weight of commodity shipped annually between any two O-D pairs (kg). ρ avg = Average density of freight shipped = kg/m 3 (12.5 lb/cu.ft). p i = Average percentage of truck type i (see figure 4). v i = Average volume of truck type i (m 3 ). w i = Average weight of non-empty trucks of type i (kg). p ei = Average percentage of empty vehicles of type i. (4) The theoretical basis for equations 3 and 4 is given in (10) 1) Weight translates into volume for a given density. 2) Empty trucks will bring down average density of goods shipped (ρ avg = kg/m 3 ). 3) Average weight of trucks range from 25% to 35% of the commodity weight they carry (hence total weight of truck in equation 4 = 1.3*W). 4) Trucks of type 4 (i = 4) are busses and are not considered here. This conversion incorporates the effects of various truck sizes and dead haul ( trucks returning empty after delivery ). Using a low density value in equation 3, a deadhead (dead haul) component gets automatically added to each direction of movement into and from the state. Further, the density value corresponds to that of commercial traffic flow as opposed to just freight flow. Hence, this conversion results in the commercial flows for a given commodity weight. Freight density has an inverse relationship with respect to truck number and small changes in it can produce large changes in the latter. Owing to such high sensitivity, this should be calculated to precision. Data from work at the University of Massachusetts (11) were used to estimate the various variables in equation 3 which was used for conversion. Tonnage of freight between various origin-destination pairs were substituted for 'W ' in equation 3 and annual 4
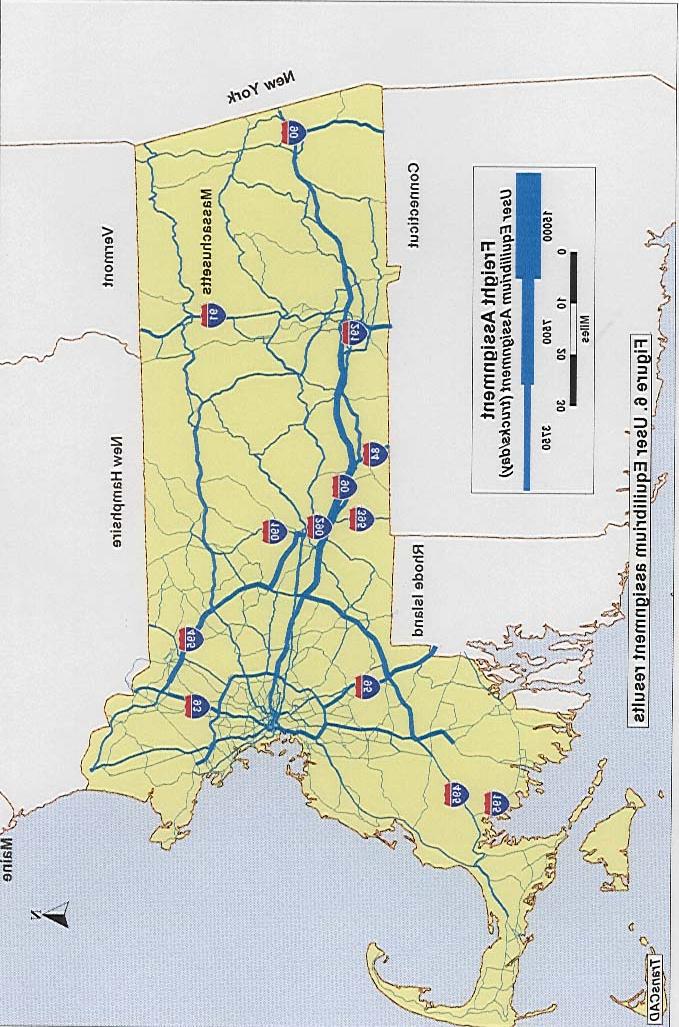
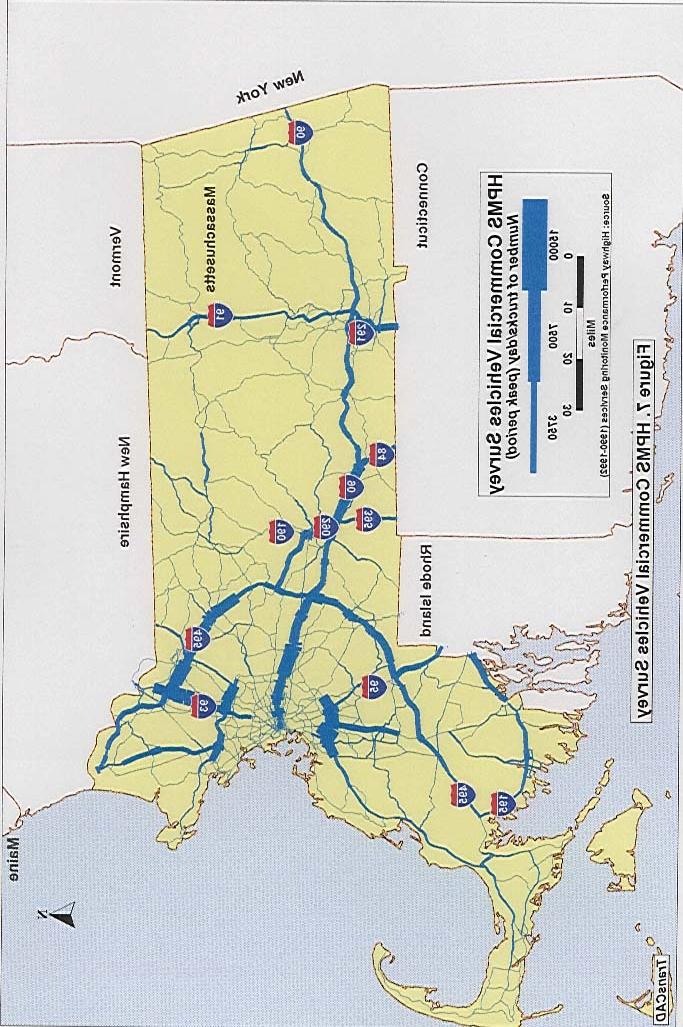
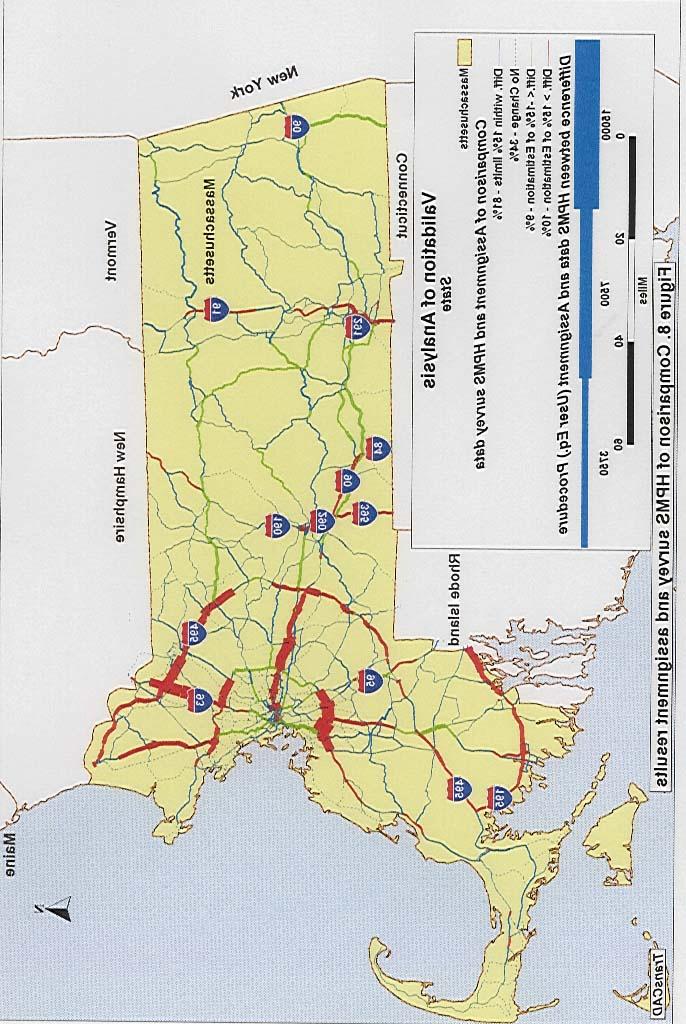
6 number of trucks moving between these pairs was determined. This number was divided by 260, the average number of annual working days, to estimate the daily truck volume between O-D pairs. The average number of annual working days was used as the resulting truck flows were to be compared against peak percentage of commercial traffic. This final O-D matrix was comprised of four basic divisions shown in figure Assigning the freight O-D matrix. Different assignment techniques including All or Nothing, Capacity Restraint, and User Equilibrium were evaluated. Results from these assignments were compared between themselves and also with actual observed data (HPMS survey). All or Nothing assignment showed the counter intuitive result of interstate highways having lower truck counts as compared to the neighboring State and US highways. Capacity Restraint method of assignment has the problems of divergence and a high dependence on the number of iterations. User Equilibrium assignment was chosen over the others as it showed both valid and intuitive results (see figure 6). The results of the above mentioned comparisons are not presented here and it should be noted that the authors were interested in using an assignment method that was both intuitive and produced reasonable results. All three methods without modifications only give approximate assignment results. This is because of the presence of a cyclic relationship between the number of trucks and the classification of the highway. The number of trucks for a given commodity weight is a function of the percentage mix of the type of trucks (p i - see equation 3) which depends on the type of highway. But, the highway characteristics do not come until assignment at which point the number of trucks on them needs to be calculated before hand. Hence, an iterative procedure of assignment using principles of the methods mentioned above needs to be used which forms a part of the future research effort Validation of analysis. The Highway Performance Monitoring Services (HPMS) for Massachusetts contains percent commercial vehicles data for 1990, 1991, and This survey and the Average Daily Traffic (ADT) values for the different highway links were used to calculate the average daily number of trucks. These values were extrapolated across highway segments as shown in figure 7. This was used to assess the validity of the assignment. The difference between the estimated flows and the survey data for the User Equilibrium type of assignment is shown in figure RESULTS AND COMPARISON The validation results show that 81% of links fall into the tolerable (±15%) category. Nine percent of the links show an overestimation and 10% show that the HPMS survey data is higher than what was calculated. A majority of the former links are on I90 (Mass Turnpike) where HPMS data was not available and an average of 10% commercial traffic was assumed. Highways closer to Boston (I495, I95, and I93) showed an underestimation as compared to the HPMS data. This is understandable as commercial traffic in an urban locality is dependent on many other factors including local trips, trip chaining and higher number of smaller trucks. A more localized study is necessary to understand the major traffic generators and attractors. Generally, a high degree of correspondence between observed and calculated flows shows that this line of research is promising. 5
7 4. FUTURE WORK. The aforementioned methodology was the basis for studying freight movement in Massachusetts. The following are some of the research objectives for the future This methodology will be applied to commodity flow data corresponding to National Analysis Transportation Region (NTAR) to NTAR flow. Massachusetts is divided vertically into two approximate halves by NTARs. Commodity flow between states is at a higher macroscopic level as compared to flow between NTARs and higher accuracy in analyses may be possible using the latter. This approach is to be used at the regional level where much more accurate employment data will be available and issues such as close proximity for freight movement can be investigated. The weight to truck number conversion formulae have to be refined and recalibrated with current data sources. The average percentage of different type of trucks (p i - see equation 3) is dependent of the type of highway - Interstate, State or US Highway. With more accurate data, these variables in the equation can be calculated more precisely. The annual commodity flow has been converted to daily truck counts by using a factor of 260 (the number of working days) which needs to be refined. The analyses should be conducted with 365 and 312 days and the results compared. Separate truck flow assignments near urban areas are necessary due to the effects of local trips. Total employment as an indicator variable has not been sufficient in explaining truck movement near urban areas. Introduction of relevant socio-economic variables has to be researched. The railway network in Massachusetts will be added to this highway network and intermodal transfer yards will be modeled as pseudo links connecting these networks. With an understanding of the spatial distribution of freight flows, suggestions for improving efficiency and reducing total shipment time can be researched. 6
8 ACKNOWLEDGMENTS This research was partially funded by the Massachusetts Port Authority. The authors would like to thank Russell Capelle of the Central Transportation Planning Staff in Boston for providing valuable insights and guidance during the course of the research. REFERENCES 1. U.S. Census Bureau; " 1993 Commodity Flow Survey; " issued December 1996, U.S. Department of Commerce, Washington, D.C. 2. TransCAD - Transportation GIS Software, Users Guide. Caliper Corporation, Newton, Massachusetts, Highway Performance Monitoring Services; " Percent Commercial Vehicles data;" issued August 1993, Bureau of Transportation Statistics, U.S. Department of Transportation, Washington, D.C. 4. Traffic Assignment Manual, Bureau of Public Roads, Urban Planning Division, U.S. Department of Commerce, Washington, D.C., Travel Demand Modeling with TransCAD 3.0. Caliper Corporation, Newton, Massachusetts, 1996, pp Highway Capacity Manual, Special Report 209, Transportation Research Board, Washington, D.C., Starkie, D. M., Commercial Vehicles in Urban Transportation, Journal of Institute of Highway Engineering, September Biddle, B., V.J. Siaurusaitis, Truck Transportation Planning, Working Paper, COMSIS, Silver Spring, Maryland, May Memmot, F. W., Applications of Statewide Freight Demand Forecasting Techniques, NCHRP 260, TRB, Washington DC, September National Transportation, Trends & Choices ( To the year 2000 ), U.S. Department of Transportation, January 1977, pp New England Vehicle Classification and Truck Weight Program, Technical Report No.2, New England Transportation Consortium, University of Massachusetts at Amherst, November
9 TABLE 1 : Commodity Flow by truck in New England, New York, New Jersey, and the rest of the US. ( 000's tons ) Destinations Origins CT ME MA NH RI VT NJ NY Rest of US CT --- b ME MA NH RI VT NJ NY Rest of US a Source : Commodity Flow Survey b Data not required for this analysis. Hence not extracted from the source.
10 CFS Census NTAD Origin-Destination data from State to State by truck and commodity type Highway and State geographic files for Massachusetts Economic Indicator(s) Employment Employment density Floor space Division of Massachusetts into smaller regions Joining their centroids to the highway network Origin-Destination matrix for internal origins (centroids) and border exit/entry points Identification of major entry/exit points on the state border Conversion to number of trucks Final Origin-Destination matrix - Number of daily trucks. Traffic Assignment - All-or-Nothing - Capacity Restraint - User Equilibrium. HPMS Commercial vehicle survey data Extrapolate over highway links Validation 81 % - tolerable range of ±15% 9 % - over predicted. 10% - under predicted. Future Work. Figure 1. Analysis procedure
11
12
13

14
15
16
17
BTS State and Freight Data Products. Freight in the Southeast Biloxi, MS March 19, 2015
 BTS State and Freight Data Products Freight in the Southeast Biloxi, MS March 19, 2015 Major BTS Freight Data Programs Commodity Flow Survey (CFS) Freight Analysis Framework (FAF) Cooperative effort with
GIS-based Modeling for Statewide and Corridor Freight Planning
 GIS-based Modeling for Statewide and Corridor Freight Planning GIS-T T Conference Colorado Springs, CO Presented by Erik Cempel Cambridge Systematics, Inc. March 19, 2003 Outline of Presentation Background
2016 Mid-Continent Transportation Research Symposium, October 24-25, Donna Brown-Martin, Director Bureau of Planning and Economic Development
 2016 Mid-Continent Transportation Research Symposium, October 24-25, 2016 Donna Brown-Martin, Director Bureau of Planning and Economic Development Why the State Freight Plan is Important to You Vision,
Modeling Applications for Freight Tennessee DOT Freight Planning
 Modeling Applications for Freight Tennessee DOT Freight Planning presented to Tennessee Model Users Group presented by Dike Ahanotu Cambridge Systematics, Inc. July 17, 2008 Transportation leadership you
Commodity Flow Modeling William R. Black Indiana University INTRODUCTION
 Commodity Flow Modeling William R. Black Indiana University INTRODUCTION The project reported on here was undertaken with the primary objective of creating a database of commodity flows into and out of
INCORPORATING TRUCK FLOWS INTO THE STATE-WIDE PLANNING TRAFFIC MODEL. December 2004 JHR Project 02-1
 INCORPORATING TRUCK FLOWS INTO THE STATE-WIDE PLANNING TRAFFIC MODEL December 2004 JHR 04-299 Project 02-1 Lisa Aultman-Hall Feng Guo Christopher O Brien Patrycja Padlo Brian Hogge This research was sponsored
CALIBRATION OF THE GRAVITY MODEL FOR TRUCK FREIGHT FLOW DISTRIBUTION
 Research Report No. UVACTS-5-14-14 August 2002 CALIBRATION OF THE GRAVITY MODEL FOR TRUCK FREIGHT FLOW DISTRIBUTION by Shaohui Mao Dr. Michael J. Demetsky II A Research Project Report For the Mid-Atlantic
Origin-Destination Trips and Skims Matrices
 Origin-Destination Trips and Skims Matrices presented by César A. Segovia, AICP Senior Transportation Planner AECOM September 17, 2015 Today s Webinar Content Matrix Estimation Data sources Florida Application
APPENDIX H: TRAVEL DEMAND MODEL VALIDATION AND ANALYSIS
 APPENDIX H: TRAVEL DEMAND MODEL VALIDATION AND ANALYSIS Travel demand models (TDM) simulate current travel conditions and forecast future travel patterns and conditions based on planned system improvements
MAP 21 Freight Provisions and Seaports
 MAP 21 Freight Provisions and Seaports September 20, 2012 American Association of Port Authorities 703.684.5700 www.aapa-ports.org 3 New Freight Eligibility in Core Highway Formula Programs Surface Transportation
Importance of the Commodity Flow Survey (CFS) in Developing the Freight Analysis Framework (FAF)
 in Developing the Freight Analysis Framework (FAF)") Bureau of Transportation Statistics Importance of the Commodity Flow Survey (CFS) in Developing the Freight Analysis Framework (FAF) Annual Meeting Transportation Research Board January 14, 2015 Michael
Bureau of Transportation Statistics Importance of the Commodity Flow Survey (CFS) in Developing the Freight Analysis Framework (FAF) Annual Meeting Transportation Research Board January 14, 2015 Michael
CRITICAL RURAL FREIGHT CORRIDORS SWRPC Transportation Advisory Committee May 7, 2018
 CRITICAL RURAL FREIGHT CORRIDORS SWRPC Transportation Advisory Committee May 7, 2018 At the March 5 th TAC meeting, NHDOT provided an introductory presentation on the development of the State Freight Plan
Some network flow problems in urban road networks. Michael Zhang Civil and Environmental Engineering University of California Davis
 Some network flow problems in urban road networks Michael Zhang Civil and Environmental Engineering University of California Davis Outline of Lecture Transportation modes, and some basic statistics Characteristics
THE TRANSSHIPMENT PROBLEM IN TRAVEL FORECASTING: TOUR STRUCTURES FROM THE ONTARIO COMMERCIAL VEHICLE SURVEY
 THE TRANSSHIPMENT PROBLEM IN TRAVEL FORECASTING: TOUR STRUCTURES FROM THE ONTARIO COMMERCIAL VEHICLE SURVEY University of Wisconsin Milwaukee Paper No. 09-3 National Center for Freight & Infrastructure
New Jersey Pilot Study
 New Jersey Pilot Study Testing Potential MAP-21 System Performance Measures for Two Corridors Executive Summary October 2014 ABOUT THE NJTPA THE NJTPA IS THE FEDERALLY AUTHORIZED Metropolitan Planning
Trade & Logistics: Understanding the Industry
 Trade & Logistics: Understanding the Industry 1 Key Initiative of Governor Scott Florida has a once in a lifetime opportunity, with the expansion of the Panama Canal, to transform the state s economy to
Intermodal Freight Transportation Planning Using Commodity Flow Data. Final Report
 Intermodal Freight Transportation Planning Using Commodity Flow Data Final Report Yunlong Zhang Department of Civil Engineering Mississippi State University Royce O. Bowden, Jr. Department of Industrial
LATTS II - Freight Investment Decision Principles
 LATIN AMERICA TRADE AND TRANSPORTATION STUDY (LATTS) II Emerging Principles in Freight Investment Decision Abstract An extremely important component to effective transportation planning and to this point
Florida Freight Supplychain Intermodal Model
 Florida Freight Supplychain Intermodal Model Innovations in Travel Modeling 2014 April 29, 2014 Introduction Support freight plan development Office of Freight Logistics and Passenger Operations Evaluate
Passenger Transport Modelling [T1]
![Passenger Transport Modelling [T1]](/thumbs/75/71491283.jpg "Passenger Transport Modelling [T1]") Passenger Transport Modelling [T1] Providing Feedback This draft document has been published for stakeholder feedback. Submissions are due Monday 9 February 2015 All submissions should be in writing and
Passenger Transport Modelling [T1] Providing Feedback This draft document has been published for stakeholder feedback. Submissions are due Monday 9 February 2015 All submissions should be in writing and
Volume to Capacity Estimation of Signalized Road Networks for Metropolitan Transportation Planning. Hiron Fernando, BSCE. A Thesis CIVIL ENGINEERING
 Volume to Capacity Estimation of Signalized Road Networks for Metropolitan Transportation Planning by Hiron Fernando, BSCE A Thesis In CIVIL ENGINEERING Submitted to the Graduate Faculty of Texas Tech
PROJECTS. The KIPDA MPO s Central Location
 PROJECTS Freight The economy of the Louisville KY-IN) Metropolitan Planning Area MPA), similar to that of the United States as a whole, is largely dependent on the efficient, reliable, and safe movement
Modeling Truck Traffic Volume Growth Congestion
 Modeling Truck Traffic Volume Growth Congestion By Mr. Gregory Harris, P. E. (Principal Investigator) Office of Freight, Logistics and Transportation The University of Alabama in Huntsville Huntsville,
Rail Freight Service Review. Submission of the New Brunswick Department of Transportation
 Rail Freight Service Review Submission of the New Brunswick Department of Transportation Department of Transportation March 25, 2010 Rail Freight Service Review Submission of the New Brunswick Department
AMPO Annual Conference Session: Performance (Part 1) October 18, 2017 Savannah, GA
 October 18, 2017 Savannah, GA") AMPO Annual Conference Session: Performance (Part 1) October 18, 2017 Savannah, GA Introduction: North Jersey Transportation Planning Authority NJTPA Congestion Management Process Study Goals Analysis
AMPO Annual Conference Session: Performance (Part 1) October 18, 2017 Savannah, GA Introduction: North Jersey Transportation Planning Authority NJTPA Congestion Management Process Study Goals Analysis
2 Purpose and Need. 2.1 Study Area. I-81 Corridor Improvement Study Tier 1 Draft Environmental Impact Statement
 2 Purpose and Need 2.1 Study Area Interstate 81 (I-81) is relied upon for local and regional travel and interstate travel in the eastern United States. It extends 855 miles from Tennessee to New York at
VISUM State-of-the-Art Travel Demand Modeling VISUM
 State-of-the-Art Travel Demand Modeling VISUM What is VISUM? VISUM is a comprehensive, flexible software system for transportation planning, travel demand modeling and network data management. VISUM is
SUTRA : Sustainable Urban Transportation for the City of Tomorrow
 Preliminary Report SUTRA : Sustainable Urban Transportation for the City of Tomorrow WP 03: Multi-modal Transportation Modelling D03.3 User Manual and Example Test Data Sets First Draft Karlsruhe, January
Factors Affecting Transportation Decisions. Transportation in a Supply Chain. Transportation Modes. Road freight transport Europe
 Transportation in a Supply Chain Factors Affecting Transportation Decisions Carrier (party that moves or transports the product) Vehicle-related cost Fixed operating cost Trip-related cost Shipper (party
TEXAS FREIGHT MOBILITY PLAN 2017
 TEXAS FREIGHT MOBILITY PLAN 2017 Texas Transportation Commission September 28, 2017 Overview of the Texas Freight Mobility Plan 2016 Plan First multimodal freight mobility plan Identified freight network,
Travel Demand Modeling At NCTCOG
 Travel Demand Modeling At NCTCOG Arash Mirzaei North Central Texas Council Of Governments For University of Texas at Arlington ITE Student Chapter March 9, 2005 Agenda Background DFW Regional Model Structure
Updating Virginia s Statewide Functional. Brad Shelton, VDOT Chris Detmer, VDOT Ben Mannell, VDOT
 Updating Virginia s Statewide Functional Classification System Brad Shelton, VDOT Chris Detmer, VDOT Ben Mannell, VDOT July 18, 2013 What is Functional Classification Use of Functional Classification Today
Statewide Model Application Using the Texas SAM
 Statewide Model Application Using the Texas SAM Presented by: William Smithson Wilbur Smith Associates September 2008 Texas Statewide Analysis Model Application Presentation Outline Brief Model Description
Darrell Wilson AVP Government Relations The Future of Freight Panel August 26 th, 2014
 Darrell Wilson AVP Government Relations The Future of Freight Panel August 26 th, 2014 Railroads - Safe & Getting Safer RR Safety Trends: 2000-2013* Train accident rate Employee injury rate Grade crossing
Morris County Freight Profile
 Morris County Freight Profile 2040 Freight Industry Level Forecasts ABOUT THIS PROFILE The NJTPA has developed a set of alternative freight forecasts to support transportation, land use, and economic development
Central Minnesota. Regional Freight Profile
 Central Minnesota Regional Freight Profile Working DRAFT May 21 Minnesota Department of Transportation The purpose of the Central Regional Freight Profile is to document freight movement trends in the
Appendix C: GHG Emissions Model
 Appendix C: GHG Emissions Model 1 METHOD OVERVIEW The Maryland Statewide Transportation Model (MSTM) Emissions Model (EM) is a CUBE-based model that uses emission rates calculated by the MOVES2010 EPA
EXISTING AND FUTURE FREIGHT GOODS MOVEMENT ASSESSMENT
 Technical Memorandum EXISTING AND FUTURE FREIGHT GOODS MOVEMENT ASSESSMENT Prepared by: April 2014 TABLE OF CONTENTS 1. Introduction... 3 1.1 Study Purpose... 3 1.2 Data Reference List... 3 2. Data sources...
Rail - What Does the Future Bring?
 Rail - What Does the Future Bring? Jeannie Beckett Sr. Dir., Inland Transportation Port of Tacoma Oct 18, 2007 The Rail Networks Railroads Media Blitz Print Ads TV Ads Radio Ads D:\aapa\ RailroadsPSA.wmv
Validate: A New Method To Generate Nationwide Traffic Data
 Validate: A New Method To Generate Nationwide Traffic Data Thomas Haupt Udo Heidl PTV AG PTV AG Stumpfstr.1 Stumpfstr. 1 76131 Karlsruhe, 76131 Karlsruhe Email thomas.haupt@ptv.de Email udo.heidl@ptv.de
INTERSTATE CORRIDOR PLANNING
 INTERSTATE CORRIDOR PLANNING Prioritization of Corridor Studies July 29, 2015 Importance of the Interstate System Texas is an integral part of the national interstate system. The interstate system provides
The Three C s of Urban Transportation Planning
 The Three C s of Urban Transportation Planning Edward G. W etzel Engineer of Transportation Policy Port of New York Authority The need for continuing, comprehensive, urban transportation planning on a
PORT INLAND DISTRIBUTION NETWORK SOUTH JERSEY SITE EVALUATION AND FEASIBILITY DEVELOPMENT STUDY. EXECUTIVE SUMMARY July 2003
 PORT INLAND DISTRIBUTION NETWORK SOUTH JERSEY SITE EVALUATION AND FEASIBILITY DEVELOPMENT STUDY NEW JERSEY DEPARTMENT OF TRANSPORTATION AND THE DELAWARE VALLEY REGIONAL PLANNING COMMISSION EXECUTIVE SUMMARY
A Network Demand Model for Rural Bypass Planning. Paper Number
 A Network Demand Model for Rural Bypass Planning Paper Number 00-1205 Dr. Michael D. Anderson Assistant Professor of Civil Engineering Department of Civil and Environmental Engineering The University of
Disaggregate State Level Freight Data to County Level
 Disaggregate State Level Freight Data to County Level October 2013 Shih-Miao Chin, Ph.D. Ho-Ling Hwang, Ph.D. Francisco Moraes Oliveira Neto, Ph.D. Center for Transportation Analysis Oak Ridge National
Establishing International Roughness Indices for a dense urban area case study in Washington, DC
 The Sustainable City VI 275 Establishing International Roughness Indices for a dense urban area case study in Washington, DC S. A. Arhin 1, E. C. Noel 1 & M. Lakew 2 1 Howard University, USA 2 District
A Commercial Movement Modelling Strategy for Alberta s Major Cities
 A Commercial Movement Modelling Strategy for Alberta s Major Cities JD Hunt, Department of Civil Engineering, University of Calgary K Stefan, Transportation Department, City of Calgary AT Brownlee, Transportation
New York State Freight Transportation Plan. NYSAMPO Meeting. NYSAMPO Meeting June 21, 2017
 New York State Freight Transportation Plan NYSAMPO Meeting NYSAMPO Meeting June 21, 2017 Why a Statewide Freight Plan? To understand statewide freight movement dynamics and relationship to economic vitality.
Northern and Western Minnesota and NW Wisconsin Regional Freight Study
 Northern and Western Minnesota and NW Wisconsin Regional Freight Study Purpose! Examine regional and local issues! Document existing freight transportation system! Identify industry- and region-specific
Roadway Traffic Assignment (Last Edit August 26, 2005)
") Roadway Traffic Assignment (Last Edit August 26, 2005) This chapter focuses on the Roadway Traffic Assignment module of the Dallas-Fort Worth Regional Travel Model (DFWRTM). Based on the input vehicle
Roadway Traffic Assignment (Last Edit August 26, 2005) This chapter focuses on the Roadway Traffic Assignment module of the Dallas-Fort Worth Regional Travel Model (DFWRTM). Based on the input vehicle
I know that you all understand the critical importance of the freight transportation system
 United States Senate Subcommittee on Surface Transportation and Merchant Marine Infrastructure, Safety and Security Testimony of Michael L. Ducker President and CEO FedEx Freight Corporation April 4, 2017
Advanced Freight Forecasting Models
 Advanced Freight Forecasting Models Prepared for: Innovations in Travel Modeling Workshop Prepared by: Maren Outwater April 30, 2012 Advanced Freight Forecasting Models 3 Types Emerging 1. Supply Chain
TAG UNIT M3.1. Highway Assignment Modelling. January Department for Transport. Transport Analysis Guidance (TAG)
") TAG UNIT M3.1 January 2014 Department for Transport Transport Analysis Guidance (TAG) https://www.gov.uk/transport-analysis-guidance-webtag This TAG Unit is guidance for the MODELLING PRACTITIONER This
TAG UNIT M3.1 January 2014 Department for Transport Transport Analysis Guidance (TAG) https://www.gov.uk/transport-analysis-guidance-webtag This TAG Unit is guidance for the MODELLING PRACTITIONER This
7. FREIGHT TRANSPORTATION AND ECONOMIC CONDITIONS
 7. FREIGHT TRANSPORTATION AND ECONOMIC CONDITIONS Oklahoma s economy has become more diverse over the past few decades. Since the oil price collapse in the mid-1980s and the subsequent U.S. recessions,
STATEWIDE ANALYSIS MODEL (SAM-V3) June 5, 2014 Janie Temple
 June 5, 2014 Janie Temple") STATEWIDE ANALYSIS MODEL (SAM-V3) June 5, 2014 Janie Temple Introduction Brief SAM History Intro to SAM-V3 functionality Past and Current SAM projects Future additions to SAM Suggestions from model users
STATEWIDE ANALYSIS MODEL (SAM-V3) June 5, 2014 Janie Temple Introduction Brief SAM History Intro to SAM-V3 functionality Past and Current SAM projects Future additions to SAM Suggestions from model users
A Canadian Commodity Flow Survey
 A Canadian Commodity Flow Survey Statistics Canada and Transport Canada Transportation Research Board Commodity Flow Survey Workshop The Keck Center of the National Academies Washington, D.C. October 29,
SWOT Analysis of Commodity Flow Datasets
 SWOT Analysis of Commodity Flow Datasets prepared for FDOT Transportation Statistics Office prepared by RS&H, Inc. 5/6/2015 Background Many users work with commodity flow data Modelers GIS analysts Policy
Chapter 2 Performance Measures
 Transportation Decision-making Principles of Project Evaluation and Programming Chapter 2 Performance Measures K. C. Sinha and S. Labi Purdue University School of Civil Engineering 1 Performance Measures
NYSDOT Roadway Inventory. Both On and Off the State System
 NYSDOT Roadway Inventory Both On and Off the State System 1 2 NYSDOT Highway Data Services Bureau Highway Data Traffic Monitoring Pavement Data Inventory of public roads, incl. LHI Systems designations
Travel Time in Macroscopic Traffic Models for Origin-Destination Estimation
 University of Wisconsin Milwaukee UWM Digital Commons Theses and Dissertations May 2013 Travel Time in Macroscopic Traffic Models for Origin-Destination Estimation Eric Youngblom University of Wisconsin-Milwaukee
CITY OF JACKSONVILLE 2030 MOBILITY PLAN STUDY UPDATE GOALS, OBJECTIVES, AND PERFORMANCE MEASURES PREPARED FOR: CITY OF JACKSONVILLE
 CITY OF JACKSONVILLE 2030 MOBILITY PLAN STUDY UPDATE GOALS, OBJECTIVES, AND PERFORMANCE MEASURES 3.20.2017 PREPARED FOR: CITY OF JACKSONVILLE 55 Railroad Row White River Junction, VT 05001 802.295.4999
Failure to Act. Of current Investment Trends in. Airports, Inland Waterways, and Marine Ports. Infrastructure EXECUTIVE SUMMARY
 Failure to Act The economic impact Of current Investment Trends in Airports, Inland Waterways, and Marine Ports Infrastructure EXECUTIVE SUMMARY EXECUTIVE SUMMARY Air and waterborne transportation infrastructure
Multi Entity Perspective Freight Demand Modeling Technique: Varying Objectives and Outcomes
 Multi Entity Perspective Freight Demand Modeling Technique: Varying Objectives and Outcomes Sabyasachee Mishra a, c1, Hiroyuki Iseki b, Rolf Moeckel b a Department of Civil Engineering, University of Memphis,
WM2008 Conference, February 24-28, 2008, Phoenix, AZ. Commodity Flow Study Clark County, Nevada, USA
 Commodity Flow Study Clark County, Nevada, USA - 8402 Sheila Conway, Ph.D. Urban Environmental Research LLC 10100 West Charleston Boulevard Suite 200 Las Vegas, NV 89135 Irene Navis, AICP Planning Manager
FREIGHT PERFORMANCE INDICATORS W.E. # C
 JACKFAU-96-527 FREIGHT PERFORMANCE INDICATORS W.E. #9500.04C FINAL REPORT Prepared for: Southern California Association of Governments Prepared by: Jack Faucett Associates In Association with: ICF Kaiser
LOUISIANA FREIGHT MOBILITY PLAN Donald Vary. March 1, 2016
 Donald Vary March 1, 2016 FREIGHT MOBILITY PLAN COMPONENTS Introduction and Plan Summary Strategic Goals and Objectives Economic Context of Freight Freight Policies, Strategies and Institutions Louisiana
INLAND NAVIGATION ECONOMICS WEBINAR SERIES #8 Elasticity of Demand - Shipper Responsiveness
 INLAND NAVIGATION ECONOMICS WEBINAR SERIES #8 Elasticity of Demand - Shipper Responsiveness Michael R. Hilliard, Ph.D. Center for Transportation Analysis Oak Ridge National Laboratory April 10, 2013 US
NATMEC June 30, 2014 Anita Vandervalk, PE, PMP
 NATMEC June 30, 2014 Anita Vandervalk, PE, PMP Agenda 1. Florida s MPM Program 2. Research Efforts and Progress 3. Source Book 4. Transitioning to Real Time Data 5. Next Steps Importance of Mobility Providing
AN INTEGRATED TRANSPORTATION PLANNING AND OPERATIONS MODEL FOR MEMPHIS, TENNESSEE
 AN INTEGRATED TRANSPORTATION PLANNING AND OPERATIONS MODEL FOR MEMPHIS, TENNESSEE Jeffery Karafa, Mihalis M. Golias, Martin Lipinski Department of Civil Engineering & Intermodal Freight Transportation
THE TRANSSHIPMENT PROBLEM IN TRAVEL FORECASTING: PRELIMINARY ANALYSIS OF THE ONTARIO COMMERCIAL VEHICLE SURVEY
 THE TRANSSHIPMENT PROBLEM IN TRAVEL FORECASTING: PRELIMINARY ANALYSIS OF THE ONTARIO COMMERCIAL VEHICLE SURVEY University of Wisconsin Milwaukee Paper No. 09-2 National Center for Freight & Infrastructure
Data Requirements for a Province-wide Travel Demand Model. David Kriger, P.Eng., MCIP David Kriger Consultants Inc., Ottawa
 David Kriger, P.Eng., MCIP David Kriger Consultants Inc., Ottawa Paper prepared for presentation at the Best Practices in Transportation Planning Session of the 2014 Conference of the Transportation Association
Introduction to Transportation Systems Analysis
 Introduction to Transportation Systems Analysis Lecture Notes in Transportation Systems Engineering Prof. Tom V. Mathew Contents 1 Goal of Transportation System Analysis 1 1.1 Characteristics...................................
Chapter 1 Introduction
 Chapter 1 Introduction KEY POINTS The amount and value of freight are critical components of the overall economic health of Missouri. Missouri s multimodal freight system supports the movement of trucks,
Appendix B5 PT Model Validation
 Appendix B5 PT Model Validation PT Model Validation Report Sheffield and Rotherham Public Transport Model Report for Sheffield City Council August 2009 Document Control Project Title: MVA Project Number:
PLANES, TRAINS & SEMIS South Carolina s Statewide Freight Plan
 PLANES, TRAINS & SEMIS South Carolina s Statewide Freight Plan Multi-Agency Partners Freight Plan Stakeholder Input MTP Kick-Off Meeting with Freight Break-Out Freight Stakeholder Interviews Online Surveys
Updating Virginia s Statewide Functional Classification System. Briefing to MPOs, PDCs, and Local Governments
 Updating Virginia s Statewide Functional Classification System Briefing to MPOs, PDCs, and Local Governments October 15 & 19, 2012 Functional Class 101 Shelton s FC Game Research Phase Today s Review New
Developing Resilient Freight Systems
 Developing Resilient Freight Systems Barbara Ivanov Co-Director Freight Systems Division TRB 2011 Transportation Hazards and Security Summit August 23, 2011 How Can States Develop Resilient Freight Systems?
 WEBB COUNTY CITY OF LAREDO REGIONAL MOBILITY AUTHORITY 7917 McPherson Road, Suite 203 Laredo, Texas 78045 956-723-9841 November 30, 2016 The Honorable Anthony R. Foxx Secretary U.S. Department of Transportation
APPENDIX G FG/FTG MODELS RELATIONAL DATABASE MANUAL: SUPPLEMENTAL MATERIAL - PUBLICATIONS
 APPENDIX G FG/FTG MODELS RELATIONAL DATABASE MANUAL: SUPPLEMENTAL MATERIAL - PUBLICATIONS This section contains a list of the publication included in the database. The publications include: research reports,
CITY OF VALLEJO PUBLIC WORKS DEPARTMENT TRAFFIC IMPACT Analysis/Study GUIDELINES
 The City Engineer, under the authority of the Public Works Director and recommendations from the Traffic Engineer, will make the final decision on the need for a traffic study. The purpose of the traffic
Overcoming Barriers to Mixed-Use Infill Development: Let s Get Trip Generation Right
 Overcoming Barriers to Mixed-Use Infill Development: Let s Get Trip Generation Right By: Matt Goyne, Mackenzie Watten, and Dennis Lee with Fehr & Peers Please contact Matt Goyne at m.goyne@fehrandpeers.com
BOSTON REGION METROPOLITAN PLANNING ORGANIZATION MEMORANDUM
 BOSTON REGION METROPOLITAN PLANNING ORGANIZATION State Transportation Building Ten Park Plaza, Suite 2150 Boston, MA 02116-3968 Tel. (617) 973-7100 Fax (617) 973-8855 TTY (617) 973-7089 www.bostonmpo.org
The Trouble with Intercity Travel Demand Models. Presentation Outline
 The Trouble with Intercity Travel Demand Models Eric J. Miller, Ph.D. Bahen-Tanenbaum Professor, Dept. of Civil Engineering Director, Joint Program in Transportation University of Toronto 2004 Annual Meeting
Niagara s Transportation Strategy 1. Introduction:
 Niagara s Transportation Strategy May 8, 2002 Niagara s Transportation Strategy 1. Introduction: Transportation is of pivotal importance in the development of Niagara. This, Niagara s first comprehensive
The Policies section will also provide guidance and short range policies in order to accomplish the goals and objectives.
 4 Goals & Objectives INTRODUCTION The 2015-2040 MTP preserves and promotes the quality of life and economic prosperity of the MAB by providing a transportation system consistent with the regional goals.
Transport Terminals: New Perspectives
 Transport Terminals: New Perspectives Andrew R. Goetz, Department of Geography, University of Denver, Denver, Colorado, USA. E-mail: agoetz@du.edu. Jean-Paul Rodrigue, Department of Economics and Geography,
CDTC NEW VISIONS FREIGHT & GOODS MOVEMENT
 CDTC NEW VISIONS FREIGHT & GOODS MOVEMENT White Paper January 2015 Draft Capital District Transportation Committee One Park Place Albany NY 12205 518-458-2161 www.cdtcmpo.org Contents Introduction... 2
The Future of Trucking in Virginia: Interstate and Intermodal Strategies
 The Future of Trucking in Virginia: Interstate and Intermodal Strategies Randy Mullett Vice President - Government Relations & Public Affairs, Con-way Inc. Virginia Global Logistics Forum December 7, 2011
Revised Paper Submitted for Publication in Transportation Research Record
 Mishra and Welch 1 A JOINT TRAVEL DEMAND AND ENVIRONMENTAL MODEL TO INCORPORATE EMISSION PRICING FOR LARGE TRANSPORTATION NETWORKS By Sabyasachee Mishra, Ph.D., P.E. Research Assistant Professor National
Functional Classification Comprehensive Guide. Prepared by
 Functional Classification Comprehensive Guide Prepared by June 6, 2014 INTRODUCTION PURPOSE OF DOCUMENT The intent of this document is to provide a comprehensive guide to Virginia Department of Transportation
Application of EMME/2 and Enif for a Congestion Relief Analysis Study in the Puget Sound Region
 Application of EMME/2 and Enif for a Congestion Relief Analysis Study in the Puget Sound Region BY Sujay Davuluri Parsons Brinckerhoff Quade & Douglas, Inc. 999 Third Avenue, Suite 2200, Seattle, WA 98104,
time and distance data at the individual vehicle level. The valuable traffic data can be used for effective freeway control and management. For the to
 A Marginal-cost Pricing Model for Transportation Networks with Multiple-class Users An Application to the Toll Ceiling Problem Shou-Ren HU a, Hui Pei HUANG b a Department of Transportation and Communication
The Indian Nations Council of Governments (INCOG) 2035 Plan: Roadways Element
 2035 Plan: Roadways Element") Roadways The Indian Nations Council of Governments (INCOG) The Indian Nations Council of Governments is the designated regional planning organization for the Tulsa Transportation Management Area (TMA).
Roadways The Indian Nations Council of Governments (INCOG) The Indian Nations Council of Governments is the designated regional planning organization for the Tulsa Transportation Management Area (TMA).
GUIDELINES FOR SELECTING TRAVEL FORECASTING METHODS AND TECHNIQUES
 GUIDELINES FOR SELECTING TRAVEL FORECASTING METHODS AND TECHNIQUES Maren Outwater and Jeff Doyle, RSG, 55 Railroad Row, White River Junction, VT 05001 maren.outwater@rsginc.com, jeff.doyle@rsginc.com ABSTRACT
KAW CONNECTS EXECUTIVE SUMMARY
 Executive Summary Page E-1 Introduction KAW CONNECTS EXECUTIVE SUMMARY The Kansas Department of Transportation (KDOT) and the Kansas Turnpike Authority (KTA) have both recognized the need to plan for the
Sabbir Saiyed, PhD., P.Eng. Manager, Transportation System Planning
 Sabbir Saiyed, PhD., P.Eng. Manager, Transportation System Planning February 5, 2016 Goods Movement is a Major Part of Peel s Economy Peel is one of Canada s most important freight hubs Close to major
City Logistics Teodor Gabriel Crainic ESG UQAM CIRRELT - CRT
 City Logistics Teodor Gabriel Crainic ESG UQAM & CIRRELT - CRT CIRRELT A Few Sources for Information Best Urban Freight Solutions www.bestufs.net Conferences and workshops Best practice handbook www.transports-marchandises-en-ville.org
4-Step Commodity Model Freight Forecasting
 Freight Forecasting Neda Masoud (nmasoud@uci.edu) Kate Hyun (khyun1@uci.edu) Professor Ritchie CEE290A University of California Irvine Generation Distribution Mode Split Assignment Total Production and
Introduction to Transportation Systems
 Introduction to Transportation Systems 1 PART III: TRAVELER TRANSPORTATION 2 Chapter 28: Urban Public Transportation 3 Urban Public Transportation Introduction LOS Services History Costs Temporal Peaking
Air Pollution Zoning based on Land use and Traffic of Vehicles
 Air Pollution Zoning based on Land use and Traffic of Vehicles Elnaz Irannezhad Transportation Planning Engineering, Iran University of Science and Technology elnaziran@gmail.com Seyed Hossein Mousavi