Strasburg Road Extension Rush Meadow Street to New Dundee Road Alternative Route Study Report
|
|
|
- Rosamond Webb
- 5 years ago
- Views:
Transcription
1 Strasburg Road Extension Rush Meadow Street to New Dundee Road Alternative Route Study Report July 2012
2 TABLE OF CONTENTS Strasburg Road Extension Rush Meadow Street to New Dundee Road City of Kitchener Alternative Route Study Report Final (Rev 02) Page 1.0 BACKGROUND EXISTING TRAFFIC CONDITION EXISTING ROAD NETWORK EXISTING TRAFFIC VOLUMES FUTURE BACKGROUND TRAFFIC VOLUMES TRAFFIC DIVERSION CORRIDOR GROWTH FUTURE TOTAL TRAFFIC CONDITION SITETRIP GENERATION SITETRIP DISTRIBUTION SITETRIP ASSIGNMENTS BASE CASE OPTION TRAFFIC IMPACT ASSESSMENT EXISTING TRAFFIC CONDITIONS (2010) FUTURE TOTAL TRAFFIC CONDITIONS (2018) BASE CASE OPTION TRAFFIC INFILTRATION ENGINEERING IMPACT ENVIRONMENTAL IMPACT BASE CASE NATURAL ENVIRONMENT SOCIAL ENVIRONMENT CULTURAL ENVIRONMENT OPTION NATURAL ENVIRONMENT SOCIAL ENVIRONMENT CULTURAL ENVIRONMENT SUMMARY ASSESSMENT COMPARATIVE EVALUATION AND CONCLUSIONS COMPARATIVE EVALUATION CONCLUSIONS APPENDICES Appendix A Appendix B Appendix C Appendix D Traffic Figures Capacity Analysis Results Road Geometric Design Figure Vegetation Community Impacts i July 2012
3 Strasburg Road Extension Rush Meadow Street to New Dundee Road City of Kitchener Alternative Route Study Report Final (Rev 02) 1.0 BACKGROUND SNC-Lavalin Inc. (SLI) was retained by the City of Kitchener to undertake an Alternative Route Selection study for the Strasburg Road Extension from its current south terminus at Rush Meadow Street. This study was undertaken to assess another route alternative and compare the functionality and impacts of the alternate route to those of the established Strasburg Road corridor, as illustrated in the City s Official Plan (OP). This study was undertaken as an addendum to the original scope of work that SLI has been working under with respect to the Detail Design of the Strasburg Road Extension from Rush Meadow Street to 500 m north of Stauffer Drive, and the Environmental Assessment Study related to the extension of Strasburg Road from 500 m north of Stauffer Drive to New Dundee Road. The approved alignment of the Strasburg Road Extension from Rush Meadow Street to 500 m north of Stauffer Drive has been developed based on the recommendations from a number of community and transportation network planning studies that were completed between 1981 and With the approval by City Council of the 2004/2005 Development Charge Background Study and the Brigadoon Community Plan, the proposed layout of the Strasburg Road Extension between Rush Meadow Street and 500 m north of Stauffer Drive was reaffirmed. The approval of the Doon South Community Plan Phase II in 2009 reconfirmed the Strasburg Road alignment between Rush Meadow Street and Stauffer Drive. Recent draft approval of the Regional Transportation Master Plan by the Region of Waterloo once again confirmed the need for and prioritization of the extension of Strasburg Road from Rush Meadow Street to New Dundee Road. The proposed Strasburg Road corridor identified for the southerly extension from its current terminus traverses an environmentally sensitive area consisting of a Provincially Significant Wetland (PSW), a dense wooded area and other sensitive environmental features. The objective of this study was to assess a feasible alternative to the current OP alignment that might significantly reduce the environmental impact of the extension of Strasburg Road from Rush Meadow Street to New Dundee Road. The alternative alignment for consideration was established by the City s Senior Project Management Team. Figure 1 in Appendix A illustrates the established alignment based on the City s Official Plan (Base Case) and the proposed alternative alignment (Option 1). To successfully complete this study, and also to understand the impact of the alternative alignment of the Strasburg Road Extension on the transportation network, a wider study area was considered. The only horizon year that was evaluated for traffic forecasting purposes was The horizon year 2018 was chosen based on the 2009 OMB decision related to the Doon South Community Plan. This assignment assessed both the Base Case and Option 1 primarily with respect to the traffic impacts at the existing and future traffic intersections, the future grading impact (footprint) of the proposed alignments, and the environmental impact parameters being used in the EA study. The study area for the traffic impact component was bounded by Huron Road to the north, Homer Watson Boulevard to the east, New Dundee Road to the south and Fischer Hallman Road to the west. The study area road intersections to be analyzed included existing intersections along Huron Road, Homer Watson Boulevard, New Dundee Road and Fischer Hallman Road. The study also evaluated the future road intersections on Strasburg Road. The list below summarizes the study area intersections covered: Existing Intersections: 1. Huron Road & Fischer-Hallman Road; 2. Huron Road & Strasburg Road; 3. Strasburg Road & Rush Meadow Street; 4. Huron Road & Battler Road; 5. Huron Road & Trillium Drive; 1 July 2012
4 6. Homer Watson Boulevard & Manitou Drive; 7. Doon Village Road & Pioneer Drive; 8. Homer Watson Boulevard & Pioneer Drive; 9. Homer Watson Boulevard & Doon South Drive; 10. Homer Watson Boulevard & Conestoga College Boulevard; 11. New Dundee Road, Homer Watson Boulevard & Highway 401 Ramp; 12. New Dundee Road & Conestoga College Boulevard; 13. New Dundee Road & Thomas Slee Drive; 14. New Dundee Road & Robert Ferrie Drive; 15. New Dundee Road & Reichert Drive; 16. New Dundee Road & Reidel Drive; and 17. New Dundee Road & Fischer-Hallman Road; Future Intersections: 1. Strasburg Road & Rockcliffe Drive; 2. Strasburg Road & Biehn Drive; 3. Strasburg Road & Robert Ferrie Drive; 4. Strasburg Road & Blair Creek Drive; 5. New Dundee Road & Collector Road B; and 6. New Dundee Road & Collector Road A. Strasburg Road Extension Rush Meadow Street to New Dundee Road City of Kitchener Alternative Route Study Report Final (Rev 02) Figure 2 in Appendix A illustrates the study area. One of the primary objectives of this study was to identify any possible change of the future traffic assignment on extended Strasburg Road from the proposed development communities around the Brigadoon and Doon South areas with respect to the Base Case and Option 1 alignment alternatives. Another objective of this study was to assess any potential increase in infiltration (short-cutting) of development traffic through the existing neighbourhoods, and also to assess the traffic impact at the neighbouring study area intersections. The proposed alternative alignment would have an impact on the existing neighbourhood intersections; however, to identify the potential impact on the neighbourhood intersections, further studies will be required to quantify the details of impacts on the surrounding intersections within the existing Brigadoon and Doon South areas. The following sections present the assessment of the traffic impact, environmental impact and cost implications for both alignments of the Strasburg Road Extension. 2 July 2012
5 Strasburg Road Extension Rush Meadow Street to New Dundee Road City of Kitchener Alternative Route Study Report Final (Rev 02) 2.0 EXISTING TRAFFIC CONDITION 2.1 EXISTING ROAD NETWORK Huron Road, an urban arterial, exhibits a basic 4-lane cross-section within the study area. The posted speed on Huron Road is 60 km/h within the vicinity of the study area. At the time that this report was prepared, the intersection of Huron Road and Strasburg Road was signalized, but has since been converted to a multi-lane roundabout. Huron Road terminates at Homer Watson Boulevard, forming an interchange. The eastbound left movement on Huron Road at Homer Watson Boulevard operates under Stop control; all other movements at this intersection operate under free flow conditions. Homer Watson Boulevard is another 4-lane divided urban arterial within the City. Homer Watson Boulevard interchanges with Highway 401 and becomes Fountain Street to the south of the interchange. New Dundee Road is a basic 2-lane road, varying from a semi-urban to a rural cross-section as it travels west, and Fischer Hallman Road is also a basic 2-lane rural arterial with a posted speed of 80 km/h. Strasburg Road is an existing 4-lane urban collector, with a posted speed of 50 km/h. The City plans to implement the Strasburg Road Extension as a major 4-lane urban collector with a posted speed of 60 km/h. 2.2 EXISTING TRAFFIC VOLUMES The 2008 traffic volumes during the weekday morning and afternoon peak hours at the existing study area intersections were extracted from the turning volumes reported in the Doon South Community and Broader Study Area Traffic Impact Study November (the Paradigm report). The 2008 traffic volumes were applied with a growth rate of 1% per annum to update the turning movement volumes to Based on the current land use around Strasburg Road, south of Huron Road, no significant change in the traffic turning volumes is anticipated, other than the background corridor growth. Figure 3 in Appendix A illustrates the existing traffic volumes (2010) during the weekday morning and afternoon peak hours, respectively, at all the intersections within the vicinity of the study area. 1 Doon South Community and Broader Study Area Traffic Impact Study November Paradigm Transportation Solutions. 3 July 2012
6 Strasburg Road Extension Rush Meadow Street to New Dundee Road City of Kitchener Alternative Route Study Report Final (Rev 02) 3.0 FUTURE BACKGROUND TRAFFIC VOLUMES 3.1 TRAFFIC DIVERSION The Doon South and Broader Study Area Traffic Impact Study report indicated that the Regional transportation model forecasted a modest traffic diversion from the existing road network upon completion of the Strasburg Road Extension (i.e., diversion of traffic from Huron Road Homer Watson Boulevard onto extended Strasburg Road). Base Case: This report estimates the traffic diversion volumes under 2018 traffic conditions based on the Traffic Impact Study report under reference for the Base Case scenario. The proximity of the Strasburg Road/Reidel Drive and New Dundee Road intersection to the Highway 401 interchange on Homer Watson Boulevard under the Base Case scenario was expected to attract more diverted/induced traffic volumes travelling along Huron Road and Homer Watson Boulevard. This report also assumes that the extension of Robert Ferrie Drive and Blair Creek Drive through the Doon South Community up to Strasburg Road will be completed and both intersections (i.e., Robert Ferrie Drive/Strasburg Road and Blair Creek Drive/Strasburg Road) will be operational under the future traffic conditions. This report, therefore, assumes that traffic using the Stauffer Drive and Riedel Drive intersection will be turning at the Robert Ferrie Drive and Strasburg Road intersection under 2018 traffic conditions. Option 1: With Option 1, a modest diversion of traffic to and from the north/northwest of the Strasburg Road/Huron Road intersection is anticipated. The modest diversion is expected due to the westerly shift of the Strasburg Road alignment relative to the Base Case alignment. The westerly shift of Strasburg Road will create increased travel distances for the diverted traffic, resulting in higher travel times and comparatively reduced travel demand. Extension of Robert Ferrie Drive and Blair Creek Drive up to future Strasburg Road is also anticipated under the Option 1 scenario. The existing intersection of Riedel Drive/Cameron Road and New Dundee Road was expected to remain operational, and future Strasburg Road will form a Tee intersection with New Dundee Road, approximately 925 m to the west. 3.2 CORRIDOR GROWTH The Doon South and Broader Study Area Traffic Impact Study report reflects that, based on the traffic forecast from the Regional model, a corridor growth rate of 1% per year was estimated in and around the study area. This report, therefore, assumes a simple growth rate of 1% per annum to estimate the background traffic volumes during the weekday peak hours under the future background traffic conditions. Based on the anticipated growth rate, a total corridor growth of about 10% will occur from 2008 to The growth of 10% was added to the Strasburg Road corridor volumes to estimate the future background volumes under 2018 traffic conditions. 4 July 2012

7 4.0 FUTURE TOTAL TRAFFIC CONDITION Strasburg Road Extension Rush Meadow Street to New Dundee Road City of Kitchener Alternative Route Study Report Final (Rev 02) Several traffic impact studies in the study area have been completed, which included all the proposed developments in the Brigadoon and Doon South communities, and other developments within the vicinity of the current study area. The Doon South Community and Broader Study Area Traffic Impact Study report prepared in November 2008 was assumed to reflect the latest development scenario in and around the Strasburg Road study area. Most of the traffic impact studies that have been completed so far assumed two specific horizon years for the proposed developments around the Brigadoon and Doon South communities, as well as areas to the west of proposed Strasburg Road, south of Huron Road. The specific horizon years were 2013 (i.e., an interim year of developments) and 2018 as the full build-out horizon year. The Doon South and Broader Study Area Traffic Impact Study report prepared by Paradigm, and the Doon South Community Road Network Review report, prepared by itrans, indicated construction of approximately 7,000 houses in the Brigadoon and Doon South communities. For this study, this development forecast was adjusted to reflect current development plans (September 2010), including the potential future developments, as provided by the City of Kitchener. Based on the latest information provided by the City's Planning Division, approximately 8,450 houses will be built within the vicinity of the study area. The development zones assumed in this study, including previously anticipated phasing of the developments, are illustrated below: 5 July 2012

8 Strasburg Road Extension Rush Meadow Street to New Dundee Road City of Kitchener Alternative Route Study Report Final (Rev 02) In addition to the cited traffic zones (TAZ) in the Paradigm report, this study also considered additional background developments that were included in the Traffic Analysis Report prepared for the recently completed 'Huron Road EA' study by Sernas 2 in October The additional developments, located to the northeast and northwest of the Strasburg Road/Huron Road intersection were also included under the 2018 traffic forecast. Based on the development information received from the City s Planning Division, the following table summarizes the details of the development phasing. Development Zones Approximate Location Land Use Horizon 2013 Horizon T-01201, 30T-98201, 30T West of Strasburg Road Residential 685 units 1,476 units 30T-04204, 30T-04208, 30T-04209, 11a East of Strasburg Road Residential 673 units 110 units 30T-0702, 30T-07204, 30T Doon South Community Residential 521 units 196 units 30T-06203, 4,5 Doon South Community Residential 200 units 214 units 30T-07205, 30T-98202, 25 Brigadoon Community Residential 379 units 711 units 30T Doon South Community Residential 1,050 units 300 units TAZ 1a, 1b, 2 and 3a East of Strasburg Road Residential units TAZ 13b, 13d and 13e East of Strasburg Road Residential units TAZ 20a Doon South Phase II Residential units TAZ 20d, 20e East of Strasburg Road Residential units OP08/07 /S/KA & ZC08/26 /S/KA West of Strasburg Road Residential units Retail/ GFA TAZ 20b East of Strasburg Road - Commercial 89,000 ft 2 2 Transportation and Traffic Analysis Report Huron Road From Strasburg Road to Fischer-Hallman Road October 2009 Sernas Transtech. 6 July 2012
9 Strasburg Road Extension Rush Meadow Street to New Dundee Road City of Kitchener Alternative Route Study Report Final (Rev 02) Development Zones Approximate Location Land Use Horizon 2013 Horizon 2018 TAZ 20c East of Strasburg Road Business GFA - Park 194,000 ft 2 TAZ 20f East of Strasburg Road Business GFA - Park 103,000 ft 2 Conestoga Development Retail/ Retail/ GFA Conestoga College Blvd. - Commercial Commercial 32,000 ft 2 Conestoga Development Office Conestoga College Blvd. Office - GFA 32,000 ft 2 Conestoga Development Hotel Conestoga College Blvd. Hotel Rooms Additional Developments 1 North of Huron Road Residential units Additional Developments 2 North of Huron Road Residential units Additional Developments - 3, 6, 7 North of Huron Road Residential - Assumed 50% Built- Out Additional Developments - 4, 5 North/South on Huron Commercial units Additional Developments 8 North of Huron Road Residential - 64 units Additional Developments 9 South of Huron Road Residential units Additional Developments 10 West of Strasburg Road Residential - Assumed 35% Built- Out Additional Developments - 14a East of Strasburg Road Commercial - 105,500 ft 2 Additional Developments - 14b East of Strasburg Road Residential - 44 units Additional Developments 15 East of Strasburg Road Residential - 64 units Additional Developments 16 East of Strasburg Road Residential - 68 units Additional Developments 17 East of Strasburg Road Commercial - 155,000 ft 2 Additional Developments 18 North of Huron Road Residential - 1,200 units 4.1 SITE TRIP GENERATION Site traffic generation was estimated based on the trip generation factors extracted from the ITE Trip Generation Handbook 8 th Edition. Site traffic forecasts were developed assuming the slower progression rate of residential developments. The sections below discuss the site trip generation in detail Horizon Year: Based on the steady progression of home building, this report assumes construction of an additional 8,449 residential units by the 2018 horizon year. This assumption is based on the horizon year forecasts given in the 2008 Paradigm report, adjusted to reflect current development plans (September 2010), as provided by the City of Kitchener. In addition, the following traffic zones were assumed to contain non-residential land use based on the updated land use plan: TAZ 20b Commercial/Retail Land Use Approximate GLA 89,000 ft 2 ; and TAZ 20e & 20f Business Park Land Use Approximate GFA 297,000 ft 2. The following tables summarize the site trip generation anticipated by residential and non-residential developments, for the horizon years of 2013 and 2018: 7 July 2012
10 Strasburg Road Extension Rush Meadow Street to New Dundee Road City of Kitchener Alternative Route Study Report Final (Rev 02) TAZ 30T-01201, 30T , 30T West of Strasburg Road (685 Units) 30T-04204, 30T , 30T-04209, 11a East of Strasburg Road (673 Units) 30T-0702, 30T , 30T Doon South Community (521 Units) 30T-06203, 4,5 Doon South Community (200 Units) 30T-07205, 30T , 25 Brigadoon Community (379 Units) 30T Doon South Community (1,050 Units) Total 3,508 Units Net New Trips Horizon Year Weekday AM Peak Hour Weekday PM Peak Hour In Out 2-way In Out 2-way Directional Distribution 25% 75% 100% 63% 37% 100% Average Rate Site Traffic based on Average Equation Rate Site Traffic based on Equation Transit %age 5% 5% 5% 5% 5% 5% Less Trips for Transit Total Trips Directional Distribution 25% 75% 100% 63% 37% 100% Average Rate Site Traffic based on Average Equation Rate Site Traffic based on Equation Transit %age 5% 5% 5% 5% 5% 5% Less Trips for Transit Total Trips Directional Distribution 25% 75% 100% 63% 37% 100% Average Rate Site Traffic based on Average Equation Rate Site Traffic based on Equation Transit %age 5% 5% 5% 5% 5% 5% Less Trips for Transit Total Trips Directional Distribution 25% 75% 100% 63% 37% 100% Average Rate Site Traffic based on Average Equation Rate Site Traffic based on Equation Transit %age 5% 5% 5% 5% 5% 5% Less Trips for Transit Total Trips Directional Distribution 25% 75% 100% 63% 37% 100% Average Rate Site Traffic based on Average Equation Rate Site Traffic based on Equation Transit %age 5% 5% 5% 5% 5% 5% Less Trips for Transit Total Trips Directional Distribution 25% 75% 100% 63% 37% 100% Average Rate Site Traffic based on Average Equation Rate Site Traffic based on Equation Transit %age 5% 5% 5% 5% 5% 5% Less Trips for Transit Total Trips ,780 2,380 1,835 1,070 2,905 8 July 2012
11 Strasburg Road Extension Rush Meadow Street to New Dundee Road City of Kitchener Alternative Route Study Report Final (Rev 02) TAZ 30T-01201, 30T , 30T West of Strasburg Road (1,476 Units) 30T-04204, 30T , 30T , 11a East of Strasburg Road (110 Units) 30T-0702, 30T , 30T Doon South Community (196 Units) 30T-06203, 4,5 Doon South Community (214 Units) 30T-07205, 30T , 25 Brigadoon Community (711 Units) 30T Doon South Community (300 Units) Horizon Year Weekday AM Peak Hour Weekday PM Peak Hour In Out 2-way In Out 2-way Directional Distribution 25% 75% 100% 63% 37% 100% Average Rate Site Traffic based on Average Equation Rate Site Traffic based on Equation Transit %age 5% 5% 5% 5% 5% 5% Less Trips for Transit Total Trips Directional Distribution 25% 75% 100% 63% 37% 100% Average Rate Site Traffic based on Average Equation Rate Site Traffic based on Equation Transit %age 5% 5% 5% 5% 5% 5% Less Trips for Transit Total Trips Directional Distribution 25% 75% 100% 63% 37% 100% Average Rate Site Traffic based on Average Equation Rate Site Traffic based on Equation Transit %age 5% 5% 5% 5% 5% 5% Less Trips for Transit Total Trips Directional Distribution 25% 75% 100% 63% 37% 100% Average Rate Site Traffic based on Average Equation Rate Site Traffic based on Equation Transit %age 5% 5% 5% 5% 5% 5% Less Trips for Transit Total Trips Directional Distribution 25% 75% 100% 63% 37% 100% Average Rate Site Traffic based on Average Equation Rate Site Traffic based on Equation Transit %age 5% 5% 5% 5% 5% 5% Less Trips for Transit Total Trips Directional Distribution 25% 75% 100% 63% 37% 100% Average Rate Site Traffic based on Average Equation Rate Site Traffic based on Equation Transit %age 5% 5% 5% 5% 5% 5% Less Trips for Transit Total Trips July 2012
12 Strasburg Road Extension Rush Meadow Street to New Dundee Road City of Kitchener Alternative Route Study Report Final (Rev 02) TAZ 1a, 1b, 2 and 3a East of Strasburg Road (799 Units) 13b, 13d and 13e East of Strasburg Road (149 Units) 20a Doon South Phase II (144 Units) 20d, 20e East of Strasburg Road (342 Units) OP08/07 /S/KA & ZC08/26 /S/KA West of Strasburg Road (500 Units) Total 4,941 Units Horizon Year Weekday AM Peak Hour Weekday PM Peak Hour In Out 2-way In Out 2-way Directional Distribution 25% 75% 100% 63% 37% 100% Average Rate Site Traffic based on Average Equation Rate Site Traffic based on Equation Transit %age 5% 5% 5% 5% 5% 5% Less Trips for Transit Total Trips Directional Distribution 25% 75% 100% 63% 37% 100% Average Rate Site Traffic based on Average Equation Rate Site Traffic based on Equation Transit %age 5% 5% 5% 5% 5% 5% Less Trips for Transit Total Trips Directional Distribution 25% 75% 100% 63% 37% 100% Average Rate Site Traffic based on Average Equation Rate Site Traffic based on Equation Transit %age 5% 5% 5% 5% 5% 5% Less Trips for Transit Total Trips Directional Distribution 25% 75% 100% 63% 37% 100% Average Rate Site Traffic based on Average Equation Rate Site Traffic based on Equation Transit %age 5% 5% 5% 5% 5% 5% Less Trips for Transit Total Trips Directional Distribution 25% 75% 100% 63% 37% 100% Average Rate Site Traffic based on Average Equation Rate Site Traffic based on Equation Transit %age 5% 5% 5% 5% 5% 5% Less Trips for Transit Total Trips Net New Trips 855 2,530 3,385 2,585 1,520 4, July 2012
13 Strasburg Road Extension Rush Meadow Street to New Dundee Road City of Kitchener Alternative Route Study Report Final (Rev 02) TAZ 20b Retail/ Commercial Development (GFA 89,000 ft 2 ) 20c Business Park (GFA 194,000 ft 2 ) 20f Business Park (GFA 103,000 ft 2 ) Sub-Total Non-Residential Development Weekday AM Peak Hour Weekday PM Peak Hour - Horizon Year In Out 2-way In Out 2-way Directional Distribution 60% 40% 100% 50% 50% 100% Average Rate Site Traffic based on Average Equation Rate Site Traffic based on Equation Synergy %age 50% 50% 50% 40% 40% 40% Less Trips for Synergy Transit %age 5% 5% 5% 5% 5% 5% Less Trips for Transit Total Trips Directional Distribution 85% 15% 100% 22% 78% 100% Average Rate Site Traffic based on Average Equation Rate Site Traffic based on Equation Synergy %age 50% 50% 50% 50% 50% 50% Less Trips for Synergy Transit %age 5% 5% 5% 5% 5% 5% Less Trips for Transit Total Trips Directional Distribution 85% 15% 100% 22% 78% 100% Average Rate Site Traffic based on Average Equation Rate Site Traffic based on Equation Synergy %age 50% 50% 50% 50% 50% 50% Less Trips for Synergy Transit %age 5% 5% 5% 5% 5% 5% Less Trips for Transit Total Trips Net New Trips A peripheral development on Conestoga College Boulevard was assumed to accommodate the following land use: Retail Land Use Approximate GFA 32,000ft 2 ; Office Land Use Approximate GFA 32,000ft 2 ; and Hotel Land Use Consisting of approximately 190 rooms Conestoga Developments Retail/ Commercial (32,000 ft 2 ) Horizon Year Weekday AM Peak Hour Weekday PM Peak Hour In Out 2-way In Out 2-way Directional Distribution 60% 40% 100% 50% 50% 100% Average Rate Site Traffic based on Average Equation Rate Site Traffic based on Equation Synergy %age 50% 50% 50% 50% 50% 50% Less Trips for Synergy Transit %age 5% 5% 5% 5% 5% 5% Less Trips for Transit Total Trips July 2012
14 Strasburg Road Extension Rush Meadow Street to New Dundee Road City of Kitchener Alternative Route Study Report Final (Rev 02) Conestoga Developments Office (32,000 ft 2 ) Hotel (190 Rooms) Sub-Total Horizon Year Weekday AM Peak Hour Weekday PM Peak Hour In Out 2-way In Out 2-way Directional Distribution 88% 12% 100% 17% 83% 100% Average Rate Site Traffic based on Average Equation Rate Site Traffic based on Equation Synergy %age 50% 50% 50% 50% 50% 50% Less Trips for Synergy Transit %age 5% 5% 5% 5% 5% 5% Less Trips for Transit Total Trips Directional Distribution 55% 45% 100% 57% 43% 100% Average Rate Site Traffic based on Average Equation Rate Site Traffic based on Equation Transit %age 5% 5% 5% 5% 5% 5% Less Trips for Transit Total Trips Net New Trips In addition to the above developments, this study also considered additional developments included in the Traffic Analysis Report prepared for Huron Road EA, completed by Sernas in October The additional development zones and their associated trip generation (as given in the Sernas report) are shown below. Additional Developments Weekday AM Peak Hour Weekday PM Peak Hour Zones Size Development Type In Out 2-way In Out 2-way units Residential 25% 75% 100% 63% 37% 100% units Residential 25% 75% 100% 63% 37% 100% , 6, 7 Assumed 50% Built-Out Residential 4, units Commercial 8 64 units Residential units Residential 10 Assumed 35% Built-Out Residential 14a 105,500 ft 2 Commercial 14b 44 units Residential units Residential 25% 75% 100% 63% 37% 100% % 50% 100% 61% 39% 100% % 75% 100% 63% 37% 100% % 75% 100% 63% 37% 100% % 75% 100% 63% 37% 100% % 50% 100% 61% 39% 100% % 75% 100% 25% 75% 100% % 75% 100% 63% 37% 100% July 2012
15 Strasburg Road Extension Rush Meadow Street to New Dundee Road City of Kitchener Alternative Route Study Report Final (Rev 02) Additional Developments Weekday AM Peak Hour Weekday PM Peak Hour Zones Size Development Type In Out 2-way In Out 2-way units Residential 25% 75% 100% 63% 37% 100% ,000 ft 2 Commercial 50% 50% 100% 61% 39% 100% ,200 units Residential 25% 75% 100% 63% 37% 100% Only the additional development trips generated from Zones 14a 17 (highlighted in the above table) are considered as net additional trips. The other developments are either already included in the 2008 Paradigm report or included in the future background traffic. With all these developments, this study estimates the following in terms of net new trips that would be added onto the future area road network under the future traffic conditions due to all the developments in Brigadoon and Doon South communities and the Conestoga College Boulevard area: Horizon 2010 to to 2018 Development Site East Side of Strasburg Road West Side of Strasburg Road Land Use Weekday AM Peak Hour Weekday PM Peak Hour In Out 2-way In Out 2-way Residential 420 1,240 1,660 1, ,005 Commercial Sub-total 420 1,240 1,660 1, ,005 Residential Commercial Sub-total East + West Total 600 1,780 2,380 1,835 1,070 2,905 East Side of Strasburg Road West Side of Strasburg Road Residential 521 1,533 2,054 1, ,595 Commercial Sub-total 927 1,824 2,751 2,134 1,432 3,566 Residential 370 1,105 1,475 1, ,705 Commercial Sub-total 370 1,105 1,475 1, ,705 East + West Total 1,297 2,929 4,226 3,209 2,062 5, to 2018 East + West Overall Total 1,897 4,709 6,606 5,044 3,132 8,176 Based on the previously approved traffic study reports referenced, this study assumes: TAZ #21 and #9 are assumed to be 100% built out under existing traffic conditions, so are not included in the developments; TAZ 20b was presumed to be developed as a Shopping Centre with an approximate GFA of 89,000 ft 2, whereas 20c and 20f were classified as Business Park consisting of approximately 193,750 ft 2 and 103,000 ft 2 GFA; A mixed-use development comprising of 63,000ft 2 consisting of 50% retail and 50% office use has been proposed on Conestoga College Boulevard. The total development on Conestoga College Boulevard also included a 190-room hotel; The non-residential land use, excluding the hotel land use, assumes 50% synergy trips; 13 July 2012
16 Strasburg Road Extension Rush Meadow Street to New Dundee Road City of Kitchener Alternative Route Study Report Final (Rev 02) Site trips were adjusted presuming a modal split of 95% and 5% as auto and transit users, respectively; The Strasburg Road and Robert Ferrie Drive intersection was presumed to be a three-legged intersection, where Robert Ferrie Drive will terminate at Strasburg Road; and 10% of existing traffic along Homer Watson Boulevard is assumed to be diverted along the extended Strasburg Road due to its strategic location within the existing area road network. 4.2 SITE TRIP DISTRIBUTION The site trip distribution was developed based on available information from the traffic impact study report under reference. The site traffic distribution is summarized in the following table: Directions Weekday AM Peak Hour Weekday PM Peak Hour IN OUT IN OUT North 25% 40% 40% 25% Northwest 30% 20% 20% 30% East 35% 30% 30% 35% Southwest/Southeast 10% 10% 10% 10% Total 100% 100% 100% 100% Figures 4 and 5 in Appendix A illustrate the above site trip distributions on the surrounding area road network and with respect to the trips originating from the proposed developments located to the west and the east of Strasburg Road, respectively. 4.3 SITE TRIP ASSIGNMENTS BASE CASE Based on the site trip distribution parameters above and also the assumptions below, the development trips were assigned onto the Strasburg Road study area intersections. The assumptions with respect to the Base Case trip assignment were as follows: For the proposed developments located to the west of Strasburg Road, a fixed portion of approximately 15% of the net new trips will be accessed via Rockcliffe Drive to Strasburg Road and the other 85% will be accessed via the north entrance on Huron Road. For the proposed developments located to the east of Strasburg Road, a gravity model based on an inverse relationship to the average daily distance travelled was employed to estimate the portion of the net new trips that will be using the Strasburg Road for access. For trips originating in developments east of Strasburg Road, it was assumed that these trips would be split 20% along Biehn Drive, 40% along Robert Ferrie Drive and 40% along Blair Creek Drive. The following table illustrates the average daily travel distances assumed in the gravity model for the estimation of the portion of the net new trips generated from the developments east of Strasburg Road that will be using Strasburg Road for access under the Base Case scenario. 14 July 2012
17 Strasburg Road Extension Rush Meadow Street to New Dundee Road City of Kitchener Alternative Route Study Report Final (Rev 02) Destinations Average Daily Travel Distance (m) Not using Strasburg Road Using Strasburg Road (Base Case) AM Outbound Percent Distribution % Development Trips Using Strasburg Road (Base Case) To North (Downtown Kitchener) To Northwest (City of Waterloo) To East (City of Cambridge) To Southwest/ Southeast (Hwy 401) 12,400 13,200 40% 44% 14,200 15,960 20% 40% 13,500 19,700 30% 24% 7,250 7,540 10% 46% Weighted Average 37% The forecast future total traffic volumes under the 2018 horizon were estimated by adding the future background volumes and the development volumes for all the intersections on Strasburg Road (i.e., from Huron Road to New Dundee Road). The future total traffic volumes at all the other study area intersections were extracted from the 2008 Paradigm report. Figure 6 in Appendix A illustrates the future total traffic volumes with the Base Case scenario OPTION 1 The proposed Strasburg Road alignment under Option 1 will be approximately 1.0 km to the west of the established Strasburg Road alignment considered under the Base Case. With Option 1, future Blair Creek Drive and future Robert Ferrie Drive will require further westerly extension of approximately 1.0 km, whereas Biehn Drive would likely not be extended to Strasburg Road due to potential environmental impacts. With Option 1, Biehn Drive is assumed to be connected with future Robert Ferrie Dive. With the increased distance between the Strasburg Road alignment and the Brigadoon and Doon South communities and also based on the site trip distribution parameters, a change in the development trip assignment is expected. The assumptions with respect to the Option 1 trip assignment were as follows: For the proposed developments located to the west of Strasburg Road, the same portion of approximately 15% of the net new trips will be accessed via Rockcliffe Drive to Strasburg Road and the other 85% will be accessed via the north entrance on Huron Road. For trips originating in developments east of Strasburg Road, it was assumed that these trips would be split 60% along Robert Ferrie Drive and 40% along Blair Creek Drive, respectively. The following table illustrates the average daily travel distances assumed in the gravity model for the estimation of the portion of the net new trips generated from the developments east of Strasburg Road that will be using Strasburg Road for access under the Option 1 scenario. 15 July 2012
18 Strasburg Road Extension Rush Meadow Street to New Dundee Road City of Kitchener Alternative Route Study Report Final (Rev 02) Destinations Average Daily Travel Distance (m) Not Using Strasburg Road Using Strasburg Road (Option 1) AM Outbound Percent Distribution % Development Trips Using Strasburg Road (Option 1) To North (Downtown Kitchener) To Northwest (City of Waterloo) To East (City of Cambridge) To Southwest/ Southeast (Hwy 401) 12,400 15,050 40% 34% 14,200 17,810 20% 32% 13,500 21,550 30% 20% 7,250 9,390 10% 30% Weighted Average 29% As can be seen from the above, Strasburg Road is assumed to carry approximately 29% of the net new trips from the developments located to the east of the road under Option 1 as compared to 37% in the Base Case. The balance of the 8% development trips to the east side of Strasburg Road were thus redistributed through the following intersections: 1. Battler Drive/Huron Road; 2. Trillium Drive/Huron Road; 3. Doon South Road/Homer Watson Boulevard; 4. Manitou Drive/Homer Watson Boulevard 5. Future Collector Road A /New Dundee Road; 6. Future Collector Road B /New Dundee Road; 7. Robert Ferrie Drive/New Dundee Road; 8. Conestoga College Boulevard/New Dundee Road; 9. Thomas Slee Drive/New Dundee Road; and 10. New Dundee Road/Homer Watson Boulevard/Highway 401 Ramp The forecast future total traffic volumes under the 2018 horizon for all the intersections on Strasburg Road (i.e., from Huron Road to New Dundee Road) were estimated by adding the future background volumes and the development volumes. The future total traffic volumes at the other study area intersections were again extracted from the 2008 Paradigm report, and adjusted to reflect more inbound and outbound development volumes due to the shifted Strasburg Road alignment. Figure 7 in Appendix A illustrates the future total traffic volumes with the Option 1 scenario. 16 July 2012
19 Strasburg Road Extension Rush Meadow Street to New Dundee Road City of Kitchener Alternative Route Study Report Final (Rev 02) 5.0 TRAFFIC IMPACT ASSESSMENT As discussed in the previous sections, the traffic assessment is based upon the 2008 traffic counts extracted from the Paradigm report, corridor growth factors, future forecast traffic volumes along Strasburg Road, and the future total traffic volumes extracted from the Paradigm report. As discussed earlier, the study area intersections consist of some unsignalized public road intersections, and seventeen existing signalized intersections. Evaluation of the performance measures of the signalized and unsignalized intersections have been completed under the existing (2010) and future traffic conditions (2018). The following paragraphs discuss the traffic analysis results and identify any traffic operation issues. Analysis of the signalized and unsignalized study area intersections was undertaken using the procedure set out in the Highway Capacity Manual (HCM 2000), with the assistance of the Synchro, Version 7 - Trafficware Traffic Signal Timing software package. The intersection operation is typically described based on Level of Service (LOS) ratings that are expressed on a scale of A to F, where A is considered excellent (i.e., very little delay) and F is considered unacceptable (i.e., very congested, very long delays), as outlined below. LEVEL OF SERVICE Signalized Intersection Unsignalized Intersection A 10 sec 10 sec B sec sec C sec sec D sec sec E sec sec F 80 sec 50 sec The roundabout controlled intersections were analyzed using the aasidra Version 5.0 software package, which evaluates delay and LOS based on HCM methodology. 5.1 EXISTING TRAFFIC CONDITIONS (2010) Existing signal timing plans were utilized to assess the performance measures of the existing signalized intersections within the study area. The review of existing traffic conditions reveals that all the study area intersections operate generally with acceptable levels of service under 2010 traffic conditions, with some exceptions, which are discussed below. The table below summarizes the overall performance measures of the existing signalized study area intersections. Summary results of the capacity analysis are provided in Appendix B. CAPACITY ANALYSIS RESULTS SIGNALIZED INTERSECTIONS EXISTING TRAFFIC CONDITIONS (2010) Weekday AM Peak Hour 2010 Weekday PM Peak Hour 2010 Intersections V/C Ratio Average Delay (sec) Level of Service (LOS) V/C Ratio Average Delay (sec) Level of Service (LOS) Strasburg Rd/Huron Rd A A Battler Rd/Huron Rd A A 17 July 2012
20 Strasburg Road Extension Rush Meadow Street to New Dundee Road City of Kitchener Alternative Route Study Report Final (Rev 02) Weekday AM Peak Hour 2010 Weekday PM Peak Hour 2010 Intersections V/C Ratio Average Delay (sec) Level of Service (LOS) V/C Ratio Average Delay (sec) Level of Service (LOS) Trillium Dr/Huron Rd A A Homer Watson Blvd/Manitou Dr D D Pioneer Dr/ Manitou Dr A B Homer Watson Blvd/Pioneer Dr D C Homer Watson Blvd/Doon South Dr B B Homer Watson Blvd/Conestoga College Blvd New Dundee Rd /Homer Watson /Highway 401 Ramp C C A B Fischer Hallman Rd/New Dundee Rd D C The performance measures of the unsignalized intersections are summarized below: CAPACITY ANALYSIS RESULTS UNSIGNALIZED INTERSECTIONS EXISTING TRAFFIC CONDITIONS (2010) Weekday AM Peak Hour 2010 Weekday PM Peak Hour 2010 Intersections V/C Ratio Average Delay (sec) Level of Service (LOS) V/C Ratio Average Delay (sec) Level of Service (LOS) Conestoga College Blvd/New Dundee Road Overall A A Eastbound LT C C Eastbound RT A B Pioneer Dr/Manitou Drive A B New Dundee Road and Thomas Slee Drive Overall A A Southbound shared LT-RT B C New Dundee Road and Robert Ferrie Drive Overall A A Southbound shared LT-RT B C New Dundee Road and Reichert Drive Overall A A Northbound shared Lt-RT B B New Dundee Road and Riedel Drive/Cameron Road Overall A A Northbound shared LT-T-RT C C Southbound shared LT-T-RT C B 18 July 2012
21 Strasburg Road Extension Rush Meadow Street to New Dundee Road City of Kitchener Alternative Route Study Report Final (Rev 02) CAPACITY ANALYSIS RESULTS ROUNDABOUT INTERSECTIONS EXISTING TRAFFIC CONDITIONS (2010) Weekday AM Peak Hour 2010 Weekday PM Peak Hour 2010 Intersections V/C Ratio Average Delay (sec) Level of Service (LOS) V/C Ratio Average Delay (sec) Level of Service (LOS) Huron Rd/Fischer Hallman Rd A A Review of the capacity analysis results of the study area intersections reveals that all the signalized and unsignalized intersections operate with acceptable levels of service during both the weekday peak hours under existing traffic conditions. Demands at a few of the signalized intersections (i.e., Fischer Hallman Road/New Dundee Road during the weekday morning, and Huron Road/Manitou Drive during the weekday afternoon) surpass the respective available capacities, although the average delays still remain within acceptable levels. 5.2 FUTURE TOTAL TRAFFIC CONDITIONS (2018) The performance measure evaluation of the study area intersections was carried out based on the future traffic forecast for the 2018 horizon year. To identify any traffic operation issues related to the proposed alignments of the Strasburg Road Extension under the future total traffic conditions in 2018, the capacity analysis of the study area intersections was developed separately with the following scenarios: Base Case (i.e., the approved Strasburg Road alignment as accepted in the OP); and Option 1 (i.e., the alignment alternative located approximately 1.0 km west of the established OP alignment). A high level signal warrant analysis has been conducted for all the new intersections. For intersections that warranted signal control, it was assumed that roundabouts would be preferred, unless roundabouts are not feasible to implement due to topography/sightline constraints. The assumed intersection control for these new intersections is shown in the following table. Intersections Signal Warranted? Assumed Type of Intersection Rockcliffe Drive/Strasburg Road No 1-Way Stop Control Biehn Drive/Strasburg Road No 1-Way Stop Control Strasburg Road/Robert Ferrie Drive Yes Blair Creek Drive/Strasburg Road Yes New Dundee Road/Strasburg Yes Signal Road/Cameron Road (Base Case) 1 New Dundee Road/Strasburg Road (Alternative 1) Yes New Dundee Road/Cameron Road Yes Signal (Alternative 1) 1 New Dundee Rd/Collector B No 1-Way Stop Control New Dundee Rd/Collector A No 1-Way Stop Control Note: 1. Traffic signals are assumed due to the limited sightline at the existing intersection of Cameron Road and New Dundee Road. 19 July 2012
22 Strasburg Road Extension Rush Meadow Street to New Dundee Road City of Kitchener Alternative Route Study Report Final (Rev 02) BASE CASE The initial (Base Case) assessment assumes that the Strasburg Road Extension will be built exactly following the approved alignment as shown in the City s OP. The capacity analysis results of the signalized intersections and unsignalized intersections are summarized below. The detailed output results are provided in Appendix B. CAPACITY ANALYSIS RESULTS SIGNALIZED INTERSECTIONS 2 FUTURE TRAFFIC CONDITIONS (2018) Intersections Weekday AM Peak Hour 2018 Weekday PM Peak Hour 2018 V/C Ratio Average Delay (sec) Level of Service (LOS) V/C Ratio Average Delay (sec) Level of Service (LOS) Battler Road/Huron Rd B C Trillium Dr/Huron Rd A A Doon South Dr/Homer Watson Blvd C B Manitou Dr/Homer Watson Blvd D D Pioneer Dr/Homer Watson Blvd D D Conestoga College Blvd/Homer Watson Blvd C C Thomas Slee Dr/New Dundee Rd A A New Dundee Rd /Homer Watson B D Blvd/Highway 401 Ramp 3 Fischer-Hallman Rd/New Dundee Rd D B Pioneer Dr/Manitou Dr A B Strasburg Rd/New Dundee Rd/ C C Cameron Road 1 Note: 1. Traffic signals are suggested due to the limited sightline at the existing intersection of Cameron Road and New Dundee Road; 2. All the recommended road network improvements from the recommendations made in the Doon South Community and Broader Study Area Traffic Impact Study were incorporated in the capacity analyses; 3. New Dundee Rd/Homer Watson Blvd/Hwy 401 ramp terminal intersection, Homer Watson Blvd/Manitou Dr and Pioneer Dr/Manitou Dr intersections will require some additional improvements to operate at an acceptable LOS; and 4. Thomas Slee Dr/New Dundee Rd intersection has been proposed to be a signalized intersection. The performance measures of the unsignalized intersections are summarized below: CAPACITY ANALYSIS RESULTS UNSIGNALIZED INTERSECTIONS FUTURE TRAFFIC CONDITIONS (2018) Intersections Weekday AM Peak Hour 2018 Weekday PM Peak Hour 2018 V/C Ratio Conestoga College Blvd/New Dundee Rd Average Delay (sec) Level of Service (LOS) V/C Ratio Average Delay (sec) Level of Service (LOS) Overall A B East bound LT C D East bound RT B C New Dundee Rd/Reichert Dr Average B C NB shared LT- RT C C 20 July 2012
23 Strasburg Road Extension Rush Meadow Street to New Dundee Road City of Kitchener Alternative Route Study Report Final (Rev 02) Intersections Weekday AM Peak Hour 2018 Weekday PM Peak Hour 2018 V/C Ratio New Dundee Rd/Collector B Average Delay (sec) Level of Service (LOS) V/C Ratio Average Delay (sec) Level of Service (LOS) Overall A A SBLT B D SBRT B B New Dundee Rd/Collector A Overall A B SBLT C D SBRT B B Biehn Dr/Strasburg Rd Overall C E WB Shared LT- RT Rockcliffe Dr/Strasburg Rd C D Overall A A EB Shared LT- RT Rush Meadow St/Strasburg Rd C D Overall A A WB shared LT- RT C C CAPACITY ANALYSIS RESULTS ROUNDABOUT INTERSECTIONS FUTURE TRAFFIC CONDITIONS (2018) Intersections Weekday AM Peak Hour 2018 V/C Ratio Average Delay (s) Level of Service (LOS) Weekday PM Peak Hour 2018 V/C Ratio Average Delay (s) Huron Rd/Fischer Hallman Rd B C Huron Rd/Strasburg Rd C D New Dundee Rd/Robert Ferrie Dr A A Strasburg Rd/Robert Ferrie Dr A A Blair Creek Dr/Future Strasburg Rd A A Note: 1. Existing single-lane roundabout needs to be improved to a two-lane roundabout, including widening all the approaches; 2. Existing intersection control will be replaced by 2-lane roundabout and widened approaches; and 3. Assumes a new 2-lane roundabout for the future intersection of Strasburg Road and Robert Ferrie Drive OPTION 1 Level of Service (LOS) This assessment assumes that the Option 1 alternative for Strasburg Road will be built approximately 1.0 km west of the approved and accepted alignment, as shown in the City s OP. With the westerly shift of Strasburg Road, a significantly lower travel demand is expected along Strasburg Road, as discussed in Section The reduction in demand on Strasburg Road will result in more new development traffic travelling along the existing/nearby road network, yielding higher flows at some of the study area intersections. The additional infiltration of traffic through the area road network is discussed further in Section Capacity analyses were carried out on all of the interactions in the network and can be found in Appendix B. The comparison of intersection delays between Option 1 and the base were carried out on the following existing intersections, which are presumed to be affected by additional traffic infiltration: 21 July 2012
24 Battler Road and Huron Road; Trillium Drive and Huron Road; Doon South Road and Homer Watson Boulevard; Manitou Drive and Homer Watson Boulevard; New Dundee Road and Thomas Slee Drive; New Dundee Road and Collector B ; New Dundee Road and Collector A ; Robert Ferrie Drive and New Dundee Road; Conestoga College Boulevard and New Dundee Road; and New Dundee Road, Homer Watson Boulevard and Highway 401 Ramp. Strasburg Road Extension Rush Meadow Street to New Dundee Road City of Kitchener Alternative Route Study Report Final (Rev 02) The capacity analysis results of the signalized intersections and unsignalized intersections are summarized below. The detailed output results are provided in Appendix B. CAPACITY ANALYSIS RESULTS SIGNALIZED INTERSECTIONS FUTURE TRAFFIC (2018) OPTION1 Intersections Weekday AM Peak Hour 2018 Weekday PM Peak Hour 2018 V/C Ratio Average Delay (sec) Level of Service (LOS) V/C Ratio Average Delay (sec) Level of Service (LOS) Battler Rd/Huron Rd B C Trillium Dr/Huron Rd B C Doon South Rd/Homer Watson Blvd C B Manitou Dr/Homer Watson Blvd D D Thomas Slee Dr/New Dundee Rd A A New Dundee Rd /Homer Watson Blvd/ Highway 401 Ramp B E CAPACITY ANALYSIS RESULTS UNSIGNALIZED INTERSECTIONS FUTURE TRAFFIC (2018) OPTION 1 Intersections Weekday AM Peak Hour 2018 Weekday PM Peak Hour 2018 V/C Ratio New Dundee Rd/Collector B Average Delay (sec) Level of Service (LOS) V/C Ratio Average Delay (sec) Overall A A SBLT C D SBRT B B New Dundee Rd/Collector A Overall A B SBLT C C SBRT B B Conestoga College Blvd/New Dundee Rd Overall A B EBLT C D EBRT B C Level of Service (LOS) 22 July 2012
25 Strasburg Road Extension Rush Meadow Street to New Dundee Road City of Kitchener Alternative Route Study Report Final (Rev 02) CAPACITY ANALYSIS RESULTS ROUNDABOUT INTERSECTIONS FUTURE TRAFFIC (2018) OPTION 1 Weekday AM Peak Hour 2018 Weekday PM Peak Hour 2018 Intersections V/C Ratio Average Delay (sec) Level of Service (LOS) V/C Ratio Average Delay (sec) Level of Service (LOS) New Dundee Rd/Robert Ferrie Dr A A In general, intersection delays increase under the Option 1 alignment. The intersection with the largest increase in delay is Trillium Drive/Huron Road, with an increase of approximately (+) 454% during the weekday AM and approximately (+) 237% during the afternoon peak hour. The impacts on delays at other intersections due to the Option 1 alignment are summarized below. Signalized Intersections: Battler Drive/Huron Road Additional delay of about (+) 2% during the weekday AM and approximately (+) 18% during the afternoon peak hour; Doon South Road/Homer Watson Boulevard. - Additional delay of about (+) 19% during the weekday AM and approximately (+) 7% during the afternoon peak hour; Manitou Drive/Homer Watson Boulevard Additional delay of about (+) 21% during the weekday AM and approximately (+) 4% during the afternoon peak hour. With Option 1, the overall demand meets the capacity during the weekday morning peak hour under future total traffic conditions; Thomas Slee Drive/New Dundee Road Additional delay of about (+) 5% during the weekday AM and approximately (+) 2% during the afternoon peak hour; and New Dundee Road/Homer Watson Boulevard/Highway 401 Ramp Additional delay of about (+) 5% during the weekday AM and approximately (+) 2% during the afternoon peak hour. With Option 1, the overall demand exceeds the capacity and has an unacceptable LOS during the weekday afternoon peak hour under future total traffic conditions. Unsignalized Intersections: Collector Road A /New Dundee Road Additional delay of about (+) 22% during the weekday AM and approximately (+) 18% during the afternoon peak hour; Collector Road B /New Dundee Road Additional delay of about (+) 25% during the weekday AM and approximately (+) 9% during the afternoon peak hour; and Conestoga College Boulevard/New Dundee Road Additional delay of about (+) 8% during the weekday AM and approximately (+) 7% during the afternoon peak hour. Intersections: New Dundee Road/Robert Ferrie Drive Negligible impact is expected. The comparative evaluation clearly identifies that most of the major arterial intersections along Huron Road, Homer Watson Boulevard and along New Dundee Road, primarily to the east of proposed Strasburg Road, operate better in the Base Case scenario. The deteriorated performance measures on these intersections with Option 1 are primarily the result of additional traffic volumes that are expected through infiltration on the existing neighbourhood streets TRAFFIC INFILTRATION One of the major impacts of the westerly shift of the Strasburg Road alignment is expected to be an increase in traffic infiltration through the existing Brigadoon and Doon South road network. To gain a more precise understanding of the impact of the traffic infiltration on the existing neighbourhood streets and intersections, further traffic studies should be undertaken in greater detail. 23 July 2012
26 Strasburg Road Extension Rush Meadow Street to New Dundee Road City of Kitchener Alternative Route Study Report Final (Rev 02) In addition, the Option 1 alignment is not supported from the transit catchment perspective. In the Base Case scenario, about a 5% reduction in the total net development trips was assumed due to transit use. Under the Option 1 scenario, this level of reduction in auto trips due to transit use may not be realized and these additional auto trips will also infiltrate the surrounding road network. The following table estimates the total amount of traffic infiltration (in ADT) that might occur under the Option 1 scenario Horizon AM Peak Hour PM Peak Hour Throughout the Weekday Net New Trips Originating From Developments to the East of Strasburg Road 8% of the Net New Trips Originating From Developments to the East of Strasburg Road being redistributed due to the alignment shift in Option 1 Reduced auto trips accounted for in the Base Case scenario due to transit use 4,411 5,571 49, , ,600 Total estimated ADT of the Infiltration Volumes through Brigadoon and Doon South Areas 7,595 The table above summarizes the additional daily traffic volumes that are expected to infiltrate through the existing community road area network. With the westerly shift of Strasburg Road, approximately 7,600 additional ADT will tend to shortcut through the existing road network. With such high traffic volumes making their way through the neighbourhood road system, it is expected that there will be significant impacts on the traffic operations of the internal road network intersections. With the increase in infiltration volumes, there might be potential increases in the number of collisions at the existing neighbourhood intersections, since the number of collision is typically proportional to the average daily traffic volumes. Moreover, with additional congestion due to the higher volume of turning traffic, there may be increases in greenhouse gas emissions associated with additional traffic congestion. Based on the existing road network within the Brigadoon Community and the existing/future road network within the Doon South Community, it is likely that the additional infiltration volumes would travel primarily via Caryndale Drive-Biehn Drive, Robert Ferrie Drive-Doon South Drive-Doon Mills Drive and Doon Village Road, which will affect a number of internal road intersections. A detailed traffic study will be required to evaluate the impact on the existing neighbourhood intersections. 24 July 2012
27 Strasburg Road Extension Rush Meadow Street to New Dundee Road City of Kitchener Alternative Route Study Report Final (Rev 02) 6.0 ENGINEERING IMPACT An engineering feasibility and cost evaluation of both the Base Case and Option 1 was undertaken, as illustrated in Figure 1 provided in Appendix C. In both cases, the road geometry was established according to design criteria consistent with a design speed of 70 km/h, and assumes a continuous 4-lane urban cross-section with a boulevard extending to the ROW limit. A 30m ROW was used for the Strasburg Road corridor, and a 26m ROW was used for the side road (collector) extensions. PROPOSED DESIGN CRITERIA Design Parameters Present Condition (North of Rush Meadow Street) Design Standards (COK Development Manual April 2010) Proposed Standards ROW Width 26 m 30 m (Secondary Arterial) 30 m Posted Speed 50 km/h 50 km/h 60 km/h Design Speed N/A km/h 70 km/h Minimum Stopping Sight Distance N/A m 95 m Equivalent Minimum 'K' Factor N/A 9 or 16 Sag 13 or 36 Crest 25 Sag 25 Crest Grade Range N/A 0.5 % % Minimum Radius N/A 130 m 0.5 % % (grade range used in design =1.0% to 5.0%) 130 m (minimum radius used in design = 350 m) Pavement Width m 10.0 m 18.0 m (1.5 m bike lane on both sides of road) 14.0 m pavement width (4 3.5 m) Boulevard Width 5.5 m (1.5 m conc. sidewalk on east side) m (1.5 m conc. sidewalk on both sides) 7.5 m (3.0 m multiuse path on both sides) Maximum Superelevation N/A 0.04 m/m 0.04 m/m Option 1 was established to avoid the wetland and woodlot areas; therefore, it will not require a bridge at the South Strasburg Creek and a culvert/bridge at Blair Creek south of Stauffer Drive. A smaller culvert will be required on the north branch of the South Strasburg Creek tributary. However, with Option 1, the following side roads will require extension, as illustrated in Figure 1 in the Appendix C : - Biehn Drive (the extension of Biehn Drive is assumed to connect to Robert Ferrie Drive and not Strasburg Road, since the intent of Option 1 is to completely avoid the wood lot and 25 July 2012
28 Strasburg Road Extension Rush Meadow Street to New Dundee Road City of Kitchener Alternative Route Study Report Final (Rev 02) wetland areas. An extension of Biehn Drive to the Option 1 alignment would result in such impact. - Robert Ferrie Drive (it is assumed that the pond which the alignment of this road crosses will not be maintained) - Blair Creek Drive It is assumed that the alignment of these side roads east of the base case alignment will be identical for both options, and therefore, the analysis for the side road connections only extend between the Base Case and Option 1, and are an impact for Option 1 only. In addition, Option 1 cuts through approved subdivision plans, and will result in severing the land of additional property owners. For each Option, it was assumed that continuous Regional infrastructure is required, including a water main and trunk sanitary sewer, and connectivity of these services along the side roads listed above. A general review of these impacts was undertaken including identification of potential issues. A preliminary grading analysis was carried out, assuming a 2:1 side slope. This grading analysis was the basis for reviewing land/property impacts and costs (both capital and operational/maintenance), to a 10% level of detail design. In general, both options are constructible and feasible, with similar cost. The degree of constructability was not evaluated. A large scale plan and profile view of the proposed alignments is included in Appendix C. 26 July 2012
29 Strasburg Road Extension Rush Meadow Street to New Dundee Road City of Kitchener Alternative Route Study Report Final (Rev 02) 7.0 ENVIRONMENTAL IMPACT The development of Option 1 was based entirely on the objective of identifying an alternative alignment that avoids the environmental sensitivities adversely affected by the OP alignment (e.g., Strasburg Creek PSW complex and associated woodlands and cold water fisheries resources). Therefore, the assessment of Option 1 from an environmental perspective addressed the inherent advantages of such avoidance. However, it is also recognized that there may be other sensitive features that may be affected by the alternative alignment. Consequently, presentation of the results of the investigation focuses on the advantages and disadvantages of Option 1, rather than presenting a direct comparative analysis of Option 1 and the OP alignment. The segment of the alignment where the Base Case is common with Option 1 (i.e., Rush Meadow Street to the point where Option 1 diverges from the Base Case alignment) was not assessed. Due to the general absence of detailed published and field information available for Option 1 (and the inability to obtain such information due to time and weather constraints), a high level assessment was undertaken using the following environmental factors, which are consistent with those being used in the EA for Part A of the project: Natural Environment Terrestrial Aquatic Groundwater Surface Drainage Socio-Economic Environment Land Use Noise Communities Air Quality Cultural Environment Archaeology Built Heritage Cultural Landscapes SLI s specialist consultants provided input as necessary, but conducted no additional original investigations (i.e., the environmental information used in the assessment was extracted from existing published material and the results of SLI s 2010 field investigations). We note that a significant amount of wildlife field investigation (coverboards placed for herpetile survey) was conducted at the north end of the Option 1 alignment, just west of the woodlot. 7.1 BASE CASE As stated above, the rationale for this investigation has been based on the objective of identifying and assessing the merits of an alternative alignment that avoids the environmental sensitivities adversely affected by the established OP alignment for the Strasburg Road Extension. As a basis for some comparison of the Base Case against the Option 1 alignment, the environmental advantages and disadvantages of the OP alignment can be summarized for the major factor groups as follows: NATURAL ENVIRONMENT - Strasburg Road Extension would traverse Strasburg Creek Wetland Complex (Provincially Significant Wetland) and Blair Swamp (PSW). - Displacement of interior forest areas in Strasburg Creek PSW. - Impacts to specimen trees in one hedgerow. - Crosses Jefferson Salamander regulated area in Upper Blair Creek corridor. 27 July 2012
30 Strasburg Road Extension Rush Meadow Street to New Dundee Road City of Kitchener Alternative Route Study Report Final (Rev 02) - Requires crossing of both North and South Tributaries of Strasburg Creek South Branch (coldwater fishery). - Requires crossing of Upper Blair Creek (intermittent watercourse with diffuse flow). - Crosses areas of Strasburg Creek PSW that constitute significant discharge and recharge areas. - Crosses significant regional recharge area in the southern half of the project area (just north of Stauffer Drive) SOCIAL ENVIRONMENT - Strasburg Road Extension alignment predates more recent community plans and has served to define Brigadoon, Huron and Doon South community boundaries, as well as the Regional Countryside Line. - Strasburg Road Extension alignment has been accounted for in pending development plans and has been used as one of the instruments in defining Plan of Subdivision requirements (grading, drainage, noise control). - Generally avoids direct impacts to existing land uses (infrastructure and buildings), with the exception of Monika s Bed and Breakfast (west end of Stauffer Drive). - Strasburg Road Extension and collector roads displace agricultural lands with relatively low agricultural capability (Class 4-7). - With the exception of the north end (at Huron Woods), the Base Case exhibits limited potential for increases in noise levels or degradation of air quality due to distance from existing and future sensitive receptors CULTURAL ENVIRONMENT - Strasburg Road Extension is in proximity to Registered Site AiHc-22 and would require additional archaeological assessment to obtain clearance. - Strasburg Road Extension will have impacts to historic/scenic road corridors (Reidel Drive existing and abandoned segments; Stauffer Drive) and associated cultural landscape features (2 farm complexes 500 Stauffer Drive and 271 Reidel Drive). 7.2 OPTION NATURAL ENVIRONMENT Vegetation communities within the general area of Option 1 are characteristic of areas in southern Ontario that have been heavily influenced by historical clearing for agriculture and residential development. In summary, four (4) vegetation units, including three (3) hedgerows, will be affected by the construction of Option 1 south of its divergence from the OP alignment. Another five (5) vegetation units, including four (4) hedgerows, will be affected by the construction (extension) of Biehn Drive, Robert Ferrie Drive and the Blair Creek Drive west of the OP alignment (refer to Figure 1 in Appendix D ). None of these vegetation units exhibit the ecological value inherent in the wetland and interior woodland areas directly affected by the OP alignment. Documented wildlife species in 2010 along the proposed route were mostly common and secure wildlife species. Species documented included garter snake and brown snake. Species at risk (SAR) and potential SAR along this route (exclusive of the section common to the OP alignment) include: Milksnake (confirmed) Special Concern was documented in 2009 at the Strasburg Creek corridor; Monarch Butterfly (confirmed) Special Concern confirmed in the study area and may occur along field edges where habitat is suitable. Cultural meadow areas did not reveal bird or other wildlife species at risk. The potential exists in these areas for additional Monarch and for milksnake. 28 July 2012
31 Strasburg Road Extension Rush Meadow Street to New Dundee Road City of Kitchener Alternative Route Study Report Final (Rev 02) As the route traverses south, it appears to avoid remnant natural features (woodlots, ponds or wetlands). It does cross hedgerows and open agricultural areas. Although hedgerows may provide a minor connecting role, they are generally not considered sensitive wildlife habitat. Typically, open agricultural areas also are not considered sensitive wildlife habitat. MNR has indicated that agricultural areas should be surveyed for bobolink (species of concern). Bobolink was not documented in the 2010 surveys, which were focused to the east of this new alignment, and along the previously established corridor in the detailed design portion of the project area. The crops planted in the area will significantly affect the likelihood of nesting bobolink. During 2010, most fields were planted in corn crops, which provide low potential for bobolink nesting habitat. Hays and wheat are more likely to support the species. The MNR has also indicated the potential for nightjar species (Common Nighthawk, Chimney Swift and Whip-poor-whil) in the project area. Targeted species completed in 2011 indicated that SOCIAL ENVIRONMENT Option 1 influences would be greatest for this environmental component, particularly with respect to land use implications. While the OP alignment has been established for many years and has been integrated in long range land use and community planning initiatives, Option 1 would result in the need to revisit key components of the Official Plan for the southwest quadrant of the City. Since the proposed Strasburg Road Extension alignment defines the western boundary of the Brigadoon Community, this boundary would have to be redefined, resulting in the need to amend both the Brigadoon Community and Huron Community plans. At the south end of the project, this alignment may also result in the need to amend the Doon South Community Plan. In the latter regard, additional considerations and concerns may focus on possible pressures for extension of the urban boundary, relocation of the Regional Countryside Line to the west, and the associated permanent loss of prime agricultural land. In terms of impacts to planned land uses that are in various stages of implementation, Option 1 would create severances of one draft approved plan of subdivision (30T-98201), and one plan of subdivision in circulation (30T-98202) in the Huron Community, which may have significant adverse legal and financial ramifications. At the individual property level on lands still designated and used for agricultural or rural purposes, the Strasburg Road Extension alignment would create severances on two (2) large parcels, both under the same ownership (Activa). The collector road extensions would create new single or multiple severances for three (3) properties (Ruttkowski 2; Activa 4; and Stonefield - 1). The effects of these severances would range from loss of productive (Class 1-2 and Class 3) agriculture land and constraints on current agricultural operations,to viability for future higher and better uses based on the size and/or configuration of remainder parcels. Other potential impacts are associated with proximity effects to existing homes on immediately adjacent lots in Huron Woods, including degradation of air quality and increased noise levels, resulting in the possible need for installation of a noise attenuation barrier. Two homes on New Dundee Road may experience increased noise levels associated with implementation of this Strasburg Road Extension alignment CULTURAL ENVIRONMENT There are four registered archaeological sites in the vicinity of the Option 1 alignment. The Strasburg Road Extension alignment would be situated just east of site AiHc-20 and would have to be cleared of any related concerns through additional archaeological assessment. The other three sites do not enter into consideration due to the low potential for direct impacts. The Strasburg Road Extension Option 1 alignment will have no impacts to historic/scenic road corridors (Reidel Drive, Stauffer Drive) and associated cultural landscape features (2 farm complexes), but the extensions of Robert Ferrie Drive and the Blair Creek Drive will affect these features (crossing of Reidel 29 July 2012
32 Strasburg Road Extension Rush Meadow Street to New Dundee Road City of Kitchener Alternative Route Study Report Final (Rev 02) Drive existing and abandoned segments; addition of new impacts to two (2) farm complexes at 500 Stauffer Drive and 271 Reidel Drive). 30 July 2012
33 Strasburg Road Extension Rush Meadow Street to New Dundee Road City of Kitchener Alternative Route Study Report Final (Rev 02) 8.0 SUMMARY ASSESSMENT In addition to the detailed evaluation of the performance measures of the study area intersections, the estimated infiltration volumes through the neighbourhood road area network, road safety and measurements of effectiveness, Table 8.1 provides a consolidated summary of the assessment results under the following factor groups: Technical Considerations: Road Geometrics: o Road Profile; o Staging and Constructability; and o Servicing issues. Environmental Impact: o Natural Environment; o Socio-Economic Environment; and o Cultural Environment Financial Consideration: o Construction Cost; o Operation and Maintenance Cost; and o Land Requirements. 31 July 2012
34 TABLE 8.1: SUMMARY ASSESSMENT MATRIX Strasburg Road Extension Rush Meadow Street to New Dundee Road City of Kitchener Alternative Route Study Report Final (Rev 02) EVALUATION ROAD ALIGNMENT ALTERNATIVES CRITERIA Original Official Plan Alignment Option-1 Alignment ENGINEERING FEASIBILITY AND COST ASSESSMENT Servicing/ Utilities - Includes proposed watermain, sanitary sewer, and utilities. - Services/utilities along future Strasburg Road will be utilized by the proposed Huron Woods Subdivision (South of Huron Road and West of future Strasburg Road) and by the Stauffer Woods Subdivision (north of New Dundee Road and east of future Strasburg Road). - Includes proposed watermains, sanitary sewer, and utilities. - Services along future Strasburg Road will most likely not be fully utilized as there are fewer proposed subdivisions abutting/close to the alignment - Services/utilities to be extended additional distance along required side road extensions, resulting in additional long term maintenance and replacement costs. - Extensions of watermain may require additional network modelling, and may not be consistent with current proposals to change the Zones Kit 2W and Kit 4 boundary (Kitchener Zone 2 and 4 Optimization Study, Stantec, May 2009). Additional pumping or pressure reduction valves may be required. - Sanitary Sewer outlet elevation may be impacted, as the sewer is moved further west from the outlet. Stormwater Management - Several potential storm water outlets at Strasburg Creek tributaries and Blair Creek. - Potentially use SWM pond proposed by Freure Developments. - Additional areas of road to be treated and conveyed in a storm sewer. Very few outlet locations for storm water, and potential additional impact for additional ditches to a watercourse outlet. - Potentially use SWM pond proposed by Freure Developments. - Potential need for municipal drains to convey agricultural land storm drainage. Land Impacts Note: Strasburg Road is based on a 30m rightof-way with 2:1 grading slope. Collector roads Footprint Area - Footprint area from each road (based on grading limits): o Strasburg Road: ha (Part A: 6.41 ha, Part B: 7.93 ha) o Total: ha - Footprint area from each road (based on grading limits): o o o Strasburg Road: ha (Part A:6.05 ha, Part B: 6.62 ha) Robert Ferrie Drive: 2.88 ha Biehn Drive: 1.85 ha 32 July 2012
35 Strasburg Road Extension Rush Meadow Street to New Dundee Road City of Kitchener Alternative Route Study Report Final (Rev 02) EVALUATION ROAD ALIGNMENT ALTERNATIVES CRITERIA Original Official Plan Alignment Option-1 Alignment are based on a 26m right-of-way with 2:1 grading slope. o Blair Creek Drive: 3.24 ha o Total: ha - Requires an additional 6.30 ha of land to construct (includes land to construct collector roads). Properties Impacted (see discussion of Socioeconomics for further discussion) - Properties impacted by the Strasburg Road Original alignment (based on grading limits): o o o o o o o Activa Holdings: 0.56 ha (no severances) Stonefield Development Corp.: 2.13 ha (no severances) Ruttkowski: 2.95 ha (one severance) Sunvest Reid Ltd.: 0.45 ha (one severance) Freure Developments Ltd. (South Lands): 0.44 ha (no severance) Freure Developments Ltd. (North Lands): 0.23 ha (no severance) Hallman Construction Ltd.: 3.29 ha (no severances) o City of Kitchener: 4.29 ha (no severances) o Total: ha - Properties impacted by the alternative alignment option and collector road extensions (based on grading limits): o o o o o o o o Activa Holdings: ha (four severances) Stonefield Development Corp.: 2.24 ha (one severance) Ruttkowski: 1.19 ha (one severance) Sunvest Reid Ltd.: 0 ha Freure Developments Ltd. (South Lands): 1.96 ha (one severance within approved subdivision lands) Freure Developments Ltd. (North Lands): 1.24 ha (one severance within draft subdivision lands) Hallman Construction Ltd.: 1.05 ha (no severances) City of Kitchener: 1.03 ha (no severances) o Total: ha Impacts to Subdivision Plans (see discussion of Socioeconomics for further discussion) - The approved Huron Woods Subdivision was designed to incorporate the Strasburg Road Extension. Storm water management ponds in this development are not affected by the road. - There will be some grading impacts to the southeast portion of the subdivision in the North Lands which has not been constructed and to the east portion of the subdivision in the South Lands, but no major severances or reduction is development area. - There will be some grading impacts to the proposed 33 - Strasburg Alignment cuts through the south portion of the North Lands of the approved Huron Woods Subdivision plan and cuts through a significant portion of the South Lands, severing four proposed local roads and abutting lots (all within the wood lot area). Stormwater management ponds in this development are not affected by the road, but will be severed from the main development. No construction has commenced in this area. - Biehn Drive cuts through a small portion of the July 2012
36 Strasburg Road Extension Rush Meadow Street to New Dundee Road City of Kitchener Alternative Route Study Report Final (Rev 02) EVALUATION ROAD ALIGNMENT ALTERNATIVES CRITERIA Original Official Plan Alignment Option-1 Alignment Stauffer Woods Subdivision plan (northeast of New Dundee Road and future Strasburg Road Extension). Freure property at the southeast corner. The South Lands of the Freure development are within the woodlot area. - There are currently no other subdivision plans affected by this alignment option. Cost Note: Part A refers to Strasburg Road and side roads south of proposed Robert Ferrie Drive; Part B refers to Strasburg Road and side roads north of proposed Robert Ferrie Drive (and includes Robert Ferrie Drive) Capital (Land cost or legal implications are not evaluated in the cost analysis) - Breakdown of Cost estimate (includes road works, traffic signals, illumination, structures, storm sewers, sanitary sewers and watermain): o Strasburg Road: $22,047,000 (Part A: $7,135,000) (Part B: $14,912,000) o Total: $22,047,000 - $6,000,000 for 175m 3-span bridge over Strasburg Creek South Branch Tributaries (included in total cost estimate). - $750,000 for assumed 6m x 2.5m open bottom concrete culvert over Blair Creek south of Stauffer Drive (included in total cost estimate); this may require a longer structure and additional cost, depending on sensitivities. - Breakdown of Cost estimate (includes road works, traffic signals, illumination, structures, storm sewers, sanitary sewers and watermain): o Strasburg Road: $15,683,000 (Part A: $6,378,000) (Part B: $9,305,000) o Robert Ferrie Drive: $2,715,000 o Biehn Drive: $1,675,000 o Blair Creek Drive: $2,910,000 o Total: $22,983,000 - $750,000 cost for 6m x 2.5m open bottom concrete culvert over Strasburg Creek South Branch North Tributary (included in total cost estimate). - Additional cost of $936,000 to construct (difference from original official plan alignment). Maintenance/ Operational - Cost considerations include regular operations (i.e., cleaning of pipes, snow removal, testing/inspections), and long term rehabilitation costs (i.e., road resurfacing, pipe lining, valve replacement, crack repair, etc.) - Similar with respect to Strasburg Road length, and associated watermains, sewers, and utilities. - Additional cost for bridge and culvert maintenance. - Cost considerations include regular operations (i.e., cleaning of pipes, snow removal, testing/inspections), and long term rehabilitation costs (i.e., road resurfacing, pipe lining, valve replacement, crack repair, etc.) - Similar with respect to Strasburg Road length, and associated watermains, sewers, and utilities. - Additional cost for additional side road extensions and associated watermains, sewers, and utilities. - Potential additional cost if pumping stations are required. 34 July 2012
37 Strasburg Road Extension Rush Meadow Street to New Dundee Road City of Kitchener Alternative Route Study Report Final (Rev 02) EVALUATION ROAD ALIGNMENT ALTERNATIVES CRITERIA Original Official Plan Alignment Option-1 Alignment ENVIRONMENTAL IMPACT ASSESSMENT Natural Environment Terrestrial - Strasburg Road Extension would traverse Strasburg Creek Wetland Complex (Provincially Significant Wetland) and Blair Swamp (PSW) - Displacement of interior forest areas in Strasburg Creek PSW. - Impacts to specimen trees in one hedgerow. - Crosses Jefferson Salamander regulated area in Upper Blair Creek corridor. - Strasburg Road Extension would result in nominal impacts to relatively insignificant vegetation communities (2 cultural thickets; 3 hedgerows). - Collector road extensions would displace a very small edge segment of a major woodlot and sever 4 hedgerows. - Wildlife species lists for the newly affected properties do not indicate the presence of sensitive species or habitat. - Documented wildlife species in 2010 along the proposed route were mostly common and secure wildlife species. Species at risk (SAR) and potential SAR along this route include: - Milksnake (confirmed) Special Concern was documented in 2009 at the Strasburg Creek corridor; - Monarch Butterfly (confirmed) Special Concern confirmed in the study area and may occur along field edges where habitat is suitable. - Open agricultural areas and hedgerows crossed are generally not considered sensitive wildlife habitat, but may support Bobolink (species of concern), depending on which crops are planted. Aquatic/ Surface Drainage - Requires crossing of both North and South Tributaries of Strasburg Creek South Branch (coldwater fishery). - Requires crossing of Upper Blair Creek (intermittent watercourse with diffuse flow). - Strasburg Road Extension crosses North Tributary of Strasburg Creek South Branch, but flow is intermittent. Not deemed to be fish habitat. - Strasburg Road Extension crosses Upper Blair Creek, but channel is ill-defined and flow is intermittent. Not deemed to be fish habitat. 35 July 2012
38 Strasburg Road Extension Rush Meadow Street to New Dundee Road City of Kitchener Alternative Route Study Report Final (Rev 02) EVALUATION ROAD ALIGNMENT ALTERNATIVES CRITERIA Original Official Plan Alignment Option-1 Alignment Socio- Economic Environment Groundwater - Strasburg Road Extension crosses areas of Strasburg Creek PSW that constitute significant discharge and recharge areas. - Crosses significant regional recharge area in southern half of the project area. Land Use - Strasburg Road Extension alignment predates more recent community plans and has served to define Brigadoon, Huron and Doon South community boundaries, as well as the Regional Countryside Line. - Strasburg Road Extension alignment has been accounted for in pending development plans and has been used as one of the instruments in defining Plan of Subdivision requirements (grading, drainage, noise control). - Generally avoids direct impacts to existing land uses (infrastructure and buildings), with the exception of Monika s Bed and Breakfast (just north of Stauffer Drive). - Strasburg Road Extension and collector roads displace agricultural lands with relatively low agricultural capability (Class 4-7) Avoids major discharge and recharge areas associated with Strasburg Creek wetland complex (PSW) and Upper Blair Creek. - Avoids significant regional recharge area in southern half of the project area. - Strasburg Road Extension would likely result in the need for redefinition of Brigadoon Community and Huron Community boundaries and amendments to the respective community plans. - Strasburg Road Extension results in displacement of planned residential lots Blocks 7 and 8 (Newcastle Court) in Ontario Ltd. (Freure) Draft Approved PoS 30T Major severance and displacement of residential lots in Ontario Ltd. (Freure) PoS 30T (in circulation). - Biehn Drive Extension results in minor impact to southeast corner (Stage 4) of PoS 30T Strasburg Road Extension will create severances of two Activa parcels between Freure lands and New Dundee Road. Severance of Activa lands immediately north of New Dundee may create a nonviable remainder parcel. - Extension of Biehn Drive, Robert Ferrie Drive and Blair Creek Drive will create additional severances of Activa lands, and new severances of Ruttkowski and Stonefield lands (potential effects on viability of remainder parcels). - Strasburg Road Extension and collector road extensions displace agricultural lands with primarily Class 1 and 2 and Specialty Crop capability south of Robert Ferrie Drive and Class 3 lands north of Robert Ferrie Drive. - Strasburg Road Extension is about 2 lots west of 2009 RMOW ROP Countryside Line and 1 lot west of eastern limit of Prime Agricultural Area. This may exert pressure for unplanned development in Prime July 2012
39 Strasburg Road Extension Rush Meadow Street to New Dundee Road City of Kitchener Alternative Route Study Report Final (Rev 02) EVALUATION ROAD ALIGNMENT ALTERNATIVES CRITERIA Original Official Plan Alignment Option-1 Alignment Agricultural Area (incompatible with ROPP). Possible redefinition of Doon South Community boundary and amendments to Community Plan. Noise/Air Quality - With the exception of the north end (at Huron Woods), exhibits limited potential for increases in noise levels or degradation of air quality due to distance from sensitive receptors. - Strasburg Road Extension would likely require incorporation of unplanned noise attenuation measures in planned Huron South PoS (30T-98201) and result in potential noise increases for two adjacent residences on New Dundee Road. The B&B operation at 500 Stauffer Road would experience reduced noise levels. - Strasburg Road Extension may adversely affect air quality of additional immediately adjacent receptors in Huron Woods. Communities - Strasburg Road Extension is expected to provide some relief to community areas currently under some pressure from infiltration of through traffic (e.g., Caryndale). - With the westerly shift of Strasburg Road, approximately 20,000 additional ADT will tend to shortcut through the existing road area network, adversely affecting community cohesion. - It is likely that the additional infiltration volumes would traverse areas already under pressure from through traffic (Caryndale Drive, Biehn Drive, Manitou Drive), as well as introducing pressures on areas that may not currently be under pressure (Battler Drive, Trillium Drive, Robert Ferrie Drive, Doon South Drive, Doon Mills Drive and Doon Village Road). Cultural Environment Archaeological Resources/ Built Heritage/ Cultural Landscapes - Strasburg Road Extension is in proximity to Registered Site AiHc Strasburg Road Extension will have impacts to historic/scenic road corridors (Reidel Drive existing and abandoned segments; Stauffer Drive) and associated cultural landscape features (2 farm complexes). - Strasburg Road Extension is in proximity to Registered Site AiHc Strasburg Road Extension will have no impacts to historic/scenic road corridors (Reidel Drive, Stauffer Drive) and associated cultural landscape features (2 farm complexes), but the extensions of Robert Ferrie Drive and the Blair Creek Drive will affect these features (crossing of Reidel Drive (existing and abandoned segments; addition of new impacts to farm complexes). 37 July 2012
40 Strasburg Road Extension Rush Meadow Street to New Dundee Road City of Kitchener Alternative Route Study Report Final (Rev 02) 9.0 COMPARATIVE EVALUATION AND CONCLUSIONS 9.1 COMPARATIVE EVALUATION Based on the study findings, a qualitative assessment of the advantages and disadvantages of the Base Case scenario and the Option 1 scenario was carried out to identify, on balance, the preferred alignment in the context of a reasoned argument. The following matrix summarizes the findings and identifies the preferred alternative, with respect most/ moderate and least impact. The intensity of the shading reflects the degree of impact i.e. the lighter the shedding the worse the impact: EVALUATION MATRIX Least Impact Higher Impact Highest Impact Evaluation Criteria Base Case Option 1 Remarks Impact on Traffic Operations/Intersection Performance Major Intersections on Huron Road/ Homer Watson Boulevard Major Intersections on New Dundee Road Battler Drive Trillium Drive Manitou Drive Thomas Slee Robert Ferrie Average delay remains lower in the Base Case option. Average delay remains lower in the Base Case option Average delay remains lower in the Base Case option Negligible impact is expected Negligible impact is expected Traffic Infiltration through Neighbourhood Intersections Road Safety Scenario on the Neighbourhood road area network Measurement of Effectiveness With Option 1, an additional 7,600 vehicles per day are expected on the existing road area network With increased AADT frequency of collision increases With Option 1, Strasburg Road will be underutilized 38 July 2012
41 Strasburg Road Extension Rush Meadow Street to New Dundee Road City of Kitchener Alternative Route Study Report Final (Rev 02) Least Impact Higher Impact Highest Impact Evaluation Criteria Base Case Option 1 Remarks Impact Due to Road Geometry/Road Construction and Maintenance Servicing/ Utilities Stormwater Management Land Impacts Cost Feasibility of Provision Utilization by Existing and Future Developments Possibility of any Modification of Existing Municipal Servicing Feasible Storm Outlet Requirement of Additional Municipal Servicing Footprint Area Impact on Private Properties Impact on Draft Approved Subdivision Plans Capital Maintenance/Operations Most planning to date considers the base case, with some infrastructure already constructed Base Case is closer to drainage outlets, and can be accommodated in planned SWM ponds Option 1 is away from drainage outlets, and planned developments, and will require significant additional ditching for drainage Base Case has significantly less footprint area since side road extensions are not required and the impacts to private properties are significantly less. The Base Case will not sever/impact approved/circulated subdivision plans Construction costs are similar, although additional land cost is incurred with Option 1 Base case will have additional maintenance/operational costs associated with the bridge. Option 1 will have additional maintenance/operational 39 July 2012
42 Strasburg Road Extension Rush Meadow Street to New Dundee Road City of Kitchener Alternative Route Study Report Final (Rev 02) Least Impact Higher Impact Highest Impact Evaluation Criteria Base Case Option 1 Remarks Environmental Impact Assessment costs associated with additional watermain and sanitary sewer infrastructure extended along collector roads (assuming this is required for system looping and outlets) Natural Environment Socio- Economic Environment Cultural Environment Terrestrial Aquatic/Surface Drainage Groundwater Land Use Noise/Air Quality Communities Archaeological/BHF/Cultural Landscapes Option 1 avoids major natural heritage features Option 1 avoids major aquatic habitat Option 1 avoids major recharge/discharge areas Option 1 imposes major land use and planning boundary impacts Base Case imposes fewer impacts on sensitive receptors Impacts to community cohesion with Option 1 No significant differences OVERALL SCORE 9.2 CONCLUSIONS SNC-Lavalin Inc. (SLI) was retained by the City of Kitchener to undertake an Alternative Route Selection study for the Strasburg Road Extension from its current south terminus at Rush Meadow Street, southerly to New Dundee Road. This study compared and evaluated the functionality and potential impacts of the established Strasburg Road corridor and an alternative alignment (Option 1) developed to avoid a number of natural heritage features directly affected by the established alignment. 40 July 2012
43 Strasburg Road Extension Rush Meadow Street to New Dundee Road City of Kitchener Alternative Route Study Report Final (Rev 02) The study was completed through a comparative assessment and evaluation of the two route alternatives with respect to the following major parameters: Traffic Operations/Intersection Performance; Impact of Road Geometry/Road Construction and Maintenance; and Environmental Impacts It is worth noting that the evaluation of the route alternatives was undertaken primarily with respect to traffic engineering analyses, backed up with a functional road design and a very high level/desktop environmental analysis. Based on the outcome of the traffic engineering analysis, a high level evaluation of the impact of the road design geometry and potential environmental impacts, a qualitative evaluation of the two design alternatives was conducted to identify the preferred option, between the two options. The evaluation results suggest that the alignment established in the City s Official Plan (Base Case) is preferable to Option 1 for the proposed Strasburg Road Extension. Based on the limitations of the design alternatives, this study reflects that the current alignment (i.e., the OP approved alignment of the Strasburg Road Extension) is a better alternative between the two alignments. However, it is recommended that the following investigations should be included in any further studies to identify the preferred route alternative for the proposed Strasburg Road Extension: 1. Testing of further alignments connecting the existing Strasburg Road terminus and Riedel Drive, while minimizing potential impacts to major environmental features; 2. Detailed evaluation of traffic infiltration through the Brigadoon Community and Doon South Community, as identified in the traffic findings; and 3. Development of a dynamic traffic assignment model or a dynamic simulation traffic model to confirm the traffic assignment assumptions made so far and also the sensitivities of other alignments with respect to attracting the development traffic volumes. 41 July 2012
44 Strasburg Road Extension Rush Meadow Street to New Dundee Road City of Kitchener Alternative Route Study Report Final (Rev 02) APPENDICES July 2012
45 Strasburg Road Extension Rush Meadow Street to New Dundee Road City of Kitchener Alternative Route Study Report Final (Rev 02) APPENDIX A TRAFFIC FIGURES July 2012
46 FISCHER HALLMAN RD. HURON RD. OPTION 1 EAST-WEST COLLECTOR BIEHN DRIVE BASE CASE ROBERT FERRIE DRIVE STAUFFER DR. CARYNDALE DR. CAMERON RD. NEW DUNDEE RD. LEGEND:
47
48
49
50
51
52
53 Strasburg Road Extension Rush Meadow Street to New Dundee Road City of Kitchener Alternative Route Study Report Final (Rev 02) APPENDIX B CAPACITY ANALYSIS RESULTS July 2012
54 HCM Unsignalized Intersection Capacity Analysis Weekday AM - Future Total Traffic : New Dundee Road & Collector "A" Base Case Movement EBL EBT WBT WBR SBL SBR Lane Configurations Sign Control Free Free Stop Grade 0% 0% 0% Volume (veh/h) Peak Hour Factor Hourly flow rate (vph) Pedestrians Lane Width (m) Walking Speed (m/s) Percent Blockage Right turn flare (veh) Median type TWLTL Median storage veh) 1 Upstream signal (m) px, platoon unblocked vc, conflicting volume vc1, stage 1 conf vol 523 vc2, stage 2 conf vol 516 vcu, unblocked vol tc, single (s) tc, 2 stage (s) 5.8 tf (s) p0 queue free % cm capacity (veh/h) Direction, Lane # EB 1 EB 2 WB 1 WB 2 WB 3 SB 1 SB 2 Volume Total Volume Left Volume Right csh Volume to Capacity Queue Length 95th (m) Control Delay (s) Lane LOS A C B Approach Delay (s) Approach LOS B Intersection Summary Average Delay 0.9 Intersection Capacity Utilization 53.7% ICU Level of Service A Analysis Period (min) 15 SNC Lavalin Synchro 6 Report Page 3
55 HCM Unsignalized Intersection Capacity Analysis Weekday AM - Future Total Traffic : Rockcliffe Drive & Strasburg Road Base Case Movement EBL EBR NBL NBT SBT SBR Lane Configurations Sign Control Stop Free Free Grade 0% 0% 0% Volume (veh/h) Peak Hour Factor Hourly flow rate (vph) Pedestrians Lane Width (m) Walking Speed (m/s) Percent Blockage Right turn flare (veh) 4 Median type TWLTL Median storage veh) 2 Upstream signal (m) px, platoon unblocked vc, conflicting volume vc1, stage 1 conf vol 628 vc2, stage 2 conf vol 562 vcu, unblocked vol tc, single (s) tc, 2 stage (s) 5.8 tf (s) p0 queue free % cm capacity (veh/h) Direction, Lane # EB 1 NB 1 NB 2 NB 3 SB 1 SB 2 SB 3 Volume Total Volume Left Volume Right csh Volume to Capacity Queue Length 95th (m) Control Delay (s) Lane LOS C A Approach Delay (s) Approach LOS C Intersection Summary Average Delay 2.5 Intersection Capacity Utilization 45.7% ICU Level of Service A Analysis Period (min) 15 SNC Lavalin Synchro 6 Report Page 4
56 Queues Weekday AM - Future Total Traffic : New Dundee Road & Strasburg Road Base Case Lane Group EBL EBT EBR WBL WBT WBR NBL NBT NBR SBL SBT SBR Lane Configurations Total Lost Time (s) Satd. Flow (prot) Flt Permitted Satd. Flow (perm) Satd. Flow (RTOR) Volume (vph) Lane Group Flow (vph) Turn Type Prot Perm Free Perm pm+pt Protected Phases Permitted Phases 8 Free 2 6 Total Split (s) Act Effct Green (s) Actuated g/c Ratio v/c Ratio Control Delay Queue Delay Total Delay LOS D D D A C C A Approach Delay Approach LOS D B C B Queue Length 50th (m) Queue Length 95th (m) # Internal Link Dist (m) Turn Bay Length (m) Base Capacity (vph) Starvation Cap Reductn Spillback Cap Reductn Storage Cap Reductn Reduced v/c Ratio Intersection Summary Cycle Length: 100 Actuated Cycle Length: 96.6 Control Type: Semi Act-Uncoord Maximum v/c Ratio: 0.82 Intersection Signal Delay: 24.7 Intersection LOS: C ICU Level of Service D Intersection Capacity Utilization 73.2% Analysis Period (min) 15 # 95th percentile volume exceeds capacity, queue may be longer. Queue shown is maximum after two cycles. Splits and Phases: 15: New Dundee Road & Strasburg Road SNC Lavalin Synchro 6 Report Page 8
57 HCM Signalized Intersection Capacity Analysis Weekday AM - Future Total Traffic : New Dundee Road & Strasburg Road Base Case Movement EBL EBT EBR WBL WBT WBR NBL NBT NBR SBL SBT SBR Lane Configurations Ideal Flow (vphpl) Total Lost time (s) Lane Util. Factor Frt Flt Protected Satd. Flow (prot) Flt Permitted Satd. Flow (perm) Volume (vph) Peak-hour factor, PHF Adj. Flow (vph) RTOR Reduction (vph) Lane Group Flow (vph) Heavy Vehicles (%) 0% 3% 3% 20% 16% 0% 2% 0% 60% 33% 5% 2% Turn Type Prot Perm Free Perm pm+pt Protected Phases Permitted Phases 8 Free 2 6 Actuated Green, G (s) Effective Green, g (s) Actuated g/c Ratio Clearance Time (s) Vehicle Extension (s) Lane Grp Cap (vph) v/s Ratio Prot 0.00 c0.19 c v/s Ratio Perm c0.35 v/c Ratio Uniform Delay, d Progression Factor Incremental Delay, d Delay (s) Level of Service F D C A C B A Approach Delay (s) Approach LOS D B C B Intersection Summary HCM Average Control Delay 22.8 HCM Level of Service C HCM Volume to Capacity ratio 0.77 Actuated Cycle Length (s) 99.8 Sum of lost time (s) 8.0 Intersection Capacity Utilization 73.2% ICU Level of Service D Analysis Period (min) 15 c Critical Lane Group SNC Lavalin Synchro 6 Report Page 9
58 HCM Unsignalized Intersection Capacity Analysis Weekday AM - Future Total Traffic : Rush Meadow & Strasburg Road Base Case Movement WBL WBR NET NER SWL SWT Lane Configurations Sign Control Stop Free Free Grade 0% 0% 0% Volume (veh/h) Peak Hour Factor Hourly flow rate (vph) Pedestrians Lane Width (m) Walking Speed (m/s) Percent Blockage Right turn flare (veh) Median type TWLTL Median storage veh) 2 Upstream signal (m) px, platoon unblocked vc, conflicting volume vc1, stage 1 conf vol 1212 vc2, stage 2 conf vol 393 vcu, unblocked vol tc, single (s) tc, 2 stage (s) 5.8 tf (s) p0 queue free % cm capacity (veh/h) Direction, Lane # WB 1 NE 1 NE 2 SW 1 SW 2 SW 3 Volume Total Volume Left Volume Right csh Volume to Capacity Queue Length 95th (m) Control Delay (s) Lane LOS C B Approach Delay (s) Approach LOS C Intersection Summary Average Delay 1.9 Intersection Capacity Utilization 50.5% ICU Level of Service A Analysis Period (min) 15 SNC Lavalin Synchro 6 Report Page 10
59 Queues Weekday AM - Future Total Traffic : New Dundee Road & Fischer-Hallman Rd. Base Case Lane Group EBL EBT EBR WBL WBT WBR NBL NBT NBR SBL SBT SBR Lane Configurations Total Lost Time (s) Satd. Flow (prot) Flt Permitted Satd. Flow (perm) Satd. Flow (RTOR) Volume (vph) Lane Group Flow (vph) Turn Type Perm Perm Perm Perm pm+pt Protected Phases Permitted Phases Total Split (s) Act Effct Green (s) Actuated g/c Ratio v/c Ratio Control Delay Queue Delay Total Delay LOS D C A C F A Approach Delay Approach LOS D B C E Queue Length 50th (m) ~ Queue Length 95th (m) # Internal Link Dist (m) Turn Bay Length (m) Base Capacity (vph) Starvation Cap Reductn Spillback Cap Reductn Storage Cap Reductn Reduced v/c Ratio Intersection Summary Cycle Length: 100 Actuated Cycle Length: 97.5 Control Type: Semi Act-Uncoord Maximum v/c Ratio: 1.18 Intersection Signal Delay: 46.0 Intersection LOS: D ICU Level of Service D Intersection Capacity Utilization 80.6% Analysis Period (min) 15 ~ Volume exceeds capacity, queue is theoretically infinite. Queue shown is maximum after two cycles. # 95th percentile volume exceeds capacity, queue may be longer. Queue shown is maximum after two cycles. SNC Lavalin Synchro 6 Report Page 12
60 Queues Weekday AM - Future Total Traffic : New Dundee Road & Fischer-Hallman Rd. Base Case Splits and Phases: 22: New Dundee Road & Fischer-Hallman Rd. SNC Lavalin Synchro 6 Report Page 13
61 HCM Signalized Intersection Capacity Analysis Weekday AM - Future Total Traffic : New Dundee Road & Fischer-Hallman Rd. Base Case Movement EBL EBT EBR WBL WBT WBR NBL NBT NBR SBL SBT SBR Lane Configurations Ideal Flow (vphpl) Total Lost time (s) Lane Util. Factor Frt Flt Protected Satd. Flow (prot) Flt Permitted Satd. Flow (perm) Volume (vph) Peak-hour factor, PHF Adj. Flow (vph) RTOR Reduction (vph) Lane Group Flow (vph) Heavy Vehicles (%) 5% 2% 15% 1% 2% 2% 25% 1% 6% 100% 0% 4% Turn Type Perm Perm Perm Perm pm+pt Protected Phases Permitted Phases Actuated Green, G (s) Effective Green, g (s) Actuated g/c Ratio Clearance Time (s) Vehicle Extension (s) Lane Grp Cap (vph) v/s Ratio Prot c v/s Ratio Perm c c0.50 v/c Ratio Uniform Delay, d Progression Factor Incremental Delay, d Delay (s) Level of Service D C C C F A Approach Delay (s) Approach LOS D C C E Intersection Summary HCM Average Control Delay 47.2 HCM Level of Service D HCM Volume to Capacity ratio 1.06 Actuated Cycle Length (s) 97.5 Sum of lost time (s) 8.0 Intersection Capacity Utilization 80.6% ICU Level of Service D Analysis Period (min) 15 c Critical Lane Group SNC Lavalin Synchro 6 Report Page 14
62 Queues Weekday AM - Future Total Traffic : Battler Road & Huron Road Base Case Lane Group SEL SET SER NWL NWT NWR NEL NET NER SWL SWT SWR Lane Configurations Total Lost Time (s) Satd. Flow (prot) Flt Permitted Satd. Flow (perm) Satd. Flow (RTOR) Volume (vph) Lane Group Flow (vph) Turn Type Perm Perm Perm Perm pm+pt Perm Protected Phases Permitted Phases Total Split (s) Act Effct Green (s) Actuated g/c Ratio v/c Ratio Control Delay Queue Delay Total Delay LOS C C D C A B C C A A Approach Delay Approach LOS C C C B Queue Length 50th (m) Queue Length 95th (m) Internal Link Dist (m) Turn Bay Length (m) Base Capacity (vph) Starvation Cap Reductn Spillback Cap Reductn Storage Cap Reductn Reduced v/c Ratio Intersection Summary Cycle Length: 100 Actuated Cycle Length: 95.5 Control Type: Semi Act-Uncoord Maximum v/c Ratio: 0.78 Intersection Signal Delay: 19.3 Intersection Capacity Utilization 78.2% Analysis Period (min) 15 Intersection LOS: B ICU Level of Service D Splits and Phases: 28: Battler Road & Huron Road SNC Lavalin Synchro 6 Report Page 15
63 HCM Signalized Intersection Capacity Analysis Weekday AM - Future Total Traffic : Battler Road & Huron Road Base Case Movement SEL SET SER NWL NWT NWR NEL NET NER SWL SWT SWR Lane Configurations Ideal Flow (vphpl) Total Lost time (s) Lane Util. Factor Frt Flt Protected Satd. Flow (prot) Flt Permitted Satd. Flow (perm) Volume (vph) Peak-hour factor, PHF Adj. Flow (vph) RTOR Reduction (vph) Lane Group Flow (vph) Heavy Vehicles (%) 28% 17% 100% 6% 3% 3% 100% 4% 15% 9% 10% 6% Turn Type Perm Perm Perm Perm pm+pt Perm Protected Phases Permitted Phases Actuated Green, G (s) Effective Green, g (s) Actuated g/c Ratio Clearance Time (s) Vehicle Extension (s) Lane Grp Cap (vph) v/s Ratio Prot c0.44 c v/s Ratio Perm 0.04 c v/c Ratio Uniform Delay, d Progression Factor Incremental Delay, d Delay (s) Level of Service C C D C C A B C A A Approach Delay (s) Approach LOS C D B A Intersection Summary HCM Average Control Delay 19.5 HCM Level of Service B HCM Volume to Capacity ratio 0.74 Actuated Cycle Length (s) 95.5 Sum of lost time (s) 12.0 Intersection Capacity Utilization 78.2% ICU Level of Service D Analysis Period (min) 15 c Critical Lane Group SNC Lavalin Synchro 6 Report Page 16
64 Queues Weekday AM - Future Total Traffic : Huron Road & Trillium Dr Base Case Lane Group EBL EBT EBR WBL WBT WBR NBL NBT NBR SBL SBT SBR Lane Configurations Total Lost Time (s) Satd. Flow (prot) Flt Permitted Satd. Flow (perm) Satd. Flow (RTOR) Volume (vph) Lane Group Flow (vph) Turn Type Perm Freecustom custom Protected Phases 4 8 Permitted Phases 4 Free 6 6 Total Split (s) Act Effct Green (s) Actuated g/c Ratio v/c Ratio Control Delay Queue Delay Total Delay LOS A A A A C B Approach Delay Approach LOS A A Queue Length 50th (m) Queue Length 95th (m) Internal Link Dist (m) Turn Bay Length (m) Base Capacity (vph) Starvation Cap Reductn Spillback Cap Reductn Storage Cap Reductn Reduced v/c Ratio Intersection Summary Cycle Length: 90 Actuated Cycle Length: Control Type: Semi Act-Uncoord Maximum v/c Ratio: 0.51 Intersection Signal Delay: 1.9 Intersection Capacity Utilization 55.6% Analysis Period (min) 15 Intersection LOS: A ICU Level of Service B Splits and Phases: 30: Huron Road & Trillium Dr SNC Lavalin Synchro 6 Report Page 17
65 HCM Signalized Intersection Capacity Analysis Weekday AM - Future Total Traffic : Huron Road & Trillium Dr Base Case Movement EBL EBT EBR WBL WBT WBR NBL NBT NBR SBL SBT SBR Lane Configurations Ideal Flow (vphpl) Total Lost time (s) Lane Util. Factor Frt Flt Protected Satd. Flow (prot) Flt Permitted Satd. Flow (perm) Volume (vph) Peak-hour factor, PHF Adj. Flow (vph) RTOR Reduction (vph) Lane Group Flow (vph) Heavy Vehicles (%) 4% 4% 0% 0% 10% 10% 0% 0% 5% 5% 0% 5% Turn Type Perm Freecustom custom Protected Phases 4 8 Permitted Phases 4 Free 6 6 Actuated Green, G (s) Effective Green, g (s) Actuated g/c Ratio Clearance Time (s) Vehicle Extension (s) Lane Grp Cap (vph) v/s Ratio Prot c v/s Ratio Perm 0.06 c v/c Ratio Uniform Delay, d Progression Factor Incremental Delay, d Delay (s) Level of Service A A A A D D Approach Delay (s) Approach LOS A A A D Intersection Summary HCM Average Control Delay 2.2 HCM Level of Service A HCM Volume to Capacity ratio 0.52 Actuated Cycle Length (s) Sum of lost time (s) 4.0 Intersection Capacity Utilization 55.6% ICU Level of Service B Analysis Period (min) 15 c Critical Lane Group SNC Lavalin Synchro 6 Report Page 18
66 Queues Weekday AM - Future Total Traffic : Homer Watson & Manitou Drive Base Case Lane Group EBL EBT EBR WBL WBT WBR NBL NBT NBR SBL SBT SBR Lane Configurations Total Lost Time (s) Satd. Flow (prot) Flt Permitted Satd. Flow (perm) Satd. Flow (RTOR) Volume (vph) Lane Group Flow (vph) Turn Type Prot Free pm+pt Free pm+pt Prot Protected Phases Permitted Phases Free 8 Free 2 Total Split (s) Act Effct Green (s) Actuated g/c Ratio v/c Ratio Control Delay Queue Delay Total Delay LOS F C A C D A F D E C Approach Delay Approach LOS D C E D Queue Length 50th (m) ~ ~ Queue Length 95th (m)# # Internal Link Dist (m) Turn Bay Length (m) Base Capacity (vph) Starvation Cap Reductn Spillback Cap Reductn Storage Cap Reductn Reduced v/c Ratio Intersection Summary Cycle Length: 130 Actuated Cycle Length: Control Type: Semi Act-Uncoord Maximum v/c Ratio: 1.03 Intersection Signal Delay: 43.1 Intersection LOS: D ICU Level of Service E Intersection Capacity Utilization 90.9% Analysis Period (min) 15 ~ Volume exceeds capacity, queue is theoretically infinite. Queue shown is maximum after two cycles. # 95th percentile volume exceeds capacity, queue may be longer. Queue shown is maximum after two cycles. SNC Lavalin Synchro 6 Report Page 19
67 Queues Weekday AM - Future Total Traffic : Homer Watson & Manitou Drive Base Case Splits and Phases: 35: Homer Watson & Manitou Drive SNC Lavalin Synchro 6 Report Page 20
68 HCM Signalized Intersection Capacity Analysis Weekday AM - Future Total Traffic : Homer Watson & Manitou Drive Base Case Movement EBL EBT EBR WBL WBT WBR NBL NBT NBR SBL SBT SBR Lane Configurations Ideal Flow (vphpl) Total Lost time (s) Lane Util. Factor Frt Flt Protected Satd. Flow (prot) Flt Permitted Satd. Flow (perm) Volume (vph) Peak-hour factor, PHF Adj. Flow (vph) RTOR Reduction (vph) Lane Group Flow (vph) Heavy Vehicles (%) 2% 1% 0% 14% 5% 13% 19% 5% 5% 3% 5% 4% Turn Type Prot Free pm+pt Free pm+pt Prot Protected Phases Permitted Phases Free 8 Free 2 Actuated Green, G (s) Effective Green, g (s) Actuated g/c Ratio Clearance Time (s) Vehicle Extension (s) Lane Grp Cap (vph) v/s Ratio Prot c c0.29 c v/s Ratio Perm c0.21 v/c Ratio Uniform Delay, d Progression Factor Incremental Delay, d Delay (s) Level of Service F C A C D A F D E D Approach Delay (s) Approach LOS D C E D Intersection Summary HCM Average Control Delay 43.7 HCM Level of Service D HCM Volume to Capacity ratio 0.97 Actuated Cycle Length (s) Sum of lost time (s) 12.0 Intersection Capacity Utilization 90.9% ICU Level of Service E Analysis Period (min) 15 c Critical Lane Group SNC Lavalin Synchro 6 Report Page 21
69 Queues Weekday AM - Future Total Traffic : Homer Watson Blvd. & Doon South Dr. Base Case Lane Group EBL EBT EBR WBL WBT WBR NBL NBT NBR SBL SBT SBR Lane Configurations Total Lost Time (s) Satd. Flow (prot) Flt Permitted Satd. Flow (perm) Satd. Flow (RTOR) Volume (vph) Lane Group Flow (vph) Turn Type Perm Perm pm+pt Split Split Perm Protected Phases Permitted Phases Total Split (s) Act Effct Green (s) Actuated g/c Ratio v/c Ratio Control Delay Queue Delay Total Delay LOS C A B B D E Approach Delay Approach LOS C B D Queue Length 50th (m) Queue Length 95th (m) # #151.2 Internal Link Dist (m) Turn Bay Length (m) Base Capacity (vph) Starvation Cap Reductn Spillback Cap Reductn Storage Cap Reductn Reduced v/c Ratio Intersection Summary Cycle Length: 120 Actuated Cycle Length: Control Type: Semi Act-Uncoord Maximum v/c Ratio: 0.95 Intersection Signal Delay: 25.2 Intersection LOS: C ICU Level of Service F Intersection Capacity Utilization 91.9% Analysis Period (min) 15 # 95th percentile volume exceeds capacity, queue may be longer. Queue shown is maximum after two cycles. Splits and Phases: 38: Homer Watson Blvd. & Doon South Dr. SNC Lavalin Synchro 6 Report Page 22
70 HCM Signalized Intersection Capacity Analysis Weekday AM - Future Total Traffic : Homer Watson Blvd. & Doon South Dr. Base Case Movement EBL EBT EBR WBL WBT WBR NBL NBT NBR SBL SBT SBR Lane Configurations Ideal Flow (vphpl) Total Lost time (s) Lane Util. Factor Frt Flt Protected Satd. Flow (prot) Flt Permitted Satd. Flow (perm) Volume (vph) Peak-hour factor, PHF Adj. Flow (vph) RTOR Reduction (vph) Lane Group Flow (vph) Heavy Vehicles (%) 2% 0% 1% 0% 0% 0% 18% 7% 0% 0% 0% 6% Turn Type Perm Perm pm+pt Split Split Perm Protected Phases Permitted Phases Actuated Green, G (s) Effective Green, g (s) Actuated g/c Ratio Clearance Time (s) Vehicle Extension (s) Lane Grp Cap (vph) v/s Ratio Prot c c c0.24 v/s Ratio Perm v/c Ratio Uniform Delay, d Progression Factor Incremental Delay, d Delay (s) Level of Service C A C B D E Approach Delay (s) Approach LOS C B D A Intersection Summary HCM Average Control Delay 26.3 HCM Level of Service C HCM Volume to Capacity ratio 0.91 Actuated Cycle Length (s) Sum of lost time (s) 12.0 Intersection Capacity Utilization 91.9% ICU Level of Service F Analysis Period (min) 15 c Critical Lane Group SNC Lavalin Synchro 6 Report Page 23
71 Queues Weekday AM - Future Total Traffic : Pioneer Drive & Manitou Drive Base Case Lane Group EBL EBT EBR WBL WBT WBR NBL NBT NBR SBL SBT SBR Lane Configurations Total Lost Time (s) Satd. Flow (prot) Flt Permitted Satd. Flow (perm) Satd. Flow (RTOR) Volume (vph) Lane Group Flow (vph) Turn Type Perm Perm Perm Perm Perm Perm Perm Protected Phases Permitted Phases Total Split (s) Act Effct Green (s) Actuated g/c Ratio v/c Ratio Control Delay Queue Delay Total Delay LOS C A B A B A B B A Approach Delay Approach LOS B B B A Queue Length 50th (m) Queue Length 95th (m) Internal Link Dist (m) Turn Bay Length (m) Base Capacity (vph) Starvation Cap Reductn Spillback Cap Reductn Storage Cap Reductn Reduced v/c Ratio Intersection Summary Cycle Length: 90 Actuated Cycle Length: 43.6 Control Type: Semi Act-Uncoord Maximum v/c Ratio: 0.61 Intersection Signal Delay: 13.2 Intersection Capacity Utilization 71.8% Analysis Period (min) 15 Intersection LOS: B ICU Level of Service C Splits and Phases: 39: Pioneer Drive & Manitou Drive SNC Lavalin Synchro 6 Report Page 24
72 HCM Signalized Intersection Capacity Analysis Weekday AM - Future Total Traffic : Pioneer Drive & Manitou Drive Base Case Movement EBL EBT EBR WBL WBT WBR NBL NBT NBR SBL SBT SBR Lane Configurations Ideal Flow (vphpl) Total Lost time (s) Lane Util. Factor Frt Flt Protected Satd. Flow (prot) Flt Permitted Satd. Flow (perm) Volume (vph) Peak-hour factor, PHF Adj. Flow (vph) RTOR Reduction (vph) Lane Group Flow (vph) Turn Type Perm Perm Perm Perm Perm Perm Perm Protected Phases Permitted Phases Actuated Green, G (s) Effective Green, g (s) Actuated g/c Ratio Clearance Time (s) Vehicle Extension (s) Lane Grp Cap (vph) v/s Ratio Prot v/s Ratio Perm 0.21 c c v/c Ratio Uniform Delay, d Progression Factor Incremental Delay, d Delay (s) Level of Service A A A A B A A A A Approach Delay (s) Approach LOS A A B A Intersection Summary HCM Average Control Delay 9.2 HCM Level of Service A HCM Volume to Capacity ratio 0.58 Actuated Cycle Length (s) 38.1 Sum of lost time (s) 8.0 Intersection Capacity Utilization 71.8% ICU Level of Service C Analysis Period (min) 15 c Critical Lane Group SNC Lavalin Synchro 6 Report Page 25
73 Queues Weekday AM - Future Total Traffic : Homer Watson & Pioneer Dr. Base Case Lane Group SEL SET SER NWL NWT NWR NEL NET NER SWL SWT SWR Lane Configurations Total Lost Time (s) Satd. Flow (prot) Flt Permitted Satd. Flow (perm) Satd. Flow (RTOR) Volume (vph) Lane Group Flow (vph) Turn Type pm+pt Free pm+pt Free pm+pt Free Perm Protected Phases Permitted Phases 6 Free 2 Free 4 Free 8 Total Split (s) Act Effct Green (s) Actuated g/c Ratio v/c Ratio Control Delay Queue Delay Total Delay LOS B D A E C A D E A E D Approach Delay Approach LOS D C D D Queue Length 50th (m) Queue Length 95th (m) 5.8 # # #68.0 # Internal Link Dist (m) Turn Bay Length (m) Base Capacity (vph) Starvation Cap Reductn Spillback Cap Reductn Storage Cap Reductn Reduced v/c Ratio Intersection Summary Cycle Length: 130 Actuated Cycle Length: 130 Control Type: Semi Act-Uncoord Maximum v/c Ratio: 0.97 Intersection Signal Delay: 36.4 Intersection LOS: D ICU Level of Service E Intersection Capacity Utilization 89.2% Analysis Period (min) 15 # 95th percentile volume exceeds capacity, queue may be longer. Queue shown is maximum after two cycles. Splits and Phases: 45: Homer Watson & Pioneer Dr. SNC Lavalin Synchro 6 Report Page 26
74 HCM Signalized Intersection Capacity Analysis Weekday AM - Future Total Traffic : Homer Watson & Pioneer Dr. Base Case Movement SEL SET SER NWL NWT NWR NEL NET NER SWL SWT SWR Lane Configurations Ideal Flow (vphpl) Total Lost time (s) Lane Util. Factor Frt Flt Protected Satd. Flow (prot) Flt Permitted Satd. Flow (perm) Volume (vph) Peak-hour factor, PHF Adj. Flow (vph) RTOR Reduction (vph) Lane Group Flow (vph) Heavy Vehicles (%) 4% 15% 6% 11% 6% 6% 2% 4% 4% 0% 7% 2% Parking (#/hr) 0 Turn Type pm+pt Free pm+pt Free pm+pt Free Perm Protected Phases Permitted Phases 6 Free 2 Free 4 Free 8 Actuated Green, G (s) Effective Green, g (s) Actuated g/c Ratio Clearance Time (s) Vehicle Extension (s) Lane Grp Cap (vph) v/s Ratio Prot 0.01 c0.54 c c v/s Ratio Perm c v/c Ratio Uniform Delay, d Progression Factor Incremental Delay, d Delay (s) Level of Service C D A E C A D E A D D Approach Delay (s) Approach LOS D C D D Intersection Summary HCM Average Control Delay 35.8 HCM Level of Service D HCM Volume to Capacity ratio 0.93 Actuated Cycle Length (s) Sum of lost time (s) 12.0 Intersection Capacity Utilization 89.2% ICU Level of Service E Analysis Period (min) 15 c Critical Lane Group SNC Lavalin Synchro 6 Report Page 27
75 Queues Weekday AM - Future Total Traffic : Homer Watson Blvd. & Conestoga College Blvd Base Case Lane Group EBL EBT EBR WBL WBT WBR NBL NBT NBR SBL SBT SBR Lane Configurations Total Lost Time (s) Satd. Flow (prot) Flt Permitted Satd. Flow (perm) Satd. Flow (RTOR) Volume (vph) Lane Group Flow (vph) Turn Type Prot Perm pm+pt Free pm+pt pm+pt Perm Protected Phases Permitted Phases 4 8 Free Total Split (s) Act Effct Green (s) Actuated g/c Ratio v/c Ratio Control Delay Queue Delay Total Delay LOS D C A D C A D D D D B Approach Delay Approach LOS C B D D Queue Length 50th (m) Queue Length 95th (m) # Internal Link Dist (m) Turn Bay Length (m) Base Capacity (vph) Starvation Cap Reductn Spillback Cap Reductn Storage Cap Reductn Reduced v/c Ratio Intersection Summary Cycle Length: 120 Actuated Cycle Length: Control Type: Semi Act-Uncoord Maximum v/c Ratio: 0.86 Intersection Signal Delay: 24.3 Intersection LOS: C ICU Level of Service E Intersection Capacity Utilization 85.8% Analysis Period (min) 15 # 95th percentile volume exceeds capacity, queue may be longer. Queue shown is maximum after two cycles. Splits and Phases: 50: Homer Watson Blvd. & Conestoga College Blvd SNC Lavalin Synchro 6 Report Page 28
76 HCM Signalized Intersection Capacity Analysis Weekday AM - Future Total Traffic : Homer Watson Blvd. & Conestoga College Blvd Base Case Movement EBL EBT EBR WBL WBT WBR NBL NBT NBR SBL SBT SBR Lane Configurations Ideal Flow (vphpl) Total Lost time (s) Lane Util. Factor Frt Flt Protected Satd. Flow (prot) Flt Permitted Satd. Flow (perm) Volume (vph) Peak-hour factor, PHF Adj. Flow (vph) RTOR Reduction (vph) Lane Group Flow (vph) Heavy Vehicles (%) 4% 2% 30% 3% 3% 9% 14% 6% 1% 3% 6% 19% Turn Type Prot Perm pm+pt Free pm+pt pm+pt Perm Protected Phases Permitted Phases 4 8 Free Actuated Green, G (s) Effective Green, g (s) Actuated g/c Ratio Clearance Time (s) Vehicle Extension (s) Lane Grp Cap (vph) v/s Ratio Prot c0.13 c c v/s Ratio Perm c c v/c Ratio Uniform Delay, d Progression Factor Incremental Delay, d Delay (s) Level of Service D C A D C A D D D D D Approach Delay (s) Approach LOS C B D D Intersection Summary HCM Average Control Delay 24.8 HCM Level of Service C HCM Volume to Capacity ratio 0.79 Actuated Cycle Length (s) Sum of lost time (s) 12.0 Intersection Capacity Utilization 85.8% ICU Level of Service E Analysis Period (min) 15 c Critical Lane Group SNC Lavalin Synchro 6 Report Page 29
77 Queues Weekday AM - Future Total Traffic : Homer Watson Blvd. & New Dundee Road Base Case Lane Group EBL EBT EBR WBL WBT WBR NBL NBT NBR SBL SBT SBR Lane Configurations Total Lost Time (s) Satd. Flow (prot) Flt Permitted Satd. Flow (perm) Satd. Flow (RTOR) Volume (vph) Lane Group Flow (vph) Turn Type Perm pm+pt Perm custom Free Perm Free Protected Phases Permitted Phases Free 6 Free Total Split (s) Act Effct Green (s) Actuated g/c Ratio v/c Ratio Control Delay Queue Delay Total Delay LOS B A E A A C A C C A Approach Delay Approach LOS B B B Queue Length 50th (m) Queue Length 95th (m) # Internal Link Dist (m) Turn Bay Length (m) Base Capacity (vph) Starvation Cap Reductn Spillback Cap Reductn Storage Cap Reductn Reduced v/c Ratio Intersection Summary Cycle Length: 100 Actuated Cycle Length: 82.9 Control Type: Semi Act-Uncoord Maximum v/c Ratio: 0.94 Intersection Signal Delay: 12.6 Intersection LOS: B ICU Level of Service D Intersection Capacity Utilization 76.2% Analysis Period (min) 15 # 95th percentile volume exceeds capacity, queue may be longer. Queue shown is maximum after two cycles. Splits and Phases: 53: Homer Watson Blvd. & New Dundee Road SNC Lavalin Synchro 6 Report Page 30
78 HCM Signalized Intersection Capacity Analysis Weekday AM - Future Total Traffic : Homer Watson Blvd. & New Dundee Road Base Case Movement EBL EBT EBR WBL WBT WBR NBL NBT NBR SBL SBT SBR Lane Configurations Ideal Flow (vphpl) Total Lost time (s) Lane Util. Factor Frt Flt Protected Satd. Flow (prot) Flt Permitted Satd. Flow (perm) Volume (vph) Peak-hour factor, PHF Adj. Flow (vph) RTOR Reduction (vph) Lane Group Flow (vph) Heavy Vehicles (%) 0% 5% 50% 0% 6% 0% 0% 0% 4% 11% 15% 6% Parking (#/hr) 0 Turn Type Perm pm+pt Perm custom Free Perm Free Protected Phases Permitted Phases Free 6 Free Actuated Green, G (s) Effective Green, g (s) Actuated g/c Ratio Clearance Time (s) Vehicle Extension (s) Lane Grp Cap (vph) v/s Ratio Prot 0.37 c v/s Ratio Perm 0.00 c c0.65 v/c Ratio Uniform Delay, d Progression Factor Incremental Delay, d Delay (s) Level of Service B A E A A C A C C A Approach Delay (s) Approach LOS B B A A Intersection Summary HCM Average Control Delay 12.1 HCM Level of Service B HCM Volume to Capacity ratio 0.86 Actuated Cycle Length (s) 82.9 Sum of lost time (s) 4.0 Intersection Capacity Utilization 76.2% ICU Level of Service D Analysis Period (min) 15 c Critical Lane Group SNC Lavalin Synchro 6 Report Page 31
79 HCM Unsignalized Intersection Capacity Analysis Weekday AM - Future Total Traffic : ConesToga College & New Dundee Rd. Base Case Movement EBL EBR NBL NBT SBT SBR Lane Configurations Sign Control Stop Free Free Grade 0% 0% 0% Volume (veh/h) Peak Hour Factor Hourly flow rate (vph) Pedestrians Lane Width (m) Walking Speed (m/s) Percent Blockage Right turn flare (veh) Median type TWLTL Median storage veh) 2 Upstream signal (m) 149 px, platoon unblocked vc, conflicting volume vc1, stage 1 conf vol 521 vc2, stage 2 conf vol 959 vcu, unblocked vol tc, single (s) tc, 2 stage (s) 5.8 tf (s) p0 queue free % cm capacity (veh/h) Direction, Lane # EB 1 EB 2 NB 1 NB 2 NB 3 SB 1 SB 2 SB 3 Volume Total Volume Left Volume Right csh Volume to Capacity Queue Length 95th (m) Control Delay (s) Lane LOS C B A Approach Delay (s) Approach LOS C Intersection Summary Average Delay 2.4 Intersection Capacity Utilization 41.0% ICU Level of Service A Analysis Period (min) 15 SNC Lavalin Synchro 6 Report Page 32
80 Queues Weekday AM - Future Total Traffic : New Dundee Rd & Thomas Slee Dr. Base Case Lane Group EBL EBT EBR WBL WBT WBR NBL NBT NBR SBL SBT SBR Lane Configurations Total Lost Time (s) Satd. Flow (prot) Flt Permitted Satd. Flow (perm) Satd. Flow (RTOR) Volume (vph) Lane Group Flow (vph) Turn Type Perm Perm Perm Perm Perm Perm Protected Phases Permitted Phases Total Split (s) Act Effct Green (s) Actuated g/c Ratio v/c Ratio Control Delay Queue Delay Total Delay LOS A A A A D A Approach Delay Approach LOS A A C Queue Length 50th (m) Queue Length 95th (m) Internal Link Dist (m) Turn Bay Length (m) Base Capacity (vph) Starvation Cap Reductn Spillback Cap Reductn Storage Cap Reductn Reduced v/c Ratio Intersection Summary Cycle Length: 90 Actuated Cycle Length: 93.9 Control Type: Semi Act-Uncoord Maximum v/c Ratio: 0.45 Intersection Signal Delay: 5.2 Intersection Capacity Utilization 45.6% Analysis Period (min) 15 Intersection LOS: A ICU Level of Service A Splits and Phases: 57: New Dundee Rd & Thomas Slee Dr. SNC Lavalin Synchro 6 Report Page 33
81 HCM Signalized Intersection Capacity Analysis Weekday AM - Future Total Traffic : New Dundee Rd & Thomas Slee Dr. Base Case Movement EBL EBT EBR WBL WBT WBR NBL NBT NBR SBL SBT SBR Lane Configurations Ideal Flow (vphpl) Total Lost time (s) Lane Util. Factor Frt Flt Protected Satd. Flow (prot) Flt Permitted Satd. Flow (perm) Volume (vph) Peak-hour factor, PHF Adj. Flow (vph) RTOR Reduction (vph) Lane Group Flow (vph) Heavy Vehicles (%) 65% 2% 2% 2% 11% 67% 2% 2% 2% 2% 2% 48% Turn Type Perm Perm Perm Perm Perm Perm Protected Phases Permitted Phases Actuated Green, G (s) Effective Green, g (s) Actuated g/c Ratio Clearance Time (s) Vehicle Extension (s) Lane Grp Cap (vph) v/s Ratio Prot c v/s Ratio Perm c0.06 v/c Ratio Uniform Delay, d Progression Factor Incremental Delay, d Delay (s) Level of Service A A A A D D Approach Delay (s) Approach LOS A A A D Intersection Summary HCM Average Control Delay 6.0 HCM Level of Service A HCM Volume to Capacity ratio 0.41 Actuated Cycle Length (s) 94.7 Sum of lost time (s) 8.0 Intersection Capacity Utilization 45.6% ICU Level of Service A Analysis Period (min) 15 c Critical Lane Group SNC Lavalin Synchro 6 Report Page 34
82 HCM Unsignalized Intersection Capacity Analysis Weekday AM - Future Total Traffic : New Dundee Road & Collector"B" Base Case Movement EBL EBT WBT WBR SBL SBR Lane Configurations Sign Control Free Free Stop Grade 0% 0% 0% Volume (veh/h) Peak Hour Factor Hourly flow rate (vph) Pedestrians Lane Width (m) Walking Speed (m/s) Percent Blockage Right turn flare (veh) Median type TWLTL Median storage veh) 2 Upstream signal (m) px, platoon unblocked vc, conflicting volume vc1, stage 1 conf vol 572 vc2, stage 2 conf vol 538 vcu, unblocked vol tc, single (s) tc, 2 stage (s) 5.8 tf (s) p0 queue free % cm capacity (veh/h) Direction, Lane # EB 1 EB 2 EB 3 WB 1 WB 2 SB 1 SB 2 Volume Total Volume Left Volume Right csh Volume to Capacity Queue Length 95th (m) Control Delay (s) Lane LOS A B B Approach Delay (s) Approach LOS B Intersection Summary Average Delay 0.8 Intersection Capacity Utilization 37.0% ICU Level of Service A Analysis Period (min) 15 SNC Lavalin Synchro 6 Report Page 35
83 HCM Unsignalized Intersection Capacity Analysis Weekday AM - Future Total Traffic : New Dundee Rd & Reichert Dr. Base Case Movement EBT EBR WBL WBT NBL NBR Lane Configurations Sign Control Free Free Stop Grade 0% 0% 0% Volume (veh/h) Peak Hour Factor Hourly flow rate (vph) Pedestrians Lane Width (m) Walking Speed (m/s) Percent Blockage Right turn flare (veh) Median type None Median storage veh) Upstream signal (m) px, platoon unblocked vc, conflicting volume vc1, stage 1 conf vol vc2, stage 2 conf vol vcu, unblocked vol tc, single (s) tc, 2 stage (s) tf (s) p0 queue free % cm capacity (veh/h) Direction, Lane # EB 1 EB 2 WB 1 WB 2 NB 1 Volume Total Volume Left Volume Right csh Volume to Capacity Queue Length 95th (m) Control Delay (s) Lane LOS A C Approach Delay (s) Approach LOS C Intersection Summary Average Delay 1.1 Intersection Capacity Utilization 59.9% ICU Level of Service B Analysis Period (min) 15 SNC Lavalin Synchro 6 Report Page 37
84 HCM Unsignalized Intersection Capacity Analysis Weekday AM - Future Total Traffic : Biehn Drive & Strasburg Road Base Case Movement WBL WBR NBT NBR SBL SBT Lane Configurations Sign Control Stop Free Free Grade 0% 0% 0% Volume (veh/h) Peak Hour Factor Hourly flow rate (vph) Pedestrians Lane Width (m) Walking Speed (m/s) Percent Blockage Right turn flare (veh) Median type TWLTL Median storage veh) 2 Upstream signal (m) px, platoon unblocked vc, conflicting volume vc1, stage 1 conf vol 726 vc2, stage 2 conf vol 430 vcu, unblocked vol tc, single (s) tc, 2 stage (s) 5.8 tf (s) p0 queue free % cm capacity (veh/h) Direction, Lane # WB 1 NB 1 NB 2 SB 1 SB 2 Volume Total Volume Left Volume Right csh Volume to Capacity Queue Length 95th (m) Control Delay (s) Lane LOS C A Approach Delay (s) Approach LOS C Intersection Summary Average Delay 2.9 Intersection Capacity Utilization 64.7% ICU Level of Service C Analysis Period (min) 15 SNC Lavalin Synchro 6 Report Page 38
85 HCM Unsignalized Intersection Capacity Analysis Weekdays PM - Future Total Traffic : New Dundee Road & Collector "A" Base Case Movement EBL EBT WBT WBR SBL SBR Lane Configurations Sign Control Free Free Stop Grade 0% 0% 0% Volume (veh/h) Peak Hour Factor Hourly flow rate (vph) Pedestrians Lane Width (m) Walking Speed (m/s) Percent Blockage Right turn flare (veh) Median type TWLTL Median storage veh) 1 Upstream signal (m) px, platoon unblocked vc, conflicting volume vc1, stage 1 conf vol 1098 vc2, stage 2 conf vol 440 vcu, unblocked vol tc, single (s) tc, 2 stage (s) 5.8 tf (s) p0 queue free % cm capacity (veh/h) Direction, Lane # EB 1 EB 2 WB 1 WB 2 WB 3 SB 1 SB 2 Volume Total Volume Left Volume Right csh Volume to Capacity Queue Length 95th (m) Control Delay (s) Lane LOS A D B Approach Delay (s) Approach LOS C Intersection Summary Average Delay 1.1 Intersection Capacity Utilization 61.8% ICU Level of Service B Analysis Period (min) 15 SNC Lavalin Synchro 6 Report Page 3
86 HCM Unsignalized Intersection Capacity Analysis Weekdays PM - Future Total Traffic : Rockcliffe Drive & Strasburg Road Base Case Movement EBL EBR NBL NBT SBT SBR Lane Configurations Sign Control Stop Free Free Grade 0% 0% 0% Volume (veh/h) Peak Hour Factor Hourly flow rate (vph) Pedestrians Lane Width (m) Walking Speed (m/s) Percent Blockage Right turn flare (veh) 9 Median type TWLTL Median storage veh) 2 Upstream signal (m) px, platoon unblocked vc, conflicting volume vc1, stage 1 conf vol 1283 vc2, stage 2 conf vol 568 vcu, unblocked vol tc, single (s) tc, 2 stage (s) 5.8 tf (s) p0 queue free % cm capacity (veh/h) Direction, Lane # EB 1 NB 1 NB 2 NB 3 SB 1 SB 2 SB 3 Volume Total Volume Left Volume Right csh Volume to Capacity Queue Length 95th (m) Control Delay (s) Lane LOS D B Approach Delay (s) Approach LOS D Intersection Summary Average Delay 2.2 Intersection Capacity Utilization 54.7% ICU Level of Service A Analysis Period (min) 15 SNC Lavalin Synchro 6 Report Page 4
87 Queues Weekdays PM - Future Total Traffic : New Dundee Road & Strasburg Road Base Case Lane Group EBL EBT EBR WBL WBT WBR NBL NBT NBR SBL SBT SBR Lane Configurations Total Lost Time (s) Satd. Flow (prot) Flt Permitted Satd. Flow (perm) Satd. Flow (RTOR) Volume (vph) Lane Group Flow (vph) Turn Type Prot Perm Free Perm pm+pt Protected Phases Permitted Phases 8 Free 2 6 Total Split (s) Act Effct Green (s) Actuated g/c Ratio v/c Ratio Control Delay Queue Delay Total Delay LOS E C D A C B A Approach Delay Approach LOS C C C B Queue Length 50th (m) Queue Length 95th (m) # #195.4 # Internal Link Dist (m) Turn Bay Length (m) Base Capacity (vph) Starvation Cap Reductn Spillback Cap Reductn Storage Cap Reductn Reduced v/c Ratio Intersection Summary Cycle Length: 100 Actuated Cycle Length: 94.6 Control Type: Semi Act-Uncoord Maximum v/c Ratio: 0.88 Intersection Signal Delay: 25.4 Intersection LOS: C ICU Level of Service F Intersection Capacity Utilization 97.0% Analysis Period (min) 15 # 95th percentile volume exceeds capacity, queue may be longer. Queue shown is maximum after two cycles. Splits and Phases: 15: New Dundee Road & Strasburg Road SNC Lavalin Synchro 6 Report Page 8
88 HCM Signalized Intersection Capacity Analysis Weekdays PM - Future Total Traffic : New Dundee Road & Strasburg Road Base Case Movement EBL EBT EBR WBL WBT WBR NBL NBT NBR SBL SBT SBR Lane Configurations Ideal Flow (vphpl) Total Lost time (s) Lane Util. Factor Frt Flt Protected Satd. Flow (prot) Flt Permitted Satd. Flow (perm) Volume (vph) Peak-hour factor, PHF Adj. Flow (vph) RTOR Reduction (vph) Lane Group Flow (vph) Heavy Vehicles (%) 0% 7% 0% 10% 3% 0% 2% 2% 0% 0% 4% 0% Turn Type Prot Perm Free Perm pm+pt Protected Phases Permitted Phases 8 Free 2 6 Actuated Green, G (s) Effective Green, g (s) Actuated g/c Ratio Clearance Time (s) Vehicle Extension (s) Lane Grp Cap (vph) v/s Ratio Prot c v/s Ratio Perm c0.19 c0.32 c v/c Ratio Uniform Delay, d Progression Factor Incremental Delay, d Delay (s) Level of Service F C D A C B A Approach Delay (s) Approach LOS D C C B Intersection Summary HCM Average Control Delay 26.2 HCM Level of Service C HCM Volume to Capacity ratio 0.83 Actuated Cycle Length (s) 97.0 Sum of lost time (s) 12.0 Intersection Capacity Utilization 97.0% ICU Level of Service F Analysis Period (min) 15 c Critical Lane Group SNC Lavalin Synchro 6 Report Page 9
89 HCM Unsignalized Intersection Capacity Analysis Weekdays PM - Future Total Traffic : Rush Meadow & Strasburg Road Base Case Movement WBL WBR NET NER SWL SWT Lane Configurations Sign Control Stop Free Free Grade 0% 0% 0% Volume (veh/h) Peak Hour Factor Hourly flow rate (vph) Pedestrians Lane Width (m) Walking Speed (m/s) Percent Blockage Right turn flare (veh) Median type TWLTL Median storage veh) 2 Upstream signal (m) px, platoon unblocked vc, conflicting volume vc1, stage 1 conf vol 976 vc2, stage 2 conf vol 857 vcu, unblocked vol tc, single (s) tc, 2 stage (s) 5.8 tf (s) p0 queue free % cm capacity (veh/h) Direction, Lane # WB 1 NE 1 NE 2 SW 1 SW 2 SW 3 Volume Total Volume Left Volume Right csh Volume to Capacity Queue Length 95th (m) Control Delay (s) Lane LOS C B Approach Delay (s) Approach LOS C Intersection Summary Average Delay 0.7 Intersection Capacity Utilization 50.7% ICU Level of Service A Analysis Period (min) 15 SNC Lavalin Synchro 6 Report Page 10
90 Queues Weekdays PM - Future Total Traffic : New Dundee Road & Fischer-Hallman Rd. Base Case Lane Group EBL EBT EBR WBL WBT WBR NBL NBT NBR SBL SBT SBR Lane Configurations Total Lost Time (s) Satd. Flow (prot) Flt Permitted Satd. Flow (perm) Satd. Flow (RTOR) Volume (vph) Lane Group Flow (vph) Turn Type Perm Perm Perm Perm pm+pt Protected Phases Permitted Phases Total Split (s) Act Effct Green (s) Actuated g/c Ratio v/c Ratio Control Delay Queue Delay Total Delay LOS C C B B B A Approach Delay Approach LOS C B B B Queue Length 50th (m) Queue Length 95th (m) # Internal Link Dist (m) Turn Bay Length (m) Base Capacity (vph) Starvation Cap Reductn Spillback Cap Reductn Storage Cap Reductn Reduced v/c Ratio Intersection Summary Cycle Length: 100 Actuated Cycle Length: 84.5 Control Type: Semi Act-Uncoord Maximum v/c Ratio: 0.77 Intersection Signal Delay: 14.8 Intersection LOS: B ICU Level of Service D Intersection Capacity Utilization 77.4% Analysis Period (min) 15 # 95th percentile volume exceeds capacity, queue may be longer. Queue shown is maximum after two cycles. Splits and Phases: 22: New Dundee Road & Fischer-Hallman Rd. SNC Lavalin Synchro 6 Report Page 12
91 HCM Signalized Intersection Capacity Analysis Weekdays PM - Future Total Traffic : New Dundee Road & Fischer-Hallman Rd. Base Case Movement EBL EBT EBR WBL WBT WBR NBL NBT NBR SBL SBT SBR Lane Configurations Ideal Flow (vphpl) Total Lost time (s) Lane Util. Factor Frt Flt Protected Satd. Flow (prot) Flt Permitted Satd. Flow (perm) Volume (vph) Peak-hour factor, PHF Adj. Flow (vph) RTOR Reduction (vph) Lane Group Flow (vph) Heavy Vehicles (%) 3% 9% 10% 0% 6% 2% 1% 2% 0% 3% 4% 2% Turn Type Perm Perm Perm Perm pm+pt Protected Phases Permitted Phases Actuated Green, G (s) Effective Green, g (s) Actuated g/c Ratio Clearance Time (s) Vehicle Extension (s) Lane Grp Cap (vph) v/s Ratio Prot c v/s Ratio Perm c c0.39 v/c Ratio Uniform Delay, d Progression Factor Incremental Delay, d Delay (s) Level of Service C C C B A A Approach Delay (s) Approach LOS C C B A Intersection Summary HCM Average Control Delay 17.1 HCM Level of Service B HCM Volume to Capacity ratio 0.58 Actuated Cycle Length (s) 84.3 Sum of lost time (s) 8.0 Intersection Capacity Utilization 77.4% ICU Level of Service D Analysis Period (min) 15 c Critical Lane Group SNC Lavalin Synchro 6 Report Page 13
92 Queues Weekdays PM - Future Total Traffic : Battler Road & Huron Road Base Case Lane Group SEL SET SER NWL NWT NWR NEL NET NER SWL SWT SWR Lane Configurations Total Lost Time (s) Satd. Flow (prot) Flt Permitted Satd. Flow (perm) Satd. Flow (RTOR) Volume (vph) Lane Group Flow (vph) Turn Type Perm Perm Perm Perm pm+pt Perm Protected Phases Permitted Phases Total Split (s) Act Effct Green (s) Actuated g/c Ratio v/c Ratio Control Delay Queue Delay Total Delay LOS D D D C A C C D A A Approach Delay Approach LOS D C C B Queue Length 50th (m) Queue Length 95th (m) # Internal Link Dist (m) Turn Bay Length (m) Base Capacity (vph) Starvation Cap Reductn Spillback Cap Reductn Storage Cap Reductn Reduced v/c Ratio Intersection Summary Cycle Length: 100 Actuated Cycle Length: 95.8 Control Type: Semi Act-Uncoord Maximum v/c Ratio: 0.94 Intersection Signal Delay: 24.8 Intersection LOS: C ICU Level of Service E Intersection Capacity Utilization 86.5% Analysis Period (min) 15 # 95th percentile volume exceeds capacity, queue may be longer. Queue shown is maximum after two cycles. Splits and Phases: 28: Battler Road & Huron Road SNC Lavalin Synchro 6 Report Page 14
93 HCM Signalized Intersection Capacity Analysis Weekdays PM - Future Total Traffic : Battler Road & Huron Road Base Case Movement SEL SET SER NWL NWT NWR NEL NET NER SWL SWT SWR Lane Configurations Ideal Flow (vphpl) Total Lost time (s) Lane Util. Factor Frt Flt Protected Satd. Flow (prot) Flt Permitted Satd. Flow (perm) Volume (vph) Peak-hour factor, PHF Adj. Flow (vph) RTOR Reduction (vph) Lane Group Flow (vph) Heavy Vehicles (%) 9% 0% 0% 0% 1% 0% 0% 3% 6% 2% 0% 13% Turn Type Perm Perm Perm Perm pm+pt Perm Protected Phases Permitted Phases Actuated Green, G (s) Effective Green, g (s) Actuated g/c Ratio Clearance Time (s) Vehicle Extension (s) Lane Grp Cap (vph) v/s Ratio Prot c v/s Ratio Perm 0.06 c c v/c Ratio Uniform Delay, d Progression Factor Incremental Delay, d Delay (s) Level of Service D C D C C B C D A A Approach Delay (s) Approach LOS C D C B Intersection Summary HCM Average Control Delay 23.7 HCM Level of Service C HCM Volume to Capacity ratio 0.85 Actuated Cycle Length (s) 95.8 Sum of lost time (s) 8.0 Intersection Capacity Utilization 86.5% ICU Level of Service E Analysis Period (min) 15 c Critical Lane Group SNC Lavalin Synchro 6 Report Page 15
94 Queues Weekdays PM - Future Total Traffic : Huron Road & Trillium Dr Base Case Lane Group EBL EBT EBR WBL WBT WBR NBL NBT NBR SBL SBT SBR Lane Configurations Total Lost Time (s) Satd. Flow (prot) Flt Permitted Satd. Flow (perm) Satd. Flow (RTOR) Volume (vph) Lane Group Flow (vph) Turn Type Perm Freecustom custom Protected Phases 4 8 Permitted Phases 4 Free 6 6 Total Split (s) Act Effct Green (s) Actuated g/c Ratio v/c Ratio Control Delay Queue Delay Total Delay LOS A A A A C C Approach Delay Approach LOS A A Queue Length 50th (m) Queue Length 95th (m) Internal Link Dist (m) Turn Bay Length (m) Base Capacity (vph) Starvation Cap Reductn Spillback Cap Reductn Storage Cap Reductn Reduced v/c Ratio Intersection Summary Cycle Length: 90 Actuated Cycle Length: 89.7 Control Type: Semi Act-Uncoord Maximum v/c Ratio: 0.75 Intersection Signal Delay: 7.6 Intersection Capacity Utilization 66.7% Analysis Period (min) 15 Intersection LOS: A ICU Level of Service C Splits and Phases: 30: Huron Road & Trillium Dr SNC Lavalin Synchro 6 Report Page 16
95 HCM Signalized Intersection Capacity Analysis Weekdays PM - Future Total Traffic : Huron Road & Trillium Dr Base Case Movement EBL EBT EBR WBL WBT WBR NBL NBT NBR SBL SBT SBR Lane Configurations Ideal Flow (vphpl) Total Lost time (s) Lane Util. Factor Frt Flt Protected Satd. Flow (prot) Flt Permitted Satd. Flow (perm) Volume (vph) Peak-hour factor, PHF Adj. Flow (vph) RTOR Reduction (vph) Lane Group Flow (vph) Heavy Vehicles (%) 4% 4% 0% 0% 10% 10% 0% 0% 5% 5% 0% 5% Turn Type Perm Freecustom custom Protected Phases 4 8 Permitted Phases 4 Free 6 6 Actuated Green, G (s) Effective Green, g (s) Actuated g/c Ratio Clearance Time (s) Vehicle Extension (s) Lane Grp Cap (vph) v/s Ratio Prot 0.28 c0.60 v/s Ratio Perm c v/c Ratio Uniform Delay, d Progression Factor Incremental Delay, d Delay (s) Level of Service A A A A D D Approach Delay (s) Approach LOS A A A D Intersection Summary HCM Average Control Delay 7.0 HCM Level of Service A HCM Volume to Capacity ratio 0.72 Actuated Cycle Length (s) 90.2 Sum of lost time (s) 8.0 Intersection Capacity Utilization 66.7% ICU Level of Service C Analysis Period (min) 15 c Critical Lane Group SNC Lavalin Synchro 6 Report Page 17
96 Queues Weekdays PM - Future Total Traffic : Homer Watson & Manitou Drive Base Case Lane Group EBL EBT EBR WBL WBT WBR NBL NBT NBR SBL SBT SBR Lane Configurations Total Lost Time (s) Satd. Flow (prot) Flt Permitted Satd. Flow (perm) Satd. Flow (RTOR) Volume (vph) Lane Group Flow (vph) Turn Type Prot Perm pm+pt Perm pm+pt Prot Protected Phases Permitted Phases Total Split (s) Act Effct Green (s) Actuated g/c Ratio v/c Ratio Control Delay Queue Delay Total Delay LOS F D A D E A E D E D Approach Delay Approach LOS D D E E Queue Length 50th (m) Queue Length 95th (m) # #41.8 # # #127.5 #162.1 Internal Link Dist (m) Turn Bay Length (m) Base Capacity (vph) Starvation Cap Reductn Spillback Cap Reductn Storage Cap Reductn Reduced v/c Ratio Intersection Summary Cycle Length: 130 Actuated Cycle Length: Control Type: Semi Act-Uncoord Maximum v/c Ratio: 0.97 Intersection Signal Delay: 47.4 Intersection LOS: D ICU Level of Service G Intersection Capacity Utilization 101.1% Analysis Period (min) 15 # 95th percentile volume exceeds capacity, queue may be longer. Queue shown is maximum after two cycles. Splits and Phases: 35: Homer Watson & Manitou Drive SNC Lavalin Synchro 6 Report Page 18
97 HCM Signalized Intersection Capacity Analysis Weekdays PM - Future Total Traffic : Homer Watson & Manitou Drive Base Case Movement EBL EBT EBR WBL WBT WBR NBL NBT NBR SBL SBT SBR Lane Configurations Ideal Flow (vphpl) Total Lost time (s) Lane Util. Factor Frt Flt Protected Satd. Flow (prot) Flt Permitted Satd. Flow (perm) Volume (vph) Peak-hour factor, PHF Adj. Flow (vph) RTOR Reduction (vph) Lane Group Flow (vph) Heavy Vehicles (%) 2% 1% 0% 2% 1% 3% 0% 4% 5% 4% 6% 1% Turn Type Prot Perm pm+pt Perm pm+pt Prot Protected Phases Permitted Phases Actuated Green, G (s) Effective Green, g (s) Actuated g/c Ratio Clearance Time (s) Vehicle Extension (s) Lane Grp Cap (vph) v/s Ratio Prot c c0.34 c c0.21 c0.28 v/s Ratio Perm v/c Ratio Uniform Delay, d Progression Factor Incremental Delay, d Delay (s) Level of Service F D C D E C E D E E Approach Delay (s) Approach LOS D D E E Intersection Summary HCM Average Control Delay 51.6 HCM Level of Service D HCM Volume to Capacity ratio 0.92 Actuated Cycle Length (s) Sum of lost time (s) 12.0 Intersection Capacity Utilization 101.1% ICU Level of Service G Analysis Period (min) 15 c Critical Lane Group SNC Lavalin Synchro 6 Report Page 19
98 Queues Weekdays PM - Future Total Traffic : Homer Watson Blvd & Doon South Dr. Base Case Lane Group EBL EBT EBR WBL WBT WBR NBL NBT NBR SBL SBT SBR Lane Configurations Total Lost Time (s) Satd. Flow (prot) Flt Permitted Satd. Flow (perm) Satd. Flow (RTOR) Volume (vph) Lane Group Flow (vph) Turn Type Perm Perm pm+pt Split Split Perm Protected Phases Permitted Phases Total Split (s) Act Effct Green (s) Actuated g/c Ratio v/c Ratio Control Delay Queue Delay Total Delay LOS B A D A E B Approach Delay Approach LOS B B C Queue Length 50th (m) Queue Length 95th (m) # Internal Link Dist (m) Turn Bay Length (m) Base Capacity (vph) Starvation Cap Reductn Spillback Cap Reductn Storage Cap Reductn Reduced v/c Ratio Intersection Summary Cycle Length: 120 Actuated Cycle Length: Control Type: Semi Act-Uncoord Maximum v/c Ratio: 0.82 Intersection Signal Delay: 14.5 Intersection LOS: B ICU Level of Service F Intersection Capacity Utilization 96.5% Analysis Period (min) 15 # 95th percentile volume exceeds capacity, queue may be longer. Queue shown is maximum after two cycles. Splits and Phases: 38: Homer Watson Blvd & Doon South Dr. SNC Lavalin Synchro 6 Report Page 20
99 HCM Signalized Intersection Capacity Analysis Weekdays PM - Future Total Traffic : Homer Watson Blvd & Doon South Dr. Base Case Movement EBL EBT EBR WBL WBT WBR NBL NBT NBR SBL SBT SBR Lane Configurations Ideal Flow (vphpl) Total Lost time (s) Lane Util. Factor Frt Flt Protected Satd. Flow (prot) Flt Permitted Satd. Flow (perm) Volume (vph) Peak-hour factor, PHF Adj. Flow (vph) RTOR Reduction (vph) Lane Group Flow (vph) Heavy Vehicles (%) 1% 0% 0% 0% 0% 0% 0% 4% 4% 0% 5% 1% Turn Type Perm Perm pm+pt Split Split Perm Protected Phases Permitted Phases Actuated Green, G (s) Effective Green, g (s) Actuated g/c Ratio Clearance Time (s) Vehicle Extension (s) Lane Grp Cap (vph) v/s Ratio Prot c0.66 c v/s Ratio Perm v/c Ratio Uniform Delay, d Progression Factor Incremental Delay, d Delay (s) Level of Service B B D A D D Approach Delay (s) Approach LOS B B D A Intersection Summary HCM Average Control Delay 15.4 HCM Level of Service B HCM Volume to Capacity ratio 0.78 Actuated Cycle Length (s) Sum of lost time (s) 8.0 Intersection Capacity Utilization 96.5% ICU Level of Service F Analysis Period (min) 15 c Critical Lane Group SNC Lavalin Synchro 6 Report Page 21
100 Queues Weekdays PM - Future Total Traffic : Pioneer Dr & Manitou Drive Base Case Lane Group EBL EBT EBR WBL WBT WBR NBL NBT NBR SBL SBT SBR Lane Configurations Total Lost Time (s) Satd. Flow (prot) Flt Permitted Satd. Flow (perm) Satd. Flow (RTOR) Volume (vph) Lane Group Flow (vph) Turn Type pm+pt Perm Perm Perm Perm Perm Perm Protected Phases Permitted Phases Total Split (s) Act Effct Green (s) Actuated g/c Ratio v/c Ratio Control Delay Queue Delay Total Delay LOS A B B A D A C C A Approach Delay Approach LOS B B C B Queue Length 50th (m) Queue Length 95th (m) # Internal Link Dist (m) Turn Bay Length (m) Base Capacity (vph) Starvation Cap Reductn Spillback Cap Reductn Storage Cap Reductn Reduced v/c Ratio Intersection Summary Cycle Length: 90 Actuated Cycle Length: 62.4 Control Type: Semi Act-Uncoord Maximum v/c Ratio: 0.83 Intersection Signal Delay: 17.5 Intersection LOS: B ICU Level of Service G Intersection Capacity Utilization 102.3% Analysis Period (min) 15 # 95th percentile volume exceeds capacity, queue may be longer. Queue shown is maximum after two cycles. Splits and Phases: 39: Pioneer Dr & Manitou Drive SNC Lavalin Synchro 6 Report Page 22
101 HCM Signalized Intersection Capacity Analysis Weekdays PM - Future Total Traffic : Pioneer Dr & Manitou Drive Base Case Movement EBL EBT EBR WBL WBT WBR NBL NBT NBR SBL SBT SBR Lane Configurations Ideal Flow (vphpl) Total Lost time (s) Lane Util. Factor Frt Flt Protected Satd. Flow (prot) Flt Permitted Satd. Flow (perm) Volume (vph) Peak-hour factor, PHF Adj. Flow (vph) RTOR Reduction (vph) Lane Group Flow (vph) Turn Type pm+pt Perm Perm Perm Perm Perm Perm Protected Phases Permitted Phases Actuated Green, G (s) Effective Green, g (s) Actuated g/c Ratio Clearance Time (s) Vehicle Extension (s) Lane Grp Cap (vph) v/s Ratio Prot 0.02 c v/s Ratio Perm c v/c Ratio Uniform Delay, d Progression Factor Incremental Delay, d Delay (s) Level of Service A B B A C B B B B Approach Delay (s) Approach LOS B B B B Intersection Summary HCM Average Control Delay 15.7 HCM Level of Service B HCM Volume to Capacity ratio 0.72 Actuated Cycle Length (s) 61.4 Sum of lost time (s) 8.0 Intersection Capacity Utilization 102.3% ICU Level of Service G Analysis Period (min) 15 c Critical Lane Group SNC Lavalin Synchro 6 Report Page 23
102 Queues Weekdays PM - Future Total Traffic : Homer Watson Blvd. & Pioneer Dr. Base Case Lane Group SEL SET SER NWL NWT NWR NEL NET NER SWL SWT SWR Lane Configurations Total Lost Time (s) Satd. Flow (prot) Flt Permitted Satd. Flow (perm) Satd. Flow (RTOR) Volume (vph) Lane Group Flow (vph) Turn Type pm+pt Free pm+pt Free pm+pt Free Perm Protected Phases Permitted Phases 6 Free 2 Free 4 Free 8 Total Split (s) Act Effct Green (s) Actuated g/c Ratio v/c Ratio Control Delay Queue Delay Total Delay LOS D C A E D A D E A D D Approach Delay Approach LOS C D D D Queue Length 50th (m) Queue Length 95th (m) # #88.8 # # Internal Link Dist (m) Turn Bay Length (m) Base Capacity (vph) Starvation Cap Reductn Spillback Cap Reductn Storage Cap Reductn Reduced v/c Ratio Intersection Summary Cycle Length: 130 Actuated Cycle Length: Control Type: Semi Act-Uncoord Maximum v/c Ratio: 0.99 Intersection Signal Delay: 38.3 Intersection LOS: D ICU Level of Service F Intersection Capacity Utilization 94.8% Analysis Period (min) 15 # 95th percentile volume exceeds capacity, queue may be longer. Queue shown is maximum after two cycles. Splits and Phases: 45: Homer Watson Blvd. & Pioneer Dr. SNC Lavalin Synchro 6 Report Page 24
103 HCM Signalized Intersection Capacity Analysis Weekdays PM - Future Total Traffic : Homer Watson Blvd. & Pioneer Dr. Base Case Movement SEL SET SER NWL NWT NWR NEL NET NER SWL SWT SWR Lane Configurations Ideal Flow (vphpl) Total Lost time (s) Lane Util. Factor Frt Flt Protected Satd. Flow (prot) Flt Permitted Satd. Flow (perm) Volume (vph) Peak-hour factor, PHF Adj. Flow (vph) RTOR Reduction (vph) Lane Group Flow (vph) Heavy Vehicles (%) 0% 7% 4% 3% 6% 0% 5% 2% 7% 3% 2% 0% Turn Type pm+pt Free pm+pt Free pm+pt Free Perm Protected Phases Permitted Phases 6 Free 2 Free 4 Free 8 Actuated Green, G (s) Effective Green, g (s) Actuated g/c Ratio Clearance Time (s) Vehicle Extension (s) Lane Grp Cap (vph) v/s Ratio Prot c0.10 c c v/s Ratio Perm c v/c Ratio Uniform Delay, d Progression Factor Incremental Delay, d Delay (s) Level of Service D C A E D A D E A D D Approach Delay (s) Approach LOS C D D D Intersection Summary HCM Average Control Delay 37.8 HCM Level of Service D HCM Volume to Capacity ratio 0.94 Actuated Cycle Length (s) Sum of lost time (s) 8.0 Intersection Capacity Utilization 94.8% ICU Level of Service F Analysis Period (min) 15 c Critical Lane Group SNC Lavalin Synchro 6 Report Page 25
104 Queues Weekdays PM - Future Total Traffic : Homer Watson Blvd. & Conestoga College Blvd Base Case Lane Group EBL EBT EBR WBL WBT WBR NBL NBT NBR SBL SBT SBR Lane Configurations Total Lost Time (s) Satd. Flow (prot) Flt Permitted Satd. Flow (perm) Satd. Flow (RTOR) Volume (vph) Lane Group Flow (vph) Turn Type Prot Perm pm+pt Free pm+pt pm+pt Perm Protected Phases Permitted Phases 4 8 Free Total Split (s) Act Effct Green (s) Actuated g/c Ratio v/c Ratio Control Delay Queue Delay Total Delay LOS E C A D C A D C D D D Approach Delay Approach LOS C C C D Queue Length 50th (m) Queue Length 95th (m) 30.7 # # Internal Link Dist (m) Turn Bay Length (m) Base Capacity (vph) Starvation Cap Reductn Spillback Cap Reductn Storage Cap Reductn Reduced v/c Ratio Intersection Summary Cycle Length: 120 Actuated Cycle Length: Control Type: Semi Act-Uncoord Maximum v/c Ratio: 0.89 Intersection Signal Delay: 29.8 Intersection LOS: C ICU Level of Service E Intersection Capacity Utilization 82.1% Analysis Period (min) 15 # 95th percentile volume exceeds capacity, queue may be longer. Queue shown is maximum after two cycles. Splits and Phases: 50: Homer Watson Blvd. & Conestoga College Blvd SNC Lavalin Synchro 6 Report Page 26
105 HCM Signalized Intersection Capacity Analysis Weekdays PM - Future Total Traffic : Homer Watson Blvd. & Conestoga College Blvd Base Case Movement EBL EBT EBR WBL WBT WBR NBL NBT NBR SBL SBT SBR Lane Configurations Ideal Flow (vphpl) Total Lost time (s) Lane Util. Factor Frt Flt Protected Satd. Flow (prot) Flt Permitted Satd. Flow (perm) Volume (vph) Peak-hour factor, PHF Adj. Flow (vph) RTOR Reduction (vph) Lane Group Flow (vph) Heavy Vehicles (%) 3% 5% 0% 13% 6% 1% 3% 0% 25% 1% 0% 1% Turn Type Prot Perm pm+pt Free pm+pt pm+pt Perm Protected Phases Permitted Phases 4 8 Free Actuated Green, G (s) Effective Green, g (s) Actuated g/c Ratio Clearance Time (s) Vehicle Extension (s) Lane Grp Cap (vph) v/s Ratio Prot c0.05 c c v/s Ratio Perm c c0.13 v/c Ratio Uniform Delay, d Progression Factor Incremental Delay, d Delay (s) Level of Service D C B C C A D D D D D Approach Delay (s) Approach LOS C C D D Intersection Summary HCM Average Control Delay 30.3 HCM Level of Service C HCM Volume to Capacity ratio 0.78 Actuated Cycle Length (s) Sum of lost time (s) 8.0 Intersection Capacity Utilization 82.1% ICU Level of Service E Analysis Period (min) 15 c Critical Lane Group SNC Lavalin Synchro 6 Report Page 27
106 Queues Weekdays PM - Future Total Traffic : Homer Watson Blvd. & New Dundee Road Base Case Lane Group EBL EBT EBR WBL WBT WBR NBL NBT NBR SBL SBT SBR Lane Configurations Total Lost Time (s) Satd. Flow (prot) Flt Permitted Satd. Flow (perm) Satd. Flow (RTOR) Volume (vph) Lane Group Flow (vph) Turn Type Perm pm+pt Perm custom Free Perm Free Protected Phases Permitted Phases Free 6 Free Total Split (s) Act Effct Green (s) Actuated g/c Ratio v/c Ratio Control Delay Queue Delay Total Delay LOS D B F B A D A C D A Approach Delay Approach LOS D F C Queue Length 50th (m) ~ Queue Length 95th (m) # # Internal Link Dist (m) Turn Bay Length (m) Base Capacity (vph) Starvation Cap Reductn Spillback Cap Reductn Storage Cap Reductn Reduced v/c Ratio Intersection Summary Cycle Length: 120 Actuated Cycle Length: Control Type: Semi Act-Uncoord Maximum v/c Ratio: 1.44 Intersection Signal Delay: 44.3 Intersection LOS: D ICU Level of Service G Intersection Capacity Utilization 102.7% Analysis Period (min) 15 ~ Volume exceeds capacity, queue is theoretically infinite. Queue shown is maximum after two cycles. # 95th percentile volume exceeds capacity, queue may be longer. Queue shown is maximum after two cycles. SNC Lavalin Synchro 6 Report Page 28
107 Queues Weekdays PM - Future Total Traffic : Homer Watson Blvd. & New Dundee Road Base Case Splits and Phases: 53: Homer Watson Blvd. & New Dundee Road SNC Lavalin Synchro 6 Report Page 29
108 HCM Signalized Intersection Capacity Analysis Weekdays PM - Future Total Traffic : Homer Watson Blvd. & New Dundee Road Base Case Movement EBL EBT EBR WBL WBT WBR NBL NBT NBR SBL SBT SBR Lane Configurations Ideal Flow (vphpl) Total Lost time (s) Lane Util. Factor Frt Flt Protected Satd. Flow (prot) Flt Permitted Satd. Flow (perm) Volume (vph) Peak-hour factor, PHF Adj. Flow (vph) RTOR Reduction (vph) Lane Group Flow (vph) Heavy Vehicles (%) 0% 3% 13% 0% 5% 6% 0% 0% 2% 4% 2% 5% Parking (#/hr) 0 Turn Type Perm pm+pt Perm custom Free Perm Free Protected Phases Permitted Phases Free 6 Free Actuated Green, G (s) Effective Green, g (s) Actuated g/c Ratio Clearance Time (s) Vehicle Extension (s) Lane Grp Cap (vph) v/s Ratio Prot 0.36 c v/s Ratio Perm 0.01 c c0.85 v/c Ratio Uniform Delay, d Progression Factor Incremental Delay, d Delay (s) Level of Service D C F B A C A C D A Approach Delay (s) Approach LOS D F A B Intersection Summary HCM Average Control Delay 44.6 HCM Level of Service D HCM Volume to Capacity ratio 1.22 Actuated Cycle Length (s) Sum of lost time (s) 4.0 Intersection Capacity Utilization 102.7% ICU Level of Service G Analysis Period (min) 15 c Critical Lane Group SNC Lavalin Synchro 6 Report Page 30
109 HCM Unsignalized Intersection Capacity Analysis Weekdays PM - Future Total Traffic : ConesToga College & New Dundee Rd. Base Case Movement EBL EBR NBL NBT SBT SBR Lane Configurations Sign Control Stop Free Free Grade 0% 0% 0% Volume (veh/h) Peak Hour Factor Hourly flow rate (vph) Pedestrians Lane Width (m) Walking Speed (m/s) Percent Blockage Right turn flare (veh) Median type TWLTL Median storage veh) 2 Upstream signal (m) 149 px, platoon unblocked vc, conflicting volume vc1, stage 1 conf vol 1357 vc2, stage 2 conf vol 570 vcu, unblocked vol tc, single (s) tc, 2 stage (s) 5.8 tf (s) p0 queue free % cm capacity (veh/h) Direction, Lane # EB 1 EB 2 NB 1 NB 2 NB 3 SB 1 SB 2 SB 3 Volume Total Volume Left Volume Right csh Volume to Capacity Queue Length 95th (m) Control Delay (s) Lane LOS D C C Approach Delay (s) Approach LOS C Intersection Summary Average Delay 2.9 Intersection Capacity Utilization 58.7% ICU Level of Service B Analysis Period (min) 15 SNC Lavalin Synchro 6 Report Page 31
110 Queues Weekdays PM - Future Total Traffic : New Dundee Rd & Thomas Slee Dr. Base Case Lane Group EBL EBT EBR WBL WBT WBR NBL NBT NBR SBL SBT SBR Lane Configurations Total Lost Time (s) Satd. Flow (prot) Flt Permitted Satd. Flow (perm) Satd. Flow (RTOR) Volume (vph) Lane Group Flow (vph) Turn Type Perm Perm Perm Perm Perm Perm Protected Phases Permitted Phases Total Split (s) Act Effct Green (s) Actuated g/c Ratio v/c Ratio Control Delay Queue Delay Total Delay LOS B A A A C B Approach Delay Approach LOS A A C Queue Length 50th (m) Queue Length 95th (m) # Internal Link Dist (m) Turn Bay Length (m) Base Capacity (vph) Starvation Cap Reductn Spillback Cap Reductn Storage Cap Reductn Reduced v/c Ratio Intersection Summary Cycle Length: 90 Actuated Cycle Length: 90.6 Control Type: Semi Act-Uncoord Maximum v/c Ratio: 0.48 Intersection Signal Delay: 4.7 Intersection LOS: A ICU Level of Service B Intersection Capacity Utilization 55.7% Analysis Period (min) 15 # 95th percentile volume exceeds capacity, queue may be longer. Queue shown is maximum after two cycles. Splits and Phases: 57: New Dundee Rd & Thomas Slee Dr. SNC Lavalin Synchro 6 Report Page 32
111 HCM Signalized Intersection Capacity Analysis Weekdays PM - Future Total Traffic : New Dundee Rd & Thomas Slee Dr. Base Case Movement EBL EBT EBR WBL WBT WBR NBL NBT NBR SBL SBT SBR Lane Configurations Ideal Flow (vphpl) Total Lost time (s) Lane Util. Factor Frt Flt Protected Satd. Flow (prot) Flt Permitted Satd. Flow (perm) Volume (vph) Peak-hour factor, PHF Adj. Flow (vph) RTOR Reduction (vph) Lane Group Flow (vph) Heavy Vehicles (%) 26% 5% 2% 2% 2% 0% 2% 2% 2% 0% 2% 35% Parking (#/hr) 0 Turn Type Perm Perm Perm Perm Perm Perm Protected Phases Permitted Phases Actuated Green, G (s) Effective Green, g (s) Actuated g/c Ratio Clearance Time (s) Vehicle Extension (s) Lane Grp Cap (vph) v/s Ratio Prot 0.22 c v/s Ratio Perm c0.04 v/c Ratio Uniform Delay, d Progression Factor Incremental Delay, d Delay (s) Level of Service A A A A D D Approach Delay (s) Approach LOS A A A D Intersection Summary HCM Average Control Delay 4.8 HCM Level of Service A HCM Volume to Capacity ratio 0.47 Actuated Cycle Length (s) 91.2 Sum of lost time (s) 8.0 Intersection Capacity Utilization 55.7% ICU Level of Service B Analysis Period (min) 15 c Critical Lane Group SNC Lavalin Synchro 6 Report Page 33
112 HCM Unsignalized Intersection Capacity Analysis Weekdays PM - Future Total Traffic : New Dundee Rd & Collector "B" Base Case Movement EBL EBT WBT WBR SBL SBR Lane Configurations Sign Control Free Free Stop Grade 0% 0% 0% Volume (veh/h) Peak Hour Factor Hourly flow rate (vph) Pedestrians Lane Width (m) Walking Speed (m/s) Percent Blockage Right turn flare (veh) Median type TWLTL Median storage veh) 1 Upstream signal (m) px, platoon unblocked vc, conflicting volume vc1, stage 1 conf vol 1254 vc2, stage 2 conf vol 420 vcu, unblocked vol tc, single (s) tc, 2 stage (s) 5.8 tf (s) p0 queue free % cm capacity (veh/h) Direction, Lane # EB 1 EB 2 EB 3 WB 1 WB 2 SB 1 SB 2 Volume Total Volume Left Volume Right csh Volume to Capacity Queue Length 95th (m) Control Delay (s) Lane LOS B D B Approach Delay (s) Approach LOS C Intersection Summary Average Delay 1.1 Intersection Capacity Utilization 46.4% ICU Level of Service A Analysis Period (min) 15 SNC Lavalin Synchro 6 Report Page 34
113 HCM Unsignalized Intersection Capacity Analysis Weekdays PM - Future Total Traffic : New Dundee Rd & Reichert Dr. Base Case Movement EBT EBR WBL WBT NBL NBR Lane Configurations Sign Control Free Free Stop Grade 0% 0% 0% Volume (veh/h) Peak Hour Factor Hourly flow rate (vph) Pedestrians Lane Width (m) Walking Speed (m/s) Percent Blockage Right turn flare (veh) Median type None Median storage veh) Upstream signal (m) px, platoon unblocked vc, conflicting volume vc1, stage 1 conf vol vc2, stage 2 conf vol vcu, unblocked vol tc, single (s) tc, 2 stage (s) tf (s) p0 queue free % cm capacity (veh/h) Direction, Lane # EB 1 EB 2 WB 1 WB 2 NB 1 Volume Total Volume Left Volume Right csh Volume to Capacity Queue Length 95th (m) Control Delay (s) Lane LOS A C Approach Delay (s) Approach LOS C Intersection Summary Average Delay 1.1 Intersection Capacity Utilization 71.1% ICU Level of Service C Analysis Period (min) 15 SNC Lavalin Synchro 6 Report Page 36
114 HCM Unsignalized Intersection Capacity Analysis Weekdays PM - Future Total Traffic : Biehn Drive & Strasburg Road Base Case Movement WBL WBR NBT NBR SBL SBT Lane Configurations Sign Control Stop Free Free Grade 0% 0% 0% Volume (veh/h) Peak Hour Factor Hourly flow rate (vph) Pedestrians Lane Width (m) Walking Speed (m/s) Percent Blockage Right turn flare (veh) Median type TWLTL Median storage veh) 2 Upstream signal (m) px, platoon unblocked vc, conflicting volume vc1, stage 1 conf vol 914 vc2, stage 2 conf vol 901 vcu, unblocked vol tc, single (s) tc, 2 stage (s) 5.8 tf (s) p0 queue free % cm capacity (veh/h) Direction, Lane # WB 1 NB 1 NB 2 SB 1 SB 2 Volume Total Volume Left Volume Right csh Volume to Capacity Queue Length 95th (m) Control Delay (s) Lane LOS D A Approach Delay (s) Approach LOS D Intersection Summary Average Delay 3.0 Intersection Capacity Utilization 83.3% ICU Level of Service E Analysis Period (min) 15 SNC Lavalin Synchro 6 Report Page 37
115 Page 1 of /10/18 DETAILED OUTPUT Blair Creek Drive-N-Strasburg Road Base Case Blair Creek Drive-N-Strasburg Road Drive-Weekday AM 2018 OUTPUT TABLE LINKS s Basic Parameters Gap Acceptance Parameters Movements Movement Capacity Parameters Movement Performance Fuel Consumption, Emissions and Cost (Total) Fuel Consumption, Emissions and Cost (Rate) Intersection Negotiation Data Movement Speeds and Geometric Delay Lanes Lane Performance Lane Flow and Capacity Information Lane, Approach and Intersection Performance Driver Characteristics Lane Delays Lane Queues (Vehicles) Lane Queues (Distance) Lane Queue Percentiles (Vehicles) Lane Queue Percentiles (Distance) Lane Stops Flow Rates and Demand Analysis Movement Definitions and Flow Rates (O-D) Flow Rates (Separate Light and Heavy Vehicles) Flow Rates (Total Vehicles and Percent Heavy) Other Model Settings Parameters Used in Cost Calculations Diagnostics s Basic Parameters Site:Blair Creek Drive-N-Strasburg Road-Weekday AM Circulating/Exiting Stream Cent Circ Insc Ent Ent Cir Ent Av.Ent Island Width Diam. Rad Ang Lan Lan Lane Flow %HV Adjust. %Exit Cap. O-D Diam Width Flow Incl. Constr. Factor m m m m deg m veh/h pcu/h Effect Environment Factor: 1.20 Entry/Circulating Flow Adjustment: Medium N East: Blair Creek Drive Environment Factor: 1.20 Entry/Circulating Flow Adjustment: Medium N Environment Factor: 1.20 Entry/Circulating Flow Adjustment: Medium N 0.979
116 Page 2 of /10/ Capacity Model: SIDRA Standard HV Method for Gap Acceptance: Include HV Effect for all percentages Gap Acceptance Parameters Site:Blair Creek Drive-N-Strasburg Road-Weekday AM Turn Lane Lane ---- Circulating/Exiting Stream --- Critical Gap No. Type Flow Aver Aver In-Bnch Prop Foll-up Rate Speed Dist Headway Bunched Hdwy Dist Headway pcu/h km/h m sec sec m sec Environment Factor: 1.20 Entry/Circulating Flow Adjustment: Medium Thru 1 Subdominant D 2 Dominant Right 2 Dominant East: Blair Creek Drive Environment Factor: 1.20 Entry/Circulating Flow Adjustment: Medium Left 1 Subdominant Right 2 Dominant Environment Factor: 1.20 Entry/Circulating Flow Adjustment: Medium Left 1 Subdominant Thru 1 Subdominant Dominant Capacity Model: SIDRA Standard P Priority sharing is implied for some movements (Follow-up Headway plus Intra-bunch Headway is larger than the Critical Gap). The O-D Factor ( Basic Parameters table) allows for priority sharing and priority emphasis. D Subdominant lane follow-up headway was calculated as less than the dominant lane value and was set to the dominant lane value Dist (Distance): Spacing, i.e. distance between the front ends of two successive vehicles across all lanes in the circulating or exiting stream Movements Movement Capacity Parameters Site:Blair Creek Drive-N-Strasburg Road-Weekday AM Mov Opposing Movement Total Prac. Prac. Lane Deg. ID Demand Adjust. Cap. Deg. Spare Util Satn Flow HV Flow HV Flow Satn Cap. veh/h % veh/h % pcu/h veh/h xp % % x T T R R East: Blair Creek Drive 1L L R R L L * 4T T * * Maximum degree of saturation
117 Page 3 of /10/18 Movement Performance Site:Blair Creek Drive-N-Strasburg Road-Weekday AM Mov Total Total Aver. Eff. Total Perf. Tot.Trav. Tot.Trav. Aver. ID Delay Delay Delay Stop Stops Index Distance Time Speed (veh-h/h)(pers-h/h)(sec) Rate (veh-km/h)(veh-h/h) (km/h) T T R R East: Blair Creek Drive 1L L R R L L T T Fuel Consumption, Emissions and Cost (Total) Site:Blair Creek Drive-N-Strasburg Road-Weekday AM 2018 Mov Cost Fuel CO2 CO HC NOX ID Total Total Total Total Total Total $/h L/h kg/h kg/h kg/h kg/h 8T T R R East: Blair Creek Drive 1L L R R L L T T INTERSECTION: Fuel Consumption, Emissions and Cost (Rate) Site:Blair Creek Drive-N-Strasburg Road-Weekday AM 2018 Mov Cost Fuel CO2 CO HC NOX ID Rate Rate Rate Rate Rate Rate $/km L/100km g/km g/km g/km g/km 8T T R R
118 Page 4 of /10/ East: Blair Creek Drive 1L L R R L L T T INTERSECTION: Intersection Negotiation Data Site:Blair Creek Drive-N-Strasburg Road-Weekday AM Negn Negn Negn Appr. Downstream Distance From To Radius Speed Dist. Dist Approach Approach Turn m km/h m m m User Spec? East Right No North Thru No East: Blair Creek Drive South Left No North Right No South Thru No East Left No Maximum Negotiation (Design) Speed = 50.0 km/h Downstream distance is distance travelled from the stopline until exit cruise speed is reached (includes negotiation distance). Acceleration distance is weighted for light and heavy vehicles. The same distance applies for both stopped and unstopped vehicles. Movement Speeds and Geometric Delay Site:Blair Creek Drive-N-Strasburg Road-Weekday AM Queue Move-up App. Speeds Exit Speeds Av. Section Spd Geom Mov st 2nd Delay ID Cruise Negn Negn Cruise Grn Grn Running Overall sec T T R R East: Blair Creek Drive 1L L R R L L T T "Running Speed" is the average speed excluding stopped periods. HCM Delay Formula option used: Geometric Delay is not included in Control Delay.
119 Page 5 of /10/18 Lanes Lane Performance Site:Blair Creek Drive-N-Strasburg Road-Weekday AM 2018 Q u e u e Flow Cap Deg. Aver. Eff. 95% Back Lane Lane Satn Delay Stop Length No. veh/h veh/h x sec Rate veh m m 1 T TR East: Blair Creek Drive 1 L R T 1 LT T T Short lane due to specification of Turn Bay Lane Flow and Capacity Information Site:Blair Creek Drive-N-Strasburg Road-Weekday AM Lane Dem Flow (veh/h) Min Tot Deg. Lane No Cap Cap Satn Util Lef Thru Rig Tot veh/h veh/h x % T TR East: Blair Creek Drive 1 L R LT T The capacity value for priority and continuous movements is obtained by adjusting the basic saturation flow for heavy vehicle and turning vehicle effects. Saturation flow scale applies if specified. Lane, Approach and Intersection Performance Site:Blair Creek Drive-N-Strasburg Road-Weekday AM Lane Demand Flow (veh/h) Adj. Eff Grn Deg Aver. Longest Shrt No %HV Basic (sec) Sat Delay Queue Lane L T R Tot Satf. 1st 2nd x sec m m
120 Page 6 of /10/18 1 T TR East: Blair Creek Drive 1 L R LT T ========================================================================== ALL VEHICLES Total % Max Aver. Max Flow HV X Delay Queue ========================================================================== Peak flow period = 15 minutes. Queue values in this table are 95% queue (metres) Note: Basic Saturation Flows are not adjusted at roundabouts or signcontrolled intersections and apply only to continuous lanes. Driver Characteristics Site:Blair Creek Drive-N-Strasburg Road-Weekday AM Average Driver Lane Satn Satn Satn Satn Queue Response No. Speed Flow Hdwy Spacing Space Time km/h veh/h sec m m sec T TR East: Blair Creek Drive 1 L R NA - Short Lane LT T Saturation Flow and Saturation Headway are derived from follow-up headway. Lane Delays Site:Blair Creek Drive-N-Strasburg Road-Weekday AM Delay (seconds/veh) Deg. Stop-line Delay Acc. Queuing Stopd Lane Satn 1st 2nd Total Dec. Total MvUp (Idle) Geom Control No. x d1 d2 dsl dn dq dqm di dig dic T TR East: Blair Creek Drive 1 L R
121 Page 7 of /10/18 1 LT T HCM Delay Formula option used: (i) Control Delay does not include Geometric Delay, (ii) Stop-line Delay is treated as being same as Control Delay. dsl: Stop-line delay (=d1+d2) dn: Average stop-start delay for all vehicles queued and unqueued dq: Queuing delay (the part of the stop-line delay that includes stopped delay and queue move-up delay) dqm: Queue move-up delay di: Stopped delay (stopped (idling) time at near-zero speed) dig: Geometric delay dic: Intersection control delay (sum of stop-line and geometric delays) Lane Queues (Vehicles) Site:Blair Creek Drive-N-Strasburg Road-Weekday AM Deg. Ovrfl. Back of Queue (veh) Queue Prob. P'ile Cyc-Av. Queue Lane Satn Queue Stor. Block Block No. x No Nb1 Nb2 Nb 95% Ratio % % Nc 95% T TR East: Blair Creek Drive 1 L R LT T HCM Delay Formula option used: Cycle-Average Queue is calculated using average delay from the HCM equation. (i.e. HCM delays are treated as stop-line delays for this purpose). SIDRA Standard models are used for Back of Queue estimation since HCM only gives Cycle-Average Queues for unsignalised intersections. Lane Queues (Distance) Site:Blair Creek Drive-N-Strasburg Road-Weekday AM Deg. Ovrfl. Back of Queue (m) Queue Prob. P'ile Cyc-Av. Queue Lane Satn Queue Stor. Block Block No. x No Nb1 Nb2 Nb 95% Ratio % % Nc 95% T TR East: Blair Creek Drive 1 L R LT T HCM Delay Formula option used: Cycle-Average Queue is calculated using average delay from the HCM equation. (i.e. HCM delays are treated as stop-line delays for this purpose). SIDRA Standard models are used for Back of Queue estimation since
122 Page 8 of /10/18 HCM only gives Cycle-Average Queues for unsignalised intersections. Lane Queue Percentiles (Vehicles) Site:Blair Creek Drive-N-Strasburg Road-Weekday AM Deg. Percentile Back of Queue (veh) Lane Satn No. x 50% 70% 85% 90% 95% 98% T TR East: Blair Creek Drive 1 L R LT T SIDRA Standard models are used for Back of Queue estimation since HCM only gives Cycle-Average Queues for unsignalised intersections. Lane Queue Percentiles (Distance) Site:Blair Creek Drive-N-Strasburg Road-Weekday AM Deg. Percentile Back of Queue (metres) Lane Satn No. x 50% 70% 85% 90% 95% 98% T TR East: Blair Creek Drive 1 L R LT T SIDRA Standard models are used for Back of Queue estimation since HCM only gives Cycle-Average Queues for unsignalised intersections. Lane Stops Site:Blair Creek Drive-N-Strasburg Road-Weekday AM Queue Total Deg. -- Effective Stop Rate -- Total Move-up Queue Prop. Lane Satn Geom. Overall Stops Rate Move-ups Queued No. x he1 he2 hig h H hqm Hqm pq T TR
123 Page 9 of /10/ East: Blair Creek Drive 1 L R LT T hig is the average value for all movements in a shared lane hqm is average queue move-up rate for all vehicles queued and unqueued Flow Rates and Demand Analysis Movement Definitions and Flow Rates (O-D) Site:Blair Creek Drive-N-Strasburg Road-Weekday AM From To Mov Flow Rate Flow Scale Peak Flow Approach Approach ID Turn LV HV Fixed Var Factor East 8R Right North 8T Thru East: Blair Creek Drive South 1L Left North 6R Right South 4T Thru East 7L Left Unit Time for Volumes = 60 minutes Peak Flow Period = 15 minutes Flow Rates include effects of Flow Scale and Peak Flow Factor Flow Rates (Separate Light and Heavy Vehicles) Site:Blair Creek Drive-N-Strasburg Road-Weekday AM 2018 Mov Left Through Right ID LV HV LV HV LV HV Demand flows in veh/h as used by the program 8T T R R East: Blair Creek Drive 1L L R R L L T T Unit Time for Volumes = 60 minutes Peak Flow Period = 15 minutes Flow Rates include effects of Flow Scale and Peak Flow Factor
124 Page 10 of /10/18 Flow Rates (Total Vehicles and Percent Heavy) Site:Blair Creek Drive-N-Strasburg Road-Weekday AM Mov Left Through Right ID Total %HV Total %HV Total %HV --- Demand flows in veh/h as used by the program 8T T R R East: Blair Creek Drive 1L L R R L L T T Unit Time for Volumes = 60 minutes Peak Flow Period = 15 minutes Flow Rates include effects of Flow Scale and Peak Flow Factor Other Model Settings Site:Blair Creek Drive-N-Strasburg Road-Weekday AM 2018 * Basic Parameters: Intersection Type: Driving on the right-hand side of the road Input data specified in Metric units Model Defaults: US HCM (Metric) Peak Flow Period (for performance): 15 minutes Unit time (for volumes): 60 minutes. HCM Delay Model option used HCM Queue Model option used Level of Service based on: Delay (HCM 2000) Queue percentile: 95% Parameters Used in Cost Calculations Site:Blair Creek Drive-N-Strasburg Road-Weekday AM 2018 Pump price of fuel ($/L) = Fuel resource cost factor = 0.70 Ratio of running cost to fuel cost = 3.0 Average income ($/h) = Time value factor = 0.40 Light vehicle mass (1000 kg) = 1.4 Heavy vehicle mass (1000 kg) = 11.0 Light vehicle idle fuel rate (L/h) = Heavy vehicle idle fuel rate (L/h) = Diagnostics
125 Page 11 of /10/18 Site:Blair Creek Drive-N-Strasburg Road-Weekday AM 2018 Processed: October 18, :13:35 AM Copyright Akcelik and Associates Pty Ltd SIDRA INTERSECTION Project: H:\DATA\ Transportation Planning\Working\Strasburg Road\SIDRA Files\PC\East-West Connector and Strasburg Road BASE.sip , SNC-LAVALIN INC, SINGLE
126 Page 1 of /10/18 DETAILED OUTPUT Blair Creek Drive-N-Strasburg Road Base Case Blair Creek Drive-N-Robert Ferrie Drive-Weekday PM 2018 OUTPUT TABLE LINKS s Basic Parameters Gap Acceptance Parameters Movements Movement Capacity Parameters Movement Performance Fuel Consumption, Emissions and Cost (Total) Fuel Consumption, Emissions and Cost (Rate) Intersection Negotiation Data Movement Speeds and Geometric Delay Lanes Lane Performance Lane Flow and Capacity Information Lane, Approach and Intersection Performance Driver Characteristics Lane Delays Lane Queues (Vehicles) Lane Queues (Distance) Lane Queue Percentiles (Vehicles) Lane Queue Percentiles (Distance) Lane Stops Flow Rates and Demand Analysis Movement Definitions and Flow Rates (O-D) Flow Rates (Separate Light and Heavy Vehicles) Flow Rates (Total Vehicles and Percent Heavy) Other Model Settings Parameters Used in Cost Calculations Diagnostics s Basic Parameters Site:Blair Creek Drive-N-Strasburg Road-Weekday PM Circulating/Exiting Stream Cent Circ Insc Ent Ent Cir Ent Av.Ent Island Width Diam. Rad Ang Lan Lan Lane Flow %HV Adjust. %Exit Cap. O-D Diam Width Flow Incl. Constr. Factor m m m m deg m veh/h pcu/h Effect Environment Factor: 1.20 Entry/Circulating Flow Adjustment: Medium N East: Blair Creek Drive Environment Factor: 1.20 Entry/Circulating Flow Adjustment: Medium N Environment Factor: 1.20 Entry/Circulating Flow Adjustment: Medium N 0.978
127 Page 2 of /10/ Capacity Model: SIDRA Standard HV Method for Gap Acceptance: Include HV Effect for all percentages Gap Acceptance Parameters Site:Blair Creek Drive-N-Strasburg Road-Weekday PM Turn Lane Lane ---- Circulating/Exiting Stream --- Critical Gap No. Type Flow Aver Aver In-Bnch Prop Foll-up Rate Speed Dist Headway Bunched Hdwy Dist Headway pcu/h km/h m sec sec m sec Environment Factor: 1.20 Entry/Circulating Flow Adjustment: Medium Thru 1 Subdominant D 2 Dominant Right 2 Dominant East: Blair Creek Drive Environment Factor: 1.20 Entry/Circulating Flow Adjustment: Medium Left 1 Subdominant Right 2 Dominant Environment Factor: 1.20 Entry/Circulating Flow Adjustment: Medium Left 1 Subdominant Thru 1 Subdominant Dominant Capacity Model: SIDRA Standard P Priority sharing is implied for some movements (Follow-up Headway plus Intra-bunch Headway is larger than the Critical Gap). The O-D Factor ( Basic Parameters table) allows for priority sharing and priority emphasis. D Subdominant lane follow-up headway was calculated as less than the dominant lane value and was set to the dominant lane value Dist (Distance): Spacing, i.e. distance between the front ends of two successive vehicles across all lanes in the circulating or exiting stream Movements Movement Capacity Parameters Site:Blair Creek Drive-N-Strasburg Road-Weekday PM Mov Opposing Movement Total Prac. Prac. Lane Deg. ID Demand Adjust. Cap. Deg. Spare Util Satn Flow HV Flow HV Flow Satn Cap. veh/h % veh/h % pcu/h veh/h xp % % x T T * 8R R * East: Blair Creek Drive 1L L R R L L T T * Maximum degree of saturation
128 Page 3 of /10/18 Movement Performance Site:Blair Creek Drive-N-Strasburg Road-Weekday PM Mov Total Total Aver. Eff. Total Perf. Tot.Trav. Tot.Trav. Aver. ID Delay Delay Delay Stop Stops Index Distance Time Speed (veh-h/h)(pers-h/h)(sec) Rate (veh-km/h)(veh-h/h) (km/h) T T R R East: Blair Creek Drive 1L L R R L L T T Fuel Consumption, Emissions and Cost (Total) Site:Blair Creek Drive-N-Strasburg Road-Weekday PM 2018 Mov Cost Fuel CO2 CO HC NOX ID Total Total Total Total Total Total $/h L/h kg/h kg/h kg/h kg/h 8T T R R East: Blair Creek Drive 1L L R R L L T T INTERSECTION: Fuel Consumption, Emissions and Cost (Rate) Site:Blair Creek Drive-N-Strasburg Road-Weekday PM 2018 Mov Cost Fuel CO2 CO HC NOX ID Rate Rate Rate Rate Rate Rate $/km L/100km g/km g/km g/km g/km 8T T R R
129 Page 4 of /10/ East: Blair Creek Drive 1L L R R L L T T INTERSECTION: Intersection Negotiation Data Site:Blair Creek Drive-N-Strasburg Road-Weekday PM Negn Negn Negn Appr. Downstream Distance From To Radius Speed Dist. Dist Approach Approach Turn m km/h m m m User Spec? East Right No North Thru No East: Blair Creek Drive South Left No North Right No South Thru No East Left No Maximum Negotiation (Design) Speed = 50.0 km/h Downstream distance is distance travelled from the stopline until exit cruise speed is reached (includes negotiation distance). Acceleration distance is weighted for light and heavy vehicles. The same distance applies for both stopped and unstopped vehicles. Movement Speeds and Geometric Delay Site:Blair Creek Drive-N-Strasburg Road-Weekday PM Queue Move-up App. Speeds Exit Speeds Av. Section Spd Geom Mov st 2nd Delay ID Cruise Negn Negn Cruise Grn Grn Running Overall sec T T R R East: Blair Creek Drive 1L L R R L L T T "Running Speed" is the average speed excluding stopped periods. HCM Delay Formula option used: Geometric Delay is not included in Control Delay.
130 Page 5 of /10/18 Lanes Lane Performance Site:Blair Creek Drive-N-Strasburg Road-Weekday PM 2018 Q u e u e Flow Cap Deg. Aver. Eff. 95% Back Lane Lane Satn Delay Stop Length No. veh/h veh/h x sec Rate veh m m 1 T TR East: Blair Creek Drive 1 L R T 1 LT T T Short lane due to specification of Turn Bay Lane Flow and Capacity Information Site:Blair Creek Drive-N-Strasburg Road-Weekday PM Lane Dem Flow (veh/h) Min Tot Deg. Lane No Cap Cap Satn Util Lef Thru Rig Tot veh/h veh/h x % T TR East: Blair Creek Drive 1 L R LT T The capacity value for priority and continuous movements is obtained by adjusting the basic saturation flow for heavy vehicle and turning vehicle effects. Saturation flow scale applies if specified. Lane, Approach and Intersection Performance Site:Blair Creek Drive-N-Strasburg Road-Weekday PM Lane Demand Flow (veh/h) Adj. Eff Grn Deg Aver. Longest Shrt No %HV Basic (sec) Sat Delay Queue Lane L T R Tot Satf. 1st 2nd x sec m m
131 Page 6 of /10/18 1 T TR East: Blair Creek Drive 1 L R LT T ========================================================================== ALL VEHICLES Total % Max Aver. Max Flow HV X Delay Queue ========================================================================== Peak flow period = 15 minutes. Queue values in this table are 95% queue (metres) Note: Basic Saturation Flows are not adjusted at roundabouts or signcontrolled intersections and apply only to continuous lanes. Driver Characteristics Site:Blair Creek Drive-N-Strasburg Road-Weekday PM Average Driver Lane Satn Satn Satn Satn Queue Response No. Speed Flow Hdwy Spacing Space Time km/h veh/h sec m m sec T TR East: Blair Creek Drive 1 L R NA - Short Lane LT T Saturation Flow and Saturation Headway are derived from follow-up headway. Lane Delays Site:Blair Creek Drive-N-Strasburg Road-Weekday PM Delay (seconds/veh) Deg. Stop-line Delay Acc. Queuing Stopd Lane Satn 1st 2nd Total Dec. Total MvUp (Idle) Geom Control No. x d1 d2 dsl dn dq dqm di dig dic T TR East: Blair Creek Drive 1 L R
132 Page 7 of /10/18 1 LT T HCM Delay Formula option used: (i) Control Delay does not include Geometric Delay, (ii) Stop-line Delay is treated as being same as Control Delay. dsl: Stop-line delay (=d1+d2) dn: Average stop-start delay for all vehicles queued and unqueued dq: Queuing delay (the part of the stop-line delay that includes stopped delay and queue move-up delay) dqm: Queue move-up delay di: Stopped delay (stopped (idling) time at near-zero speed) dig: Geometric delay dic: Intersection control delay (sum of stop-line and geometric delays) Lane Queues (Vehicles) Site:Blair Creek Drive-N-Strasburg Road-Weekday PM Deg. Ovrfl. Back of Queue (veh) Queue Prob. P'ile Cyc-Av. Queue Lane Satn Queue Stor. Block Block No. x No Nb1 Nb2 Nb 95% Ratio % % Nc 95% T TR East: Blair Creek Drive 1 L R LT T HCM Delay Formula option used: Cycle-Average Queue is calculated using average delay from the HCM equation. (i.e. HCM delays are treated as stop-line delays for this purpose). SIDRA Standard models are used for Back of Queue estimation since HCM only gives Cycle-Average Queues for unsignalised intersections. Lane Queues (Distance) Site:Blair Creek Drive-N-Strasburg Road-Weekday PM Deg. Ovrfl. Back of Queue (m) Queue Prob. P'ile Cyc-Av. Queue Lane Satn Queue Stor. Block Block No. x No Nb1 Nb2 Nb 95% Ratio % % Nc 95% T TR East: Blair Creek Drive 1 L R LT T HCM Delay Formula option used: Cycle-Average Queue is calculated using average delay from the HCM equation. (i.e. HCM delays are treated as stop-line delays for this purpose). SIDRA Standard models are used for Back of Queue estimation since
133 Page 8 of /10/18 HCM only gives Cycle-Average Queues for unsignalised intersections. Lane Queue Percentiles (Vehicles) Site:Blair Creek Drive-N-Strasburg Road-Weekday PM Deg. Percentile Back of Queue (veh) Lane Satn No. x 50% 70% 85% 90% 95% 98% T TR East: Blair Creek Drive 1 L R LT T SIDRA Standard models are used for Back of Queue estimation since HCM only gives Cycle-Average Queues for unsignalised intersections. Lane Queue Percentiles (Distance) Site:Blair Creek Drive-N-Strasburg Road-Weekday PM Deg. Percentile Back of Queue (metres) Lane Satn No. x 50% 70% 85% 90% 95% 98% T TR East: Blair Creek Drive 1 L R LT T SIDRA Standard models are used for Back of Queue estimation since HCM only gives Cycle-Average Queues for unsignalised intersections. Lane Stops Site:Blair Creek Drive-N-Strasburg Road-Weekday PM Queue Total Deg. -- Effective Stop Rate -- Total Move-up Queue Prop. Lane Satn Geom. Overall Stops Rate Move-ups Queued No. x he1 he2 hig h H hqm Hqm pq T TR
134 Page 9 of /10/ East: Blair Creek Drive 1 L R LT T hig is the average value for all movements in a shared lane hqm is average queue move-up rate for all vehicles queued and unqueued Flow Rates and Demand Analysis Movement Definitions and Flow Rates (O-D) Site:Blair Creek Drive-N-Strasburg Road-Weekday PM From To Mov Flow Rate Flow Scale Peak Flow Approach Approach ID Turn LV HV Fixed Var Factor East 8R Right North 8T Thru East: Blair Creek Drive South 1L Left North 6R Right South 4T Thru East 7L Left Unit Time for Volumes = 60 minutes Peak Flow Period = 15 minutes Flow Rates include effects of Flow Scale and Peak Flow Factor Flow Rates (Separate Light and Heavy Vehicles) Site:Blair Creek Drive-N-Strasburg Road-Weekday PM 2018 Mov Left Through Right ID LV HV LV HV LV HV Demand flows in veh/h as used by the program 8T T R R East: Blair Creek Drive 1L L R R L L T T Unit Time for Volumes = 60 minutes Peak Flow Period = 15 minutes Flow Rates include effects of Flow Scale and Peak Flow Factor
135 Page 10 of /10/18 Flow Rates (Total Vehicles and Percent Heavy) Site:Blair Creek Drive-N-Strasburg Road-Weekday PM Mov Left Through Right ID Total %HV Total %HV Total %HV --- Demand flows in veh/h as used by the program 8T T R R East: Blair Creek Drive 1L L R R L L T T Unit Time for Volumes = 60 minutes Peak Flow Period = 15 minutes Flow Rates include effects of Flow Scale and Peak Flow Factor Other Model Settings Site:Blair Creek Drive-N-Strasburg Road-Weekday PM 2018 * Basic Parameters: Intersection Type: Driving on the right-hand side of the road Input data specified in Metric units Model Defaults: US HCM (Metric) Peak Flow Period (for performance): 15 minutes Unit time (for volumes): 60 minutes. HCM Delay Model option used HCM Queue Model option used Level of Service based on: Delay (HCM 2000) Queue percentile: 95% Parameters Used in Cost Calculations Site:Blair Creek Drive-N-Strasburg Road-Weekday PM 2018 Pump price of fuel ($/L) = Fuel resource cost factor = 0.70 Ratio of running cost to fuel cost = 3.0 Average income ($/h) = Time value factor = 0.40 Light vehicle mass (1000 kg) = 1.4 Heavy vehicle mass (1000 kg) = 11.0 Light vehicle idle fuel rate (L/h) = Heavy vehicle idle fuel rate (L/h) = Diagnostics
136 Page 11 of /10/18 Site:Blair Creek Drive-N-Strasburg Road-Weekday PM 2018 Processed: October 18, :14:07 AM Copyright Akcelik and Associates Pty Ltd SIDRA INTERSECTION Project: H:\DATA\ Transportation Planning\Working\Strasburg Road\SIDRA Files\PC\East-West Connector and Strasburg Road BASE.sip , SNC-LAVALIN INC, SINGLE
137 DETAILED OUTPUT FH-n-HR Weekday AM 2018 Huron Road and Fischer Hallman Road Page 1 of 12 OUTPUT TABLE LINKS s Basic Parameters Gap Acceptance Parameters Movements Movement Capacity Parameters Movement Performance Fuel Consumption, Emissions and Cost (Total) Fuel Consumption, Emissions and Cost (Rate) Intersection Negotiation Data Movement Speeds and Geometric Delay Lanes Lane Performance Lane Flow and Capacity Information Lane, Approach and Intersection Performance Driver Characteristics Lane Delays Lane Queues (Vehicles) Lane Queues (Distance) Lane Queue Percentiles (Vehicles) Lane Queue Percentiles (Distance) Lane Stops Flow Rates and Demand Analysis Movement Definitions and Flow Rates (O-D) Flow Rates (Separate Light and Heavy Vehicles) Flow Rates (Total Vehicles and Percent Heavy) Other Model Settings Parameters Used in Cost Calculations Diagnostics s Basic Parameters Site:FH-n-HR Weekday AM Circulating/Exiting Stream Cent Circ Insc Ent Ent Cir Ent Av.Ent Island Width Diam. Rad Ang Lan Lan Lane Flow %HV Adjust. %Exit Cap. O-D Diam Width Flow Incl. Constr. Factor m m m m deg m veh/h pcu/h Effect South: Fischer Hallman Road Environment Factor: 1.20 Entry/Circulating Flow Adjustment: Medium N East: Huron Road Environment Factor: 1.10 Entry/Circulating Flow Adjustment: High N Exclusive Slip lane (exiting flow): N North: Fischer Hallman Road Environment Factor: 1.20 Entry/Circulating Flow Adjustment: Medium N Exclusive Slip lane (exiting flow): N West: Huron Road Environment Factor: 1.20 Entry/Circulating Flow Adjustment: Medium 2011/09/29
138 N Capacity Model: SIDRA Standard HV Method for Gap Acceptance: Include HV Effect for all percentages Page 2 of 12 Gap Acceptance Parameters Site:FH-n-HR Weekday AM Turn Lane Lane ---- Circulating/Exiting Stream --- Critical Gap No. Type Flow Aver Aver In-Bnch Prop Foll-up Rate Speed Dist Headway Bunched Hdwy Dist Headway pcu/h km/h m sec sec m sec South: Fischer Hallman Road Environment Factor: 1.20 Entry/Circulating Flow Adjustment: Medium Left 1 Subdominant Thru 1 Subdominant Dominant Right 3 Subdominant East: Huron Road Environment Factor: 1.10 Entry/Circulating Flow Adjustment: High Left 1 Subdominant Thru 1 Subdominant Subdominant Right 3 Excl. Slip 780E North: Fischer Hallman Road Environment Factor: 1.20 Entry/Circulating Flow Adjustment: Medium Left 1 Subdominant Thru 1 Subdominant Dominant Right 3 Excl. Slip 724E West: Huron Road Environment Factor: 1.20 Entry/Circulating Flow Adjustment: Medium Left 1 Dominant Thru 1 Dominant Subdominant Right 2 Subdominant Capacity Model: SIDRA Standard P Priority sharing is implied for some movements (Follow-up Headway plus Intra-bunch Headway is larger than the Critical Gap). The O-D Factor ( Basic Parameters table) allows for priority sharing and priority emphasis. E Exiting flow for slip lane traffic Dist (Distance): Spacing, i.e. distance between the front ends of two successive vehicles across all lanes in the circulating or exiting stream Movements Movement Capacity Parameters Site:FH-n-HR Weekday AM Mov Opposing Movement Total Prac. Prac. Lane Deg. ID Demand Adjust. Cap. Deg. Spare Util Satn Flow HV Flow HV Flow Satn Cap. veh/h % veh/h % pcu/h veh/h xp % % x South: Fischer Hallman Road 3L L T T R R East: Huron Road 2011/09/29
139 1L L T T R R North: Fischer Hallman Road 7L L T T R R West: Huron Road 5L L * 2T T * 2R R * * Maximum degree of saturation Page 3 of 12 Movement Performance Site:FH-n-HR Weekday AM Mov Total Total Aver. Eff. Total Perf. Tot.Trav. Tot.Trav. Aver. ID Delay Delay Delay Stop Stops Index Distance Time Speed (veh-h/h)(pers-h/h)(sec) Rate (veh-km/h)(veh-h/h) (km/h) South: Fischer Hallman Road 3L L T T R R East: Huron Road 1L L T T R R North: Fischer Hallman Road 7L L T T R R West: Huron Road 5L L T T R R Fuel Consumption, Emissions and Cost (Total) Site:FH-n-HR Weekday AM 2018 Mov Cost Fuel CO2 CO HC NOX ID Total Total Total Total Total Total $/h L/h kg/h kg/h kg/h kg/h South: Fischer Hallman Road 3L L T T R R East: Huron Road 1L L T T R R North: Fischer Hallman Road 7L L T T R R /09/29
140 West: Huron Road 5L L T T R R INTERSECTION: Page 4 of 12 Fuel Consumption, Emissions and Cost (Rate) Site:FH-n-HR Weekday AM 2018 Mov Cost Fuel CO2 CO HC NOX ID Rate Rate Rate Rate Rate Rate $/km L/100km g/km g/km g/km g/km South: Fischer Hallman Road 3L L T T R R East: Huron Road 1L L T T R R North: Fischer Hallman Road 7L L T T R R West: Huron Road 5L L T T R R INTERSECTION: Intersection Negotiation Data Site:FH-n-HR Weekday AM Negn Negn Negn Appr. Downstream Distance From To Radius Speed Dist. Dist Approach Approach Turn m km/h m m m User Spec? South: Fischer Hallman Road East Right No North Thru No West Left No East: Huron Road South Left No North Right No West Thru No North: Fischer Hallman Road 2011/09/29
141 South Thru No East Left No West Right No West: Huron Road South Right No East Thru No North Left No Page 5 of 12 Maximum Negotiation (Design) Speed = 50.0 km/h Downstream distance is distance travelled from the stopline until exit cruise speed is reached (includes negotiation distance). Acceleration distance is weighted for light and heavy vehicles. The same distance applies for both stopped and unstopped vehicles. Movement Speeds and Geometric Delay Site:FH-n-HR Weekday AM Queue Move-up App. Speeds Exit Speeds Av. Section Spd Geom Mov st 2nd Delay ID Cruise Negn Negn Cruise Grn Grn Running Overall sec South: Fischer Hallman Road 3L L T T R R East: Huron Road 1L L T T R R North: Fischer Hallman Road 7L L T T R R West: Huron Road 5L L T T R R "Running Speed" is the average speed excluding stopped periods. HCM Delay Formula option used: Geometric Delay is not included in Control Delay. Lanes Lane Performance Site:FH-n-HR Weekday AM 2018 Q u e u e Flow Cap Deg. Aver. Eff. 95% Back Lane Lane Satn Delay Stop Length No. veh/h veh/h x sec Rate veh m m South: Fischer Hallman Road 1 LT T R T East: Huron Road 1 LT T R T 2011/09/29
142 North: Fischer Hallman Road 1 LT T R T West: Huron Road 1 LT TR T Short lane due to specification of Turn Bay Page 6 of 12 Lane Flow and Capacity Information Site:FH-n-HR Weekday AM Lane Dem Flow (veh/h) Min Tot Deg. Lane No Cap Cap Satn Util Lef Thru Rig Tot veh/h veh/h x % South: Fischer Hallman Road 1 LT T R East: Huron Road 1 LT T R North: Fischer Hallman Road 1 LT T R West: Huron Road 1 LT TR The capacity value for priority and continuous movements is obtained by adjusting the basic saturation flow for heavy vehicle and turning vehicle effects. Saturation flow scale applies if specified. Lane, Approach and Intersection Performance Site:FH-n-HR Weekday AM Lane Demand Flow (veh/h) Adj. Eff Grn Deg Aver. Longest Shrt No %HV Basic (sec) Sat Delay Queue Lane L T R Tot Satf. 1st 2nd x sec m m South: Fischer Hallman Road 1 LT T R East: Huron Road 1 LT T R North: Fischer Hallman Road 1 LT T R /09/29
143 West: Huron Road 1 LT TR ========================================================================== ALL VEHICLES Total % Max Aver. Max Flow HV X Delay Queue ========================================================================== Peak flow period = 15 minutes. Page 7 of 12 Queue values in this table are 95% queue (metres) Note: Basic Saturation Flows are not adjusted at roundabouts or signcontrolled intersections and apply only to continuous lanes. Driver Characteristics Site:FH-n-HR Weekday AM Average Driver Lane Satn Satn Satn Satn Queue Response No. Speed Flow Hdwy Spacing Space Time km/h veh/h sec m m sec South: Fischer Hallman Road 1 LT T R NA - Short Lane East: Huron Road 1 LT T R NA - Short Lane North: Fischer Hallman Road 1 LT T R NA - Short Lane West: Huron Road 1 LT TR Saturation Flow and Saturation Headway are derived from follow-up headway. Lane Delays Site:FH-n-HR Weekday AM Delay (seconds/veh) Deg. Stop-line Delay Acc. Queuing Stopd Lane Satn 1st 2nd Total Dec. Total MvUp (Idle) Geom Control No. x d1 d2 dsl dn dq dqm di dig dic South: Fischer Hallman Road 1 LT T R East: Huron Road 1 LT T R North: Fischer Hallman Road 1 LT T /09/29
144 3 R West: Huron Road 1 LT TR HCM Delay Formula option used: (i) Control Delay does not include Geometric Delay, (ii) Stop-line Delay is treated as being same as Control Delay. dsl: Stop-line delay (=d1+d2) dn: Average stop-start delay for all vehicles queued and unqueued dq: Queuing delay (the part of the stop-line delay that includes stopped delay and queue move-up delay) dqm: Queue move-up delay di: Stopped delay (stopped (idling) time at near-zero speed) dig: Geometric delay dic: Intersection control delay (sum of stop-line and geometric delays) Page 8 of 12 Lane Queues (Vehicles) Site:FH-n-HR Weekday AM Deg. Ovrfl. Back of Queue (veh) Queue Prob. P'ile Cyc-Av. Queue Lane Satn Queue Stor. Block Block No. x No Nb1 Nb2 Nb 95% Ratio % % Nc 95% South: Fischer Hallman Road 1 LT T R East: Huron Road 1 LT T R North: Fischer Hallman Road 1 LT T R West: Huron Road 1 LT TR HCM Delay Formula option used: Cycle-Average Queue is calculated using average delay from the HCM equation. (i.e. HCM delays are treated as stop-line delays for this purpose). SIDRA Standard models are used for Back of Queue estimation since HCM only gives Cycle-Average Queues for unsignalised intersections. Lane Queues (Distance) Site:FH-n-HR Weekday AM Deg. Ovrfl. Back of Queue (m) Queue Prob. P'ile Cyc-Av. Queue Lane Satn Queue Stor. Block Block No. x No Nb1 Nb2 Nb 95% Ratio % % Nc 95% South: Fischer Hallman Road 1 LT T R East: Huron Road 1 LT T R North: Fischer Hallman Road 2011/09/29
145 1 LT T R West: Huron Road 1 LT TR Page 9 of 12 HCM Delay Formula option used: Cycle-Average Queue is calculated using average delay from the HCM equation. (i.e. HCM delays are treated as stop-line delays for this purpose). SIDRA Standard models are used for Back of Queue estimation since HCM only gives Cycle-Average Queues for unsignalised intersections. Lane Queue Percentiles (Vehicles) Site:FH-n-HR Weekday AM Deg. Percentile Back of Queue (veh) Lane Satn No. x 50% 70% 85% 90% 95% 98% South: Fischer Hallman Road 1 LT T R East: Huron Road 1 LT T R North: Fischer Hallman Road 1 LT T R West: Huron Road 1 LT TR SIDRA Standard models are used for Back of Queue estimation since HCM only gives Cycle-Average Queues for unsignalised intersections. Lane Queue Percentiles (Distance) Site:FH-n-HR Weekday AM Deg. Percentile Back of Queue (metres) Lane Satn No. x 50% 70% 85% 90% 95% 98% South: Fischer Hallman Road 1 LT T R East: Huron Road 1 LT T R North: Fischer Hallman Road 1 LT T R West: Huron Road 1 LT /09/29
146 2 TR Page 10 of 12 SIDRA Standard models are used for Back of Queue estimation since HCM only gives Cycle-Average Queues for unsignalised intersections. Lane Stops Site:FH-n-HR Weekday AM Queue Total Deg. -- Effective Stop Rate -- Total Move-up Queue Prop. Lane Satn Geom. Overall Stops Rate Move-ups Queued No. x he1 he2 hig h H hqm Hqm pq South: Fischer Hallman Road 1 LT T R East: Huron Road 1 LT T R North: Fischer Hallman Road 1 LT T R West: Huron Road 1 LT TR hig is the average value for all movements in a shared lane hqm is average queue move-up rate for all vehicles queued and unqueued Flow Rates and Demand Analysis Movement Definitions and Flow Rates (O-D) Site:FH-n-HR Weekday AM From To Mov Flow Rate Flow Scale Peak Flow Approach Approach ID Turn LV HV Fixed Var Factor South: Fischer Hallman Road East 8R Right North 8T Thru West 3L Left East: Huron Road South 1L Left North 6R Right West 6T Thru North: Fischer Hallman Road South 4T Thru East 7L Left West 4R Right West: Huron Road South 2R Right East 2T Thru North 5L Left Unit Time for Volumes = 60 minutes Peak Flow Period = 15 minutes Flow Rates include effects of Flow Scale and Peak Flow Factor 2011/09/29
147 Page 11 of 12 Flow Rates (Separate Light and Heavy Vehicles) Site:FH-n-HR Weekday AM 2018 Mov Left Through Right ID LV HV LV HV LV HV Demand flows in veh/h as used by the program South: Fischer Hallman Road 3L L T T R R East: Huron Road 1L L T T R R North: Fischer Hallman Road 7L L T T R R West: Huron Road 5L L T T R R Unit Time for Volumes = 60 minutes Peak Flow Period = 15 minutes Flow Rates include effects of Flow Scale and Peak Flow Factor Flow Rates (Total Vehicles and Percent Heavy) Site:FH-n-HR Weekday AM Mov Left Through Right ID Total %HV Total %HV Total %HV --- Demand flows in veh/h as used by the program South: Fischer Hallman Road 3L L T T R R East: Huron Road 1L L T T R R North: Fischer Hallman Road 7L L T T R R West: Huron Road 5L L T T R R Unit Time for Volumes = 60 minutes Peak Flow Period = 15 minutes Flow Rates include effects of Flow Scale and Peak Flow Factor 2011/09/29
148 Page 12 of 12 Other Model Settings Site:FH-n-HR Weekday AM 2018 * Basic Parameters: Intersection Type: Driving on the right-hand side of the road Input data specified in Metric units Model Defaults: US HCM (Metric) Peak Flow Period (for performance): 15 minutes Unit time (for volumes): 60 minutes. HCM Delay Model option used HCM Queue Model option used Level of Service based on: Delay (HCM 2000) Queue percentile: 95% Parameters Used in Cost Calculations Site:FH-n-HR Weekday AM 2018 Pump price of fuel ($/L) = Fuel resource cost factor = 0.70 Ratio of running cost to fuel cost = 3.0 Average income ($/h) = Time value factor = 0.40 Light vehicle mass (1000 kg) = 1.4 Heavy vehicle mass (1000 kg) = 11.0 Light vehicle idle fuel rate (L/h) = Heavy vehicle idle fuel rate (L/h) = Diagnostics Site:FH-n-HR Weekday AM 2018 Processed: September 28, :28:48 PM SIDRA INTERSECTION Copyright Akcelik and Associates Pty Ltd Project: H:\DATA\ Transportation Planning\Working\Strasburg Road\SIDRA Files\PC\Fischer Hallman and Huron-Future BASE.sip , SNC-LAVALIN INC, SINGLE 2011/09/29
149 Page 1 of 12 DETAILED OUTPUT FH-n-HR Weekday PM 2018 Huron Road and Fischer Hallman Road OUTPUT TABLE LINKS s Basic Parameters Gap Acceptance Parameters Movements Movement Capacity Parameters Movement Performance Fuel Consumption, Emissions and Cost (Total) Fuel Consumption, Emissions and Cost (Rate) Intersection Negotiation Data Movement Speeds and Geometric Delay Lanes Lane Performance Lane Flow and Capacity Information Lane, Approach and Intersection Performance Driver Characteristics Lane Delays Lane Queues (Vehicles) Lane Queues (Distance) Lane Queue Percentiles (Vehicles) Lane Queue Percentiles (Distance) Lane Stops Flow Rates and Demand Analysis Movement Definitions and Flow Rates (O-D) Flow Rates (Separate Light and Heavy Vehicles) Flow Rates (Total Vehicles and Percent Heavy) Other Model Settings Parameters Used in Cost Calculations Diagnostics s Basic Parameters Site:FH-n-HR Weekday PM Circulating/Exiting Stream Cent Circ Insc Ent Ent Cir Ent Av.Ent Island Width Diam. Rad Ang Lan Lan Lane Flow %HV Adjust. %Exit Cap. O-D Diam Width Flow Incl. Constr. Factor m m m m deg m veh/h pcu/h Effect South: Fischer Hallman Road Environment Factor: 1.20 Entry/Circulating Flow Adjustment: Medium N East: Huron Road Environment Factor: 1.10 Entry/Circulating Flow Adjustment: High N Exclusive Slip lane (exiting flow): N North: Fischer Hallman Road Environment Factor: 1.20 Entry/Circulating Flow Adjustment: Medium N Exclusive Slip lane (exiting flow): N West: Huron Road 2011/09/29
150 Environment Factor: 1.20 Entry/Circulating Flow Adjustment: Medium N Capacity Model: SIDRA Standard HV Method for Gap Acceptance: Include HV Effect for all percentages Page 2 of 12 Gap Acceptance Parameters Site:FH-n-HR Weekday PM Turn Lane Lane ---- Circulating/Exiting Stream --- Critical Gap No. Type Flow Aver Aver In-Bnch Prop Foll-up Rate Speed Dist Headway Bunched Hdwy Dist Headway pcu/h km/h m sec sec m sec South: Fischer Hallman Road Environment Factor: 1.20 Entry/Circulating Flow Adjustment: Medium Left 1 Subdominant Thru 1 Subdominant Dominant Right 3 Subdominant East: Huron Road Environment Factor: 1.10 Entry/Circulating Flow Adjustment: High Left 1 Subdominant Thru 1 Subdominant Dominant Right 3 Excl. Slip 647E North: Fischer Hallman Road Environment Factor: 1.20 Entry/Circulating Flow Adjustment: Medium Left 1 Subdominant Thru 1 Subdominant Dominant Right 3 Excl. Slip 830E West: Huron Road Environment Factor: 1.20 Entry/Circulating Flow Adjustment: Medium Left 1 Dominant Thru 1 Dominant Subdominant Right 2 Subdominant Capacity Model: SIDRA Standard P Priority sharing is implied for some movements (Follow-up Headway plus Intra-bunch Headway is larger than the Critical Gap). The O-D Factor ( Basic Parameters table) allows for priority sharing and priority emphasis. E Exiting flow for slip lane traffic Dist (Distance): Spacing, i.e. distance between the front ends of two successive vehicles across all lanes in the circulating or exiting stream Movements Movement Capacity Parameters Site:FH-n-HR Weekday PM Mov Opposing Movement Total Prac. Prac. Lane Deg. ID Demand Adjust. Cap. Deg. Spare Util Satn Flow HV Flow HV Flow Satn Cap. veh/h % veh/h % pcu/h veh/h xp % % x South: Fischer Hallman Road 3L L T T R R /09/29
151 East: Huron Road 1L L T T R R North: Fischer Hallman Road 7L L T T R R West: Huron Road 5L L * 2T T * 2R R * * Maximum degree of saturation Page 3 of 12 Movement Performance Site:FH-n-HR Weekday PM Mov Total Total Aver. Eff. Total Perf. Tot.Trav. Tot.Trav. Aver. ID Delay Delay Delay Stop Stops Index Distance Time Speed (veh-h/h)(pers-h/h)(sec) Rate (veh-km/h)(veh-h/h) (km/h) South: Fischer Hallman Road 3L L T T R R East: Huron Road 1L L T T R R North: Fischer Hallman Road 7L L T T R R West: Huron Road 5L L T T R R Fuel Consumption, Emissions and Cost (Total) Site:FH-n-HR Weekday PM 2018 Mov Cost Fuel CO2 CO HC NOX ID Total Total Total Total Total Total $/h L/h kg/h kg/h kg/h kg/h South: Fischer Hallman Road 3L L T T R R East: Huron Road 1L L T T R R North: Fischer Hallman Road 2011/09/29
152 7L L T T R R West: Huron Road 5L L T T R R INTERSECTION: Page 4 of 12 Fuel Consumption, Emissions and Cost (Rate) Site:FH-n-HR Weekday PM 2018 Mov Cost Fuel CO2 CO HC NOX ID Rate Rate Rate Rate Rate Rate $/km L/100km g/km g/km g/km g/km South: Fischer Hallman Road 3L L T T R R East: Huron Road 1L L T T R R North: Fischer Hallman Road 7L L T T R R West: Huron Road 5L L T T R R INTERSECTION: Intersection Negotiation Data Site:FH-n-HR Weekday PM Negn Negn Negn Appr. Downstream Distance From To Radius Speed Dist. Dist Approach Approach Turn m km/h m m m User Spec? South: Fischer Hallman Road East Right No North Thru No West Left No East: Huron Road South Left No 2011/09/29
153 North Right No West Thru No North: Fischer Hallman Road South Thru No East Left No West Right No West: Huron Road South Right No East Thru No North Left No Page 5 of 12 Maximum Negotiation (Design) Speed = 50.0 km/h Downstream distance is distance travelled from the stopline until exit cruise speed is reached (includes negotiation distance). Acceleration distance is weighted for light and heavy vehicles. The same distance applies for both stopped and unstopped vehicles. Movement Speeds and Geometric Delay Site:FH-n-HR Weekday PM Queue Move-up App. Speeds Exit Speeds Av. Section Spd Geom Mov st 2nd Delay ID Cruise Negn Negn Cruise Grn Grn Running Overall sec South: Fischer Hallman Road 3L L T T R R East: Huron Road 1L L T T R R North: Fischer Hallman Road 7L L T T R R West: Huron Road 5L L T T R R "Running Speed" is the average speed excluding stopped periods. HCM Delay Formula option used: Geometric Delay is not included in Control Delay. Lanes Lane Performance Site:FH-n-HR Weekday PM 2018 Q u e u e Flow Cap Deg. Aver. Eff. 95% Back Lane Lane Satn Delay Stop Length No. veh/h veh/h x sec Rate veh m m South: Fischer Hallman Road 1 LT T R T 2011/09/29
154 East: Huron Road 1 LT T R T North: Fischer Hallman Road 1 LT T R T West: Huron Road 1 LT TR T Short lane due to specification of Turn Bay Page 6 of 12 Lane Flow and Capacity Information Site:FH-n-HR Weekday PM Lane Dem Flow (veh/h) Min Tot Deg. Lane No Cap Cap Satn Util Lef Thru Rig Tot veh/h veh/h x % South: Fischer Hallman Road 1 LT T R East: Huron Road 1 LT T R North: Fischer Hallman Road 1 LT T R West: Huron Road 1 LT TR The capacity value for priority and continuous movements is obtained by adjusting the basic saturation flow for heavy vehicle and turning vehicle effects. Saturation flow scale applies if specified. Lane, Approach and Intersection Performance Site:FH-n-HR Weekday PM Lane Demand Flow (veh/h) Adj. Eff Grn Deg Aver. Longest Shrt No %HV Basic (sec) Sat Delay Queue Lane L T R Tot Satf. 1st 2nd x sec m m South: Fischer Hallman Road 1 LT T R East: Huron Road 1 LT T R /09/29
155 North: Fischer Hallman Road 1 LT T R West: Huron Road 1 LT TR ========================================================================== ALL VEHICLES Total % Max Aver. Max Flow HV X Delay Queue ========================================================================== Peak flow period = 15 minutes. Page 7 of 12 Queue values in this table are 95% queue (metres) Note: Basic Saturation Flows are not adjusted at roundabouts or signcontrolled intersections and apply only to continuous lanes. Driver Characteristics Site:FH-n-HR Weekday PM Average Driver Lane Satn Satn Satn Satn Queue Response No. Speed Flow Hdwy Spacing Space Time km/h veh/h sec m m sec South: Fischer Hallman Road 1 LT T R NA - Short Lane East: Huron Road 1 LT T R NA - Short Lane North: Fischer Hallman Road 1 LT T R NA - Short Lane West: Huron Road 1 LT TR Saturation Flow and Saturation Headway are derived from follow-up headway. Lane Delays Site:FH-n-HR Weekday PM Delay (seconds/veh) Deg. Stop-line Delay Acc. Queuing Stopd Lane Satn 1st 2nd Total Dec. Total MvUp (Idle) Geom Control No. x d1 d2 dsl dn dq dqm di dig dic South: Fischer Hallman Road 1 LT T R East: Huron Road 2011/09/29
156 1 LT T R North: Fischer Hallman Road 1 LT T R West: Huron Road 1 LT TR HCM Delay Formula option used: (i) Control Delay does not include Geometric Delay, (ii) Stop-line Delay is treated as being same as Control Delay. dsl: Stop-line delay (=d1+d2) dn: Average stop-start delay for all vehicles queued and unqueued dq: Queuing delay (the part of the stop-line delay that includes stopped delay and queue move-up delay) dqm: Queue move-up delay di: Stopped delay (stopped (idling) time at near-zero speed) dig: Geometric delay dic: Intersection control delay (sum of stop-line and geometric delays) Page 8 of 12 Lane Queues (Vehicles) Site:FH-n-HR Weekday PM Deg. Ovrfl. Back of Queue (veh) Queue Prob. P'ile Cyc-Av. Queue Lane Satn Queue Stor. Block Block No. x No Nb1 Nb2 Nb 95% Ratio % % Nc 95% South: Fischer Hallman Road 1 LT T R East: Huron Road 1 LT T R North: Fischer Hallman Road 1 LT T R West: Huron Road 1 LT TR HCM Delay Formula option used: Cycle-Average Queue is calculated using average delay from the HCM equation. (i.e. HCM delays are treated as stop-line delays for this purpose). SIDRA Standard models are used for Back of Queue estimation since HCM only gives Cycle-Average Queues for unsignalised intersections. Lane Queues (Distance) Site:FH-n-HR Weekday PM Deg. Ovrfl. Back of Queue (m) Queue Prob. P'ile Cyc-Av. Queue Lane Satn Queue Stor. Block Block No. x No Nb1 Nb2 Nb 95% Ratio % % Nc 95% South: Fischer Hallman Road 1 LT T /09/29
157 3 R East: Huron Road 1 LT T R North: Fischer Hallman Road 1 LT T R West: Huron Road 1 LT TR Page 9 of 12 HCM Delay Formula option used: Cycle-Average Queue is calculated using average delay from the HCM equation. (i.e. HCM delays are treated as stop-line delays for this purpose). SIDRA Standard models are used for Back of Queue estimation since HCM only gives Cycle-Average Queues for unsignalised intersections. Lane Queue Percentiles (Vehicles) Site:FH-n-HR Weekday PM Deg. Percentile Back of Queue (veh) Lane Satn No. x 50% 70% 85% 90% 95% 98% South: Fischer Hallman Road 1 LT T R East: Huron Road 1 LT T R North: Fischer Hallman Road 1 LT T R West: Huron Road 1 LT TR SIDRA Standard models are used for Back of Queue estimation since HCM only gives Cycle-Average Queues for unsignalised intersections. Lane Queue Percentiles (Distance) Site:FH-n-HR Weekday PM Deg. Percentile Back of Queue (metres) Lane Satn No. x 50% 70% 85% 90% 95% 98% South: Fischer Hallman Road 1 LT T R East: Huron Road 1 LT T /09/29
158 3 R North: Fischer Hallman Road 1 LT T R West: Huron Road 1 LT TR Page 10 of 12 SIDRA Standard models are used for Back of Queue estimation since HCM only gives Cycle-Average Queues for unsignalised intersections. Lane Stops Site:FH-n-HR Weekday PM Queue Total Deg. -- Effective Stop Rate -- Total Move-up Queue Prop. Lane Satn Geom. Overall Stops Rate Move-ups Queued No. x he1 he2 hig h H hqm Hqm pq South: Fischer Hallman Road 1 LT T R East: Huron Road 1 LT T R North: Fischer Hallman Road 1 LT T R West: Huron Road 1 LT TR hig is the average value for all movements in a shared lane hqm is average queue move-up rate for all vehicles queued and unqueued Flow Rates and Demand Analysis Movement Definitions and Flow Rates (O-D) Site:FH-n-HR Weekday PM From To Mov Flow Rate Flow Scale Peak Flow Approach Approach ID Turn LV HV Fixed Var Factor South: Fischer Hallman Road East 8R Right North 8T Thru West 3L Left East: Huron Road South 1L Left North 6R Right West 6T Thru North: Fischer Hallman Road South 4T Thru East 7L Left /09/29
159 West 4R Right West: Huron Road South 2R Right East 2T Thru North 5L Left Unit Time for Volumes = 60 minutes Peak Flow Period = 15 minutes Flow Rates include effects of Flow Scale and Peak Flow Factor Page 11 of 12 Flow Rates (Separate Light and Heavy Vehicles) Site:FH-n-HR Weekday PM 2018 Mov Left Through Right ID LV HV LV HV LV HV Demand flows in veh/h as used by the program South: Fischer Hallman Road 3L L T T R R East: Huron Road 1L L T T R R North: Fischer Hallman Road 7L L T T R R West: Huron Road 5L L T T R R Unit Time for Volumes = 60 minutes Peak Flow Period = 15 minutes Flow Rates include effects of Flow Scale and Peak Flow Factor Flow Rates (Total Vehicles and Percent Heavy) Site:FH-n-HR Weekday PM Mov Left Through Right ID Total %HV Total %HV Total %HV --- Demand flows in veh/h as used by the program South: Fischer Hallman Road 3L L T T R R East: Huron Road 1L L T T R R North: Fischer Hallman Road 7L L T T R R /09/29
160 2011/09/29 Detailed Output West: Huron Road 5L L T T R R Unit Time for Volumes = 60 minutes Peak Flow Period = 15 minutes Flow Rates include effects of Flow Scale and Peak Flow Factor Page 12 of 12 Other Model Settings Site:FH-n-HR Weekday PM 2018 * Basic Parameters: Intersection Type: Driving on the right-hand side of the road Input data specified in Metric units Model Defaults: US HCM (Metric) Peak Flow Period (for performance): 15 minutes Unit time (for volumes): 60 minutes. HCM Delay Model option used HCM Queue Model option used Level of Service based on: Delay (HCM 2000) Queue percentile: 95% Parameters Used in Cost Calculations Site:FH-n-HR Weekday PM 2018 Pump price of fuel ($/L) = Fuel resource cost factor = 0.70 Ratio of running cost to fuel cost = 3.0 Average income ($/h) = Time value factor = 0.40 Light vehicle mass (1000 kg) = 1.4 Heavy vehicle mass (1000 kg) = 11.0 Light vehicle idle fuel rate (L/h) = Heavy vehicle idle fuel rate (L/h) = Diagnostics Site:FH-n-HR Weekday PM 2018 Processed: September 28, :27:58 PM Copyright Akcelik and Associates Pty Ltd SIDRA INTERSECTION Project: H:\DATA\ Transportation Planning\Working\Strasburg Road\SIDRA Files\PC\Fischer Hallman and Huron-Future BASE.sip , SNC-LAVALIN INC, SINGLE
161 Page 1 of /09/29 DETAILED OUTPUT Huron Road-N-Strasburg Road Base Case Huron Road-N-Strasburg Road AM 2018 OUTPUT TABLE LINKS s Basic Parameters Gap Acceptance Parameters Movements Movement Capacity Parameters Movement Performance Fuel Consumption, Emissions and Cost (Total) Fuel Consumption, Emissions and Cost (Rate) Intersection Negotiation Data Movement Speeds and Geometric Delay Lanes Lane Performance Lane Flow and Capacity Information Lane, Approach and Intersection Performance Driver Characteristics Lane Delays Lane Queues (Vehicles) Lane Queues (Distance) Lane Queue Percentiles (Vehicles) Lane Queue Percentiles (Distance) Lane Stops Flow Rates and Demand Analysis Movement Definitions and Flow Rates (O-D) Flow Rates (Separate Light and Heavy Vehicles) Flow Rates (Total Vehicles and Percent Heavy) Other Model Settings Parameters Used in Cost Calculations Diagnostics s Basic Parameters Site:Huron Road-N-Strasburg Road AM Circulating/Exiting Stream Cent Circ Insc Ent Ent Cir Ent Av.Ent Island Width Diam. Rad Ang Lan Lan Lane Flow %HV Adjust. %Exit Cap. O-D Diam Width Flow Incl. Constr. Factor m m m m deg m veh/h pcu/h Effect Environment Factor: 1.20 Entry/Circulating Flow Adjustment: Medium N Exclusive Slip lane (exiting flow): N East: Huron Road Environment Factor: 1.20 Entry/Circulating Flow Adjustment: Medium Y Exclusive Slip lane (exiting flow): Y
162 Page 2 of /09/29 Environment Factor: 1.20 Entry/Circulating Flow Adjustment: Medium Y Exclusive Slip lane (exiting flow): Y West: Huron Road Environment Factor: 1.20 Entry/Circulating Flow Adjustment: Medium N Exclusive Slip lane (exiting flow): N Capacity Model: SIDRA Standard HV Method for Gap Acceptance: Include HV Effect for all percentages Gap Acceptance Parameters Site:Huron Road-N-Strasburg Road AM Turn Lane Lane ---- Circulating/Exiting Stream --- Critical Gap No. Type Flow Aver Aver In-Bnch Prop Foll-up Rate Speed Dist Headway Bunched Hdwy Dist Headway pcu/h km/h m sec sec m sec Environment Factor: 1.20 Entry/Circulating Flow Adjustment: Medium Left 1 Subdominant Thru 1 Subdominant Dominant Right 3 Excl. Slip 1320E East: Huron Road Environment Factor: 1.20 Entry/Circulating Flow Adjustment: Medium Left 1 Subdominant Thru 1 Subdominant Dominant Right 3 Excl. Slip 942E Environment Factor: 1.20 Entry/Circulating Flow Adjustment: Medium Left 1 Subdominant Thru 1 Subdominant Dominant Right 3 Excl. Slip 881E West: Huron Road Environment Factor: 1.20 Entry/Circulating Flow Adjustment: Medium Left 1 Subdominant Thru 1 Subdominant Dominant Right 3 Excl. Slip 475E Capacity Model: SIDRA Standard P Priority sharing is implied for some movements (Follow-up Headway plus Intra-bunch Headway is larger than the Critical Gap). The O-D Factor ( Basic Parameters table) allows for priority sharing and priority emphasis. E Exiting flow for slip lane traffic Dist (Distance): Spacing, i.e. distance between the front ends of two successive vehicles across all lanes in the circulating or exiting stream Movements Movement Capacity Parameters Site:Huron Road-N-Strasburg Road AM Mov Opposing Movement Total Prac. Prac. Lane Deg.
163 Page 3 of /09/29 ID Demand Adjust. Cap. Deg. Spare Util Satn Flow HV Flow HV Flow Satn Cap. veh/h % veh/h % pcu/h veh/h xp % % x L L * 8T T * 8R R East: Huron Road 1L L T T R R L L T T R R West: Huron Road 5L L T T R R * Maximum degree of saturation Movement Performance Site:Huron Road-N-Strasburg Road AM Mov Total Total Aver. Eff. Total Perf. Tot.Trav. Tot.Trav. Aver. ID Delay Delay Delay Stop Stops Index Distance Time Speed (veh-h/h)(pers-h/h)(sec) Rate (veh-km/h)(veh-h/h) (km/h) L L T T R R East: Huron Road 1L L T T R R L L T T R R West: Huron Road 5L L T T R R Fuel Consumption, Emissions and Cost (Total) Site:Huron Road-N-Strasburg Road AM 2018 Mov Cost Fuel CO2 CO HC NOX ID Total Total Total Total Total Total $/h L/h kg/h kg/h kg/h kg/h 3L L T T R R
164 Page 4 of /09/ East: Huron Road 1L L T T R R L L T T R R West: Huron Road 5L L T T R R INTERSECTION: Fuel Consumption, Emissions and Cost (Rate) Site:Huron Road-N-Strasburg Road AM 2018 Mov Cost Fuel CO2 CO HC NOX ID Rate Rate Rate Rate Rate Rate $/km L/100km g/km g/km g/km g/km 3L L T T R R East: Huron Road 1L L T T R R L L T T R R West: Huron Road 5L L T T R R INTERSECTION: Intersection Negotiation Data Site:Huron Road-N-Strasburg Road AM 2018
165 Page 5 of /09/ Negn Negn Negn Appr. Downstream Distance From To Radius Speed Dist. Dist Approach Approach Turn m km/h m m m User Spec? East Right No North Thru No West Left No East: Huron Road South Left No North Right No West Thru No South Thru No East Left No West Right No West: Huron Road South Right No East Thru No North Left No Maximum Negotiation (Design) Speed = 50.0 km/h Downstream distance is distance travelled from the stopline until exit cruise speed is reached (includes negotiation distance). Acceleration distance is weighted for light and heavy vehicles. The same distance applies for both stopped and unstopped vehicles. Movement Speeds and Geometric Delay Site:Huron Road-N-Strasburg Road AM Queue Move-up App. Speeds Exit Speeds Av. Section Spd Geom Mov st 2nd Delay ID Cruise Negn Negn Cruise Grn Grn Running Overall sec L L T T R R East: Huron Road 1L L T T R R L L T T R R West: Huron Road 5L L T T R R "Running Speed" is the average speed excluding stopped periods. HCM Delay Formula option used: Geometric Delay is not included in Control Delay. Lanes Lane Performance Site:Huron Road-N-Strasburg Road AM 2018
166 Page 6 of /09/29 Q u e u e Flow Cap Deg. Aver. Eff. 95% Back Lane Lane Satn Delay Stop Length No. veh/h veh/h x sec Rate veh m m 1 LT T R T East: Huron Road 1 LT T R T 1 LT T R T West: Huron Road 1 LT T R T T Short lane due to specification of Turn Bay Lane Flow and Capacity Information Site:Huron Road-N-Strasburg Road AM Lane Dem Flow (veh/h) Min Tot Deg. Lane No Cap Cap Satn Util Lef Thru Rig Tot veh/h veh/h x % LT T R East: Huron Road 1 LT T R LT T R West: Huron Road 1 LT T R The capacity value for priority and continuous movements is obtained by adjusting the basic saturation flow for heavy vehicle and turning vehicle effects. Saturation flow scale applies if specified. Lane, Approach and Intersection Performance Site:Huron Road-N-Strasburg Road AM 2018
167 Page 7 of /09/ Lane Demand Flow (veh/h) Adj. Eff Grn Deg Aver. Longest Shrt No %HV Basic (sec) Sat Delay Queue Lane L T R Tot Satf. 1st 2nd x sec m m LT T R East: Huron Road 1 LT T R LT T R West: Huron Road 1 LT T R ========================================================================== ALL VEHICLES Total % Max Aver. Max Flow HV X Delay Queue ========================================================================== Peak flow period = 15 minutes. Queue values in this table are 95% queue (metres) Note: Basic Saturation Flows are not adjusted at roundabouts or signcontrolled intersections and apply only to continuous lanes. Driver Characteristics Site:Huron Road-N-Strasburg Road AM Average Driver Lane Satn Satn Satn Satn Queue Response No. Speed Flow Hdwy Spacing Space Time km/h veh/h sec m m sec LT T R NA - Short Lane East: Huron Road 1 LT T R NA - Short Lane LT T R NA - Short Lane West: Huron Road 1 LT T R NA - Short Lane Saturation Flow and Saturation Headway are derived from follow-up headway.
168 Page 8 of /09/29 Lane Delays Site:Huron Road-N-Strasburg Road AM Delay (seconds/veh) Deg. Stop-line Delay Acc. Queuing Stopd Lane Satn 1st 2nd Total Dec. Total MvUp (Idle) Geom Control No. x d1 d2 dsl dn dq dqm di dig dic LT T R East: Huron Road 1 LT T R LT T R West: Huron Road 1 LT T R HCM Delay Formula option used: (i) Control Delay does not include Geometric Delay, (ii) Stop-line Delay is treated as being same as Control Delay. dsl: Stop-line delay (=d1+d2) dn: Average stop-start delay for all vehicles queued and unqueued dq: Queuing delay (the part of the stop-line delay that includes stopped delay and queue move-up delay) dqm: Queue move-up delay di: Stopped delay (stopped (idling) time at near-zero speed) dig: Geometric delay dic: Intersection control delay (sum of stop-line and geometric delays) Lane Queues (Vehicles) Site:Huron Road-N-Strasburg Road AM Deg. Ovrfl. Back of Queue (veh) Queue Prob. P'ile Cyc-Av. Queue Lane Satn Queue Stor. Block Block No. x No Nb1 Nb2 Nb 95% Ratio % % Nc 95% LT T R East: Huron Road 1 LT T R LT T R West: Huron Road 1 LT T
169 Page 9 of /09/29 3 R HCM Delay Formula option used: Cycle-Average Queue is calculated using average delay from the HCM equation. (i.e. HCM delays are treated as stop-line delays for this purpose). SIDRA Standard models are used for Back of Queue estimation since HCM only gives Cycle-Average Queues for unsignalised intersections. Lane Queues (Distance) Site:Huron Road-N-Strasburg Road AM Deg. Ovrfl. Back of Queue (m) Queue Prob. P'ile Cyc-Av. Queue Lane Satn Queue Stor. Block Block No. x No Nb1 Nb2 Nb 95% Ratio % % Nc 95% LT T R East: Huron Road 1 LT T R LT T R West: Huron Road 1 LT T R HCM Delay Formula option used: Cycle-Average Queue is calculated using average delay from the HCM equation. (i.e. HCM delays are treated as stop-line delays for this purpose). SIDRA Standard models are used for Back of Queue estimation since HCM only gives Cycle-Average Queues for unsignalised intersections. Lane Queue Percentiles (Vehicles) Site:Huron Road-N-Strasburg Road AM Deg. Percentile Back of Queue (veh) Lane Satn No. x 50% 70% 85% 90% 95% 98% LT T R East: Huron Road 1 LT T R LT T R West: Huron Road
170 Page 10 of /09/29 1 LT T R SIDRA Standard models are used for Back of Queue estimation since HCM only gives Cycle-Average Queues for unsignalised intersections. Lane Queue Percentiles (Distance) Site:Huron Road-N-Strasburg Road AM Deg. Percentile Back of Queue (metres) Lane Satn No. x 50% 70% 85% 90% 95% 98% LT T R East: Huron Road 1 LT T R LT T R West: Huron Road 1 LT T R SIDRA Standard models are used for Back of Queue estimation since HCM only gives Cycle-Average Queues for unsignalised intersections. Lane Stops Site:Huron Road-N-Strasburg Road AM Queue Total Deg. -- Effective Stop Rate -- Total Move-up Queue Prop. Lane Satn Geom. Overall Stops Rate Move-ups Queued No. x he1 he2 hig h H hqm Hqm pq LT T R East: Huron Road 1 LT T R LT T R West: Huron Road 1 LT T R
171 Page 11 of /09/ hig is the average value for all movements in a shared lane hqm is average queue move-up rate for all vehicles queued and unqueued Flow Rates and Demand Analysis Movement Definitions and Flow Rates (O-D) Site:Huron Road-N-Strasburg Road AM From To Mov Flow Rate Flow Scale Peak Flow Approach Approach ID Turn LV HV Fixed Var Factor East 8R Right North 8T Thru West 3L Left East: Huron Road South 1L Left North 6R Right West 6T Thru South 4T Thru East 7L Left West 4R Right West: Huron Road South 2R Right East 2T Thru North 5L Left Unit Time for Volumes = 60 minutes Peak Flow Period = 15 minutes Flow Rates include effects of Flow Scale and Peak Flow Factor Flow Rates (Separate Light and Heavy Vehicles) Site:Huron Road-N-Strasburg Road AM 2018 Mov Left Through Right ID LV HV LV HV LV HV Demand flows in veh/h as used by the program 3L L T T R R East: Huron Road 1L L T T R R L L T T R R West: Huron Road 5L L T T R R
172 Page 12 of /09/29 Unit Time for Volumes = 60 minutes Peak Flow Period = 15 minutes Flow Rates include effects of Flow Scale and Peak Flow Factor Flow Rates (Total Vehicles and Percent Heavy) Site:Huron Road-N-Strasburg Road AM Mov Left Through Right ID Total %HV Total %HV Total %HV --- Demand flows in veh/h as used by the program 3L L T T R R East: Huron Road 1L L T T R R L L T T R R West: Huron Road 5L L T T R R Unit Time for Volumes = 60 minutes Peak Flow Period = 15 minutes Flow Rates include effects of Flow Scale and Peak Flow Factor Other Model Settings Site:Huron Road-N-Strasburg Road AM 2018 * Basic Parameters: Intersection Type: Driving on the right-hand side of the road Input data specified in Metric units Model Defaults: US HCM (Metric) Peak Flow Period (for performance): 15 minutes Unit time (for volumes): 60 minutes. HCM Delay Model option used HCM Queue Model option used Level of Service based on: Delay (HCM 2000) Queue percentile: 95% Parameters Used in Cost Calculations Site:Huron Road-N-Strasburg Road AM 2018
173 Page 13 of 13 Pump price of fuel ($/L) = Fuel resource cost factor = 0.70 Ratio of running cost to fuel cost = 3.0 Average income ($/h) = Time value factor = 0.40 Light vehicle mass (1000 kg) = 1.4 Heavy vehicle mass (1000 kg) = 11.0 Light vehicle idle fuel rate (L/h) = Heavy vehicle idle fuel rate (L/h) = Diagnostics Site:Huron Road-N-Strasburg Road AM 2018 Processed: September 28, :32:09 PM SIDRA INTERSECTION Copyright Akcelik and Associates Pty Ltd Project: H:\DATA\ Transportation Planning\Working\Strasburg Road\SIDRA Files\PC\Huron Road and Strasburg Road BASE.sip , SNC-LAVALIN INC, SINGLE 2011/09/29
174 DETAILED OUTPUT Huron Road-N-Strasburg Road Base Case Page 1 of 12 Huron Road-N-Strasburg Road PM 2018 OUTPUT TABLE LINKS s Basic Parameters Gap Acceptance Parameters Movements Movement Capacity Parameters Movement Performance Fuel Consumption, Emissions and Cost (Total) Fuel Consumption, Emissions and Cost (Rate) Intersection Negotiation Data Movement Speeds and Geometric Delay Lanes Lane Performance Lane Flow and Capacity Information Lane, Approach and Intersection Performance Driver Characteristics Lane Delays Lane Queues (Vehicles) Lane Queues (Distance) Lane Queue Percentiles (Vehicles) Lane Queue Percentiles (Distance) Lane Stops Flow Rates and Demand Analysis Movement Definitions and Flow Rates (O-D) Flow Rates (Separate Light and Heavy Vehicles) Flow Rates (Total Vehicles and Percent Heavy) Other Model Settings Parameters Used in Cost Calculations Diagnostics s Basic Parameters Site:Huron Road-N-Strasburg Road PM Circulating/Exiting Stream Cent Circ Insc Ent Ent Cir Ent Av.Ent Island Width Diam. Rad Ang Lan Lan Lane Flow %HV Adjust. %Exit Cap. O-D Diam Width Flow Incl. Constr. Factor m m m m deg m veh/h pcu/h Effect Environment Factor: 1.20 Entry/Circulating Flow Adjustment: Medium Y Exclusive Slip lane (exiting flow): Y East: Huron Road Environment Factor: 1.20 Entry/Circulating Flow Adjustment: Medium N Exclusive Slip lane (exiting flow): N Environment Factor: 1.10 Entry/Circulating Flow Adjustment: High N Exclusive Slip lane (exiting flow): N /09/29
175 West: Huron Road Environment Factor: 1.20 Entry/Circulating Flow Adjustment: Medium Y Exclusive Slip lane (exiting flow): Y Capacity Model: SIDRA Standard HV Method for Gap Acceptance: Include HV Effect for all percentages Page 2 of 12 Gap Acceptance Parameters Site:Huron Road-N-Strasburg Road PM Turn Lane Lane ---- Circulating/Exiting Stream --- Critical Gap No. Type Flow Aver Aver In-Bnch Prop Foll-up Rate Speed Dist Headway Bunched Hdwy Dist Headway pcu/h km/h m sec sec m sec Environment Factor: 1.20 Entry/Circulating Flow Adjustment: Medium Left 1 Subdominant Thru 2 Dominant Right 3 Excl. Slip 861E East: Huron Road Environment Factor: 1.20 Entry/Circulating Flow Adjustment: Medium Left 1 Subdominant Thru 1 Subdominant Dominant Right 3 Excl. Slip 580E Environment Factor: 1.10 Entry/Circulating Flow Adjustment: High Left 1 Subdominant Thru 1 Subdominant Dominant * Right 3 Excl. Slip 1605E West: Huron Road Environment Factor: 1.20 Entry/Circulating Flow Adjustment: Medium Left 1 Subdominant Thru 1 Subdominant Subdominant Right 3 Excl. Slip 969E Capacity Model: SIDRA Standard P Priority sharing is implied for some movements (Follow-up Headway plus Intra-bunch Headway is larger than the Critical Gap). The O-D Factor ( Basic Parameters table) allows for priority sharing and priority emphasis. * Critical gap or follow-up headway set to MINIMUM value E Exiting flow for slip lane traffic Dist (Distance): Spacing, i.e. distance between the front ends of two successive vehicles across all lanes in the circulating or exiting stream Movements Movement Capacity Parameters Site:Huron Road-N-Strasburg Road PM Mov Opposing Movement Total Prac. Prac. Lane Deg. ID Demand Adjust. Cap. Deg. Spare Util Satn Flow HV Flow HV Flow Satn Cap. veh/h % veh/h % pcu/h veh/h xp % % x L L /09/29
176 8T T R R East: Huron Road 1L L T T R R L L * 4T T * 4R R West: Huron Road 5L L T T R R * Maximum degree of saturation Page 3 of 12 Movement Performance Site:Huron Road-N-Strasburg Road PM Mov Total Total Aver. Eff. Total Perf. Tot.Trav. Tot.Trav. Aver. ID Delay Delay Delay Stop Stops Index Distance Time Speed (veh-h/h)(pers-h/h)(sec) Rate (veh-km/h)(veh-h/h) (km/h) L L T T R R East: Huron Road 1L L T T R R L L T T R R West: Huron Road 5L L T T R R Fuel Consumption, Emissions and Cost (Total) Site:Huron Road-N-Strasburg Road PM 2018 Mov Cost Fuel CO2 CO HC NOX ID Total Total Total Total Total Total $/h L/h kg/h kg/h kg/h kg/h 3L L T T R R East: Huron Road 1L L T T R R /09/29
177 7L L T T R R West: Huron Road 5L L T T R R INTERSECTION: Page 4 of 12 Fuel Consumption, Emissions and Cost (Rate) Site:Huron Road-N-Strasburg Road PM 2018 Mov Cost Fuel CO2 CO HC NOX ID Rate Rate Rate Rate Rate Rate $/km L/100km g/km g/km g/km g/km 3L L T T R R East: Huron Road 1L L T T R R L L T T R R West: Huron Road 5L L T T R R INTERSECTION: Intersection Negotiation Data Site:Huron Road-N-Strasburg Road PM Negn Negn Negn Appr. Downstream Distance From To Radius Speed Dist. Dist Approach Approach Turn m km/h m m m User Spec? East Right No North Thru No West Left No East: Huron Road South Left No 2011/09/29
178 North Right No West Thru No South Thru No East Left No West Right No West: Huron Road South Right No East Thru No North Left No Page 5 of 12 Maximum Negotiation (Design) Speed = 50.0 km/h Downstream distance is distance travelled from the stopline until exit cruise speed is reached (includes negotiation distance). Acceleration distance is weighted for light and heavy vehicles. The same distance applies for both stopped and unstopped vehicles. Movement Speeds and Geometric Delay Site:Huron Road-N-Strasburg Road PM Queue Move-up App. Speeds Exit Speeds Av. Section Spd Geom Mov st 2nd Delay ID Cruise Negn Negn Cruise Grn Grn Running Overall sec L L T T R R East: Huron Road 1L L T T R R L L T T R R West: Huron Road 5L L T T R R "Running Speed" is the average speed excluding stopped periods. HCM Delay Formula option used: Geometric Delay is not included in Control Delay. Lanes Lane Performance Site:Huron Road-N-Strasburg Road PM 2018 Q u e u e Flow Cap Deg. Aver. Eff. 95% Back Lane Lane Satn Delay Stop Length No. veh/h veh/h x sec Rate veh m m 1 L T R T 2011/09/29
179 East: Huron Road 1 LT T R T 1 LT T R T West: Huron Road 1 LT T R T T Short lane due to specification of Turn Bay Page 6 of 12 Lane Flow and Capacity Information Site:Huron Road-N-Strasburg Road PM Lane Dem Flow (veh/h) Min Tot Deg. Lane No Cap Cap Satn Util Lef Thru Rig Tot veh/h veh/h x % L T P 3 R East: Huron Road 1 LT T R LT T R West: Huron Road 1 LT T R P Lane under-utilisation found by the "Program". This includes cases where the value of lane under-utilisation due to downstream effects has been modified by the program during lane flow calculations (e.g. a de facto exclusive lane has been found). The capacity value for priority and continuous movements is obtained by adjusting the basic saturation flow for heavy vehicle and turning vehicle effects. Saturation flow scale applies if specified. Lane, Approach and Intersection Performance Site:Huron Road-N-Strasburg Road PM Lane Demand Flow (veh/h) Adj. Eff Grn Deg Aver. Longest Shrt No %HV Basic (sec) Sat Delay Queue Lane L T R Tot Satf. 1st 2nd x sec m m L T R East: Huron Road 1 LT /09/29
180 2 T R LT T R West: Huron Road 1 LT T R ========================================================================== ALL VEHICLES Total % Max Aver. Max Flow HV X Delay Queue ========================================================================== Peak flow period = 15 minutes. Page 7 of 12 Queue values in this table are 95% queue (metres) Note: Basic Saturation Flows are not adjusted at roundabouts or signcontrolled intersections and apply only to continuous lanes. Driver Characteristics Site:Huron Road-N-Strasburg Road PM Average Driver Lane Satn Satn Satn Satn Queue Response No. Speed Flow Hdwy Spacing Space Time km/h veh/h sec m m sec L T R NA - Short Lane East: Huron Road 1 LT T R NA - Short Lane LT T R NA - Short Lane West: Huron Road 1 LT T R NA - Short Lane Saturation Flow and Saturation Headway are derived from follow-up headway. Lane Delays Site:Huron Road-N-Strasburg Road PM Delay (seconds/veh) Deg. Stop-line Delay Acc. Queuing Stopd Lane Satn 1st 2nd Total Dec. Total MvUp (Idle) Geom Control No. x d1 d2 dsl dn dq dqm di dig dic /09/29
181 1 L T R East: Huron Road 1 LT T R LT T R West: Huron Road 1 LT T R HCM Delay Formula option used: (i) Control Delay does not include Geometric Delay, (ii) Stop-line Delay is treated as being same as Control Delay. dsl: Stop-line delay (=d1+d2) dn: Average stop-start delay for all vehicles queued and unqueued dq: Queuing delay (the part of the stop-line delay that includes stopped delay and queue move-up delay) dqm: Queue move-up delay di: Stopped delay (stopped (idling) time at near-zero speed) dig: Geometric delay dic: Intersection control delay (sum of stop-line and geometric delays) Page 8 of 12 Lane Queues (Vehicles) Site:Huron Road-N-Strasburg Road PM Deg. Ovrfl. Back of Queue (veh) Queue Prob. P'ile Cyc-Av. Queue Lane Satn Queue Stor. Block Block No. x No Nb1 Nb2 Nb 95% Ratio % % Nc 95% L T R East: Huron Road 1 LT T R LT T R West: Huron Road 1 LT T R HCM Delay Formula option used: Cycle-Average Queue is calculated using average delay from the HCM equation. (i.e. HCM delays are treated as stop-line delays for this purpose). SIDRA Standard models are used for Back of Queue estimation since HCM only gives Cycle-Average Queues for unsignalised intersections. Lane Queues (Distance) Site:Huron Road-N-Strasburg Road PM Deg. Ovrfl. Back of Queue (m) Queue Prob. P'ile Cyc-Av. Queue 2011/09/29
182 Lane Satn Queue Stor. Block Block No. x No Nb1 Nb2 Nb 95% Ratio % % Nc 95% L T R East: Huron Road 1 LT T R LT T R West: Huron Road 1 LT T R Page 9 of 12 HCM Delay Formula option used: Cycle-Average Queue is calculated using average delay from the HCM equation. (i.e. HCM delays are treated as stop-line delays for this purpose). SIDRA Standard models are used for Back of Queue estimation since HCM only gives Cycle-Average Queues for unsignalised intersections. Lane Queue Percentiles (Vehicles) Site:Huron Road-N-Strasburg Road PM Deg. Percentile Back of Queue (veh) Lane Satn No. x 50% 70% 85% 90% 95% 98% L T R East: Huron Road 1 LT T R LT T R West: Huron Road 1 LT T R SIDRA Standard models are used for Back of Queue estimation since HCM only gives Cycle-Average Queues for unsignalised intersections. Lane Queue Percentiles (Distance) Site:Huron Road-N-Strasburg Road PM Deg. Percentile Back of Queue (metres) Lane Satn No. x 50% 70% 85% 90% 95% 98% /09/29
183 1 L T R East: Huron Road 1 LT T R LT T R West: Huron Road 1 LT T R Page 10 of 12 SIDRA Standard models are used for Back of Queue estimation since HCM only gives Cycle-Average Queues for unsignalised intersections. Lane Stops Site:Huron Road-N-Strasburg Road PM Queue Total Deg. -- Effective Stop Rate -- Total Move-up Queue Prop. Lane Satn Geom. Overall Stops Rate Move-ups Queued No. x he1 he2 hig h H hqm Hqm pq L T R East: Huron Road 1 LT T R LT T R West: Huron Road 1 LT T R hig is the average value for all movements in a shared lane hqm is average queue move-up rate for all vehicles queued and unqueued Flow Rates and Demand Analysis Movement Definitions and Flow Rates (O-D) Site:Huron Road-N-Strasburg Road PM From To Mov Flow Rate Flow Scale Peak Flow Approach Approach ID Turn LV HV Fixed Var Factor East 8R Right North 8T Thru West 3L Left /09/29
184 East: Huron Road South 1L Left North 6R Right West 6T Thru South 4T Thru East 7L Left West 4R Right West: Huron Road South 2R Right East 2T Thru North 5L Left Unit Time for Volumes = 60 minutes Peak Flow Period = 15 minutes Flow Rates include effects of Flow Scale and Peak Flow Factor Page 11 of 12 Flow Rates (Separate Light and Heavy Vehicles) Site:Huron Road-N-Strasburg Road PM 2018 Mov Left Through Right ID LV HV LV HV LV HV Demand flows in veh/h as used by the program 3L L T T R R East: Huron Road 1L L T T R R L L T T R R West: Huron Road 5L L T T R R Unit Time for Volumes = 60 minutes Peak Flow Period = 15 minutes Flow Rates include effects of Flow Scale and Peak Flow Factor Flow Rates (Total Vehicles and Percent Heavy) Site:Huron Road-N-Strasburg Road PM Mov Left Through Right ID Total %HV Total %HV Total %HV --- Demand flows in veh/h as used by the program 3L L T T R R East: Huron Road 1L L T T /09/29
185 2011/09/29 Detailed Output 6R R L L T T R R West: Huron Road 5L L T T R R Unit Time for Volumes = 60 minutes Peak Flow Period = 15 minutes Flow Rates include effects of Flow Scale and Peak Flow Factor Page 12 of 12 Other Model Settings Site:Huron Road-N-Strasburg Road PM 2018 * Basic Parameters: Intersection Type: Driving on the right-hand side of the road Input data specified in Metric units Model Defaults: US HCM (Metric) Peak Flow Period (for performance): 15 minutes Unit time (for volumes): 60 minutes. HCM Delay Model option used HCM Queue Model option used Level of Service based on: Delay (HCM 2000) Queue percentile: 95% Parameters Used in Cost Calculations Site:Huron Road-N-Strasburg Road PM 2018 Pump price of fuel ($/L) = Fuel resource cost factor = 0.70 Ratio of running cost to fuel cost = 3.0 Average income ($/h) = Time value factor = 0.40 Light vehicle mass (1000 kg) = 1.4 Heavy vehicle mass (1000 kg) = 11.0 Light vehicle idle fuel rate (L/h) = Heavy vehicle idle fuel rate (L/h) = Diagnostics Site:Huron Road-N-Strasburg Road PM 2018 Processed: September 28, :33:13 PM SIDRA INTERSECTION Copyright Akcelik and Associates Pty Ltd Project: H:\DATA\ Transportation Planning\Working\Strasburg Road\SIDRA Files\PC\Huron Road and Strasburg Road BASE.sip , SNC-LAVALIN INC, SINGLE
186 Page 1 of /09/29 DETAILED OUTPUT Robert Ferrie Drive and New Dundee Road Base Case Robert Ferrie-N-New Dundee- Weekday AM 2018 OUTPUT TABLE LINKS s Basic Parameters Gap Acceptance Parameters Movements Movement Capacity Parameters Movement Performance Fuel Consumption, Emissions and Cost (Total) Fuel Consumption, Emissions and Cost (Rate) Intersection Negotiation Data Movement Speeds and Geometric Delay Lanes Lane Performance Lane Flow and Capacity Information Lane, Approach and Intersection Performance Driver Characteristics Lane Delays Lane Queues (Vehicles) Lane Queues (Distance) Lane Queue Percentiles (Vehicles) Lane Queue Percentiles (Distance) Lane Stops Flow Rates and Demand Analysis Movement Definitions and Flow Rates (O-D) Flow Rates (Separate Light and Heavy Vehicles) Flow Rates (Total Vehicles and Percent Heavy) Other Model Settings Parameters Used in Cost Calculations Diagnostics s Basic Parameters Site:Robert Ferrie-N-New Dundee-Weekday AM Circulating/Exiting Stream Cent Circ Insc Ent Ent Cir Ent Av.Ent Island Width Diam. Rad Ang Lan Lan Lane Flow %HV Adjust. %Exit Cap. O-D Diam Width Flow Incl. Constr. Factor m m m m deg m veh/h pcu/h Effect East: New Dundee Road Environment Factor: 1.20 Entry/Circulating Flow Adjustment: Medium N North: Robert Ferrie Drive Environment Factor: 1.20 Entry/Circulating Flow Adjustment: Medium N West: New Dundee Road Environment Factor: 1.20 Entry/Circulating Flow Adjustment: Medium N 0.988
187 Page 2 of /09/ Capacity Model: SIDRA Standard HV Method for Gap Acceptance: Include HV Effect for all percentages Gap Acceptance Parameters Site:Robert Ferrie-N-New Dundee-Weekday AM Turn Lane Lane ---- Circulating/Exiting Stream --- Critical Gap No. Type Flow Aver Aver In-Bnch Prop Foll-up Rate Speed Dist Headway Bunched Hdwy Dist Headway pcu/h km/h m sec sec m sec East: New Dundee Road Environment Factor: 1.20 Entry/Circulating Flow Adjustment: Medium Thru 1 Subdominant Dominant Right 2 Dominant North: Robert Ferrie Drive Environment Factor: 1.20 Entry/Circulating Flow Adjustment: Medium Left 1 Dominant Right 1 Dominant West: New Dundee Road Environment Factor: 1.20 Entry/Circulating Flow Adjustment: Medium Left 1 Subdominant Thru 1 Subdominant Dominant Capacity Model: SIDRA Standard P Priority sharing is implied for some movements (Follow-up Headway plus Intra-bunch Headway is larger than the Critical Gap). The O-D Factor ( Basic Parameters table) allows for priority sharing and priority emphasis. Dist (Distance): Spacing, i.e. distance between the front ends of two successive vehicles across all lanes in the circulating or exiting stream Movements Movement Capacity Parameters Site:Robert Ferrie-N-New Dundee-Weekday AM Mov Opposing Movement Total Prac. Prac. Lane Deg. ID Demand Adjust. Cap. Deg. Spare Util Satn Flow HV Flow HV Flow Satn Cap. veh/h % veh/h % pcu/h veh/h xp % % x East: New Dundee Road 6T T R R North: Robert Ferrie Drive 7L L R R West: New Dundee Road 5L L * 2T T * * Maximum degree of saturation
188 Page 3 of /09/29 Movement Performance Site:Robert Ferrie-N-New Dundee-Weekday AM Mov Total Total Aver. Eff. Total Perf. Tot.Trav. Tot.Trav. Aver. ID Delay Delay Delay Stop Stops Index Distance Time Speed (veh-h/h)(pers-h/h)(sec) Rate (veh-km/h)(veh-h/h) (km/h) East: New Dundee Road 6T T R R North: Robert Ferrie Drive 7L L R R West: New Dundee Road 5L L T T Fuel Consumption, Emissions and Cost (Total) Site:Robert Ferrie-N-New Dundee-Weekday AM 2018 Mov Cost Fuel CO2 CO HC NOX ID Total Total Total Total Total Total $/h L/h kg/h kg/h kg/h kg/h East: New Dundee Road 6T T R R North: Robert Ferrie Drive 7L L R R West: New Dundee Road 5L L T T INTERSECTION: Fuel Consumption, Emissions and Cost (Rate) Site:Robert Ferrie-N-New Dundee-Weekday AM 2018 Mov Cost Fuel CO2 CO HC NOX ID Rate Rate Rate Rate Rate Rate $/km L/100km g/km g/km g/km g/km East: New Dundee Road 6T T R R
189 Page 4 of /09/29 North: Robert Ferrie Drive 7L L R R West: New Dundee Road 5L L T T INTERSECTION: Intersection Negotiation Data Site:Robert Ferrie-N-New Dundee-Weekday AM Negn Negn Negn Appr. Downstream Distance From To Radius Speed Dist. Dist Approach Approach Turn m km/h m m m User Spec? East: New Dundee Road North Right No West Thru No North: Robert Ferrie Drive East Left No West Right No West: New Dundee Road East Thru No North Left No Maximum Negotiation (Design) Speed = 50.0 km/h Downstream distance is distance travelled from the stopline until exit cruise speed is reached (includes negotiation distance). Acceleration distance is weighted for light and heavy vehicles. The same distance applies for both stopped and unstopped vehicles. Movement Speeds and Geometric Delay Site:Robert Ferrie-N-New Dundee-Weekday AM Queue Move-up App. Speeds Exit Speeds Av. Section Spd Geom Mov st 2nd Delay ID Cruise Negn Negn Cruise Grn Grn Running Overall sec East: New Dundee Road 6T T R R North: Robert Ferrie Drive 7L L R R West: New Dundee Road 5L L T T "Running Speed" is the average speed excluding stopped periods. HCM Delay Formula option used: Geometric Delay is not included in Control Delay.
190 Page 5 of /09/29 Lanes Lane Performance Site:Robert Ferrie-N-New Dundee-Weekday AM 2018 Q u e u e Flow Cap Deg. Aver. Eff. 95% Back Lane Lane Satn Delay Stop Length No. veh/h veh/h x sec Rate veh m m East: New Dundee Road 1 T TR North: Robert Ferrie Drive 1 LR West: New Dundee Road 1 LT T Lane Flow and Capacity Information Site:Robert Ferrie-N-New Dundee-Weekday AM Lane Dem Flow (veh/h) Min Tot Deg. Lane No Cap Cap Satn Util Lef Thru Rig Tot veh/h veh/h x % East: New Dundee Road 1 T TR North: Robert Ferrie Drive 1 LR West: New Dundee Road 1 LT T The capacity value for priority and continuous movements is obtained by adjusting the basic saturation flow for heavy vehicle and turning vehicle effects. Saturation flow scale applies if specified. Lane, Approach and Intersection Performance Site:Robert Ferrie-N-New Dundee-Weekday AM Lane Demand Flow (veh/h) Adj. Eff Grn Deg Aver. Longest Shrt No %HV Basic (sec) Sat Delay Queue Lane L T R Tot Satf. 1st 2nd x sec m m East: New Dundee Road 1 T TR
191 Page 6 of /09/ North: Robert Ferrie Drive 1 LR West: New Dundee Road 1 LT T ========================================================================== ALL VEHICLES Total % Max Aver. Max Flow HV X Delay Queue ========================================================================== Peak flow period = 15 minutes. Queue values in this table are 95% queue (metres) Note: Basic Saturation Flows are not adjusted at roundabouts or signcontrolled intersections and apply only to continuous lanes. Driver Characteristics Site:Robert Ferrie-N-New Dundee-Weekday AM Average Driver Lane Satn Satn Satn Satn Queue Response No. Speed Flow Hdwy Spacing Space Time km/h veh/h sec m m sec East: New Dundee Road 1 T TR North: Robert Ferrie Drive 1 LR West: New Dundee Road 1 LT T Saturation Flow and Saturation Headway are derived from follow-up headway. Lane Delays Site:Robert Ferrie-N-New Dundee-Weekday AM Delay (seconds/veh) Deg. Stop-line Delay Acc. Queuing Stopd Lane Satn 1st 2nd Total Dec. Total MvUp (Idle) Geom Control No. x d1 d2 dsl dn dq dqm di dig dic East: New Dundee Road 1 T TR North: Robert Ferrie Drive 1 LR West: New Dundee Road 1 LT T HCM Delay Formula option used: (i) Control Delay does not include Geometric Delay, (ii) Stop-line Delay is treated as being same as Control Delay.
192 Page 7 of /09/29 dsl: Stop-line delay (=d1+d2) dn: Average stop-start delay for all vehicles queued and unqueued dq: Queuing delay (the part of the stop-line delay that includes stopped delay and queue move-up delay) dqm: Queue move-up delay di: Stopped delay (stopped (idling) time at near-zero speed) dig: Geometric delay dic: Intersection control delay (sum of stop-line and geometric delays) Geometric delay is less than 2 seconds for some movements. The negotiation speed may be too high or the approach and exit speeds may be too low for given geometric design (e.g. for a large roundabout). Check Detailed Output for geometric delay data including negotiation speeds. If necessary, specify appropriate values of approach and exit speeds, negotiation radius or negotiation speed data in the Path Data dialog. Lane Queues (Vehicles) Site:Robert Ferrie-N-New Dundee-Weekday AM Deg. Ovrfl. Back of Queue (veh) Queue Prob. P'ile Cyc-Av. Queue Lane Satn Queue Stor. Block Block No. x No Nb1 Nb2 Nb 95% Ratio % % Nc 95% East: New Dundee Road 1 T TR North: Robert Ferrie Drive 1 LR West: New Dundee Road 1 LT T HCM Delay Formula option used: Cycle-Average Queue is calculated using average delay from the HCM equation. (i.e. HCM delays are treated as stop-line delays for this purpose). SIDRA Standard models are used for Back of Queue estimation since HCM only gives Cycle-Average Queues for unsignalised intersections. Lane Queues (Distance) Site:Robert Ferrie-N-New Dundee-Weekday AM Deg. Ovrfl. Back of Queue (m) Queue Prob. P'ile Cyc-Av. Queue Lane Satn Queue Stor. Block Block No. x No Nb1 Nb2 Nb 95% Ratio % % Nc 95% East: New Dundee Road 1 T TR North: Robert Ferrie Drive 1 LR West: New Dundee Road 1 LT T HCM Delay Formula option used: Cycle-Average Queue is calculated using average delay from the HCM equation. (i.e. HCM delays are treated as stop-line delays for this purpose). SIDRA Standard models are used for Back of Queue estimation since HCM only gives Cycle-Average Queues for unsignalised intersections.
193 Page 8 of /09/29 Lane Queue Percentiles (Vehicles) Site:Robert Ferrie-N-New Dundee-Weekday AM Deg. Percentile Back of Queue (veh) Lane Satn No. x 50% 70% 85% 90% 95% 98% East: New Dundee Road 1 T TR North: Robert Ferrie Drive 1 LR West: New Dundee Road 1 LT T SIDRA Standard models are used for Back of Queue estimation since HCM only gives Cycle-Average Queues for unsignalised intersections. Lane Queue Percentiles (Distance) Site:Robert Ferrie-N-New Dundee-Weekday AM Deg. Percentile Back of Queue (metres) Lane Satn No. x 50% 70% 85% 90% 95% 98% East: New Dundee Road 1 T TR North: Robert Ferrie Drive 1 LR West: New Dundee Road 1 LT T SIDRA Standard models are used for Back of Queue estimation since HCM only gives Cycle-Average Queues for unsignalised intersections. Lane Stops Site:Robert Ferrie-N-New Dundee-Weekday AM Queue Total Deg. -- Effective Stop Rate -- Total Move-up Queue Prop. Lane Satn Geom. Overall Stops Rate Move-ups Queued No. x he1 he2 hig h H hqm Hqm pq East: New Dundee Road 1 T TR North: Robert Ferrie Drive 1 LR
194 Page 9 of /09/29 West: New Dundee Road 1 LT T hig is the average value for all movements in a shared lane hqm is average queue move-up rate for all vehicles queued and unqueued Flow Rates and Demand Analysis Movement Definitions and Flow Rates (O-D) Site:Robert Ferrie-N-New Dundee-Weekday AM From To Mov Flow Rate Flow Scale Peak Flow Approach Approach ID Turn LV HV Fixed Var Factor East: New Dundee Road North 6R Right West 6T Thru North: Robert Ferrie Drive East 7L Left West 4R Right West: New Dundee Road East 2T Thru North 5L Left Unit Time for Volumes = 60 minutes Peak Flow Period = 15 minutes Flow Rates include effects of Flow Scale and Peak Flow Factor Flow Rates (Separate Light and Heavy Vehicles) Site:Robert Ferrie-N-New Dundee-Weekday AM 2018 Mov Left Through Right ID LV HV LV HV LV HV Demand flows in veh/h as used by the program East: New Dundee Road 6T T R R North: Robert Ferrie Drive 7L L R R West: New Dundee Road 5L L T T Unit Time for Volumes = 60 minutes Peak Flow Period = 15 minutes Flow Rates include effects of Flow Scale and Peak Flow Factor Flow Rates (Total Vehicles and Percent Heavy) Site:Robert Ferrie-N-New Dundee-Weekday AM 2018
195 Page 10 of /09/ Mov Left Through Right ID Total %HV Total %HV Total %HV --- Demand flows in veh/h as used by the program East: New Dundee Road 6T T R R North: Robert Ferrie Drive 7L L R R West: New Dundee Road 5L L T T Unit Time for Volumes = 60 minutes Peak Flow Period = 15 minutes Flow Rates include effects of Flow Scale and Peak Flow Factor Other Model Settings Site:Robert Ferrie-N-New Dundee-Weekday AM 2018 * Basic Parameters: Intersection Type: Driving on the right-hand side of the road Input data specified in Metric units Model Defaults: US HCM (Metric) Peak Flow Period (for performance): 15 minutes Unit time (for volumes): 60 minutes. HCM Delay Model option used HCM Queue Model option used Level of Service based on: Delay (HCM 2000) Queue percentile: 95% Parameters Used in Cost Calculations Site:Robert Ferrie-N-New Dundee-Weekday AM 2018 Pump price of fuel ($/L) = Fuel resource cost factor = 0.70 Ratio of running cost to fuel cost = 3.0 Average income ($/h) = Time value factor = 0.40 Light vehicle mass (1000 kg) = 1.4 Heavy vehicle mass (1000 kg) = 11.0 Light vehicle idle fuel rate (L/h) = Heavy vehicle idle fuel rate (L/h) = Diagnostics Site:Robert Ferrie-N-New Dundee-Weekday AM 2018 Geometric delay is less than 2 seconds for some movements. The negotiation speed may be too high or the approach and exit speeds may be too low for given geometric design (e.g. for a large roundabout). Check Detailed Output for geometric delay data including negotiation speeds.
196 Page 11 of /09/29 If necessary, specify appropriate values of approach and exit speeds, negotiation radius or negotiation speed data in the Path Data dialog. Processed: September 28, :49:12 PM Copyright Akcelik and Associates Pty Ltd SIDRA INTERSECTION Project: H:\DATA\ Transportation Planning\Working\Strasburg Road\SIDRA Files\PC\Robert Ferrie Drive and New Dundee Road BASE.sip , SNC-LAVALIN INC, SINGLE
197 Page 1 of /09/29 DETAILED OUTPUT Robert Ferrie Drive and New Dundee Road Base Case Robert Ferrie-N-New Dundee- Weekday PM 2018 OUTPUT TABLE LINKS s Basic Parameters Gap Acceptance Parameters Movements Movement Capacity Parameters Movement Performance Fuel Consumption, Emissions and Cost (Total) Fuel Consumption, Emissions and Cost (Rate) Intersection Negotiation Data Movement Speeds and Geometric Delay Lanes Lane Performance Lane Flow and Capacity Information Lane, Approach and Intersection Performance Driver Characteristics Lane Delays Lane Queues (Vehicles) Lane Queues (Distance) Lane Queue Percentiles (Vehicles) Lane Queue Percentiles (Distance) Lane Stops Flow Rates and Demand Analysis Movement Definitions and Flow Rates (O-D) Flow Rates (Separate Light and Heavy Vehicles) Flow Rates (Total Vehicles and Percent Heavy) Other Model Settings Parameters Used in Cost Calculations Diagnostics s Basic Parameters Site:Robert Ferrie-N-New Dundee-Weekday PM Circulating/Exiting Stream Cent Circ Insc Ent Ent Cir Ent Av.Ent Island Width Diam. Rad Ang Lan Lan Lane Flow %HV Adjust. %Exit Cap. O-D Diam Width Flow Incl. Constr. Factor m m m m deg m veh/h pcu/h Effect East: New Dundee Road Environment Factor: 1.20 Entry/Circulating Flow Adjustment: Medium N North: Robert Ferrie Drive Environment Factor: 1.20 Entry/Circulating Flow Adjustment: Medium N West: New Dundee Road Environment Factor: 1.20 Entry/Circulating Flow Adjustment: Medium N 0.988
198 Page 2 of /09/ Capacity Model: SIDRA Standard HV Method for Gap Acceptance: Include HV Effect for all percentages Gap Acceptance Parameters Site:Robert Ferrie-N-New Dundee-Weekday PM Turn Lane Lane ---- Circulating/Exiting Stream --- Critical Gap No. Type Flow Aver Aver In-Bnch Prop Foll-up Rate Speed Dist Headway Bunched Hdwy Dist Headway pcu/h km/h m sec sec m sec East: New Dundee Road Environment Factor: 1.20 Entry/Circulating Flow Adjustment: Medium Thru 1 Subdominant Dominant Right 2 Dominant North: Robert Ferrie Drive Environment Factor: 1.20 Entry/Circulating Flow Adjustment: Medium Left 1 Dominant Right 1 Dominant West: New Dundee Road Environment Factor: 1.20 Entry/Circulating Flow Adjustment: Medium Left 1 Subdominant Thru 1 Subdominant Dominant Capacity Model: SIDRA Standard P Priority sharing is implied for some movements (Follow-up Headway plus Intra-bunch Headway is larger than the Critical Gap). The O-D Factor ( Basic Parameters table) allows for priority sharing and priority emphasis. Dist (Distance): Spacing, i.e. distance between the front ends of two successive vehicles across all lanes in the circulating or exiting stream Movements Movement Capacity Parameters Site:Robert Ferrie-N-New Dundee-Weekday PM Mov Opposing Movement Total Prac. Prac. Lane Deg. ID Demand Adjust. Cap. Deg. Spare Util Satn Flow HV Flow HV Flow Satn Cap. veh/h % veh/h % pcu/h veh/h xp % % x East: New Dundee Road 6T T * 6R R * North: Robert Ferrie Drive 7L L R R West: New Dundee Road 5L L T T * Maximum degree of saturation
199 Page 3 of /09/29 Movement Performance Site:Robert Ferrie-N-New Dundee-Weekday PM Mov Total Total Aver. Eff. Total Perf. Tot.Trav. Tot.Trav. Aver. ID Delay Delay Delay Stop Stops Index Distance Time Speed (veh-h/h)(pers-h/h)(sec) Rate (veh-km/h)(veh-h/h) (km/h) East: New Dundee Road 6T T R R North: Robert Ferrie Drive 7L L R R West: New Dundee Road 5L L T T Fuel Consumption, Emissions and Cost (Total) Site:Robert Ferrie-N-New Dundee-Weekday PM 2018 Mov Cost Fuel CO2 CO HC NOX ID Total Total Total Total Total Total $/h L/h kg/h kg/h kg/h kg/h East: New Dundee Road 6T T R R North: Robert Ferrie Drive 7L L R R West: New Dundee Road 5L L T T INTERSECTION: Fuel Consumption, Emissions and Cost (Rate) Site:Robert Ferrie-N-New Dundee-Weekday PM 2018 Mov Cost Fuel CO2 CO HC NOX ID Rate Rate Rate Rate Rate Rate $/km L/100km g/km g/km g/km g/km East: New Dundee Road 6T T R R
200 Page 4 of /09/29 North: Robert Ferrie Drive 7L L R R West: New Dundee Road 5L L T T INTERSECTION: Intersection Negotiation Data Site:Robert Ferrie-N-New Dundee-Weekday PM Negn Negn Negn Appr. Downstream Distance From To Radius Speed Dist. Dist Approach Approach Turn m km/h m m m User Spec? East: New Dundee Road North Right No West Thru No North: Robert Ferrie Drive East Left No West Right No West: New Dundee Road East Thru No North Left No Maximum Negotiation (Design) Speed = 50.0 km/h Downstream distance is distance travelled from the stopline until exit cruise speed is reached (includes negotiation distance). Acceleration distance is weighted for light and heavy vehicles. The same distance applies for both stopped and unstopped vehicles. Movement Speeds and Geometric Delay Site:Robert Ferrie-N-New Dundee-Weekday PM Queue Move-up App. Speeds Exit Speeds Av. Section Spd Geom Mov st 2nd Delay ID Cruise Negn Negn Cruise Grn Grn Running Overall sec East: New Dundee Road 6T T R R North: Robert Ferrie Drive 7L L R R West: New Dundee Road 5L L T T "Running Speed" is the average speed excluding stopped periods. HCM Delay Formula option used: Geometric Delay is not included in Control Delay.
201 Page 5 of /09/29 Lanes Lane Performance Site:Robert Ferrie-N-New Dundee-Weekday PM 2018 Q u e u e Flow Cap Deg. Aver. Eff. 95% Back Lane Lane Satn Delay Stop Length No. veh/h veh/h x sec Rate veh m m East: New Dundee Road 1 T TR North: Robert Ferrie Drive 1 LR West: New Dundee Road 1 LT T Lane Flow and Capacity Information Site:Robert Ferrie-N-New Dundee-Weekday PM Lane Dem Flow (veh/h) Min Tot Deg. Lane No Cap Cap Satn Util Lef Thru Rig Tot veh/h veh/h x % East: New Dundee Road 1 T TR North: Robert Ferrie Drive 1 LR West: New Dundee Road 1 LT T The capacity value for priority and continuous movements is obtained by adjusting the basic saturation flow for heavy vehicle and turning vehicle effects. Saturation flow scale applies if specified. Lane, Approach and Intersection Performance Site:Robert Ferrie-N-New Dundee-Weekday PM Lane Demand Flow (veh/h) Adj. Eff Grn Deg Aver. Longest Shrt No %HV Basic (sec) Sat Delay Queue Lane L T R Tot Satf. 1st 2nd x sec m m East: New Dundee Road 1 T TR
202 Page 6 of /09/ North: Robert Ferrie Drive 1 LR West: New Dundee Road 1 LT T ========================================================================== ALL VEHICLES Total % Max Aver. Max Flow HV X Delay Queue ========================================================================== Peak flow period = 15 minutes. Queue values in this table are 95% queue (metres) Note: Basic Saturation Flows are not adjusted at roundabouts or signcontrolled intersections and apply only to continuous lanes. Driver Characteristics Site:Robert Ferrie-N-New Dundee-Weekday PM Average Driver Lane Satn Satn Satn Satn Queue Response No. Speed Flow Hdwy Spacing Space Time km/h veh/h sec m m sec East: New Dundee Road 1 T TR North: Robert Ferrie Drive 1 LR West: New Dundee Road 1 LT T Saturation Flow and Saturation Headway are derived from follow-up headway. Lane Delays Site:Robert Ferrie-N-New Dundee-Weekday PM Delay (seconds/veh) Deg. Stop-line Delay Acc. Queuing Stopd Lane Satn 1st 2nd Total Dec. Total MvUp (Idle) Geom Control No. x d1 d2 dsl dn dq dqm di dig dic East: New Dundee Road 1 T TR North: Robert Ferrie Drive 1 LR West: New Dundee Road 1 LT T HCM Delay Formula option used: (i) Control Delay does not include Geometric Delay, (ii) Stop-line Delay is treated as being same as Control Delay.
203 Page 7 of /09/29 dsl: Stop-line delay (=d1+d2) dn: Average stop-start delay for all vehicles queued and unqueued dq: Queuing delay (the part of the stop-line delay that includes stopped delay and queue move-up delay) dqm: Queue move-up delay di: Stopped delay (stopped (idling) time at near-zero speed) dig: Geometric delay dic: Intersection control delay (sum of stop-line and geometric delays) Geometric delay is less than 2 seconds for some movements. The negotiation speed may be too high or the approach and exit speeds may be too low for given geometric design (e.g. for a large roundabout). Check Detailed Output for geometric delay data including negotiation speeds. If necessary, specify appropriate values of approach and exit speeds, negotiation radius or negotiation speed data in the Path Data dialog. Lane Queues (Vehicles) Site:Robert Ferrie-N-New Dundee-Weekday PM Deg. Ovrfl. Back of Queue (veh) Queue Prob. P'ile Cyc-Av. Queue Lane Satn Queue Stor. Block Block No. x No Nb1 Nb2 Nb 95% Ratio % % Nc 95% East: New Dundee Road 1 T TR North: Robert Ferrie Drive 1 LR West: New Dundee Road 1 LT T HCM Delay Formula option used: Cycle-Average Queue is calculated using average delay from the HCM equation. (i.e. HCM delays are treated as stop-line delays for this purpose). SIDRA Standard models are used for Back of Queue estimation since HCM only gives Cycle-Average Queues for unsignalised intersections. Lane Queues (Distance) Site:Robert Ferrie-N-New Dundee-Weekday PM Deg. Ovrfl. Back of Queue (m) Queue Prob. P'ile Cyc-Av. Queue Lane Satn Queue Stor. Block Block No. x No Nb1 Nb2 Nb 95% Ratio % % Nc 95% East: New Dundee Road 1 T TR North: Robert Ferrie Drive 1 LR West: New Dundee Road 1 LT T HCM Delay Formula option used: Cycle-Average Queue is calculated using average delay from the HCM equation. (i.e. HCM delays are treated as stop-line delays for this purpose). SIDRA Standard models are used for Back of Queue estimation since HCM only gives Cycle-Average Queues for unsignalised intersections.
204 Page 8 of /09/29 Lane Queue Percentiles (Vehicles) Site:Robert Ferrie-N-New Dundee-Weekday PM Deg. Percentile Back of Queue (veh) Lane Satn No. x 50% 70% 85% 90% 95% 98% East: New Dundee Road 1 T TR North: Robert Ferrie Drive 1 LR West: New Dundee Road 1 LT T SIDRA Standard models are used for Back of Queue estimation since HCM only gives Cycle-Average Queues for unsignalised intersections. Lane Queue Percentiles (Distance) Site:Robert Ferrie-N-New Dundee-Weekday PM Deg. Percentile Back of Queue (metres) Lane Satn No. x 50% 70% 85% 90% 95% 98% East: New Dundee Road 1 T TR North: Robert Ferrie Drive 1 LR West: New Dundee Road 1 LT T SIDRA Standard models are used for Back of Queue estimation since HCM only gives Cycle-Average Queues for unsignalised intersections. Lane Stops Site:Robert Ferrie-N-New Dundee-Weekday PM Queue Total Deg. -- Effective Stop Rate -- Total Move-up Queue Prop. Lane Satn Geom. Overall Stops Rate Move-ups Queued No. x he1 he2 hig h H hqm Hqm pq East: New Dundee Road 1 T TR North: Robert Ferrie Drive 1 LR
205 Page 9 of /09/29 West: New Dundee Road 1 LT T hig is the average value for all movements in a shared lane hqm is average queue move-up rate for all vehicles queued and unqueued Flow Rates and Demand Analysis Movement Definitions and Flow Rates (O-D) Site:Robert Ferrie-N-New Dundee-Weekday PM From To Mov Flow Rate Flow Scale Peak Flow Approach Approach ID Turn LV HV Fixed Var Factor East: New Dundee Road North 6R Right West 6T Thru North: Robert Ferrie Drive East 7L Left West 4R Right West: New Dundee Road East 2T Thru North 5L Left Unit Time for Volumes = 60 minutes Peak Flow Period = 15 minutes Flow Rates include effects of Flow Scale and Peak Flow Factor Flow Rates (Separate Light and Heavy Vehicles) Site:Robert Ferrie-N-New Dundee-Weekday PM 2018 Mov Left Through Right ID LV HV LV HV LV HV Demand flows in veh/h as used by the program East: New Dundee Road 6T T R R North: Robert Ferrie Drive 7L L R R West: New Dundee Road 5L L T T Unit Time for Volumes = 60 minutes Peak Flow Period = 15 minutes Flow Rates include effects of Flow Scale and Peak Flow Factor Flow Rates (Total Vehicles and Percent Heavy) Site:Robert Ferrie-N-New Dundee-Weekday PM 2018
206 Page 10 of /09/ Mov Left Through Right ID Total %HV Total %HV Total %HV --- Demand flows in veh/h as used by the program East: New Dundee Road 6T T R R North: Robert Ferrie Drive 7L L R R West: New Dundee Road 5L L T T Unit Time for Volumes = 60 minutes Peak Flow Period = 15 minutes Flow Rates include effects of Flow Scale and Peak Flow Factor Other Model Settings Site:Robert Ferrie-N-New Dundee-Weekday PM 2018 * Basic Parameters: Intersection Type: Driving on the right-hand side of the road Input data specified in Metric units Model Defaults: US HCM (Metric) Peak Flow Period (for performance): 15 minutes Unit time (for volumes): 60 minutes. HCM Delay Model option used HCM Queue Model option used Level of Service based on: Delay (HCM 2000) Queue percentile: 95% Parameters Used in Cost Calculations Site:Robert Ferrie-N-New Dundee-Weekday PM 2018 Pump price of fuel ($/L) = Fuel resource cost factor = 0.70 Ratio of running cost to fuel cost = 3.0 Average income ($/h) = Time value factor = 0.40 Light vehicle mass (1000 kg) = 1.4 Heavy vehicle mass (1000 kg) = 11.0 Light vehicle idle fuel rate (L/h) = Heavy vehicle idle fuel rate (L/h) = Diagnostics Site:Robert Ferrie-N-New Dundee-Weekday PM 2018 Geometric delay is less than 2 seconds for some movements. The negotiation speed may be too high or the approach and exit speeds may be too low for given geometric design (e.g. for a large roundabout). Check Detailed Output for geometric delay data including negotiation speeds.
207 Page 11 of /09/29 If necessary, specify appropriate values of approach and exit speeds, negotiation radius or negotiation speed data in the Path Data dialog. Processed: September 28, :49:40 PM Copyright Akcelik and Associates Pty Ltd SIDRA INTERSECTION Project: H:\DATA\ Transportation Planning\Working\Strasburg Road\SIDRA Files\PC\Robert Ferrie Drive and New Dundee Road BASE.sip , SNC-LAVALIN INC, SINGLE
208 Page 1 of /10/14 DETAILED OUTPUT Strasburg Road-N-Robert Ferrie Drive Base Case Strasburg Road-N-Robert Ferrie Drive-Weekday AM 2018 OUTPUT TABLE LINKS s Basic Parameters Gap Acceptance Parameters Movements Movement Capacity Parameters Movement Performance Fuel Consumption, Emissions and Cost (Total) Fuel Consumption, Emissions and Cost (Rate) Intersection Negotiation Data Movement Speeds and Geometric Delay Lanes Lane Performance Lane Flow and Capacity Information Lane, Approach and Intersection Performance Driver Characteristics Lane Delays Lane Queues (Vehicles) Lane Queues (Distance) Lane Queue Percentiles (Vehicles) Lane Queue Percentiles (Distance) Lane Stops Flow Rates and Demand Analysis Movement Definitions and Flow Rates (O-D) Flow Rates (Separate Light and Heavy Vehicles) Flow Rates (Total Vehicles and Percent Heavy) Other Model Settings Parameters Used in Cost Calculations Diagnostics s Basic Parameters Site:Strasburg Road-N-Robert Ferrie Drive-Weekday AM Circulating/Exiting Stream Cent Circ Insc Ent Ent Cir Ent Av.Ent Island Width Diam. Rad Ang Lan Lan Lane Flow %HV Adjust. %Exit Cap. O-D Diam Width Flow Incl. Constr. Factor m m m m deg m veh/h pcu/h Effect Environment Factor: 1.20 Entry/Circulating Flow Adjustment: Medium N East: Robert Ferrie Drive Environment Factor: 1.20 Entry/Circulating Flow Adjustment: Medium N Environment Factor: 1.20 Entry/Circulating Flow Adjustment: Medium N 0.966
209 Page 2 of /10/ Capacity Model: SIDRA Standard HV Method for Gap Acceptance: Include HV Effect for all percentages Gap Acceptance Parameters Site:Strasburg Road-N-Robert Ferrie Drive-Weekday AM Turn Lane Lane ---- Circulating/Exiting Stream --- Critical Gap No. Type Flow Aver Aver In-Bnch Prop Foll-up Rate Speed Dist Headway Bunched Hdwy Dist Headway pcu/h km/h m sec sec m sec Environment Factor: 1.20 Entry/Circulating Flow Adjustment: Medium Thru 1 Subdominant Dominant Right 2 Dominant East: Robert Ferrie Drive Environment Factor: 1.20 Entry/Circulating Flow Adjustment: Medium Left 1 Subdominant Right 2 Dominant Environment Factor: 1.20 Entry/Circulating Flow Adjustment: Medium Left 1 Subdominant D Thru 1 Subdominant D 2 Dominant Capacity Model: SIDRA Standard P Priority sharing is implied for some movements (Follow-up Headway plus Intra-bunch Headway is larger than the Critical Gap). The O-D Factor ( Basic Parameters table) allows for priority sharing and priority emphasis. D Subdominant lane follow-up headway was calculated as less than the dominant lane value and was set to the dominant lane value Dist (Distance): Spacing, i.e. distance between the front ends of two successive vehicles across all lanes in the circulating or exiting stream Movements Movement Capacity Parameters Site:Strasburg Road-N-Robert Ferrie Drive-Weekday AM Mov Opposing Movement Total Prac. Prac. Lane Deg. ID Demand Adjust. Cap. Deg. Spare Util Satn Flow HV Flow HV Flow Satn Cap. veh/h % veh/h % pcu/h veh/h xp % % x T T R R East: Robert Ferrie Drive 1L L R R * L L T T * Maximum degree of saturation
210 Page 3 of /10/14 Movement Performance Site:Strasburg Road-N-Robert Ferrie Drive-Weekday AM Mov Total Total Aver. Eff. Total Perf. Tot.Trav. Tot.Trav. Aver. ID Delay Delay Delay Stop Stops Index Distance Time Speed (veh-h/h)(pers-h/h)(sec) Rate (veh-km/h)(veh-h/h) (km/h) T T R R East: Robert Ferrie Drive 1L L R R L L T T Fuel Consumption, Emissions and Cost (Total) Site:Strasburg Road-N-Robert Ferrie Drive-Weekday AM 2018 Mov Cost Fuel CO2 CO HC NOX ID Total Total Total Total Total Total $/h L/h kg/h kg/h kg/h kg/h 8T T R R East: Robert Ferrie Drive 1L L R R L L T T INTERSECTION: Fuel Consumption, Emissions and Cost (Rate) Site:Strasburg Road-N-Robert Ferrie Drive-Weekday AM 2018 Mov Cost Fuel CO2 CO HC NOX ID Rate Rate Rate Rate Rate Rate $/km L/100km g/km g/km g/km g/km 8T T R R
211 Page 4 of /10/ East: Robert Ferrie Drive 1L L R R L L T T INTERSECTION: Intersection Negotiation Data Site:Strasburg Road-N-Robert Ferrie Drive-Weekday AM Negn Negn Negn Appr. Downstream Distance From To Radius Speed Dist. Dist Approach Approach Turn m km/h m m m User Spec? East Right No North Thru No East: Robert Ferrie Drive South Left No North Right No South Thru No East Left No Maximum Negotiation (Design) Speed = 50.0 km/h Downstream distance is distance travelled from the stopline until exit cruise speed is reached (includes negotiation distance). Acceleration distance is weighted for light and heavy vehicles. The same distance applies for both stopped and unstopped vehicles. Movement Speeds and Geometric Delay Site:Strasburg Road-N-Robert Ferrie Drive-Weekday AM Queue Move-up App. Speeds Exit Speeds Av. Section Spd Geom Mov st 2nd Delay ID Cruise Negn Negn Cruise Grn Grn Running Overall sec T T R R East: Robert Ferrie Drive 1L L R R L L T T "Running Speed" is the average speed excluding stopped periods. HCM Delay Formula option used: Geometric Delay is not included in Control Delay.
212 Page 5 of /10/14 Lanes Lane Performance Site:Strasburg Road-N-Robert Ferrie Drive-Weekday AM 2018 Q u e u e Flow Cap Deg. Aver. Eff. 95% Back Lane Lane Satn Delay Stop Length No. veh/h veh/h x sec Rate veh m m 1 T TR East: Robert Ferrie Drive 1 L R T 1 LT T T Short lane due to specification of Turn Bay Lane Flow and Capacity Information Site:Strasburg Road-N-Robert Ferrie Drive-Weekday AM Lane Dem Flow (veh/h) Min Tot Deg. Lane No Cap Cap Satn Util Lef Thru Rig Tot veh/h veh/h x % T TR East: Robert Ferrie Drive 1 L R LT T The capacity value for priority and continuous movements is obtained by adjusting the basic saturation flow for heavy vehicle and turning vehicle effects. Saturation flow scale applies if specified. Lane, Approach and Intersection Performance Site:Strasburg Road-N-Robert Ferrie Drive-Weekday AM Lane Demand Flow (veh/h) Adj. Eff Grn Deg Aver. Longest Shrt No %HV Basic (sec) Sat Delay Queue Lane L T R Tot Satf. 1st 2nd x sec m m
213 Page 6 of /10/14 1 T TR East: Robert Ferrie Drive 1 L R LT T ========================================================================== ALL VEHICLES Total % Max Aver. Max Flow HV X Delay Queue ========================================================================== Peak flow period = 15 minutes. Queue values in this table are 95% queue (metres) Note: Basic Saturation Flows are not adjusted at roundabouts or signcontrolled intersections and apply only to continuous lanes. Driver Characteristics Site:Strasburg Road-N-Robert Ferrie Drive-Weekday AM Average Driver Lane Satn Satn Satn Satn Queue Response No. Speed Flow Hdwy Spacing Space Time km/h veh/h sec m m sec T TR East: Robert Ferrie Drive 1 L R NA - Short Lane LT T Saturation Flow and Saturation Headway are derived from follow-up headway. Lane Delays Site:Strasburg Road-N-Robert Ferrie Drive-Weekday AM Delay (seconds/veh) Deg. Stop-line Delay Acc. Queuing Stopd Lane Satn 1st 2nd Total Dec. Total MvUp (Idle) Geom Control No. x d1 d2 dsl dn dq dqm di dig dic T TR East: Robert Ferrie Drive 1 L R
214 Page 7 of /10/14 1 LT T HCM Delay Formula option used: (i) Control Delay does not include Geometric Delay, (ii) Stop-line Delay is treated as being same as Control Delay. dsl: Stop-line delay (=d1+d2) dn: Average stop-start delay for all vehicles queued and unqueued dq: Queuing delay (the part of the stop-line delay that includes stopped delay and queue move-up delay) dqm: Queue move-up delay di: Stopped delay (stopped (idling) time at near-zero speed) dig: Geometric delay dic: Intersection control delay (sum of stop-line and geometric delays) Lane Queues (Vehicles) Site:Strasburg Road-N-Robert Ferrie Drive-Weekday AM Deg. Ovrfl. Back of Queue (veh) Queue Prob. P'ile Cyc-Av. Queue Lane Satn Queue Stor. Block Block No. x No Nb1 Nb2 Nb 95% Ratio % % Nc 95% T TR East: Robert Ferrie Drive 1 L R LT T HCM Delay Formula option used: Cycle-Average Queue is calculated using average delay from the HCM equation. (i.e. HCM delays are treated as stop-line delays for this purpose). SIDRA Standard models are used for Back of Queue estimation since HCM only gives Cycle-Average Queues for unsignalised intersections. Lane Queues (Distance) Site:Strasburg Road-N-Robert Ferrie Drive-Weekday AM Deg. Ovrfl. Back of Queue (m) Queue Prob. P'ile Cyc-Av. Queue Lane Satn Queue Stor. Block Block No. x No Nb1 Nb2 Nb 95% Ratio % % Nc 95% T TR East: Robert Ferrie Drive 1 L R LT T HCM Delay Formula option used: Cycle-Average Queue is calculated using average delay from the HCM equation. (i.e. HCM delays are treated as stop-line delays for this purpose). SIDRA Standard models are used for Back of Queue estimation since
215 Page 8 of /10/14 HCM only gives Cycle-Average Queues for unsignalised intersections. Lane Queue Percentiles (Vehicles) Site:Strasburg Road-N-Robert Ferrie Drive-Weekday AM Deg. Percentile Back of Queue (veh) Lane Satn No. x 50% 70% 85% 90% 95% 98% T TR East: Robert Ferrie Drive 1 L R LT T SIDRA Standard models are used for Back of Queue estimation since HCM only gives Cycle-Average Queues for unsignalised intersections. Lane Queue Percentiles (Distance) Site:Strasburg Road-N-Robert Ferrie Drive-Weekday AM Deg. Percentile Back of Queue (metres) Lane Satn No. x 50% 70% 85% 90% 95% 98% T TR East: Robert Ferrie Drive 1 L R LT T SIDRA Standard models are used for Back of Queue estimation since HCM only gives Cycle-Average Queues for unsignalised intersections. Lane Stops Site:Strasburg Road-N-Robert Ferrie Drive-Weekday AM Queue Total Deg. -- Effective Stop Rate -- Total Move-up Queue Prop. Lane Satn Geom. Overall Stops Rate Move-ups Queued No. x he1 he2 hig h H hqm Hqm pq T TR
216 Page 9 of /10/ East: Robert Ferrie Drive 1 L R LT T hig is the average value for all movements in a shared lane hqm is average queue move-up rate for all vehicles queued and unqueued Flow Rates and Demand Analysis Movement Definitions and Flow Rates (O-D) Site:Strasburg Road-N-Robert Ferrie Drive-Weekday AM From To Mov Flow Rate Flow Scale Peak Flow Approach Approach ID Turn LV HV Fixed Var Factor East 8R Right North 8T Thru East: Robert Ferrie Drive South 1L Left North 6R Right South 4T Thru East 7L Left Unit Time for Volumes = 60 minutes Peak Flow Period = 15 minutes Flow Rates include effects of Flow Scale and Peak Flow Factor Flow Rates (Separate Light and Heavy Vehicles) Site:Strasburg Road-N-Robert Ferrie Drive-Weekday AM 2018 Mov Left Through Right ID LV HV LV HV LV HV Demand flows in veh/h as used by the program 8T T R R East: Robert Ferrie Drive 1L L R R L L T T Unit Time for Volumes = 60 minutes Peak Flow Period = 15 minutes Flow Rates include effects of Flow Scale and Peak Flow Factor
217 Page 10 of /10/14 Flow Rates (Total Vehicles and Percent Heavy) Site:Strasburg Road-N-Robert Ferrie Drive-Weekday AM Mov Left Through Right ID Total %HV Total %HV Total %HV --- Demand flows in veh/h as used by the program 8T T R R East: Robert Ferrie Drive 1L L R R L L T T Unit Time for Volumes = 60 minutes Peak Flow Period = 15 minutes Flow Rates include effects of Flow Scale and Peak Flow Factor Other Model Settings Site:Strasburg Road-N-Robert Ferrie Drive-Weekday AM 2018 * Basic Parameters: Intersection Type: Driving on the right-hand side of the road Input data specified in Metric units Model Defaults: US HCM (Metric) Peak Flow Period (for performance): 15 minutes Unit time (for volumes): 60 minutes. HCM Delay Model option used HCM Queue Model option used Level of Service based on: Delay (HCM 2000) Queue percentile: 95% Parameters Used in Cost Calculations Site:Strasburg Road-N-Robert Ferrie Drive-Weekday AM 2018 Pump price of fuel ($/L) = Fuel resource cost factor = 0.70 Ratio of running cost to fuel cost = 3.0 Average income ($/h) = Time value factor = 0.40 Light vehicle mass (1000 kg) = 1.4 Heavy vehicle mass (1000 kg) = 11.0 Light vehicle idle fuel rate (L/h) = Heavy vehicle idle fuel rate (L/h) = Diagnostics
218 Page 11 of /10/14 Site:Strasburg Road-N-Robert Ferrie Drive-Weekday AM 2018 Processed: October 14, :03:39 PM Copyright Akcelik and Associates Pty Ltd SIDRA INTERSECTION Project: H:\DATA\ Transportation Planning\Working\Strasburg Road\SIDRA Files\PC\Robert Ferrie Drive and Strasburg Road BASE.sip , SNC-LAVALIN INC, SINGLE
219 Page 1 of /10/14 DETAILED OUTPUT Strasburg Road-N-Robert Ferrie Drive Strasburg Road-N-Robert Ferrie Drive-Weekday PM 2018 OUTPUT TABLE LINKS s Basic Parameters Gap Acceptance Parameters Movements Movement Capacity Parameters Movement Performance Fuel Consumption, Emissions and Cost (Total) Fuel Consumption, Emissions and Cost (Rate) Intersection Negotiation Data Movement Speeds and Geometric Delay Lanes Lane Performance Lane Flow and Capacity Information Lane, Approach and Intersection Performance Driver Characteristics Lane Delays Lane Queues (Vehicles) Lane Queues (Distance) Lane Queue Percentiles (Vehicles) Lane Queue Percentiles (Distance) Lane Stops Flow Rates and Demand Analysis Movement Definitions and Flow Rates (O-D) Flow Rates (Separate Light and Heavy Vehicles) Flow Rates (Total Vehicles and Percent Heavy) Other Model Settings Parameters Used in Cost Calculations Diagnostics s Basic Parameters Site:Strasburg Road-N-Robert Ferrie Drive-Weekday PM Circulating/Exiting Stream Cent Circ Insc Ent Ent Cir Ent Av.Ent Island Width Diam. Rad Ang Lan Lan Lane Flow %HV Adjust. %Exit Cap. O-D Diam Width Flow Incl. Constr. Factor m m m m deg m veh/h pcu/h Effect Environment Factor: 1.20 Entry/Circulating Flow Adjustment: Medium N East: Robert Ferrie Drive Environment Factor: 1.20 Entry/Circulating Flow Adjustment: Medium N Environment Factor: 1.20 Entry/Circulating Flow Adjustment: Medium N
220 Page 2 of /10/14 Capacity Model: SIDRA Standard HV Method for Gap Acceptance: Include HV Effect for all percentages Gap Acceptance Parameters Site:Strasburg Road-N-Robert Ferrie Drive-Weekday PM Turn Lane Lane ---- Circulating/Exiting Stream --- Critical Gap No. Type Flow Aver Aver In-Bnch Prop Foll-up Rate Speed Dist Headway Bunched Hdwy Dist Headway pcu/h km/h m sec sec m sec Environment Factor: 1.20 Entry/Circulating Flow Adjustment: Medium Thru 1 Subdominant D 2 Dominant Right 2 Dominant East: Robert Ferrie Drive Environment Factor: 1.20 Entry/Circulating Flow Adjustment: Medium Left 1 Subdominant Right 2 Dominant Environment Factor: 1.20 Entry/Circulating Flow Adjustment: Medium Left 1 Subdominant Thru 1 Subdominant Dominant Capacity Model: SIDRA Standard P Priority sharing is implied for some movements (Follow-up Headway plus Intra-bunch Headway is larger than the Critical Gap). The O-D Factor ( Basic Parameters table) allows for priority sharing and priority emphasis. D Subdominant lane follow-up headway was calculated as less than the dominant lane value and was set to the dominant lane value Dist (Distance): Spacing, i.e. distance between the front ends of two successive vehicles across all lanes in the circulating or exiting stream Movements Movement Capacity Parameters Site:Strasburg Road-N-Robert Ferrie Drive-Weekday PM Mov Opposing Movement Total Prac. Prac. Lane Deg. ID Demand Adjust. Cap. Deg. Spare Util Satn Flow HV Flow HV Flow Satn Cap. veh/h % veh/h % pcu/h veh/h xp % % x T T R R East: Robert Ferrie Drive 1L L R R L L * 4T T * * Maximum degree of saturation
221 Page 3 of /10/14 Movement Performance Site:Strasburg Road-N-Robert Ferrie Drive-Weekday PM Mov Total Total Aver. Eff. Total Perf. Tot.Trav. Tot.Trav. Aver. ID Delay Delay Delay Stop Stops Index Distance Time Speed (veh-h/h)(pers-h/h)(sec) Rate (veh-km/h)(veh-h/h) (km/h) T T R R East: Robert Ferrie Drive 1L L R R L L T T Fuel Consumption, Emissions and Cost (Total) Site:Strasburg Road-N-Robert Ferrie Drive-Weekday PM 2018 Mov Cost Fuel CO2 CO HC NOX ID Total Total Total Total Total Total $/h L/h kg/h kg/h kg/h kg/h 8T T R R East: Robert Ferrie Drive 1L L R R L L T T INTERSECTION: Fuel Consumption, Emissions and Cost (Rate) Site:Strasburg Road-N-Robert Ferrie Drive-Weekday PM 2018 Mov Cost Fuel CO2 CO HC NOX ID Rate Rate Rate Rate Rate Rate $/km L/100km g/km g/km g/km g/km 8T T R R
222 Page 4 of /10/14 East: Robert Ferrie Drive 1L L R R L L T T INTERSECTION: Intersection Negotiation Data Site:Strasburg Road-N-Robert Ferrie Drive-Weekday PM Negn Negn Negn Appr. Downstream Distance From To Radius Speed Dist. Dist Approach Approach Turn m km/h m m m User Spec? East Right No North Thru No East: Robert Ferrie Drive South Left No North Right No South Thru No East Left No Maximum Negotiation (Design) Speed = 50.0 km/h Downstream distance is distance travelled from the stopline until exit cruise speed is reached (includes negotiation distance). Acceleration distance is weighted for light and heavy vehicles. The same distance applies for both stopped and unstopped vehicles. Movement Speeds and Geometric Delay Site:Strasburg Road-N-Robert Ferrie Drive-Weekday PM Queue Move-up App. Speeds Exit Speeds Av. Section Spd Geom Mov st 2nd Delay ID Cruise Negn Negn Cruise Grn Grn Running Overall sec T T R R East: Robert Ferrie Drive 1L L R R L L T T "Running Speed" is the average speed excluding stopped periods. HCM Delay Formula option used: Geometric Delay is not included in Control Delay.
223 Page 5 of /10/14 Lanes Lane Performance Site:Strasburg Road-N-Robert Ferrie Drive-Weekday PM 2018 Q u e u e Flow Cap Deg. Aver. Eff. 95% Back Lane Lane Satn Delay Stop Length No. veh/h veh/h x sec Rate veh m m 1 T TR East: Robert Ferrie Drive 1 L R T 1 LT T T Short lane due to specification of Turn Bay Lane Flow and Capacity Information Site:Strasburg Road-N-Robert Ferrie Drive-Weekday PM Lane Dem Flow (veh/h) Min Tot Deg. Lane No Cap Cap Satn Util Lef Thru Rig Tot veh/h veh/h x % T TR East: Robert Ferrie Drive 1 L R LT T The capacity value for priority and continuous movements is obtained by adjusting the basic saturation flow for heavy vehicle and turning vehicle effects. Saturation flow scale applies if specified. Lane, Approach and Intersection Performance Site:Strasburg Road-N-Robert Ferrie Drive-Weekday PM Lane Demand Flow (veh/h) Adj. Eff Grn Deg Aver. Longest Shrt No %HV Basic (sec) Sat Delay Queue Lane L T R Tot Satf. 1st 2nd x sec m m T
224 Page 6 of /10/14 2 TR East: Robert Ferrie Drive 1 L R LT T ========================================================================== ALL VEHICLES Total % Max Aver. Max Flow HV X Delay Queue ========================================================================== Peak flow period = 15 minutes. Queue values in this table are 95% queue (metres) Note: Basic Saturation Flows are not adjusted at roundabouts or signcontrolled intersections and apply only to continuous lanes. Driver Characteristics Site:Strasburg Road-N-Robert Ferrie Drive-Weekday PM Average Driver Lane Satn Satn Satn Satn Queue Response No. Speed Flow Hdwy Spacing Space Time km/h veh/h sec m m sec T TR East: Robert Ferrie Drive 1 L R NA - Short Lane LT T Saturation Flow and Saturation Headway are derived from follow-up headway. Lane Delays Site:Strasburg Road-N-Robert Ferrie Drive-Weekday PM Delay (seconds/veh) Deg. Stop-line Delay Acc. Queuing Stopd Lane Satn 1st 2nd Total Dec. Total MvUp (Idle) Geom Control No. x d1 d2 dsl dn dq dqm di dig dic T TR East: Robert Ferrie Drive 1 L R
225 Page 7 of /10/14 1 LT T HCM Delay Formula option used: (i) Control Delay does not include Geometric Delay, (ii) Stop-line Delay is treated as being same as Control Delay. dsl: Stop-line delay (=d1+d2) dn: Average stop-start delay for all vehicles queued and unqueued dq: Queuing delay (the part of the stop-line delay that includes stopped delay and queue move-up delay) dqm: Queue move-up delay di: Stopped delay (stopped (idling) time at near-zero speed) dig: Geometric delay dic: Intersection control delay (sum of stop-line and geometric delays) Lane Queues (Vehicles) Site:Strasburg Road-N-Robert Ferrie Drive-Weekday PM Deg. Ovrfl. Back of Queue (veh) Queue Prob. P'ile Cyc-Av. Queue Lane Satn Queue Stor. Block Block No. x No Nb1 Nb2 Nb 95% Ratio % % Nc 95% T TR East: Robert Ferrie Drive 1 L R LT T HCM Delay Formula option used: Cycle-Average Queue is calculated using average delay from the HCM equation. (i.e. HCM delays are treated as stop-line delays for this purpose). SIDRA Standard models are used for Back of Queue estimation since HCM only gives Cycle-Average Queues for unsignalised intersections. Lane Queues (Distance) Site:Strasburg Road-N-Robert Ferrie Drive-Weekday PM Deg. Ovrfl. Back of Queue (m) Queue Prob. P'ile Cyc-Av. Queue Lane Satn Queue Stor. Block Block No. x No Nb1 Nb2 Nb 95% Ratio % % Nc 95% T TR East: Robert Ferrie Drive 1 L R LT T HCM Delay Formula option used: Cycle-Average Queue is calculated using average delay from the HCM equation. (i.e. HCM delays are treated as stop-line delays for this purpose). SIDRA Standard models are used for Back of Queue estimation since HCM only gives Cycle-Average Queues for unsignalised intersections.
226 Page 8 of /10/14 Lane Queue Percentiles (Vehicles) Site:Strasburg Road-N-Robert Ferrie Drive-Weekday PM Deg. Percentile Back of Queue (veh) Lane Satn No. x 50% 70% 85% 90% 95% 98% T TR East: Robert Ferrie Drive 1 L R LT T SIDRA Standard models are used for Back of Queue estimation since HCM only gives Cycle-Average Queues for unsignalised intersections. Lane Queue Percentiles (Distance) Site:Strasburg Road-N-Robert Ferrie Drive-Weekday PM Deg. Percentile Back of Queue (metres) Lane Satn No. x 50% 70% 85% 90% 95% 98% T TR East: Robert Ferrie Drive 1 L R LT T SIDRA Standard models are used for Back of Queue estimation since HCM only gives Cycle-Average Queues for unsignalised intersections. Lane Stops Site:Strasburg Road-N-Robert Ferrie Drive-Weekday PM Queue Total Deg. -- Effective Stop Rate -- Total Move-up Queue Prop. Lane Satn Geom. Overall Stops Rate Move-ups Queued No. x he1 he2 hig h H hqm Hqm pq T TR
227 Page 9 of /10/14 East: Robert Ferrie Drive 1 L R LT T hig is the average value for all movements in a shared lane hqm is average queue move-up rate for all vehicles queued and unqueued Flow Rates and Demand Analysis Movement Definitions and Flow Rates (O-D) Site:Strasburg Road-N-Robert Ferrie Drive-Weekday PM From To Mov Flow Rate Flow Scale Peak Flow Approach Approach ID Turn LV HV Fixed Var Factor East 8R Right North 8T Thru East: Robert Ferrie Drive South 1L Left North 6R Right South 4T Thru East 7L Left Unit Time for Volumes = 60 minutes Peak Flow Period = 15 minutes Flow Rates include effects of Flow Scale and Peak Flow Factor Flow Rates (Separate Light and Heavy Vehicles) Site:Strasburg Road-N-Robert Ferrie Drive-Weekday PM 2018 Mov Left Through Right ID LV HV LV HV LV HV Demand flows in veh/h as used by the program 8T T R R East: Robert Ferrie Drive 1L L R R L L T T Unit Time for Volumes = 60 minutes Peak Flow Period = 15 minutes Flow Rates include effects of Flow Scale and Peak Flow Factor
228 Page 10 of /10/14 Flow Rates (Total Vehicles and Percent Heavy) Site:Strasburg Road-N-Robert Ferrie Drive-Weekday PM Mov Left Through Right ID Total %HV Total %HV Total %HV --- Demand flows in veh/h as used by the program 8T T R R East: Robert Ferrie Drive 1L L R R L L T T Unit Time for Volumes = 60 minutes Peak Flow Period = 15 minutes Flow Rates include effects of Flow Scale and Peak Flow Factor Other Model Settings Site:Strasburg Road-N-Robert Ferrie Drive-Weekday PM 2018 * Basic Parameters: Intersection Type: Driving on the right-hand side of the road Input data specified in Metric units Model Defaults: US HCM (Metric) Peak Flow Period (for performance): 15 minutes Unit time (for volumes): 60 minutes. HCM Delay Model option used HCM Queue Model option used Level of Service based on: Delay (HCM 2000) Queue percentile: 95% Parameters Used in Cost Calculations Site:Strasburg Road-N-Robert Ferrie Drive-Weekday PM 2018 Pump price of fuel ($/L) = Fuel resource cost factor = 0.70 Ratio of running cost to fuel cost = 3.0 Average income ($/h) = Time value factor = 0.40 Light vehicle mass (1000 kg) = 1.4 Heavy vehicle mass (1000 kg) = 11.0 Light vehicle idle fuel rate (L/h) = Heavy vehicle idle fuel rate (L/h) = Diagnostics Site:Strasburg Road-N-Robert Ferrie Drive-Weekday PM 2018
229 Page 11 of /10/14 Processed: October 14, :04:18 PM Copyright Akcelik and Associates Pty Ltd SIDRA INTERSECTION Project: H:\DATA\ Transportation Planning\Working\Strasburg Road\SIDRA Files\PC\Robert Ferrie Drive and Strasburg Road BASE.sip , SNC-LAVALIN INC, SINGLE
230 HCM Unsignalized Intersection Capacity Analysis Weekdays AM - Future Total Traffic : New Dundee Road & Collector "A" Option 1 Movement EBL EBT WBT WBR SBL SBR Lane Configurations Sign Control Free Free Stop Grade 0% 0% 0% Volume (veh/h) Peak Hour Factor Hourly flow rate (vph) Pedestrians Lane Width (m) Walking Speed (m/s) Percent Blockage Right turn flare (veh) Median type TWLTL Median storage veh) 1 Upstream signal (m) px, platoon unblocked vc, conflicting volume vc1, stage 1 conf vol 507 vc2, stage 2 conf vol 496 vcu, unblocked vol tc, single (s) tc, 2 stage (s) 5.8 tf (s) p0 queue free % cm capacity (veh/h) Direction, Lane # EB 1 EB 2 WB 1 WB 2 WB 3 SB 1 SB 2 Volume Total Volume Left Volume Right csh Volume to Capacity Queue Length 95th (m) Control Delay (s) Lane LOS A C B Approach Delay (s) Approach LOS B Intersection Summary Average Delay 1.1 Intersection Capacity Utilization 52.4% ICU Level of Service A Analysis Period (min) 15 SNC Lavalin Synchro 6 Report Page 3
231 HCM Unsignalized Intersection Capacity Analysis Weekdays AM - Future Total Traffic : Rockcliffe Drive & Strasburg Road Option 1 Movement EBL EBR NBL NBT SBT SBR Lane Configurations Sign Control Stop Free Free Grade 0% 0% 0% Volume (veh/h) Peak Hour Factor Hourly flow rate (vph) Pedestrians Lane Width (m) Walking Speed (m/s) Percent Blockage Right turn flare (veh) 4 Median type TWLTL Median storage veh) 1 Upstream signal (m) px, platoon unblocked vc, conflicting volume vc1, stage 1 conf vol 562 vc2, stage 2 conf vol 480 vcu, unblocked vol tc, single (s) tc, 2 stage (s) 5.8 tf (s) p0 queue free % cm capacity (veh/h) Direction, Lane # EB 1 NB 1 NB 2 NB 3 SB 1 SB 2 SB 3 Volume Total Volume Left Volume Right csh Volume to Capacity Queue Length 95th (m) Control Delay (s) Lane LOS C A Approach Delay (s) Approach LOS C Intersection Summary Average Delay 3.2 Intersection Capacity Utilization 41.2% ICU Level of Service A Analysis Period (min) 15 SNC Lavalin Synchro 6 Report Page 4
232 Queues Weekdays AM - Future Total Traffic : New Dundee Road & Cameran Road Option 1 Lane Group EBT EBR WBL WBT NBL NBR ø2 Lane Configurations Total Lost Time (s) Satd. Flow (prot) Flt Permitted Satd. Flow (perm) Satd. Flow (RTOR) Volume (vph) Lane Group Flow (vph) Turn Type pm+pt Protected Phases Permitted Phases 8 2 Total Split (s) Act Effct Green (s) Actuated g/c Ratio v/c Ratio Control Delay Queue Delay Total Delay LOS B A B Approach Delay Approach LOS B A B Queue Length 50th (m) Queue Length 95th (m) Internal Link Dist (m) Turn Bay Length (m) Base Capacity (vph) Starvation Cap Reductn Spillback Cap Reductn Storage Cap Reductn Reduced v/c Ratio Intersection Summary Cycle Length: 65 Actuated Cycle Length: 53.3 Control Type: Semi Act-Uncoord Maximum v/c Ratio: 0.82 Intersection Signal Delay: 13.3 Intersection Capacity Utilization 68.8% Analysis Period (min) 15 Intersection LOS: B ICU Level of Service C Splits and Phases: 15: New Dundee Road & Cameran Road SNC Lavalin Synchro 6 Report Page 7
233 HCM Signalized Intersection Capacity Analysis Weekdays AM - Future Total Traffic : New Dundee Road & Cameran Road Option 1 Movement EBT EBR WBL WBT NBL NBR Lane Configurations Ideal Flow (vphpl) Total Lost time (s) Lane Util. Factor Frt Flt Protected Satd. Flow (prot) Flt Permitted Satd. Flow (perm) Volume (vph) Peak-hour factor, PHF Adj. Flow (vph) RTOR Reduction (vph) Lane Group Flow (vph) Turn Type pm+pt Protected Phases Permitted Phases 8 2 Actuated Green, G (s) Effective Green, g (s) Actuated g/c Ratio Clearance Time (s) Vehicle Extension (s) Lane Grp Cap (vph) v/s Ratio Prot c0.40 c0.19 v/s Ratio Perm 0.17 v/c Ratio Uniform Delay, d Progression Factor Incremental Delay, d Delay (s) Level of Service B A B Approach Delay (s) Approach LOS B A B Intersection Summary HCM Average Control Delay 13.1 HCM Level of Service B HCM Volume to Capacity ratio 0.69 Actuated Cycle Length (s) 53.2 Sum of lost time (s) 8.0 Intersection Capacity Utilization 68.8% ICU Level of Service C Analysis Period (min) 15 c Critical Lane Group SNC Lavalin Synchro 6 Report Page 8
234 HCM Unsignalized Intersection Capacity Analysis Weekdays AM - Future Total Traffic : Rush Meadow & Strasburg Road Option 1 Movement WBL WBR NET NER SWL SWT Lane Configurations Sign Control Stop Free Free Grade 0% 0% 0% Volume (veh/h) Peak Hour Factor Hourly flow rate (vph) Pedestrians Lane Width (m) Walking Speed (m/s) Percent Blockage Right turn flare (veh) Median type TWLTL Median storage veh) 2 Upstream signal (m) px, platoon unblocked vc, conflicting volume vc1, stage 1 conf vol 1049 vc2, stage 2 conf vol 360 vcu, unblocked vol tc, single (s) tc, 2 stage (s) 5.8 tf (s) p0 queue free % cm capacity (veh/h) Direction, Lane # WB 1 NE 1 NE 2 SW 1 SW 2 SW 3 Volume Total Volume Left Volume Right csh Volume to Capacity Queue Length 95th (m) Control Delay (s) Lane LOS C B Approach Delay (s) Approach LOS C Intersection Summary Average Delay 1.8 Intersection Capacity Utilization 46.0% ICU Level of Service A Analysis Period (min) 15 SNC Lavalin Synchro 6 Report Page 10
235 Queues Weekdays AM - Future Total Traffic : New Dundee Road & Fischer-Hallman Rd. Option 1 Lane Group EBL EBT EBR WBL WBT WBR NBL NBT NBR SBL SBT SBR Lane Configurations Total Lost Time (s) Satd. Flow (prot) Flt Permitted Satd. Flow (perm) Satd. Flow (RTOR) Volume (vph) Lane Group Flow (vph) Turn Type Perm Perm Perm Perm pm+pt Protected Phases Permitted Phases Total Split (s) Act Effct Green (s) Actuated g/c Ratio v/c Ratio Control Delay Queue Delay Total Delay LOS D C A C B A Approach Delay Approach LOS D B C B Queue Length 50th (m) Queue Length 95th (m) Internal Link Dist (m) Turn Bay Length (m) Base Capacity (vph) Starvation Cap Reductn Spillback Cap Reductn Storage Cap Reductn Reduced v/c Ratio Intersection Summary Cycle Length: 100 Actuated Cycle Length: 97.3 Control Type: Semi Act-Uncoord Maximum v/c Ratio: 0.76 Intersection Signal Delay: 19.7 Intersection Capacity Utilization 81.6% Analysis Period (min) 15 Intersection LOS: B ICU Level of Service D Splits and Phases: 22: New Dundee Road & Fischer-Hallman Rd. SNC Lavalin Synchro 6 Report Page 12
236 HCM Signalized Intersection Capacity Analysis Weekdays AM - Future Total Traffic : New Dundee Road & Fischer-Hallman Rd. Option 1 Movement EBL EBT EBR WBL WBT WBR NBL NBT NBR SBL SBT SBR Lane Configurations Ideal Flow (vphpl) Total Lost time (s) Lane Util. Factor Frt Flt Protected Satd. Flow (prot) Flt Permitted Satd. Flow (perm) Volume (vph) Peak-hour factor, PHF Adj. Flow (vph) RTOR Reduction (vph) Lane Group Flow (vph) Turn Type Perm Perm Perm Perm pm+pt Protected Phases Permitted Phases Actuated Green, G (s) Effective Green, g (s) Actuated g/c Ratio Clearance Time (s) Vehicle Extension (s) Lane Grp Cap (vph) v/s Ratio Prot c v/s Ratio Perm c c0.35 v/c Ratio Uniform Delay, d Progression Factor Incremental Delay, d Delay (s) Level of Service D C C B B A Approach Delay (s) Approach LOS D C B A Intersection Summary HCM Average Control Delay 20.9 HCM Level of Service C HCM Volume to Capacity ratio 0.68 Actuated Cycle Length (s) 97.3 Sum of lost time (s) 8.0 Intersection Capacity Utilization 81.6% ICU Level of Service D Analysis Period (min) 15 c Critical Lane Group SNC Lavalin Synchro 6 Report Page 13
237 Queues Weekdays AM - Future Total Traffic : Battler Road & Huron Road Option 1 Lane Group SEL SET SER NWL NWT NWR NEL NET NER SWL SWT SWR Lane Configurations Total Lost Time (s) Satd. Flow (prot) Flt Permitted Satd. Flow (perm) Satd. Flow (RTOR) Volume (vph) Lane Group Flow (vph) Turn Type Perm Perm Perm Perm pm+pt Perm Protected Phases Permitted Phases Total Split (s) Act Effct Green (s) Actuated g/c Ratio v/c Ratio Control Delay Queue Delay Total Delay LOS C C D C A B C C A A Approach Delay Approach LOS C C C B Queue Length 50th (m) Queue Length 95th (m) Internal Link Dist (m) Turn Bay Length (m) Base Capacity (vph) Starvation Cap Reductn Spillback Cap Reductn Storage Cap Reductn Reduced v/c Ratio Intersection Summary Cycle Length: 100 Actuated Cycle Length: 95.9 Control Type: Semi Act-Uncoord Maximum v/c Ratio: 0.77 Intersection Signal Delay: 19.3 Intersection Capacity Utilization 80.5% Analysis Period (min) 15 Intersection LOS: B ICU Level of Service D Splits and Phases: 28: Battler Road & Huron Road SNC Lavalin Synchro 6 Report Page 14
238 HCM Signalized Intersection Capacity Analysis Weekdays AM - Future Total Traffic : Battler Road & Huron Road Option 1 Movement SEL SET SER NWL NWT NWR NEL NET NER SWL SWT SWR Lane Configurations Ideal Flow (vphpl) Total Lost time (s) Lane Util. Factor Frt Flt Protected Satd. Flow (prot) Flt Permitted Satd. Flow (perm) Volume (vph) Peak-hour factor, PHF Adj. Flow (vph) RTOR Reduction (vph) Lane Group Flow (vph) Turn Type Perm Perm Perm Perm pm+pt Perm Protected Phases Permitted Phases Actuated Green, G (s) Effective Green, g (s) Actuated g/c Ratio Clearance Time (s) Vehicle Extension (s) Lane Grp Cap (vph) v/s Ratio Prot c0.43 c v/s Ratio Perm 0.03 c v/c Ratio Uniform Delay, d Progression Factor Incremental Delay, d Delay (s) Level of Service C C D C C A B C A A Approach Delay (s) Approach LOS C D B B Intersection Summary HCM Average Control Delay 19.9 HCM Level of Service B HCM Volume to Capacity ratio 0.74 Actuated Cycle Length (s) 95.9 Sum of lost time (s) 12.0 Intersection Capacity Utilization 80.5% ICU Level of Service D Analysis Period (min) 15 c Critical Lane Group SNC Lavalin Synchro 6 Report Page 15
239 Queues Weekdays AM - Future Total Traffic : Huron Road & Trillium Dr Option 1 Lane Group EBL EBT EBR WBL WBT WBR NBL NBT NBR SBL SBT SBR Lane Configurations Total Lost Time (s) Satd. Flow (prot) Flt Permitted Satd. Flow (perm) Satd. Flow (RTOR) Volume (vph) Lane Group Flow (vph) Turn Type Perm Freecustom custom Protected Phases 4 8 Permitted Phases 4 Free 6 6 Total Split (s) Act Effct Green (s) Actuated g/c Ratio v/c Ratio Control Delay Queue Delay Total Delay LOS A B B A B A Approach Delay Approach LOS B B Queue Length 50th (m) Queue Length 95th (m) Internal Link Dist (m) Turn Bay Length (m) Base Capacity (vph) Starvation Cap Reductn Spillback Cap Reductn Storage Cap Reductn Reduced v/c Ratio Intersection Summary Cycle Length: 80 Actuated Cycle Length: 73.7 Control Type: Semi Act-Uncoord Maximum v/c Ratio: 0.87 Intersection Signal Delay: 14.1 Intersection Capacity Utilization 56.5% Analysis Period (min) 15 Intersection LOS: B ICU Level of Service B Splits and Phases: 30: Huron Road & Trillium Dr SNC Lavalin Synchro 6 Report Page 16
240 HCM Signalized Intersection Capacity Analysis Weekdays AM - Future Total Traffic : Huron Road & Trillium Dr Option 1 Movement EBL EBT EBR WBL WBT WBR NBL NBT NBR SBL SBT SBR Lane Configurations Ideal Flow (vphpl) Total Lost time (s) Lane Util. Factor Frt Flt Protected Satd. Flow (prot) Flt Permitted Satd. Flow (perm) Volume (vph) Peak-hour factor, PHF Adj. Flow (vph) RTOR Reduction (vph) Lane Group Flow (vph) Turn Type Perm Freecustom custom Protected Phases 4 8 Permitted Phases 4 Free 6 6 Actuated Green, G (s) Effective Green, g (s) Actuated g/c Ratio Clearance Time (s) Vehicle Extension (s) Lane Grp Cap (vph) v/s Ratio Prot c v/s Ratio Perm 0.08 c v/c Ratio Uniform Delay, d Progression Factor Incremental Delay, d Delay (s) Level of Service A B B A B B Approach Delay (s) Approach LOS B B A B Intersection Summary HCM Average Control Delay 13.4 HCM Level of Service B HCM Volume to Capacity ratio 0.62 Actuated Cycle Length (s) 73.6 Sum of lost time (s) 4.0 Intersection Capacity Utilization 56.5% ICU Level of Service B Analysis Period (min) 15 c Critical Lane Group SNC Lavalin Synchro 6 Report Page 17
241 Queues Weekdays AM - Future Total Traffic : Homer Watson & Manitou Drive Option 1 Lane Group EBL EBT EBR WBL WBT WBR NBL NBT NBR SBL SBT SBR Lane Configurations Total Lost Time (s) Satd. Flow (prot) Flt Permitted Satd. Flow (perm) Satd. Flow (RTOR) Volume (vph) Lane Group Flow (vph) Turn Type Prot Perm pm+pt Perm pm+pt Prot Protected Phases Permitted Phases Total Split (s) Act Effct Green (s) Actuated g/c Ratio v/c Ratio Control Delay Queue Delay Total Delay LOS F C A C D E E D E C Approach Delay Approach LOS D D E D Queue Length 50th (m) ~ ~ Queue Length 95th (m)# #232.5 # # Internal Link Dist (m) Turn Bay Length (m) Base Capacity (vph) Starvation Cap Reductn Spillback Cap Reductn Storage Cap Reductn Reduced v/c Ratio Intersection Summary Cycle Length: 130 Actuated Cycle Length: 130 Control Type: Semi Act-Uncoord Maximum v/c Ratio: 1.05 Intersection Signal Delay: 49.0 Intersection LOS: D ICU Level of Service F Intersection Capacity Utilization 93.5% Analysis Period (min) 15 ~ Volume exceeds capacity, queue is theoretically infinite. Queue shown is maximum after two cycles. # 95th percentile volume exceeds capacity, queue may be longer. Queue shown is maximum after two cycles. SNC Lavalin Synchro 6 Report Page 18
242 Queues Weekdays AM - Future Total Traffic : Homer Watson & Manitou Drive Option 1 Splits and Phases: 35: Homer Watson & Manitou Drive SNC Lavalin Synchro 6 Report Page 19
243 HCM Signalized Intersection Capacity Analysis Weekdays AM - Future Total Traffic : Homer Watson & Manitou Drive Option 1 Movement EBL EBT EBR WBL WBT WBR NBL NBT NBR SBL SBT SBR Lane Configurations Ideal Flow (vphpl) Total Lost time (s) Lane Util. Factor Frt Flt Protected Satd. Flow (prot) Flt Permitted Satd. Flow (perm) Volume (vph) Peak-hour factor, PHF Adj. Flow (vph) RTOR Reduction (vph) Lane Group Flow (vph) Turn Type Prot Perm pm+pt Perm pm+pt Prot Protected Phases Permitted Phases Actuated Green, G (s) Effective Green, g (s) Actuated g/c Ratio Clearance Time (s) Vehicle Extension (s) Lane Grp Cap (vph) v/s Ratio Prot c c v/s Ratio Perm c0.35 c0.21 v/c Ratio Uniform Delay, d Progression Factor Incremental Delay, d Delay (s) Level of Service F C C C D E E D E D Approach Delay (s) Approach LOS D D E E Intersection Summary HCM Average Control Delay 52.8 HCM Level of Service D HCM Volume to Capacity ratio 1.00 Actuated Cycle Length (s) Sum of lost time (s) 12.0 Intersection Capacity Utilization 93.5% ICU Level of Service F Analysis Period (min) 15 c Critical Lane Group SNC Lavalin Synchro 6 Report Page 20
244 Queues Weekdays AM - Future Total Traffic : Homer Watson Blvd. & Doon South Dr. Option 1 Lane Group EBL EBT EBR WBL WBT WBR NBL NBT NBR SBL SBT SBR Lane Configurations Total Lost Time (s) Satd. Flow (prot) Flt Permitted Satd. Flow (perm) Satd. Flow (RTOR) Volume (vph) Lane Group Flow (vph) Turn Type Perm Perm pm+pt Split Split Perm Protected Phases Permitted Phases Total Split (s) Act Effct Green (s) Actuated g/c Ratio v/c Ratio Control Delay Queue Delay Total Delay LOS C A C B C E Approach Delay Approach LOS C B D Queue Length 50th (m) Queue Length 95th (m) # #165.7 Internal Link Dist (m) Turn Bay Length (m) Base Capacity (vph) Starvation Cap Reductn Spillback Cap Reductn Storage Cap Reductn Reduced v/c Ratio Intersection Summary Cycle Length: 120 Actuated Cycle Length: Control Type: Semi Act-Uncoord Maximum v/c Ratio: 0.99 Intersection Signal Delay: 29.5 Intersection LOS: C ICU Level of Service F Intersection Capacity Utilization 97.2% Analysis Period (min) 15 # 95th percentile volume exceeds capacity, queue may be longer. Queue shown is maximum after two cycles. Splits and Phases: 38: Homer Watson Blvd. & Doon South Dr. SNC Lavalin Synchro 6 Report Page 21
245 HCM Signalized Intersection Capacity Analysis Weekdays AM - Future Total Traffic : Homer Watson Blvd. & Doon South Dr. Option 1 Movement EBL EBT EBR WBL WBT WBR NBL NBT NBR SBL SBT SBR Lane Configurations Ideal Flow (vphpl) Total Lost time (s) Lane Util. Factor Frt Flt Protected Satd. Flow (prot) Flt Permitted Satd. Flow (perm) Volume (vph) Peak-hour factor, PHF Adj. Flow (vph) RTOR Reduction (vph) Lane Group Flow (vph) Turn Type Perm Perm pm+pt Split Split Perm Protected Phases Permitted Phases Actuated Green, G (s) Effective Green, g (s) Actuated g/c Ratio Clearance Time (s) Vehicle Extension (s) Lane Grp Cap (vph) v/s Ratio Prot c c c0.27 v/s Ratio Perm v/c Ratio Uniform Delay, d Progression Factor Incremental Delay, d Delay (s) Level of Service C B C B C F Approach Delay (s) Approach LOS C B E A Intersection Summary HCM Average Control Delay 31.4 HCM Level of Service C HCM Volume to Capacity ratio 0.96 Actuated Cycle Length (s) Sum of lost time (s) 12.0 Intersection Capacity Utilization 97.2% ICU Level of Service F Analysis Period (min) 15 c Critical Lane Group SNC Lavalin Synchro 6 Report Page 22
246 Queues Weekdays AM - Future Total Traffic : Pioneer Drive & Manitou Drive Option 1 Lane Group EBL EBT EBR WBL WBT WBR NBL NBT NBR SBL SBT SBR Lane Configurations Total Lost Time (s) Satd. Flow (prot) Flt Permitted Satd. Flow (perm) Satd. Flow (RTOR) Volume (vph) Lane Group Flow (vph) Turn Type Perm Perm Perm Perm Perm Perm Perm Protected Phases Permitted Phases Total Split (s) Act Effct Green (s) Actuated g/c Ratio v/c Ratio Control Delay Queue Delay Total Delay LOS C A B A B A B B A Approach Delay Approach LOS B B B A Queue Length 50th (m) Queue Length 95th (m) Internal Link Dist (m) Turn Bay Length (m) Base Capacity (vph) Starvation Cap Reductn Spillback Cap Reductn Storage Cap Reductn Reduced v/c Ratio Intersection Summary Cycle Length: 90 Actuated Cycle Length: 45.5 Control Type: Semi Act-Uncoord Maximum v/c Ratio: 0.64 Intersection Signal Delay: 13.7 Intersection Capacity Utilization 73.0% Analysis Period (min) 15 Intersection LOS: B ICU Level of Service D Splits and Phases: 39: Pioneer Drive & Manitou Drive SNC Lavalin Synchro 6 Report Page 23
247 HCM Signalized Intersection Capacity Analysis Weekdays AM - Future Total Traffic : Pioneer Drive & Manitou Drive Option 1 Movement EBL EBT EBR WBL WBT WBR NBL NBT NBR SBL SBT SBR Lane Configurations Ideal Flow (vphpl) Total Lost time (s) Lane Util. Factor Frt Flt Protected Satd. Flow (prot) Flt Permitted Satd. Flow (perm) Volume (vph) Peak-hour factor, PHF Adj. Flow (vph) RTOR Reduction (vph) Lane Group Flow (vph) Turn Type Perm Perm Perm Perm Perm Perm Perm Protected Phases Permitted Phases Actuated Green, G (s) Effective Green, g (s) Actuated g/c Ratio Clearance Time (s) Vehicle Extension (s) Lane Grp Cap (vph) v/s Ratio Prot v/s Ratio Perm 0.22 c c v/c Ratio Uniform Delay, d Progression Factor Incremental Delay, d Delay (s) Level of Service A A A A B A A A A Approach Delay (s) Approach LOS A A B A Intersection Summary HCM Average Control Delay 9.4 HCM Level of Service A HCM Volume to Capacity ratio 0.59 Actuated Cycle Length (s) 39.7 Sum of lost time (s) 8.0 Intersection Capacity Utilization 73.0% ICU Level of Service D Analysis Period (min) 15 c Critical Lane Group SNC Lavalin Synchro 6 Report Page 24
248 Queues Weekdays AM - Future Total Traffic : Homer Watson & Pioneer Dr. Option 1 Lane Group SEL SET SER NWL NWT NWR NEL NET NER SWL SWT SWR Lane Configurations Total Lost Time (s) Satd. Flow (prot) Flt Permitted Satd. Flow (perm) Satd. Flow (RTOR) Volume (vph) Lane Group Flow (vph) Turn Type pm+pt Free pm+pt Perm pm+pt Free Perm Protected Phases Permitted Phases 6 Free Free 8 Total Split (s) Act Effct Green (s) Actuated g/c Ratio v/c Ratio Control Delay Queue Delay Total Delay LOS B C A D C A E F A E D Approach Delay Approach LOS C C D D Queue Length 50th (m) Queue Length 95th (m) # #77.4 # Internal Link Dist (m) Turn Bay Length (m) Base Capacity (vph) Starvation Cap Reductn Spillback Cap Reductn Storage Cap Reductn Reduced v/c Ratio Intersection Summary Cycle Length: 130 Actuated Cycle Length: Control Type: Semi Act-Uncoord Maximum v/c Ratio: 0.95 Intersection Signal Delay: 32.1 Intersection LOS: C ICU Level of Service F Intersection Capacity Utilization 91.1% Analysis Period (min) 15 # 95th percentile volume exceeds capacity, queue may be longer. Queue shown is maximum after two cycles. Splits and Phases: 45: Homer Watson & Pioneer Dr. SNC Lavalin Synchro 6 Report Page 25
249 HCM Signalized Intersection Capacity Analysis Weekdays AM - Future Total Traffic : Homer Watson & Pioneer Dr. Option 1 Movement SEL SET SER NWL NWT NWR NEL NET NER SWL SWT SWR Lane Configurations Ideal Flow (vphpl) Total Lost time (s) Lane Util. Factor Frt Flt Protected Satd. Flow (prot) Flt Permitted Satd. Flow (perm) Volume (vph) Peak-hour factor, PHF Adj. Flow (vph) RTOR Reduction (vph) Lane Group Flow (vph) Parking (#/hr) 0 Turn Type pm+pt Free pm+pt Perm pm+pt Free Perm Protected Phases Permitted Phases 6 Free Free 8 Actuated Green, G (s) Effective Green, g (s) Actuated g/c Ratio Clearance Time (s) Vehicle Extension (s) Lane Grp Cap (vph) v/s Ratio Prot c0.05 c c v/s Ratio Perm c v/c Ratio Uniform Delay, d Progression Factor Incremental Delay, d Delay (s) Level of Service C C A D C B D F A D D Approach Delay (s) Approach LOS C C D D Intersection Summary HCM Average Control Delay 32.1 HCM Level of Service C HCM Volume to Capacity ratio 0.86 Actuated Cycle Length (s) Sum of lost time (s) 8.0 Intersection Capacity Utilization 91.1% ICU Level of Service F Analysis Period (min) 15 c Critical Lane Group SNC Lavalin Synchro 6 Report Page 26
250 Queues Weekdays AM - Future Total Traffic : Homer Watson Blvd. & Conestoga College Blvd Option 1 Lane Group EBL EBT EBR WBL WBT WBR NBL NBT NBR SBL SBT SBR Lane Configurations Total Lost Time (s) Satd. Flow (prot) Flt Permitted Satd. Flow (perm) Satd. Flow (RTOR) Volume (vph) Lane Group Flow (vph) Turn Type Prot Perm pm+pt Free pm+pt pm+pt Perm Protected Phases Permitted Phases 4 8 Free Total Split (s) Act Effct Green (s) Actuated g/c Ratio v/c Ratio Control Delay Queue Delay Total Delay LOS D C A D C A D D D D B Approach Delay Approach LOS C B D D Queue Length 50th (m) Queue Length 95th (m) # Internal Link Dist (m) Turn Bay Length (m) Base Capacity (vph) Starvation Cap Reductn Spillback Cap Reductn Storage Cap Reductn Reduced v/c Ratio Intersection Summary Cycle Length: 120 Actuated Cycle Length: Control Type: Semi Act-Uncoord Maximum v/c Ratio: 0.89 Intersection Signal Delay: 24.9 Intersection LOS: C ICU Level of Service E Intersection Capacity Utilization 87.6% Analysis Period (min) 15 # 95th percentile volume exceeds capacity, queue may be longer. Queue shown is maximum after two cycles. Splits and Phases: 50: Homer Watson Blvd. & Conestoga College Blvd SNC Lavalin Synchro 6 Report Page 27
251 HCM Signalized Intersection Capacity Analysis Weekdays AM - Future Total Traffic : Homer Watson Blvd. & Conestoga College Blvd Option 1 Movement EBL EBT EBR WBL WBT WBR NBL NBT NBR SBL SBT SBR Lane Configurations Ideal Flow (vphpl) Total Lost time (s) Lane Util. Factor Frt Flt Protected Satd. Flow (prot) Flt Permitted Satd. Flow (perm) Volume (vph) Peak-hour factor, PHF Adj. Flow (vph) RTOR Reduction (vph) Lane Group Flow (vph) Turn Type Prot Perm pm+pt Free pm+pt pm+pt Perm Protected Phases Permitted Phases 4 8 Free Actuated Green, G (s) Effective Green, g (s) Actuated g/c Ratio Clearance Time (s) Vehicle Extension (s) Lane Grp Cap (vph) v/s Ratio Prot c0.12 c c v/s Ratio Perm c c v/c Ratio Uniform Delay, d Progression Factor Incremental Delay, d Delay (s) Level of Service D C A D C A D D D D D Approach Delay (s) Approach LOS C B D D Intersection Summary HCM Average Control Delay 25.5 HCM Level of Service C HCM Volume to Capacity ratio 0.81 Actuated Cycle Length (s) Sum of lost time (s) 12.0 Intersection Capacity Utilization 87.6% ICU Level of Service E Analysis Period (min) 15 c Critical Lane Group SNC Lavalin Synchro 6 Report Page 28
252 Queues Weekdays AM - Future Total Traffic : Homer Watson Blvd. & New Dundee Road Option 1 Lane Group EBL EBT EBR WBL WBT WBR NBL NBT NBR SBL SBT SBR Lane Configurations Total Lost Time (s) Satd. Flow (prot) Flt Permitted Satd. Flow (perm) Satd. Flow (RTOR) Volume (vph) Lane Group Flow (vph) Turn Type Perm pm+pt Perm custom Free Perm Free Protected Phases Permitted Phases Free 6 Free Total Split (s) Act Effct Green (s) Actuated g/c Ratio v/c Ratio Control Delay Queue Delay Total Delay LOS B A E A A C A C C A Approach Delay Approach LOS B B B Queue Length 50th (m) Queue Length 95th (m) # Internal Link Dist (m) Turn Bay Length (m) Base Capacity (vph) Starvation Cap Reductn Spillback Cap Reductn Storage Cap Reductn Reduced v/c Ratio Intersection Summary Cycle Length: 100 Actuated Cycle Length: 82.1 Control Type: Semi Act-Uncoord Maximum v/c Ratio: 0.92 Intersection Signal Delay: 12.0 Intersection LOS: B ICU Level of Service D Intersection Capacity Utilization 76.5% Analysis Period (min) 15 # 95th percentile volume exceeds capacity, queue may be longer. Queue shown is maximum after two cycles. Splits and Phases: 53: Homer Watson Blvd. & New Dundee Road SNC Lavalin Synchro 6 Report Page 29
253 HCM Signalized Intersection Capacity Analysis Weekdays AM - Future Total Traffic : Homer Watson Blvd. & New Dundee Road Option 1 Movement EBL EBT EBR WBL WBT WBR NBL NBT NBR SBL SBT SBR Lane Configurations Ideal Flow (vphpl) Total Lost time (s) Lane Util. Factor Frt Flt Protected Satd. Flow (prot) Flt Permitted Satd. Flow (perm) Volume (vph) Peak-hour factor, PHF Adj. Flow (vph) RTOR Reduction (vph) Lane Group Flow (vph) Parking (#/hr) 0 Turn Type Perm pm+pt Perm custom Free Perm Free Protected Phases Permitted Phases Free 6 Free Actuated Green, G (s) Effective Green, g (s) Actuated g/c Ratio Clearance Time (s) Vehicle Extension (s) Lane Grp Cap (vph) v/s Ratio Prot 0.36 c v/s Ratio Perm 0.00 c c0.63 v/c Ratio Uniform Delay, d Progression Factor Incremental Delay, d Delay (s) Level of Service B A D A A C A C C A Approach Delay (s) Approach LOS B B A A Intersection Summary HCM Average Control Delay 11.5 HCM Level of Service B HCM Volume to Capacity ratio 0.84 Actuated Cycle Length (s) 82.0 Sum of lost time (s) 4.0 Intersection Capacity Utilization 76.5% ICU Level of Service D Analysis Period (min) 15 c Critical Lane Group SNC Lavalin Synchro 6 Report Page 30
254 HCM Unsignalized Intersection Capacity Analysis Weekdays AM - Future Total Traffic : ConesToga College & New Dundee Rd. Option 1 Movement EBL EBR NBL NBT SBT SBR Lane Configurations Sign Control Stop Free Free Grade 0% 0% 0% Volume (veh/h) Peak Hour Factor Hourly flow rate (vph) Pedestrians Lane Width (m) Walking Speed (m/s) Percent Blockage Right turn flare (veh) Median type TWLTL Median storage veh) 2 Upstream signal (m) 149 px, platoon unblocked vc, conflicting volume vc1, stage 1 conf vol 507 vc2, stage 2 conf vol 942 vcu, unblocked vol tc, single (s) tc, 2 stage (s) 5.8 tf (s) p0 queue free % cm capacity (veh/h) Direction, Lane # EB 1 EB 2 NB 1 NB 2 NB 3 SB 1 SB 2 SB 3 Volume Total Volume Left Volume Right csh Volume to Capacity Queue Length 95th (m) Control Delay (s) Lane LOS C B A Approach Delay (s) Approach LOS C Intersection Summary Average Delay 2.6 Intersection Capacity Utilization 40.8% ICU Level of Service A Analysis Period (min) 15 SNC Lavalin Synchro 6 Report Page 31
255 Queues Weekdays AM - Future Total Traffic : New Dundee Rd & Thomas Slee Dr. Option 1 Lane Group EBL EBT EBR WBL WBT WBR NBL NBT NBR SBL SBT SBR Lane Configurations Total Lost Time (s) Satd. Flow (prot) Flt Permitted Satd. Flow (perm) Satd. Flow (RTOR) Volume (vph) Lane Group Flow (vph) Turn Type Perm Perm Perm Perm Perm Perm Protected Phases Permitted Phases Total Split (s) Act Effct Green (s) Actuated g/c Ratio v/c Ratio Control Delay Queue Delay Total Delay LOS A A A A D A Approach Delay Approach LOS A A C Queue Length 50th (m) Queue Length 95th (m) Internal Link Dist (m) Turn Bay Length (m) Base Capacity (vph) Starvation Cap Reductn Spillback Cap Reductn Storage Cap Reductn Reduced v/c Ratio Intersection Summary Cycle Length: 90 Actuated Cycle Length: 93.8 Control Type: Semi Act-Uncoord Maximum v/c Ratio: 0.47 Intersection Signal Delay: 5.4 Intersection Capacity Utilization 48.3% Analysis Period (min) 15 Intersection LOS: A ICU Level of Service A Splits and Phases: 57: New Dundee Rd & Thomas Slee Dr. SNC Lavalin Synchro 6 Report Page 32
256 HCM Signalized Intersection Capacity Analysis Weekdays AM - Future Total Traffic : New Dundee Rd & Thomas Slee Dr. Option 1 Movement EBL EBT EBR WBL WBT WBR NBL NBT NBR SBL SBT SBR Lane Configurations Ideal Flow (vphpl) Total Lost time (s) Lane Util. Factor Frt Flt Protected Satd. Flow (prot) Flt Permitted Satd. Flow (perm) Volume (vph) Peak-hour factor, PHF Adj. Flow (vph) RTOR Reduction (vph) Lane Group Flow (vph) Turn Type Perm Perm Perm Perm Perm Perm Protected Phases Permitted Phases Actuated Green, G (s) Effective Green, g (s) Actuated g/c Ratio Clearance Time (s) Vehicle Extension (s) Lane Grp Cap (vph) v/s Ratio Prot c v/s Ratio Perm c0.07 v/c Ratio Uniform Delay, d Progression Factor Incremental Delay, d Delay (s) Level of Service A A A A D D Approach Delay (s) Approach LOS A A A D Intersection Summary HCM Average Control Delay 6.3 HCM Level of Service A HCM Volume to Capacity ratio 0.40 Actuated Cycle Length (s) 94.6 Sum of lost time (s) 8.0 Intersection Capacity Utilization 48.3% ICU Level of Service A Analysis Period (min) 15 c Critical Lane Group SNC Lavalin Synchro 6 Report Page 33
257 HCM Unsignalized Intersection Capacity Analysis Weekdays AM - Future Total Traffic : New Dundee Road & Collector"B" Option 1 Movement EBL EBT WBT WBR SBL SBR Lane Configurations Sign Control Free Free Stop Grade 0% 0% 0% Volume (veh/h) Peak Hour Factor Hourly flow rate (vph) Pedestrians Lane Width (m) Walking Speed (m/s) Percent Blockage Right turn flare (veh) Median type TWLTL Median storage veh) 1 Upstream signal (m) px, platoon unblocked vc, conflicting volume vc1, stage 1 conf vol 558 vc2, stage 2 conf vol 520 vcu, unblocked vol tc, single (s) tc, 2 stage (s) 5.8 tf (s) p0 queue free % cm capacity (veh/h) Direction, Lane # EB 1 EB 2 EB 3 WB 1 WB 2 SB 1 SB 2 Volume Total Volume Left Volume Right csh Volume to Capacity Queue Length 95th (m) Control Delay (s) Lane LOS A C B Approach Delay (s) Approach LOS B Intersection Summary Average Delay 1.0 Intersection Capacity Utilization 35.5% ICU Level of Service A Analysis Period (min) 15 SNC Lavalin Synchro 6 Report Page 34
258 HCM Unsignalized Intersection Capacity Analysis Weekdays AM - Future Total Traffic : New Dundee Rd & Reichert Dr. Option 1 Movement EBT EBR WBL WBT NBL NBR Lane Configurations Sign Control Free Free Stop Grade 0% 0% 0% Volume (veh/h) Peak Hour Factor Hourly flow rate (vph) Pedestrians Lane Width (m) Walking Speed (m/s) Percent Blockage Right turn flare (veh) Median type None Median storage veh) Upstream signal (m) px, platoon unblocked vc, conflicting volume vc1, stage 1 conf vol vc2, stage 2 conf vol vcu, unblocked vol tc, single (s) tc, 2 stage (s) tf (s) p0 queue free % cm capacity (veh/h) Direction, Lane # EB 1 EB 2 WB 1 WB 2 NB 1 Volume Total Volume Left Volume Right csh Volume to Capacity Queue Length 95th (m) Control Delay (s) Lane LOS A B Approach Delay (s) Approach LOS B Intersection Summary Average Delay 1.0 Intersection Capacity Utilization 58.3% ICU Level of Service B Analysis Period (min) 15 SNC Lavalin Synchro 6 Report Page 36
259 HCM Unsignalized Intersection Capacity Analysis Weekdays PM - Future Total Traffic : New Dundee Road & Collector "A" Option 1 Movement EBL EBT WBT WBR SBL SBR Lane Configurations Sign Control Free Free Stop Grade 0% 0% 0% Volume (veh/h) Peak Hour Factor Hourly flow rate (vph) Pedestrians Lane Width (m) Walking Speed (m/s) Percent Blockage Right turn flare (veh) Median type TWLTL Median storage veh) 1 Upstream signal (m) px, platoon unblocked vc, conflicting volume vc1, stage 1 conf vol 1042 vc2, stage 2 conf vol 432 vcu, unblocked vol tc, single (s) tc, 2 stage (s) 5.8 tf (s) p0 queue free % cm capacity (veh/h) Direction, Lane # EB 1 EB 2 WB 1 WB 2 WB 3 SB 1 SB 2 Volume Total Volume Left Volume Right csh Volume to Capacity Queue Length 95th (m) Control Delay (s) Lane LOS A C B Approach Delay (s) Approach LOS C Intersection Summary Average Delay 1.3 Intersection Capacity Utilization 62.1% ICU Level of Service B Analysis Period (min) 15 SNC Lavalin Synchro 6 Report Page 3
260 HCM Unsignalized Intersection Capacity Analysis Weekdays PM - Future Total Traffic : Rockcliffe Drive & Strasburg Road Option 1 Movement EBL EBR NBL NBT SBT SBR Lane Configurations Sign Control Stop Free Free Grade 0% 0% 0% Volume (veh/h) Peak Hour Factor Hourly flow rate (vph) Pedestrians Lane Width (m) Walking Speed (m/s) Percent Blockage Right turn flare (veh) 4 Median type TWLTL Median storage veh) 2 Upstream signal (m) px, platoon unblocked vc, conflicting volume vc1, stage 1 conf vol 1102 vc2, stage 2 conf vol 516 vcu, unblocked vol tc, single (s) tc, 2 stage (s) 5.8 tf (s) p0 queue free % cm capacity (veh/h) Direction, Lane # EB 1 NB 1 NB 2 NB 3 SB 1 SB 2 SB 3 Volume Total Volume Left Volume Right csh Volume to Capacity Queue Length 95th (m) Control Delay (s) Lane LOS C B Approach Delay (s) Approach LOS C Intersection Summary Average Delay 1.9 Intersection Capacity Utilization 49.7% ICU Level of Service A Analysis Period (min) 15 SNC Lavalin Synchro 6 Report Page 4
261 Queues Weekdays PM - Future Total Traffic : New Dundee Road & Cameran Road Option 1 Lane Group EBT EBR WBL WBT NBL NBR ø2 Lane Configurations Total Lost Time (s) Satd. Flow (prot) Flt Permitted Satd. Flow (perm) Satd. Flow (RTOR) Volume (vph) Lane Group Flow (vph) Turn Type pm+pt Protected Phases Permitted Phases 8 2 Total Split (s) Act Effct Green (s) Actuated g/c Ratio v/c Ratio Control Delay Queue Delay Total Delay LOS B C C Approach Delay Approach LOS B C C Queue Length 50th (m) Queue Length 95th (m) #135.8 Internal Link Dist (m) Turn Bay Length (m) Base Capacity (vph) Starvation Cap Reductn Spillback Cap Reductn Storage Cap Reductn Reduced v/c Ratio Intersection Summary Cycle Length: 65 Actuated Cycle Length: 60.4 Control Type: Semi Act-Uncoord Maximum v/c Ratio: 0.83 Intersection Signal Delay: 19.8 Intersection LOS: B ICU Level of Service D Intersection Capacity Utilization 79.7% Analysis Period (min) 15 # 95th percentile volume exceeds capacity, queue may be longer. Queue shown is maximum after two cycles. Splits and Phases: 15: New Dundee Road & Cameran Road SNC Lavalin Synchro 6 Report Page 7
262 HCM Signalized Intersection Capacity Analysis Weekdays PM - Future Total Traffic : New Dundee Road & Cameran Road Option 1 Movement EBT EBR WBL WBT NBL NBR Lane Configurations Ideal Flow (vphpl) Total Lost time (s) Lane Util. Factor Frt Flt Protected Satd. Flow (prot) Flt Permitted Satd. Flow (perm) Volume (vph) Peak-hour factor, PHF Adj. Flow (vph) RTOR Reduction (vph) Lane Group Flow (vph) Turn Type pm+pt Protected Phases Permitted Phases 8 2 Actuated Green, G (s) Effective Green, g (s) Actuated g/c Ratio Clearance Time (s) Vehicle Extension (s) Lane Grp Cap (vph) v/s Ratio Prot 0.33 c0.36 v/s Ratio Perm c0.33 v/c Ratio Uniform Delay, d Progression Factor Incremental Delay, d Delay (s) Level of Service B B C Approach Delay (s) Approach LOS B B C Intersection Summary HCM Average Control Delay 17.9 HCM Level of Service B HCM Volume to Capacity ratio 0.79 Actuated Cycle Length (s) 60.4 Sum of lost time (s) 8.0 Intersection Capacity Utilization 79.7% ICU Level of Service D Analysis Period (min) 15 c Critical Lane Group SNC Lavalin Synchro 6 Report Page 8
263 HCM Unsignalized Intersection Capacity Analysis Weekdays PM - Future Total Traffic : Rush Meadow & Strasburg Road Option 1 Movement WBL WBR NET NER SWL SWT Lane Configurations Sign Control Stop Free Free Grade 0% 0% 0% Volume (veh/h) Peak Hour Factor Hourly flow rate (vph) Pedestrians Lane Width (m) Walking Speed (m/s) Percent Blockage Right turn flare (veh) Median type TWLTL Median storage veh) 2 Upstream signal (m) px, platoon unblocked vc, conflicting volume vc1, stage 1 conf vol 870 vc2, stage 2 conf vol 766 vcu, unblocked vol tc, single (s) tc, 2 stage (s) 5.8 tf (s) p0 queue free % cm capacity (veh/h) Direction, Lane # WB 1 NE 1 NE 2 SW 1 SW 2 SW 3 Volume Total Volume Left Volume Right csh Volume to Capacity Queue Length 95th (m) Control Delay (s) Lane LOS C B Approach Delay (s) Approach LOS C Intersection Summary Average Delay 0.7 Intersection Capacity Utilization 45.7% ICU Level of Service A Analysis Period (min) 15 SNC Lavalin Synchro 6 Report Page 10
264 Queues Weekdays PM - Future Total Traffic : New Dundee Road & Fischer-Hallman Rd. Option 1 Lane Group EBL EBT EBR WBL WBT WBR NBL NBT NBR SBL SBT SBR Lane Configurations Total Lost Time (s) Satd. Flow (prot) Flt Permitted Satd. Flow (perm) Satd. Flow (RTOR) Volume (vph) Lane Group Flow (vph) Turn Type Perm Perm Perm Perm pm+pt Protected Phases Permitted Phases Total Split (s) Act Effct Green (s) Actuated g/c Ratio v/c Ratio Control Delay Queue Delay Total Delay LOS C D A B B A Approach Delay Approach LOS C B B A Queue Length 50th (m) Queue Length 95th (m) Internal Link Dist (m) Turn Bay Length (m) Base Capacity (vph) Starvation Cap Reductn Spillback Cap Reductn Storage Cap Reductn Reduced v/c Ratio Intersection Summary Cycle Length: 100 Actuated Cycle Length: 92.1 Control Type: Semi Act-Uncoord Maximum v/c Ratio: 0.74 Intersection Signal Delay: 14.2 Intersection Capacity Utilization 76.9% Analysis Period (min) 15 Intersection LOS: B ICU Level of Service D Splits and Phases: 22: New Dundee Road & Fischer-Hallman Rd. SNC Lavalin Synchro 6 Report Page 12
265 HCM Signalized Intersection Capacity Analysis Weekdays PM - Future Total Traffic : New Dundee Road & Fischer-Hallman Rd. Option 1 Movement EBL EBT EBR WBL WBT WBR NBL NBT NBR SBL SBT SBR Lane Configurations Ideal Flow (vphpl) Total Lost time (s) Lane Util. Factor Frt Flt Protected Satd. Flow (prot) Flt Permitted Satd. Flow (perm) Volume (vph) Peak-hour factor, PHF Adj. Flow (vph) RTOR Reduction (vph) Lane Group Flow (vph) Turn Type Perm Perm Perm Perm pm+pt Protected Phases Permitted Phases Actuated Green, G (s) Effective Green, g (s) Actuated g/c Ratio Clearance Time (s) Vehicle Extension (s) Lane Grp Cap (vph) v/s Ratio Prot c v/s Ratio Perm 0.07 c c0.33 v/c Ratio Uniform Delay, d Progression Factor Incremental Delay, d Delay (s) Level of Service C C C B A A Approach Delay (s) Approach LOS C C B A Intersection Summary HCM Average Control Delay 18.4 HCM Level of Service B HCM Volume to Capacity ratio 0.54 Actuated Cycle Length (s) 92.1 Sum of lost time (s) 8.0 Intersection Capacity Utilization 76.9% ICU Level of Service D Analysis Period (min) 15 c Critical Lane Group SNC Lavalin Synchro 6 Report Page 13
266 Queues Weekdays PM - Future Total Traffic : Battler Road & Huron Road Option 1 Lane Group SEL SET SER NWL NWT NWR NEL NET NER SWL SWT SWR Lane Configurations Total Lost Time (s) Satd. Flow (prot) Flt Permitted Satd. Flow (perm) Satd. Flow (RTOR) Volume (vph) Lane Group Flow (vph) Turn Type Perm Perm Perm Perm pm+pt Perm Protected Phases Permitted Phases Total Split (s) Act Effct Green (s) Actuated g/c Ratio v/c Ratio Control Delay Queue Delay Total Delay LOS D D D C A C C E A A Approach Delay Approach LOS D C C C Queue Length 50th (m) ~ Queue Length 95th (m) # Internal Link Dist (m) Turn Bay Length (m) Base Capacity (vph) Starvation Cap Reductn Spillback Cap Reductn Storage Cap Reductn Reduced v/c Ratio Intersection Summary Cycle Length: 100 Actuated Cycle Length: 96.5 Control Type: Semi Act-Uncoord Maximum v/c Ratio: 0.99 Intersection Signal Delay: 27.9 Intersection LOS: C ICU Level of Service E Intersection Capacity Utilization 90.7% Analysis Period (min) 15 ~ Volume exceeds capacity, queue is theoretically infinite. Queue shown is maximum after two cycles. # 95th percentile volume exceeds capacity, queue may be longer. Queue shown is maximum after two cycles. SNC Lavalin Synchro 6 Report Page 14
267 Queues Weekdays PM - Future Total Traffic : Battler Road & Huron Road Option 1 Splits and Phases: 28: Battler Road & Huron Road SNC Lavalin Synchro 6 Report Page 15
268 HCM Signalized Intersection Capacity Analysis Weekdays PM - Future Total Traffic : Battler Road & Huron Road Option 1 Movement SEL SET SER NWL NWT NWR NEL NET NER SWL SWT SWR Lane Configurations Ideal Flow (vphpl) Total Lost time (s) Lane Util. Factor Frt Flt Protected Satd. Flow (prot) Flt Permitted Satd. Flow (perm) Volume (vph) Peak-hour factor, PHF Adj. Flow (vph) RTOR Reduction (vph) Lane Group Flow (vph) Turn Type Perm Perm Perm Perm pm+pt Perm Protected Phases Permitted Phases Actuated Green, G (s) Effective Green, g (s) Actuated g/c Ratio Clearance Time (s) Vehicle Extension (s) Lane Grp Cap (vph) v/s Ratio Prot c v/s Ratio Perm 0.05 c c v/c Ratio Uniform Delay, d Progression Factor Incremental Delay, d Delay (s) Level of Service C C D C C C C E A A Approach Delay (s) Approach LOS C D C C Intersection Summary HCM Average Control Delay 27.9 HCM Level of Service C HCM Volume to Capacity ratio 0.91 Actuated Cycle Length (s) 96.5 Sum of lost time (s) 8.0 Intersection Capacity Utilization 90.7% ICU Level of Service E Analysis Period (min) 15 c Critical Lane Group SNC Lavalin Synchro 6 Report Page 16
269 Queues Weekdays PM - Future Total Traffic : Huron Road & Trillium Dr Option 1 Lane Group EBL EBT EBR WBL WBT WBR NBL NBT NBR SBL SBT SBR Lane Configurations Total Lost Time (s) Satd. Flow (prot) Flt Permitted Satd. Flow (perm) Satd. Flow (RTOR) Volume (vph) Lane Group Flow (vph) Turn Type Perm Freecustom custom Protected Phases 4 8 Permitted Phases 4 Free 6 6 Total Split (s) Act Effct Green (s) Actuated g/c Ratio v/c Ratio Control Delay Queue Delay Total Delay LOS B A C A C B Approach Delay Approach LOS A C Queue Length 50th (m) Queue Length 95th (m) # Internal Link Dist (m) Turn Bay Length (m) Base Capacity (vph) Starvation Cap Reductn Spillback Cap Reductn Storage Cap Reductn Reduced v/c Ratio Intersection Summary Cycle Length: 80 Actuated Cycle Length: 80 Offset: 0 (0%), Referenced to phase 2: and 6:SBL, Start of Green Control Type: Pretimed Maximum v/c Ratio: 0.98 Intersection Signal Delay: 24.5 Intersection LOS: C Intersection Capacity Utilization 68.7% ICU Level of Service C Analysis Period (min) 15 # 95th percentile volume exceeds capacity, queue may be longer. Queue shown is maximum after two cycles. SNC Lavalin Synchro 6 Report Page 17
270 Queues Weekdays PM - Future Total Traffic : Huron Road & Trillium Dr Option 1 Splits and Phases: 30: Huron Road & Trillium Dr SNC Lavalin Synchro 6 Report Page 18
271 HCM Signalized Intersection Capacity Analysis Weekdays PM - Future Total Traffic : Huron Road & Trillium Dr Option 1 Movement EBL EBT EBR WBL WBT WBR NBL NBT NBR SBL SBT SBR Lane Configurations Ideal Flow (vphpl) Total Lost time (s) Lane Util. Factor Frt Flt Protected Satd. Flow (prot) Flt Permitted Satd. Flow (perm) Volume (vph) Peak-hour factor, PHF Adj. Flow (vph) RTOR Reduction (vph) Lane Group Flow (vph) Turn Type Perm Freecustom custom Protected Phases 4 8 Permitted Phases 4 Free 6 6 Actuated Green, G (s) Effective Green, g (s) Actuated g/c Ratio Clearance Time (s) Lane Grp Cap (vph) v/s Ratio Prot 0.23 c0.58 v/s Ratio Perm 0.13 c v/c Ratio Uniform Delay, d Progression Factor Incremental Delay, d Delay (s) Level of Service B A C A C B Approach Delay (s) Approach LOS A C A C Intersection Summary HCM Average Control Delay 23.6 HCM Level of Service C HCM Volume to Capacity ratio 0.67 Actuated Cycle Length (s) 80.0 Sum of lost time (s) 4.0 Intersection Capacity Utilization 68.7% ICU Level of Service C Analysis Period (min) 15 c Critical Lane Group SNC Lavalin Synchro 6 Report Page 19
272 Queues Weekdays PM - Future Total Traffic : Homer Watson & Manitou Drive Option 1 Lane Group EBL EBT EBR WBL WBT WBR NBL NBT NBR SBL SBT SBR Lane Configurations Total Lost Time (s) Satd. Flow (prot) Flt Permitted Satd. Flow (perm) Satd. Flow (RTOR) Volume (vph) Lane Group Flow (vph) Turn Type Prot Perm pm+pt Perm pm+pt Prot Protected Phases Permitted Phases Total Split (s) Act Effct Green (s) Actuated g/c Ratio v/c Ratio Control Delay Queue Delay Total Delay LOS F D A D E A E D D E Approach Delay Approach LOS D D E E Queue Length 50th (m) Queue Length 95th (m) # #44.1 # # #173.5 Internal Link Dist (m) Turn Bay Length (m) Base Capacity (vph) Starvation Cap Reductn Spillback Cap Reductn Storage Cap Reductn Reduced v/c Ratio Intersection Summary Cycle Length: 130 Actuated Cycle Length: 130 Control Type: Semi Act-Uncoord Maximum v/c Ratio: 0.98 Intersection Signal Delay: 49.3 Intersection LOS: D ICU Level of Service G Intersection Capacity Utilization 103.5% Analysis Period (min) 15 # 95th percentile volume exceeds capacity, queue may be longer. Queue shown is maximum after two cycles. Splits and Phases: 35: Homer Watson & Manitou Drive SNC Lavalin Synchro 6 Report Page 20
273 HCM Signalized Intersection Capacity Analysis Weekdays PM - Future Total Traffic : Homer Watson & Manitou Drive Option 1 Movement EBL EBT EBR WBL WBT WBR NBL NBT NBR SBL SBT SBR Lane Configurations Ideal Flow (vphpl) Total Lost time (s) Lane Util. Factor Frt Flt Protected Satd. Flow (prot) Flt Permitted Satd. Flow (perm) Volume (vph) Peak-hour factor, PHF Adj. Flow (vph) RTOR Reduction (vph) Lane Group Flow (vph) Turn Type Prot Perm pm+pt Perm pm+pt Prot Protected Phases Permitted Phases Actuated Green, G (s) Effective Green, g (s) Actuated g/c Ratio Clearance Time (s) Vehicle Extension (s) Lane Grp Cap (vph) v/s Ratio Prot c c0.35 c c0.28 v/s Ratio Perm v/c Ratio Uniform Delay, d Progression Factor Incremental Delay, d Delay (s) Level of Service F D C D E C F D D E Approach Delay (s) Approach LOS D D E E Intersection Summary HCM Average Control Delay 53.8 HCM Level of Service D HCM Volume to Capacity ratio 0.97 Actuated Cycle Length (s) Sum of lost time (s) 16.0 Intersection Capacity Utilization 103.5% ICU Level of Service G Analysis Period (min) 15 c Critical Lane Group SNC Lavalin Synchro 6 Report Page 21
274 Queues Weekdays PM - Future Total Traffic : Homer Watson Blvd. & Doon South Dr. Option 1 Lane Group EBL EBT EBR WBL WBT WBR NBL NBT NBR SBL SBT SBR Lane Configurations Total Lost Time (s) Satd. Flow (prot) Flt Permitted Satd. Flow (perm) Satd. Flow (RTOR) Volume (vph) Lane Group Flow (vph) Turn Type Perm Perm pm+pt Split Split Perm Protected Phases Permitted Phases Total Split (s) Act Effct Green (s) Actuated g/c Ratio v/c Ratio Control Delay Queue Delay Total Delay LOS B A D A E B Approach Delay Approach LOS B B D Queue Length 50th (m) Queue Length 95th (m) # # Internal Link Dist (m) Turn Bay Length (m) Base Capacity (vph) Starvation Cap Reductn Spillback Cap Reductn Storage Cap Reductn Reduced v/c Ratio Intersection Summary Cycle Length: 120 Actuated Cycle Length: Control Type: Semi Act-Uncoord Maximum v/c Ratio: 0.83 Intersection Signal Delay: 15.7 Intersection LOS: B ICU Level of Service F Intersection Capacity Utilization 99.0% Analysis Period (min) 15 # 95th percentile volume exceeds capacity, queue may be longer. Queue shown is maximum after two cycles. Splits and Phases: 38: Homer Watson Blvd. & Doon South Dr. SNC Lavalin Synchro 6 Report Page 22
275 HCM Signalized Intersection Capacity Analysis Weekdays PM - Future Total Traffic : Homer Watson Blvd. & Doon South Dr. Option 1 Movement EBL EBT EBR WBL WBT WBR NBL NBT NBR SBL SBT SBR Lane Configurations Ideal Flow (vphpl) Total Lost time (s) Lane Util. Factor Frt Flt Protected Satd. Flow (prot) Flt Permitted Satd. Flow (perm) Volume (vph) Peak-hour factor, PHF Adj. Flow (vph) RTOR Reduction (vph) Lane Group Flow (vph) Turn Type Perm Perm pm+pt Split Split Perm Protected Phases Permitted Phases Actuated Green, G (s) Effective Green, g (s) Actuated g/c Ratio Clearance Time (s) Vehicle Extension (s) Lane Grp Cap (vph) v/s Ratio Prot c0.68 c v/s Ratio Perm v/c Ratio Uniform Delay, d Progression Factor Incremental Delay, d Delay (s) Level of Service B B D A D D Approach Delay (s) Approach LOS B B D A Intersection Summary HCM Average Control Delay 16.5 HCM Level of Service B HCM Volume to Capacity ratio 0.81 Actuated Cycle Length (s) Sum of lost time (s) 8.0 Intersection Capacity Utilization 99.0% ICU Level of Service F Analysis Period (min) 15 c Critical Lane Group SNC Lavalin Synchro 6 Report Page 23
276 Queues Weekdays PM - Future Total Traffic : Pioneer Drive & Manitou Drive Option 1 Lane Group EBL EBT EBR WBL WBT WBR NBL NBT NBR SBL SBT SBR Lane Configurations Total Lost Time (s) Satd. Flow (prot) Flt Permitted Satd. Flow (perm) Satd. Flow (RTOR) Volume (vph) Lane Group Flow (vph) Turn Type Perm Perm Perm Perm Perm Perm Perm Protected Phases Permitted Phases Total Split (s) Act Effct Green (s) Actuated g/c Ratio v/c Ratio Control Delay Queue Delay Total Delay LOS B B D A C A B C A Approach Delay Approach LOS B D C B Queue Length 50th (m) Queue Length 95th (m) # Internal Link Dist (m) Turn Bay Length (m) Base Capacity (vph) Starvation Cap Reductn Spillback Cap Reductn Storage Cap Reductn Reduced v/c Ratio Intersection Summary Cycle Length: 90 Actuated Cycle Length: 61.6 Control Type: Semi Act-Uncoord Maximum v/c Ratio: 0.88 Intersection Signal Delay: 18.4 Intersection LOS: B ICU Level of Service E Intersection Capacity Utilization 88.9% Analysis Period (min) 15 # 95th percentile volume exceeds capacity, queue may be longer. Queue shown is maximum after two cycles. Splits and Phases: 39: Pioneer Drive & Manitou Drive SNC Lavalin Synchro 6 Report Page 24
277 HCM Signalized Intersection Capacity Analysis Weekdays PM - Future Total Traffic : Pioneer Drive & Manitou Drive Option 1 Movement EBL EBT EBR WBL WBT WBR NBL NBT NBR SBL SBT SBR Lane Configurations Ideal Flow (vphpl) Total Lost time (s) Lane Util. Factor Frt Flt Protected Satd. Flow (prot) Flt Permitted Satd. Flow (perm) Volume (vph) Peak-hour factor, PHF Adj. Flow (vph) RTOR Reduction (vph) Lane Group Flow (vph) Turn Type Perm Perm Perm Perm Perm Perm Perm Protected Phases Permitted Phases Actuated Green, G (s) Effective Green, g (s) Actuated g/c Ratio Clearance Time (s) Vehicle Extension (s) Lane Grp Cap (vph) v/s Ratio Prot c v/s Ratio Perm c v/c Ratio Uniform Delay, d Progression Factor Incremental Delay, d Delay (s) Level of Service A A A A C B B B B Approach Delay (s) Approach LOS A A C B Intersection Summary HCM Average Control Delay 11.9 HCM Level of Service B HCM Volume to Capacity ratio 0.58 Actuated Cycle Length (s) 61.5 Sum of lost time (s) 8.0 Intersection Capacity Utilization 88.9% ICU Level of Service E Analysis Period (min) 15 c Critical Lane Group SNC Lavalin Synchro 6 Report Page 25
278 Queues Weekdays PM - Future Total Traffic : Homer Watson & Pioneer Dr. Option 1 Lane Group SEL SET SER NWL NWT NWR NEL NET NER SWL SWT SWR Lane Configurations Total Lost Time (s) Satd. Flow (prot) Flt Permitted Satd. Flow (perm) Satd. Flow (RTOR) Volume (vph) Lane Group Flow (vph) Turn Type pm+pt Perm pm+pt Perm pm+pt Perm Perm Protected Phases Permitted Phases Total Split (s) Act Effct Green (s) Actuated g/c Ratio v/c Ratio Control Delay Queue Delay Total Delay LOS E C A F D A D F A D D Approach Delay Approach LOS C D E D Queue Length 50th (m) Queue Length 95th (m) # #103.3 # # Internal Link Dist (m) Turn Bay Length (m) Base Capacity (vph) Starvation Cap Reductn Spillback Cap Reductn Storage Cap Reductn Reduced v/c Ratio Intersection Summary Cycle Length: 130 Actuated Cycle Length: 130 Control Type: Semi Act-Uncoord Maximum v/c Ratio: 0.98 Intersection Signal Delay: 38.3 Intersection LOS: D ICU Level of Service F Intersection Capacity Utilization 96.4% Analysis Period (min) 15 # 95th percentile volume exceeds capacity, queue may be longer. Queue shown is maximum after two cycles. Splits and Phases: 45: Homer Watson & Pioneer Dr. SNC Lavalin Synchro 6 Report Page 26
279 HCM Signalized Intersection Capacity Analysis Weekdays PM - Future Total Traffic : Homer Watson & Pioneer Dr. Option 1 Movement SEL SET SER NWL NWT NWR NEL NET NER SWL SWT SWR Lane Configurations Ideal Flow (vphpl) Total Lost time (s) Lane Util. Factor Frt Flt Protected Satd. Flow (prot) Flt Permitted Satd. Flow (perm) Volume (vph) Peak-hour factor, PHF Adj. Flow (vph) RTOR Reduction (vph) Lane Group Flow (vph) Parking (#/hr) 0 Turn Type pm+pt Perm pm+pt Perm pm+pt Perm Perm Protected Phases Permitted Phases Actuated Green, G (s) Effective Green, g (s) Actuated g/c Ratio Clearance Time (s) Vehicle Extension (s) Lane Grp Cap (vph) v/s Ratio Prot c c v/s Ratio Perm c c v/c Ratio Uniform Delay, d Progression Factor Incremental Delay, d Delay (s) Level of Service D C B F D B D F D D D Approach Delay (s) Approach LOS C D E D Intersection Summary HCM Average Control Delay 39.7 HCM Level of Service D HCM Volume to Capacity ratio 0.95 Actuated Cycle Length (s) Sum of lost time (s) 8.0 Intersection Capacity Utilization 96.4% ICU Level of Service F Analysis Period (min) 15 c Critical Lane Group SNC Lavalin Synchro 6 Report Page 27
280 Queues Weekdays PM - Future Total Traffic : Homer Watson Blvd. & Conestoga College Blvd Option 1 Lane Group EBL EBT EBR WBL WBT WBR NBL NBT NBR SBL SBT SBR Lane Configurations Total Lost Time (s) Satd. Flow (prot) Flt Permitted Satd. Flow (perm) Satd. Flow (RTOR) Volume (vph) Lane Group Flow (vph) Turn Type Prot Perm pm+pt Free pm+pt pm+pt Perm Protected Phases Permitted Phases 4 8 Free Total Split (s) Act Effct Green (s) Actuated g/c Ratio v/c Ratio Control Delay Queue Delay Total Delay LOS C B A D D A D C E D B Approach Delay Approach LOS B D D D Queue Length 50th (m) Queue Length 95th (m) #37.6 # # Internal Link Dist (m) Turn Bay Length (m) Base Capacity (vph) Starvation Cap Reductn Spillback Cap Reductn Storage Cap Reductn Reduced v/c Ratio Intersection Summary Cycle Length: 120 Actuated Cycle Length: Control Type: Semi Act-Uncoord Maximum v/c Ratio: 1.00 Intersection Signal Delay: 34.4 Intersection LOS: C ICU Level of Service E Intersection Capacity Utilization 82.4% Analysis Period (min) 15 # 95th percentile volume exceeds capacity, queue may be longer. Queue shown is maximum after two cycles. Splits and Phases: 50: Homer Watson Blvd. & Conestoga College Blvd SNC Lavalin Synchro 6 Report Page 28
281 HCM Signalized Intersection Capacity Analysis Weekdays PM - Future Total Traffic : Homer Watson Blvd. & Conestoga College Blvd Option 1 Movement EBL EBT EBR WBL WBT WBR NBL NBT NBR SBL SBT SBR Lane Configurations Ideal Flow (vphpl) Total Lost time (s) Lane Util. Factor Frt Flt Protected Satd. Flow (prot) Flt Permitted Satd. Flow (perm) Volume (vph) Peak-hour factor, PHF Adj. Flow (vph) RTOR Reduction (vph) Lane Group Flow (vph) Turn Type Prot Perm pm+pt Free pm+pt pm+pt Perm Protected Phases Permitted Phases 4 8 Free Actuated Green, G (s) Effective Green, g (s) Actuated g/c Ratio Clearance Time (s) Vehicle Extension (s) Lane Grp Cap (vph) v/s Ratio Prot 0.04 c0.48 c0.03 c c v/s Ratio Perm c v/c Ratio Uniform Delay, d Progression Factor Incremental Delay, d Delay (s) Level of Service C B A D D A D D E D D Approach Delay (s) Approach LOS B D D D Intersection Summary HCM Average Control Delay 37.3 HCM Level of Service D HCM Volume to Capacity ratio 0.94 Actuated Cycle Length (s) Sum of lost time (s) 20.0 Intersection Capacity Utilization 82.4% ICU Level of Service E Analysis Period (min) 15 c Critical Lane Group SNC Lavalin Synchro 6 Report Page 29
282 Queues Weekdays PM - Future Total Traffic : Homer Watson Blvd. & New Dundee Road Option 1 Lane Group EBL EBT EBR WBL WBT WBR NBL NBT NBR SBL SBT SBR Lane Configurations Total Lost Time (s) Satd. Flow (prot) Flt Permitted Satd. Flow (perm) Satd. Flow (RTOR) Volume (vph) Lane Group Flow (vph) Turn Type Perm pm+pt Perm custom Free Perm Free Protected Phases Permitted Phases Free 6 Free Total Split (s) Act Effct Green (s) Actuated g/c Ratio v/c Ratio Control Delay Queue Delay Total Delay LOS C B F A A C A C D A Approach Delay Approach LOS C F B Queue Length 50th (m) ~ Queue Length 95th (m) # Internal Link Dist (m) Turn Bay Length (m) Base Capacity (vph) Starvation Cap Reductn Spillback Cap Reductn Storage Cap Reductn Reduced v/c Ratio Intersection Summary Cycle Length: 100 Actuated Cycle Length: 97.1 Control Type: Semi Act-Uncoord Maximum v/c Ratio: 2.23 Intersection Signal Delay: 70.0 Intersection LOS: E ICU Level of Service G Intersection Capacity Utilization 101.8% Analysis Period (min) 15 ~ Volume exceeds capacity, queue is theoretically infinite. Queue shown is maximum after two cycles. # 95th percentile volume exceeds capacity, queue may be longer. Queue shown is maximum after two cycles. SNC Lavalin Synchro 6 Report Page 30
283 Queues Weekdays PM - Future Total Traffic : Homer Watson Blvd. & New Dundee Road Option 1 Splits and Phases: 53: Homer Watson Blvd. & New Dundee Road SNC Lavalin Synchro 6 Report Page 31
284 HCM Signalized Intersection Capacity Analysis Weekdays PM - Future Total Traffic : Homer Watson Blvd. & New Dundee Road Option 1 Movement EBL EBT EBR WBL WBT WBR NBL NBT NBR SBL SBT SBR Lane Configurations Ideal Flow (vphpl) Total Lost time (s) Lane Util. Factor Frt Flt Protected Satd. Flow (prot) Flt Permitted Satd. Flow (perm) Volume (vph) Peak-hour factor, PHF Adj. Flow (vph) RTOR Reduction (vph) Lane Group Flow (vph) Parking (#/hr) 0 Turn Type Perm pm+pt Perm custom Free Perm Free Protected Phases Permitted Phases Free 6 Free Actuated Green, G (s) Effective Green, g (s) Actuated g/c Ratio Clearance Time (s) Vehicle Extension (s) Lane Grp Cap (vph) v/s Ratio Prot 0.36 c v/s Ratio Perm 0.01 c c0.83 v/c Ratio Uniform Delay, d Progression Factor Incremental Delay, d Delay (s) Level of Service C B F A A C A C C A Approach Delay (s) Approach LOS C F A B Intersection Summary HCM Average Control Delay 70.6 HCM Level of Service E HCM Volume to Capacity ratio 1.70 Actuated Cycle Length (s) 97.1 Sum of lost time (s) 4.0 Intersection Capacity Utilization 101.8% ICU Level of Service G Analysis Period (min) 15 c Critical Lane Group SNC Lavalin Synchro 6 Report Page 32
285 HCM Unsignalized Intersection Capacity Analysis Weekdays PM - Future Total Traffic : ConesToga College & New Dundee Rd. Option 1 Movement EBL EBR NBL NBT SBT SBR Lane Configurations Sign Control Stop Free Free Grade 0% 0% 0% Volume (veh/h) Peak Hour Factor Hourly flow rate (vph) Pedestrians Lane Width (m) Walking Speed (m/s) Percent Blockage Right turn flare (veh) Median type TWLTL Median storage veh) 2 Upstream signal (m) 149 px, platoon unblocked vc, conflicting volume vc1, stage 1 conf vol 1330 vc2, stage 2 conf vol 563 vcu, unblocked vol tc, single (s) tc, 2 stage (s) 5.8 tf (s) p0 queue free % cm capacity (veh/h) Direction, Lane # EB 1 EB 2 NB 1 NB 2 NB 3 SB 1 SB 2 SB 3 Volume Total Volume Left Volume Right csh Volume to Capacity Queue Length 95th (m) Control Delay (s) Lane LOS D C C Approach Delay (s) Approach LOS C Intersection Summary Average Delay 3.1 Intersection Capacity Utilization 58.3% ICU Level of Service B Analysis Period (min) 15 SNC Lavalin Synchro 6 Report Page 33
286 Queues Weekdays PM - Future Total Traffic : New Dundee Rd & Thomas Slee Dr. Option 1 Lane Group EBL EBT EBR WBL WBT WBR NBL NBT NBR SBL SBT SBR Lane Configurations Total Lost Time (s) Satd. Flow (prot) Flt Permitted Satd. Flow (perm) Satd. Flow (RTOR) Volume (vph) Lane Group Flow (vph) Turn Type Perm Perm Perm Perm Perm Perm Protected Phases Permitted Phases Total Split (s) Act Effct Green (s) Actuated g/c Ratio v/c Ratio Control Delay Queue Delay Total Delay LOS A A A A D A Approach Delay Approach LOS A A C Queue Length 50th (m) Queue Length 95th (m) Internal Link Dist (m) Turn Bay Length (m) Base Capacity (vph) Starvation Cap Reductn Spillback Cap Reductn Storage Cap Reductn Reduced v/c Ratio Intersection Summary Cycle Length: 90 Actuated Cycle Length: 95.5 Control Type: Semi Act-Uncoord Maximum v/c Ratio: 0.47 Intersection Signal Delay: 4.4 Intersection Capacity Utilization 55.4% Analysis Period (min) 15 Intersection LOS: A ICU Level of Service B Splits and Phases: 57: New Dundee Rd & Thomas Slee Dr. SNC Lavalin Synchro 6 Report Page 34
287 HCM Signalized Intersection Capacity Analysis Weekdays PM - Future Total Traffic : New Dundee Rd & Thomas Slee Dr. Option 1 Movement EBL EBT EBR WBL WBT WBR NBL NBT NBR SBL SBT SBR Lane Configurations Ideal Flow (vphpl) Total Lost time (s) Lane Util. Factor Frt Flt Protected Satd. Flow (prot) Flt Permitted Satd. Flow (perm) Volume (vph) Peak-hour factor, PHF Adj. Flow (vph) RTOR Reduction (vph) Lane Group Flow (vph) Turn Type Perm Perm Perm Perm Perm Perm Protected Phases Permitted Phases Actuated Green, G (s) Effective Green, g (s) Actuated g/c Ratio Clearance Time (s) Vehicle Extension (s) Lane Grp Cap (vph) v/s Ratio Prot 0.20 c v/s Ratio Perm c0.04 v/c Ratio Uniform Delay, d Progression Factor Incremental Delay, d Delay (s) Level of Service A A A A D D Approach Delay (s) Approach LOS A A A D Intersection Summary HCM Average Control Delay 4.9 HCM Level of Service A HCM Volume to Capacity ratio 0.46 Actuated Cycle Length (s) 96.2 Sum of lost time (s) 8.0 Intersection Capacity Utilization 55.4% ICU Level of Service B Analysis Period (min) 15 c Critical Lane Group SNC Lavalin Synchro 6 Report Page 35
288 HCM Unsignalized Intersection Capacity Analysis Weekdays PM - Future Total Traffic : New Dundee Road & Collector"B" Option 1 Movement EBL EBT WBT WBR SBL SBR Lane Configurations Sign Control Free Free Stop Grade 0% 0% 0% Volume (veh/h) Peak Hour Factor Hourly flow rate (vph) Pedestrians Lane Width (m) Walking Speed (m/s) Percent Blockage Right turn flare (veh) Median type TWLTL Median storage veh) 1 Upstream signal (m) px, platoon unblocked vc, conflicting volume vc1, stage 1 conf vol 1212 vc2, stage 2 conf vol 412 vcu, unblocked vol tc, single (s) tc, 2 stage (s) 5.8 tf (s) p0 queue free % cm capacity (veh/h) Direction, Lane # EB 1 EB 2 EB 3 WB 1 WB 2 SB 1 SB 2 Volume Total Volume Left Volume Right csh Volume to Capacity Queue Length 95th (m) Control Delay (s) Lane LOS B D B Approach Delay (s) Approach LOS C Intersection Summary Average Delay 1.2 Intersection Capacity Utilization 49.9% ICU Level of Service A Analysis Period (min) 15 SNC Lavalin Synchro 6 Report Page 36
289 HCM Unsignalized Intersection Capacity Analysis Weekdays PM - Future Total Traffic : New Dundee Rd & Reichert Dr. Option 1 Movement EBT EBR WBL WBT NBL NBR Lane Configurations Sign Control Free Free Stop Grade 0% 0% 0% Volume (veh/h) Peak Hour Factor Hourly flow rate (vph) Pedestrians Lane Width (m) Walking Speed (m/s) Percent Blockage Right turn flare (veh) Median type None Median storage veh) Upstream signal (m) px, platoon unblocked vc, conflicting volume vc1, stage 1 conf vol vc2, stage 2 conf vol vcu, unblocked vol tc, single (s) tc, 2 stage (s) tf (s) p0 queue free % cm capacity (veh/h) Direction, Lane # EB 1 EB 2 WB 1 WB 2 NB 1 Volume Total Volume Left Volume Right csh Volume to Capacity Queue Length 95th (m) Control Delay (s) Lane LOS A C Approach Delay (s) Approach LOS C Intersection Summary Average Delay 1.1 Intersection Capacity Utilization 69.2% ICU Level of Service C Analysis Period (min) 15 SNC Lavalin Synchro 6 Report Page 38
290 Page 1 of /10/18 DETAILED OUTPUT Blair Creek Drive-N-Strasburg Road Option 1 Blair Creek Drive-N-Strasburg Road Drive-Weekday AM 2018 OUTPUT TABLE LINKS s Basic Parameters Gap Acceptance Parameters Movements Movement Capacity Parameters Movement Performance Fuel Consumption, Emissions and Cost (Total) Fuel Consumption, Emissions and Cost (Rate) Intersection Negotiation Data Movement Speeds and Geometric Delay Lanes Lane Performance Lane Flow and Capacity Information Lane, Approach and Intersection Performance Driver Characteristics Lane Delays Lane Queues (Vehicles) Lane Queues (Distance) Lane Queue Percentiles (Vehicles) Lane Queue Percentiles (Distance) Lane Stops Flow Rates and Demand Analysis Movement Definitions and Flow Rates (O-D) Flow Rates (Separate Light and Heavy Vehicles) Flow Rates (Total Vehicles and Percent Heavy) Other Model Settings Parameters Used in Cost Calculations Diagnostics s Basic Parameters Site:Blair Creek Drive-N-Strasburg Road-Weekday AM Circulating/Exiting Stream Cent Circ Insc Ent Ent Cir Ent Av.Ent Island Width Diam. Rad Ang Lan Lan Lane Flow %HV Adjust. %Exit Cap. O-D Diam Width Flow Incl. Constr. Factor m m m m deg m veh/h pcu/h Effect Environment Factor: 1.20 Entry/Circulating Flow Adjustment: Medium N East: Blair Creek Drive Environment Factor: 1.20 Entry/Circulating Flow Adjustment: Medium N Environment Factor: 1.20 Entry/Circulating Flow Adjustment: Medium N 0.984
291 Page 2 of /10/ Capacity Model: SIDRA Standard HV Method for Gap Acceptance: Include HV Effect for all percentages Gap Acceptance Parameters Site:Blair Creek Drive-N-Strasburg Road-Weekday AM Turn Lane Lane ---- Circulating/Exiting Stream --- Critical Gap No. Type Flow Aver Aver In-Bnch Prop Foll-up Rate Speed Dist Headway Bunched Hdwy Dist Headway pcu/h km/h m sec sec m sec Environment Factor: 1.20 Entry/Circulating Flow Adjustment: Medium Thru 1 Subdominant Dominant Right 2 Dominant East: Blair Creek Drive Environment Factor: 1.20 Entry/Circulating Flow Adjustment: Medium Left 1 Subdominant Right 2 Dominant Environment Factor: 1.20 Entry/Circulating Flow Adjustment: Medium Left 1 Subdominant Thru 1 Subdominant Dominant Capacity Model: SIDRA Standard P Priority sharing is implied for some movements (Follow-up Headway plus Intra-bunch Headway is larger than the Critical Gap). The O-D Factor ( Basic Parameters table) allows for priority sharing and priority emphasis. Dist (Distance): Spacing, i.e. distance between the front ends of two successive vehicles across all lanes in the circulating or exiting stream Movements Movement Capacity Parameters Site:Blair Creek Drive-N-Strasburg Road-Weekday AM Mov Opposing Movement Total Prac. Prac. Lane Deg. ID Demand Adjust. Cap. Deg. Spare Util Satn Flow HV Flow HV Flow Satn Cap. veh/h % veh/h % pcu/h veh/h xp % % x T T R R East: Blair Creek Drive 1L L R R L L * 4T T * * Maximum degree of saturation
292 Page 3 of /10/18 Movement Performance Site:Blair Creek Drive-N-Strasburg Road-Weekday AM Mov Total Total Aver. Eff. Total Perf. Tot.Trav. Tot.Trav. Aver. ID Delay Delay Delay Stop Stops Index Distance Time Speed (veh-h/h)(pers-h/h)(sec) Rate (veh-km/h)(veh-h/h) (km/h) T T R R East: Blair Creek Drive 1L L R R L L T T Fuel Consumption, Emissions and Cost (Total) Site:Blair Creek Drive-N-Strasburg Road-Weekday AM 2018 Mov Cost Fuel CO2 CO HC NOX ID Total Total Total Total Total Total $/h L/h kg/h kg/h kg/h kg/h 8T T R R East: Blair Creek Drive 1L L R R L L T T INTERSECTION: Fuel Consumption, Emissions and Cost (Rate) Site:Blair Creek Drive-N-Strasburg Road-Weekday AM 2018 Mov Cost Fuel CO2 CO HC NOX ID Rate Rate Rate Rate Rate Rate $/km L/100km g/km g/km g/km g/km 8T T R R
293 Page 4 of /10/18 East: Blair Creek Drive 1L L R R L L T T INTERSECTION: Intersection Negotiation Data Site:Blair Creek Drive-N-Strasburg Road-Weekday AM Negn Negn Negn Appr. Downstream Distance From To Radius Speed Dist. Dist Approach Approach Turn m km/h m m m User Spec? East Right No North Thru No East: Blair Creek Drive South Left No North Right No South Thru No East Left No Maximum Negotiation (Design) Speed = 50.0 km/h Downstream distance is distance travelled from the stopline until exit cruise speed is reached (includes negotiation distance). Acceleration distance is weighted for light and heavy vehicles. The same distance applies for both stopped and unstopped vehicles. Movement Speeds and Geometric Delay Site:Blair Creek Drive-N-Strasburg Road-Weekday AM Queue Move-up App. Speeds Exit Speeds Av. Section Spd Geom Mov st 2nd Delay ID Cruise Negn Negn Cruise Grn Grn Running Overall sec T T R R East: Blair Creek Drive 1L L R R L L T T "Running Speed" is the average speed excluding stopped periods. HCM Delay Formula option used: Geometric Delay is not included in Control Delay.
294 Page 5 of /10/18 Lanes Lane Performance Site:Blair Creek Drive-N-Strasburg Road-Weekday AM 2018 Q u e u e Flow Cap Deg. Aver. Eff. 95% Back Lane Lane Satn Delay Stop Length No. veh/h veh/h x sec Rate veh m m 1 T TR East: Blair Creek Drive 1 L R T 1 LT T T Short lane due to specification of Turn Bay Lane Flow and Capacity Information Site:Blair Creek Drive-N-Strasburg Road-Weekday AM Lane Dem Flow (veh/h) Min Tot Deg. Lane No Cap Cap Satn Util Lef Thru Rig Tot veh/h veh/h x % T TR East: Blair Creek Drive 1 L R LT T The capacity value for priority and continuous movements is obtained by adjusting the basic saturation flow for heavy vehicle and turning vehicle effects. Saturation flow scale applies if specified. Lane, Approach and Intersection Performance Site:Blair Creek Drive-N-Strasburg Road-Weekday AM Lane Demand Flow (veh/h) Adj. Eff Grn Deg Aver. Longest Shrt No %HV Basic (sec) Sat Delay Queue Lane L T R Tot Satf. 1st 2nd x sec m m T
295 Page 6 of /10/18 2 TR East: Blair Creek Drive 1 L R LT T ========================================================================== ALL VEHICLES Total % Max Aver. Max Flow HV X Delay Queue ========================================================================== Peak flow period = 15 minutes. Queue values in this table are 95% queue (metres) Note: Basic Saturation Flows are not adjusted at roundabouts or signcontrolled intersections and apply only to continuous lanes. Driver Characteristics Site:Blair Creek Drive-N-Strasburg Road-Weekday AM Average Driver Lane Satn Satn Satn Satn Queue Response No. Speed Flow Hdwy Spacing Space Time km/h veh/h sec m m sec T TR East: Blair Creek Drive 1 L R NA - Short Lane LT T Saturation Flow and Saturation Headway are derived from follow-up headway. Lane Delays Site:Blair Creek Drive-N-Strasburg Road-Weekday AM Delay (seconds/veh) Deg. Stop-line Delay Acc. Queuing Stopd Lane Satn 1st 2nd Total Dec. Total MvUp (Idle) Geom Control No. x d1 d2 dsl dn dq dqm di dig dic T TR East: Blair Creek Drive 1 L R
296 Page 7 of /10/18 1 LT T HCM Delay Formula option used: (i) Control Delay does not include Geometric Delay, (ii) Stop-line Delay is treated as being same as Control Delay. dsl: Stop-line delay (=d1+d2) dn: Average stop-start delay for all vehicles queued and unqueued dq: Queuing delay (the part of the stop-line delay that includes stopped delay and queue move-up delay) dqm: Queue move-up delay di: Stopped delay (stopped (idling) time at near-zero speed) dig: Geometric delay dic: Intersection control delay (sum of stop-line and geometric delays) Lane Queues (Vehicles) Site:Blair Creek Drive-N-Strasburg Road-Weekday AM Deg. Ovrfl. Back of Queue (veh) Queue Prob. P'ile Cyc-Av. Queue Lane Satn Queue Stor. Block Block No. x No Nb1 Nb2 Nb 95% Ratio % % Nc 95% T TR East: Blair Creek Drive 1 L R LT T HCM Delay Formula option used: Cycle-Average Queue is calculated using average delay from the HCM equation. (i.e. HCM delays are treated as stop-line delays for this purpose). SIDRA Standard models are used for Back of Queue estimation since HCM only gives Cycle-Average Queues for unsignalised intersections. Lane Queues (Distance) Site:Blair Creek Drive-N-Strasburg Road-Weekday AM Deg. Ovrfl. Back of Queue (m) Queue Prob. P'ile Cyc-Av. Queue Lane Satn Queue Stor. Block Block No. x No Nb1 Nb2 Nb 95% Ratio % % Nc 95% T TR East: Blair Creek Drive 1 L R LT T HCM Delay Formula option used: Cycle-Average Queue is calculated using average delay from the HCM equation. (i.e. HCM delays are treated as stop-line delays for this purpose). SIDRA Standard models are used for Back of Queue estimation since HCM only gives Cycle-Average Queues for unsignalised intersections.
297 Page 8 of /10/18 Lane Queue Percentiles (Vehicles) Site:Blair Creek Drive-N-Strasburg Road-Weekday AM Deg. Percentile Back of Queue (veh) Lane Satn No. x 50% 70% 85% 90% 95% 98% T TR East: Blair Creek Drive 1 L R LT T SIDRA Standard models are used for Back of Queue estimation since HCM only gives Cycle-Average Queues for unsignalised intersections. Lane Queue Percentiles (Distance) Site:Blair Creek Drive-N-Strasburg Road-Weekday AM Deg. Percentile Back of Queue (metres) Lane Satn No. x 50% 70% 85% 90% 95% 98% T TR East: Blair Creek Drive 1 L R LT T SIDRA Standard models are used for Back of Queue estimation since HCM only gives Cycle-Average Queues for unsignalised intersections. Lane Stops Site:Blair Creek Drive-N-Strasburg Road-Weekday AM Queue Total Deg. -- Effective Stop Rate -- Total Move-up Queue Prop. Lane Satn Geom. Overall Stops Rate Move-ups Queued No. x he1 he2 hig h H hqm Hqm pq T TR
298 Page 9 of /10/18 East: Blair Creek Drive 1 L R LT T hig is the average value for all movements in a shared lane hqm is average queue move-up rate for all vehicles queued and unqueued Flow Rates and Demand Analysis Movement Definitions and Flow Rates (O-D) Site:Blair Creek Drive-N-Strasburg Road-Weekday AM From To Mov Flow Rate Flow Scale Peak Flow Approach Approach ID Turn LV HV Fixed Var Factor East 8R Right North 8T Thru East: Blair Creek Drive South 1L Left North 6R Right South 4T Thru East 7L Left Unit Time for Volumes = 60 minutes Peak Flow Period = 15 minutes Flow Rates include effects of Flow Scale and Peak Flow Factor Flow Rates (Separate Light and Heavy Vehicles) Site:Blair Creek Drive-N-Strasburg Road-Weekday AM 2018 Mov Left Through Right ID LV HV LV HV LV HV Demand flows in veh/h as used by the program 8T T R R East: Blair Creek Drive 1L L R R L L T T Unit Time for Volumes = 60 minutes Peak Flow Period = 15 minutes Flow Rates include effects of Flow Scale and Peak Flow Factor
299 Page 10 of /10/18 Flow Rates (Total Vehicles and Percent Heavy) Site:Blair Creek Drive-N-Strasburg Road-Weekday AM Mov Left Through Right ID Total %HV Total %HV Total %HV --- Demand flows in veh/h as used by the program 8T T R R East: Blair Creek Drive 1L L R R L L T T Unit Time for Volumes = 60 minutes Peak Flow Period = 15 minutes Flow Rates include effects of Flow Scale and Peak Flow Factor Other Model Settings Site:Blair Creek Drive-N-Strasburg Road-Weekday AM 2018 * Basic Parameters: Intersection Type: Driving on the right-hand side of the road Input data specified in Metric units Model Defaults: US HCM (Metric) Peak Flow Period (for performance): 15 minutes Unit time (for volumes): 60 minutes. HCM Delay Model option used HCM Queue Model option used Level of Service based on: Delay (HCM 2000) Queue percentile: 95% Parameters Used in Cost Calculations Site:Blair Creek Drive-N-Strasburg Road-Weekday AM 2018 Pump price of fuel ($/L) = Fuel resource cost factor = 0.70 Ratio of running cost to fuel cost = 3.0 Average income ($/h) = Time value factor = 0.40 Light vehicle mass (1000 kg) = 1.4 Heavy vehicle mass (1000 kg) = 11.0 Light vehicle idle fuel rate (L/h) = Heavy vehicle idle fuel rate (L/h) = Diagnostics Site:Blair Creek Drive-N-Strasburg Road-Weekday AM 2018
300 Page 11 of /10/18 Processed: October 18, :18:29 AM Copyright Akcelik and Associates Pty Ltd SIDRA INTERSECTION Project: H:\DATA\ Transportation Planning\Working\Strasburg Road\SIDRA Files\PC\East-West Collector and Strasburg Road Op 1.sip , SNC-LAVALIN INC, SINGLE
301 Page 1 of /10/18 DETAILED OUTPUT Blair Creek-N-Strasburg Road Option 1 Blair Creek-N-Strasburg Road Drive-Weekday PM 2018 OUTPUT TABLE LINKS s Basic Parameters Gap Acceptance Parameters Movements Movement Capacity Parameters Movement Performance Fuel Consumption, Emissions and Cost (Total) Fuel Consumption, Emissions and Cost (Rate) Intersection Negotiation Data Movement Speeds and Geometric Delay Lanes Lane Performance Lane Flow and Capacity Information Lane, Approach and Intersection Performance Driver Characteristics Lane Delays Lane Queues (Vehicles) Lane Queues (Distance) Lane Queue Percentiles (Vehicles) Lane Queue Percentiles (Distance) Lane Stops Flow Rates and Demand Analysis Movement Definitions and Flow Rates (O-D) Flow Rates (Separate Light and Heavy Vehicles) Flow Rates (Total Vehicles and Percent Heavy) Other Model Settings Parameters Used in Cost Calculations Diagnostics s Basic Parameters Site: Blair Creek Drive-N-Strasburg Road-Weekday PM Circulating/Exiting Stream Cent Circ Insc Ent Ent Cir Ent Av.Ent Island Width Diam. Rad Ang Lan Lan Lane Flow %HV Adjust. %Exit Cap. O-D Diam Width Flow Incl. Constr. Factor m m m m deg m veh/h pcu/h Effect Environment Factor: 1.20 Entry/Circulating Flow Adjustment: Medium N East: Blair Creek Environment Factor: 1.20 Entry/Circulating Flow Adjustment: Medium N Environment Factor: 1.20 Entry/Circulating Flow Adjustment: Medium N 0.983
302 Page 2 of /10/ Capacity Model: SIDRA Standard HV Method for Gap Acceptance: Include HV Effect for all percentages Gap Acceptance Parameters Site:Blair Creek Collector-N-Strasburg Road-Weekday PM Turn Lane Lane ---- Circulating/Exiting Stream --- Critical Gap No. Type Flow Aver Aver In-Bnch Prop Foll-up Rate Speed Dist Headway Bunched Hdwy Dist Headway pcu/h km/h m sec sec m sec Environment Factor: 1.20 Entry/Circulating Flow Adjustment: Medium Thru 1 Subdominant D 2 Dominant Right 2 Dominant East: Blair Creek Environment Factor: 1.20 Entry/Circulating Flow Adjustment: Medium Left 1 Subdominant Right 2 Dominant Environment Factor: 1.20 Entry/Circulating Flow Adjustment: Medium Left 1 Subdominant Thru 1 Subdominant Dominant Capacity Model: SIDRA Standard P Priority sharing is implied for some movements (Follow-up Headway plus Intra-bunch Headway is larger than the Critical Gap). The O-D Factor ( Basic Parameters table) allows for priority sharing and priority emphasis. D Subdominant lane follow-up headway was calculated as less than the dominant lane value and was set to the dominant lane value Dist (Distance): Spacing, i.e. distance between the front ends of two successive vehicles across all lanes in the circulating or exiting stream Movements Movement Capacity Parameters Site:Blair Creek-N-Strasburg Road-Weekday PM Mov Opposing Movement Total Prac. Prac. Lane Deg. ID Demand Adjust. Cap. Deg. Spare Util Satn Flow HV Flow HV Flow Satn Cap. veh/h % veh/h % pcu/h veh/h xp % % x T T * 8R R * East: Blair Creek 1L L R R L L T T * Maximum degree of saturation
303 Page 3 of /10/18 Movement Performance Site:Blair Creek-N-Strasburg Road-Weekday PM Mov Total Total Aver. Eff. Total Perf. Tot.Trav. Tot.Trav. Aver. ID Delay Delay Delay Stop Stops Index Distance Time Speed (veh-h/h)(pers-h/h)(sec) Rate (veh-km/h)(veh-h/h) (km/h) T T R R East: Blair Creek 1L L R R L L T T Fuel Consumption, Emissions and Cost (Total) Site: Blair Creek-N-Strasburg Road-Weekday PM 2018 Mov Cost Fuel CO2 CO HC NOX ID Total Total Total Total Total Total $/h L/h kg/h kg/h kg/h kg/h 8T T R R East: Blair Creek 1L L R R L L T T INTERSECTION: Fuel Consumption, Emissions and Cost (Rate) Site:Blair Creek-N-Strasburg Road-Weekday PM 2018 Mov Cost Fuel CO2 CO HC NOX ID Rate Rate Rate Rate Rate Rate $/km L/100km g/km g/km g/km g/km 8T T R R
304 Page 4 of /10/ East: Blair Creek 1L L R R L L T T INTERSECTION: Intersection Negotiation Data Site:Blair Creek-N-Strasburg Road-Weekday PM Negn Negn Negn Appr. Downstream Distance From To Radius Speed Dist. Dist Approach Approach Turn m km/h m m m User Spec? East Right No North Thru No East: Blair Creek South Left No North Right No South Thru No East Left No Maximum Negotiation (Design) Speed = 50.0 km/h Downstream distance is distance travelled from the stopline until exit cruise speed is reached (includes negotiation distance). Acceleration distance is weighted for light and heavy vehicles. The same distance applies for both stopped and unstopped vehicles. Movement Speeds and Geometric Delay Site:Blair Creek-N-Strasburg Road-Weekday PM Queue Move-up App. Speeds Exit Speeds Av. Section Spd Geom Mov st 2nd Delay ID Cruise Negn Negn Cruise Grn Grn Running Overall sec T T R R East: Blair Creek 1L L R R L L T T "Running Speed" is the average speed excluding stopped periods. HCM Delay Formula option used: Geometric Delay is not included in Control Delay.
305 Page 5 of /10/18 Lanes Lane Performance Site:Blair Creek-N-Strasburg Road-Weekday PM 2018 Q u e u e Flow Cap Deg. Aver. Eff. 95% Back Lane Lane Satn Delay Stop Length No. veh/h veh/h x sec Rate veh m m 1 T TR East: Blair Creek 1 L R T 1 LT T T Short lane due to specification of Turn Bay Lane Flow and Capacity Information Site:Blair Creek-N-Strasburg Road-Weekday PM Lane Dem Flow (veh/h) Min Tot Deg. Lane No Cap Cap Satn Util Lef Thru Rig Tot veh/h veh/h x % T TR East: Blair Creek 1 L R LT T The capacity value for priority and continuous movements is obtained by adjusting the basic saturation flow for heavy vehicle and turning vehicle effects. Saturation flow scale applies if specified. Lane, Approach and Intersection Performance Site:Blair Creek-N-Strasburg Road-Weekday PM Lane Demand Flow (veh/h) Adj. Eff Grn Deg Aver. Longest Shrt No %HV Basic (sec) Sat Delay Queue Lane L T R Tot Satf. 1st 2nd x sec m m
306 Page 6 of /10/18 1 T TR East: Blair Creek 1 L R LT T ========================================================================== ALL VEHICLES Total % Max Aver. Max Flow HV X Delay Queue ========================================================================== Peak flow period = 15 minutes. Queue values in this table are 95% queue (metres) Note: Basic Saturation Flows are not adjusted at roundabouts or signcontrolled intersections and apply only to continuous lanes. Driver Characteristics Site:Blair Creek-N-Strasburg Road-Weekday PM Average Driver Lane Satn Satn Satn Satn Queue Response No. Speed Flow Hdwy Spacing Space Time km/h veh/h sec m m sec T TR East: Blair Creek 1 L R NA - Short Lane LT T Saturation Flow and Saturation Headway are derived from follow-up headway. Lane Delays Site:Blair Creek-N-Strasburg Road-Weekday PM Delay (seconds/veh) Deg. Stop-line Delay Acc. Queuing Stopd Lane Satn 1st 2nd Total Dec. Total MvUp (Idle) Geom Control No. x d1 d2 dsl dn dq dqm di dig dic T TR East: Blair Creek 1 L R
307 Page 7 of /10/18 1 LT T HCM Delay Formula option used: (i) Control Delay does not include Geometric Delay, (ii) Stop-line Delay is treated as being same as Control Delay. dsl: Stop-line delay (=d1+d2) dn: Average stop-start delay for all vehicles queued and unqueued dq: Queuing delay (the part of the stop-line delay that includes stopped delay and queue move-up delay) dqm: Queue move-up delay di: Stopped delay (stopped (idling) time at near-zero speed) dig: Geometric delay dic: Intersection control delay (sum of stop-line and geometric delays) Lane Queues (Vehicles) Site:Blair Creek-N-Strasburg Road-Weekday PM Deg. Ovrfl. Back of Queue (veh) Queue Prob. P'ile Cyc-Av. Queue Lane Satn Queue Stor. Block Block No. x No Nb1 Nb2 Nb 95% Ratio % % Nc 95% T TR East: Blair Creek 1 L R LT T HCM Delay Formula option used: Cycle-Average Queue is calculated using average delay from the HCM equation. (i.e. HCM delays are treated as stop-line delays for this purpose). SIDRA Standard models are used for Back of Queue estimation since HCM only gives Cycle-Average Queues for unsignalised intersections. Lane Queues (Distance) Site:Blair Creek-N-Strasburg Road-Weekday PM Deg. Ovrfl. Back of Queue (m) Queue Prob. P'ile Cyc-Av. Queue Lane Satn Queue Stor. Block Block No. x No Nb1 Nb2 Nb 95% Ratio % % Nc 95% T TR East: Blair Creek 1 L R LT T HCM Delay Formula option used: Cycle-Average Queue is calculated using average delay from the HCM equation. (i.e. HCM delays are treated as stop-line delays for this purpose). SIDRA Standard models are used for Back of Queue estimation since
308 Page 8 of /10/18 HCM only gives Cycle-Average Queues for unsignalised intersections. Lane Queue Percentiles (Vehicles) Site:Blair Creek-N-Strasburg Road-Weekday PM Deg. Percentile Back of Queue (veh) Lane Satn No. x 50% 70% 85% 90% 95% 98% T TR East: Blair Creek 1 L R LT T SIDRA Standard models are used for Back of Queue estimation since HCM only gives Cycle-Average Queues for unsignalised intersections. Lane Queue Percentiles (Distance) Site:Blair Creek-N-Strasburg Road-Weekday PM Deg. Percentile Back of Queue (metres) Lane Satn No. x 50% 70% 85% 90% 95% 98% T TR East: Blair Creek 1 L R LT T SIDRA Standard models are used for Back of Queue estimation since HCM only gives Cycle-Average Queues for unsignalised intersections. Lane Stops Site:Blair Creek-N-Strasburg Road-Weekday PM Queue Total Deg. -- Effective Stop Rate -- Total Move-up Queue Prop. Lane Satn Geom. Overall Stops Rate Move-ups Queued No. x he1 he2 hig h H hqm Hqm pq T TR
309 Page 9 of /10/ East: Blair Creek 1 L R LT T hig is the average value for all movements in a shared lane hqm is average queue move-up rate for all vehicles queued and unqueued Flow Rates and Demand Analysis Movement Definitions and Flow Rates (O-D) Site:Blair Creek-N-Strasburg Road-Weekday PM From To Mov Flow Rate Flow Scale Peak Flow Approach Approach ID Turn LV HV Fixed Var Factor East 8R Right North 8T Thru East: Blair Creek South 1L Left North 6R Right South 4T Thru East 7L Left Unit Time for Volumes = 60 minutes Peak Flow Period = 15 minutes Flow Rates include effects of Flow Scale and Peak Flow Factor Flow Rates (Separate Light and Heavy Vehicles) Site:Blair Creek-N-Strasburg Road-Weekday PM 2018 Mov Left Through Right ID LV HV LV HV LV HV Demand flows in veh/h as used by the program 8T T R R East: Blair Creek 1L L R R L L T T Unit Time for Volumes = 60 minutes Peak Flow Period = 15 minutes Flow Rates include effects of Flow Scale and Peak Flow Factor
310 Page 10 of /10/18 Flow Rates (Total Vehicles and Percent Heavy) Site:Blair Creek-N-Strasburg Road-Weekday PM Mov Left Through Right ID Total %HV Total %HV Total %HV --- Demand flows in veh/h as used by the program 8T T R R East: Blair Creek 1L L R R L L T T Unit Time for Volumes = 60 minutes Peak Flow Period = 15 minutes Flow Rates include effects of Flow Scale and Peak Flow Factor Other Model Settings Site:Blair Creek-N-Strasburg Road-Weekday PM 2018 * Basic Parameters: Intersection Type: Driving on the right-hand side of the road Input data specified in Metric units Model Defaults: US HCM (Metric) Peak Flow Period (for performance): 15 minutes Unit time (for volumes): 60 minutes. HCM Delay Model option used HCM Queue Model option used Level of Service based on: Delay (HCM 2000) Queue percentile: 95% Parameters Used in Cost Calculations Site:Blair Creek-N-Strasburg Road-Weekday PM 2018 Pump price of fuel ($/L) = Fuel resource cost factor = 0.70 Ratio of running cost to fuel cost = 3.0 Average income ($/h) = Time value factor = 0.40 Light vehicle mass (1000 kg) = 1.4 Heavy vehicle mass (1000 kg) = 11.0 Light vehicle idle fuel rate (L/h) = Heavy vehicle idle fuel rate (L/h) = Diagnostics
311 Page 11 of /10/18 Site:Blair Creek-N-Strasburg Road-Weekday PM 2018 Processed: October 18, :19:24 AM Copyright Akcelik and Associates Pty Ltd SIDRA INTERSECTION Project: H:\DATA\ Transportation Planning\Working\Strasburg Road\SIDRA Files\PC\Blair Creek and Strasburg Road Op 1.sip , SNC-LAVALIN INC, SINGLE
312 Page 1 of /09/29 DETAILED OUTPUT FH-n-HR Weekday AM 2018 Huron Road and Fischer Hallman Road Option 1 OUTPUT TABLE LINKS s Basic Parameters Gap Acceptance Parameters Movements Movement Capacity Parameters Movement Performance Fuel Consumption, Emissions and Cost (Total) Fuel Consumption, Emissions and Cost (Rate) Intersection Negotiation Data Movement Speeds and Geometric Delay Lanes Lane Performance Lane Flow and Capacity Information Lane, Approach and Intersection Performance Driver Characteristics Lane Delays Lane Queues (Vehicles) Lane Queues (Distance) Lane Queue Percentiles (Vehicles) Lane Queue Percentiles (Distance) Lane Stops Flow Rates and Demand Analysis Movement Definitions and Flow Rates (O-D) Flow Rates (Separate Light and Heavy Vehicles) Flow Rates (Total Vehicles and Percent Heavy) Other Model Settings Parameters Used in Cost Calculations Diagnostics s Basic Parameters Site:FH-n-HR Weekday AM Circulating/Exiting Stream Cent Circ Insc Ent Ent Cir Ent Av.Ent Island Width Diam. Rad Ang Lan Lan Lane Flow %HV Adjust. %Exit Cap. O-D Diam Width Flow Incl. Constr. Factor m m m m deg m veh/h pcu/h Effect South: Fischer Hallman Road Environment Factor: 1.20 Entry/Circulating Flow Adjustment: Medium N East: Huron Road Environment Factor: 1.10 Entry/Circulating Flow Adjustment: High N Exclusive Slip lane (exiting flow): N North: Fischer Hallman Road Environment Factor: 1.20 Entry/Circulating Flow Adjustment: Medium
313 Page 2 of /09/ N Exclusive Slip lane (exiting flow): N West: Huron Road Environment Factor: 1.20 Entry/Circulating Flow Adjustment: Medium N Capacity Model: SIDRA Standard HV Method for Gap Acceptance: Include HV Effect for all percentages Gap Acceptance Parameters Site:FH-n-HR Weekday AM Turn Lane Lane ---- Circulating/Exiting Stream --- Critical Gap No. Type Flow Aver Aver In-Bnch Prop Foll-up Rate Speed Dist Headway Bunched Hdwy Dist Headway pcu/h km/h m sec sec m sec South: Fischer Hallman Road Environment Factor: 1.20 Entry/Circulating Flow Adjustment: Medium Left 1 Subdominant Thru 1 Subdominant Dominant Right 3 Subdominant East: Huron Road Environment Factor: 1.10 Entry/Circulating Flow Adjustment: High Left 1 Subdominant Thru 1 Subdominant Subdominant Right 3 Excl. Slip 787E North: Fischer Hallman Road Environment Factor: 1.20 Entry/Circulating Flow Adjustment: Medium Left 1 Subdominant Thru 1 Subdominant Dominant Right 3 Excl. Slip 725E West: Huron Road Environment Factor: 1.20 Entry/Circulating Flow Adjustment: Medium Left 1 Dominant Thru 1 Dominant Subdominant Right 2 Subdominant Capacity Model: SIDRA Standard P Priority sharing is implied for some movements (Follow-up Headway plus Intra-bunch Headway is larger than the Critical Gap). The O-D Factor ( Basic Parameters table) allows for priority sharing and priority emphasis. E Exiting flow for slip lane traffic Dist (Distance): Spacing, i.e. distance between the front ends of two successive vehicles across all lanes in the circulating or exiting stream Movements Movement Capacity Parameters Site:FH-n-HR Weekday AM Mov Opposing Movement Total Prac. Prac. Lane Deg. ID Demand Adjust. Cap. Deg. Spare Util Satn Flow HV Flow HV Flow Satn Cap.
314 Page 3 of /09/29 veh/h % veh/h % pcu/h veh/h xp % % x South: Fischer Hallman Road 3L L T T R R East: Huron Road 1L L T T R R North: Fischer Hallman Road 7L L T T R R West: Huron Road 5L L * 2T T * 2R R * * Maximum degree of saturation Movement Performance Site:FH-n-HR Weekday AM Mov Total Total Aver. Eff. Total Perf. Tot.Trav. Tot.Trav. Aver. ID Delay Delay Delay Stop Stops Index Distance Time Speed (veh-h/h)(pers-h/h)(sec) Rate (veh-km/h)(veh-h/h) (km/h) South: Fischer Hallman Road 3L L T T R R East: Huron Road 1L L T T R R North: Fischer Hallman Road 7L L T T R R West: Huron Road 5L L T T R R Fuel Consumption, Emissions and Cost (Total) Site:FH-n-HR Weekday AM 2018 Mov Cost Fuel CO2 CO HC NOX ID Total Total Total Total Total Total $/h L/h kg/h kg/h kg/h kg/h South: Fischer Hallman Road 3L L T T R R
315 Page 4 of /09/29 East: Huron Road 1L L T T R R North: Fischer Hallman Road 7L L T T R R West: Huron Road 5L L T T R R INTERSECTION: Fuel Consumption, Emissions and Cost (Rate) Site:FH-n-HR Weekday AM 2018 Mov Cost Fuel CO2 CO HC NOX ID Rate Rate Rate Rate Rate Rate $/km L/100km g/km g/km g/km g/km South: Fischer Hallman Road 3L L T T R R East: Huron Road 1L L T T R R North: Fischer Hallman Road 7L L T T R R West: Huron Road 5L L T T R R INTERSECTION: Intersection Negotiation Data Site:FH-n-HR Weekday AM Negn Negn Negn Appr. Downstream Distance
316 Page 5 of /09/29 From To Radius Speed Dist. Dist Approach Approach Turn m km/h m m m User Spec? South: Fischer Hallman Road East Right No North Thru No West Left No East: Huron Road South Left No North Right No West Thru No North: Fischer Hallman Road South Thru No East Left No West Right No West: Huron Road South Right No East Thru No North Left No Maximum Negotiation (Design) Speed = 50.0 km/h Downstream distance is distance travelled from the stopline until exit cruise speed is reached (includes negotiation distance). Acceleration distance is weighted for light and heavy vehicles. The same distance applies for both stopped and unstopped vehicles. Movement Speeds and Geometric Delay Site:FH-n-HR Weekday AM Queue Move-up App. Speeds Exit Speeds Av. Section Spd Geom Mov st 2nd Delay ID Cruise Negn Negn Cruise Grn Grn Running Overall sec South: Fischer Hallman Road 3L L T T R R East: Huron Road 1L L T T R R North: Fischer Hallman Road 7L L T T R R West: Huron Road 5L L T T R R "Running Speed" is the average speed excluding stopped periods. HCM Delay Formula option used: Geometric Delay is not included in Control Delay. Lanes Lane Performance Site:FH-n-HR Weekday AM 2018
317 Page 6 of /09/29 Q u e u e Flow Cap Deg. Aver. Eff. 95% Back Lane Lane Satn Delay Stop Length No. veh/h veh/h x sec Rate veh m m South: Fischer Hallman Road 1 LT T R T East: Huron Road 1 LT T R T North: Fischer Hallman Road 1 LT T R T West: Huron Road 1 LT TR T Short lane due to specification of Turn Bay Lane Flow and Capacity Information Site:FH-n-HR Weekday AM Lane Dem Flow (veh/h) Min Tot Deg. Lane No Cap Cap Satn Util Lef Thru Rig Tot veh/h veh/h x % South: Fischer Hallman Road 1 LT T R East: Huron Road 1 LT T R North: Fischer Hallman Road 1 LT T R West: Huron Road 1 LT TR The capacity value for priority and continuous movements is obtained by adjusting the basic saturation flow for heavy vehicle and turning vehicle effects. Saturation flow scale applies if specified. Lane, Approach and Intersection Performance Site:FH-n-HR Weekday AM Lane Demand Flow (veh/h) Adj. Eff Grn Deg Aver. Longest Shrt No %HV Basic (sec) Sat Delay Queue Lane L T R Tot Satf. 1st 2nd x sec m m
318 Page 7 of /09/ South: Fischer Hallman Road 1 LT T R East: Huron Road 1 LT T R North: Fischer Hallman Road 1 LT T R West: Huron Road 1 LT TR ========================================================================== ALL VEHICLES Total % Max Aver. Max Flow HV X Delay Queue ========================================================================== Peak flow period = 15 minutes. Queue values in this table are 95% queue (metres) Note: Basic Saturation Flows are not adjusted at roundabouts or signcontrolled intersections and apply only to continuous lanes. Driver Characteristics Site:FH-n-HR Weekday AM Average Driver Lane Satn Satn Satn Satn Queue Response No. Speed Flow Hdwy Spacing Space Time km/h veh/h sec m m sec South: Fischer Hallman Road 1 LT T R NA - Short Lane East: Huron Road 1 LT T R NA - Short Lane North: Fischer Hallman Road 1 LT T R NA - Short Lane West: Huron Road 1 LT TR Saturation Flow and Saturation Headway are derived from follow-up headway. Lane Delays Site:FH-n-HR Weekday AM 2018
319 Page 8 of /09/ Delay (seconds/veh) Deg. Stop-line Delay Acc. Queuing Stopd Lane Satn 1st 2nd Total Dec. Total MvUp (Idle) Geom Control No. x d1 d2 dsl dn dq dqm di dig dic South: Fischer Hallman Road 1 LT T R East: Huron Road 1 LT T R North: Fischer Hallman Road 1 LT T R West: Huron Road 1 LT TR HCM Delay Formula option used: (i) Control Delay does not include Geometric Delay, (ii) Stop-line Delay is treated as being same as Control Delay. dsl: Stop-line delay (=d1+d2) dn: Average stop-start delay for all vehicles queued and unqueued dq: Queuing delay (the part of the stop-line delay that includes stopped delay and queue move-up delay) dqm: Queue move-up delay di: Stopped delay (stopped (idling) time at near-zero speed) dig: Geometric delay dic: Intersection control delay (sum of stop-line and geometric delays) Lane Queues (Vehicles) Site:FH-n-HR Weekday AM Deg. Ovrfl. Back of Queue (veh) Queue Prob. P'ile Cyc-Av. Queue Lane Satn Queue Stor. Block Block No. x No Nb1 Nb2 Nb 95% Ratio % % Nc 95% South: Fischer Hallman Road 1 LT T R East: Huron Road 1 LT T R North: Fischer Hallman Road 1 LT T R West: Huron Road 1 LT TR HCM Delay Formula option used: Cycle-Average Queue is calculated using average delay from the HCM equation. (i.e. HCM delays are treated as stop-line delays for this purpose). SIDRA Standard models are used for Back of Queue estimation since HCM only gives Cycle-Average Queues for unsignalised intersections.
320 Page 9 of /09/29 Lane Queues (Distance) Site:FH-n-HR Weekday AM Deg. Ovrfl. Back of Queue (m) Queue Prob. P'ile Cyc-Av. Queue Lane Satn Queue Stor. Block Block No. x No Nb1 Nb2 Nb 95% Ratio % % Nc 95% South: Fischer Hallman Road 1 LT T R East: Huron Road 1 LT T R North: Fischer Hallman Road 1 LT T R West: Huron Road 1 LT TR HCM Delay Formula option used: Cycle-Average Queue is calculated using average delay from the HCM equation. (i.e. HCM delays are treated as stop-line delays for this purpose). SIDRA Standard models are used for Back of Queue estimation since HCM only gives Cycle-Average Queues for unsignalised intersections. Lane Queue Percentiles (Vehicles) Site:FH-n-HR Weekday AM Deg. Percentile Back of Queue (veh) Lane Satn No. x 50% 70% 85% 90% 95% 98% South: Fischer Hallman Road 1 LT T R East: Huron Road 1 LT T R North: Fischer Hallman Road 1 LT T R West: Huron Road 1 LT TR SIDRA Standard models are used for Back of Queue estimation since HCM only gives Cycle-Average Queues for unsignalised intersections.
321 Page 10 of /09/29 Lane Queue Percentiles (Distance) Site:FH-n-HR Weekday AM Deg. Percentile Back of Queue (metres) Lane Satn No. x 50% 70% 85% 90% 95% 98% South: Fischer Hallman Road 1 LT T R East: Huron Road 1 LT T R North: Fischer Hallman Road 1 LT T R West: Huron Road 1 LT TR SIDRA Standard models are used for Back of Queue estimation since HCM only gives Cycle-Average Queues for unsignalised intersections. Lane Stops Site:FH-n-HR Weekday AM Queue Total Deg. -- Effective Stop Rate -- Total Move-up Queue Prop. Lane Satn Geom. Overall Stops Rate Move-ups Queued No. x he1 he2 hig h H hqm Hqm pq South: Fischer Hallman Road 1 LT T R East: Huron Road 1 LT T R North: Fischer Hallman Road 1 LT T R West: Huron Road 1 LT TR hig is the average value for all movements in a shared lane hqm is average queue move-up rate for all vehicles queued and unqueued Flow Rates and Demand Analysis
322 Page 11 of /09/29 Movement Definitions and Flow Rates (O-D) Site:FH-n-HR Weekday AM From To Mov Flow Rate Flow Scale Peak Flow Approach Approach ID Turn LV HV Fixed Var Factor South: Fischer Hallman Road East 8R Right North 8T Thru West 3L Left East: Huron Road South 1L Left North 6R Right West 6T Thru North: Fischer Hallman Road South 4T Thru East 7L Left West 4R Right West: Huron Road South 2R Right East 2T Thru North 5L Left Unit Time for Volumes = 60 minutes Peak Flow Period = 15 minutes Flow Rates include effects of Flow Scale and Peak Flow Factor Flow Rates (Separate Light and Heavy Vehicles) Site:FH-n-HR Weekday AM 2018 Mov Left Through Right ID LV HV LV HV LV HV Demand flows in veh/h as used by the program South: Fischer Hallman Road 3L L T T R R East: Huron Road 1L L T T R R North: Fischer Hallman Road 7L L T T R R West: Huron Road 5L L T T R R Unit Time for Volumes = 60 minutes Peak Flow Period = 15 minutes Flow Rates include effects of Flow Scale and Peak Flow Factor Flow Rates (Total Vehicles and Percent Heavy)
323 Page 12 of /09/29 Site:FH-n-HR Weekday AM Mov Left Through Right ID Total %HV Total %HV Total %HV --- Demand flows in veh/h as used by the program South: Fischer Hallman Road 3L L T T R R East: Huron Road 1L L T T R R North: Fischer Hallman Road 7L L T T R R West: Huron Road 5L L T T R R Unit Time for Volumes = 60 minutes Peak Flow Period = 15 minutes Flow Rates include effects of Flow Scale and Peak Flow Factor Other Model Settings Site:FH-n-HR Weekday AM 2018 * Basic Parameters: Intersection Type: Driving on the right-hand side of the road Input data specified in Metric units Model Defaults: US HCM (Metric) Peak Flow Period (for performance): 15 minutes Unit time (for volumes): 60 minutes. HCM Delay Model option used HCM Queue Model option used Level of Service based on: Delay (HCM 2000) Queue percentile: 95% Parameters Used in Cost Calculations Site:FH-n-HR Weekday AM 2018 Pump price of fuel ($/L) = Fuel resource cost factor = 0.70 Ratio of running cost to fuel cost = 3.0 Average income ($/h) = Time value factor = 0.40 Light vehicle mass (1000 kg) = 1.4 Heavy vehicle mass (1000 kg) = 11.0 Light vehicle idle fuel rate (L/h) = 1.350
324 Page 13 of 13 Heavy vehicle idle fuel rate (L/h) = Diagnostics Site:FH-n-HR Weekday AM 2018 Processed: September 28, :23:36 PM SIDRA INTERSECTION Copyright Akcelik and Associates Pty Ltd Project: H:\DATA\ Transportation Planning\Working\Strasburg Road\SIDRA Files\PC\Fischer Hallman and Huron-Future Op 1.sip , SNC-LAVALIN INC, SINGLE 2011/09/29
325 DETAILED OUTPUT FH-n-HR Weekday PM 2018 Huron Road and Fischer Hallman Road Option 1 Page 1 of 12 OUTPUT TABLE LINKS s Basic Parameters Gap Acceptance Parameters Movements Movement Capacity Parameters Movement Performance Fuel Consumption, Emissions and Cost (Total) Fuel Consumption, Emissions and Cost (Rate) Intersection Negotiation Data Movement Speeds and Geometric Delay Lanes Lane Performance Lane Flow and Capacity Information Lane, Approach and Intersection Performance Driver Characteristics Lane Delays Lane Queues (Vehicles) Lane Queues (Distance) Lane Queue Percentiles (Vehicles) Lane Queue Percentiles (Distance) Lane Stops Flow Rates and Demand Analysis Movement Definitions and Flow Rates (O-D) Flow Rates (Separate Light and Heavy Vehicles) Flow Rates (Total Vehicles and Percent Heavy) Other Model Settings Parameters Used in Cost Calculations Diagnostics s Basic Parameters Site:FH-n-HR Weekday PM Circulating/Exiting Stream Cent Circ Insc Ent Ent Cir Ent Av.Ent Island Width Diam. Rad Ang Lan Lan Lane Flow %HV Adjust. %Exit Cap. O-D Diam Width Flow Incl. Constr. Factor m m m m deg m veh/h pcu/h Effect South: Fischer Hallman Road Environment Factor: 1.20 Entry/Circulating Flow Adjustment: Medium N East: Huron Road Environment Factor: 1.10 Entry/Circulating Flow Adjustment: High N Exclusive Slip lane (exiting flow): N North: Fischer Hallman Road Environment Factor: 1.20 Entry/Circulating Flow Adjustment: Medium N Exclusive Slip lane (exiting flow): N West: Huron Road 2011/09/29
326 Environment Factor: 1.20 Entry/Circulating Flow Adjustment: Medium N Capacity Model: SIDRA Standard HV Method for Gap Acceptance: Include HV Effect for all percentages Page 2 of 12 Gap Acceptance Parameters Site:FH-n-HR Weekday PM Turn Lane Lane ---- Circulating/Exiting Stream --- Critical Gap No. Type Flow Aver Aver In-Bnch Prop Foll-up Rate Speed Dist Headway Bunched Hdwy Dist Headway pcu/h km/h m sec sec m sec South: Fischer Hallman Road Environment Factor: 1.20 Entry/Circulating Flow Adjustment: Medium Left 1 Subdominant Thru 1 Subdominant Dominant Right 3 Subdominant East: Huron Road Environment Factor: 1.10 Entry/Circulating Flow Adjustment: High Left 1 Subdominant Thru 1 Subdominant Dominant Right 3 Excl. Slip 656E North: Fischer Hallman Road Environment Factor: 1.20 Entry/Circulating Flow Adjustment: Medium Left 1 Subdominant Thru 1 Subdominant Dominant Right 3 Excl. Slip 831E West: Huron Road Environment Factor: 1.20 Entry/Circulating Flow Adjustment: Medium Left 1 Dominant Thru 1 Dominant Subdominant Right 2 Subdominant Capacity Model: SIDRA Standard P Priority sharing is implied for some movements (Follow-up Headway plus Intra-bunch Headway is larger than the Critical Gap). The O-D Factor ( Basic Parameters table) allows for priority sharing and priority emphasis. E Exiting flow for slip lane traffic Dist (Distance): Spacing, i.e. distance between the front ends of two successive vehicles across all lanes in the circulating or exiting stream Movements Movement Capacity Parameters Site:FH-n-HR Weekday PM Mov Opposing Movement Total Prac. Prac. Lane Deg. ID Demand Adjust. Cap. Deg. Spare Util Satn Flow HV Flow HV Flow Satn Cap. veh/h % veh/h % pcu/h veh/h xp % % x South: Fischer Hallman Road 3L L T T R R /09/29
327 East: Huron Road 1L L T T R R North: Fischer Hallman Road 7L L T T R R West: Huron Road 5L L * 2T T * 2R R * * Maximum degree of saturation Page 3 of 12 Movement Performance Site:FH-n-HR Weekday PM Mov Total Total Aver. Eff. Total Perf. Tot.Trav. Tot.Trav. Aver. ID Delay Delay Delay Stop Stops Index Distance Time Speed (veh-h/h)(pers-h/h)(sec) Rate (veh-km/h)(veh-h/h) (km/h) South: Fischer Hallman Road 3L L T T R R East: Huron Road 1L L T T R R North: Fischer Hallman Road 7L L T T R R West: Huron Road 5L L T T R R Fuel Consumption, Emissions and Cost (Total) Site:FH-n-HR Weekday PM 2018 Mov Cost Fuel CO2 CO HC NOX ID Total Total Total Total Total Total $/h L/h kg/h kg/h kg/h kg/h South: Fischer Hallman Road 3L L T T R R East: Huron Road 1L L T T R R North: Fischer Hallman Road 7L L T T /09/29
328 4R R West: Huron Road 5L L T T R R INTERSECTION: Page 4 of 12 Fuel Consumption, Emissions and Cost (Rate) Site:FH-n-HR Weekday PM 2018 Mov Cost Fuel CO2 CO HC NOX ID Rate Rate Rate Rate Rate Rate $/km L/100km g/km g/km g/km g/km South: Fischer Hallman Road 3L L T T R R East: Huron Road 1L L T T R R North: Fischer Hallman Road 7L L T T R R West: Huron Road 5L L T T R R INTERSECTION: Intersection Negotiation Data Site:FH-n-HR Weekday PM Negn Negn Negn Appr. Downstream Distance From To Radius Speed Dist. Dist Approach Approach Turn m km/h m m m User Spec? South: Fischer Hallman Road East Right No North Thru No West Left No East: Huron Road South Left No North Right No West Thru No /09/29
329 North: Fischer Hallman Road South Thru No East Left No West Right No West: Huron Road South Right No East Thru No North Left No Page 5 of 12 Maximum Negotiation (Design) Speed = 50.0 km/h Downstream distance is distance travelled from the stopline until exit cruise speed is reached (includes negotiation distance). Acceleration distance is weighted for light and heavy vehicles. The same distance applies for both stopped and unstopped vehicles. Movement Speeds and Geometric Delay Site:FH-n-HR Weekday PM Queue Move-up App. Speeds Exit Speeds Av. Section Spd Geom Mov st 2nd Delay ID Cruise Negn Negn Cruise Grn Grn Running Overall sec South: Fischer Hallman Road 3L L T T R R East: Huron Road 1L L T T R R North: Fischer Hallman Road 7L L T T R R West: Huron Road 5L L T T R R "Running Speed" is the average speed excluding stopped periods. HCM Delay Formula option used: Geometric Delay is not included in Control Delay. Lanes Lane Performance Site:FH-n-HR Weekday PM 2018 Q u e u e Flow Cap Deg. Aver. Eff. 95% Back Lane Lane Satn Delay Stop Length No. veh/h veh/h x sec Rate veh m m South: Fischer Hallman Road 1 LT T R T East: Huron Road 1 LT T /09/29
330 3 R T North: Fischer Hallman Road 1 LT T R T West: Huron Road 1 LT TR T Short lane due to specification of Turn Bay Page 6 of 12 Lane Flow and Capacity Information Site:FH-n-HR Weekday PM Lane Dem Flow (veh/h) Min Tot Deg. Lane No Cap Cap Satn Util Lef Thru Rig Tot veh/h veh/h x % South: Fischer Hallman Road 1 LT T R East: Huron Road 1 LT T R North: Fischer Hallman Road 1 LT T R West: Huron Road 1 LT TR The capacity value for priority and continuous movements is obtained by adjusting the basic saturation flow for heavy vehicle and turning vehicle effects. Saturation flow scale applies if specified. Lane, Approach and Intersection Performance Site:FH-n-HR Weekday PM Lane Demand Flow (veh/h) Adj. Eff Grn Deg Aver. Longest Shrt No %HV Basic (sec) Sat Delay Queue Lane L T R Tot Satf. 1st 2nd x sec m m South: Fischer Hallman Road 1 LT T R East: Huron Road 1 LT T R North: Fischer Hallman Road 1 LT T R /09/29
331 West: Huron Road 1 LT TR ========================================================================== ALL VEHICLES Total % Max Aver. Max Flow HV X Delay Queue ========================================================================== Peak flow period = 15 minutes. Page 7 of 12 Queue values in this table are 95% queue (metres) Note: Basic Saturation Flows are not adjusted at roundabouts or signcontrolled intersections and apply only to continuous lanes. Driver Characteristics Site:FH-n-HR Weekday PM Average Driver Lane Satn Satn Satn Satn Queue Response No. Speed Flow Hdwy Spacing Space Time km/h veh/h sec m m sec South: Fischer Hallman Road 1 LT T R NA - Short Lane East: Huron Road 1 LT T R NA - Short Lane North: Fischer Hallman Road 1 LT T R NA - Short Lane West: Huron Road 1 LT TR Saturation Flow and Saturation Headway are derived from follow-up headway. Lane Delays Site:FH-n-HR Weekday PM Delay (seconds/veh) Deg. Stop-line Delay Acc. Queuing Stopd Lane Satn 1st 2nd Total Dec. Total MvUp (Idle) Geom Control No. x d1 d2 dsl dn dq dqm di dig dic South: Fischer Hallman Road 1 LT T R East: Huron Road 1 LT T R North: Fischer Hallman Road 1 LT /09/29
332 2 T R West: Huron Road 1 LT TR HCM Delay Formula option used: (i) Control Delay does not include Geometric Delay, (ii) Stop-line Delay is treated as being same as Control Delay. dsl: Stop-line delay (=d1+d2) dn: Average stop-start delay for all vehicles queued and unqueued dq: Queuing delay (the part of the stop-line delay that includes stopped delay and queue move-up delay) dqm: Queue move-up delay di: Stopped delay (stopped (idling) time at near-zero speed) dig: Geometric delay dic: Intersection control delay (sum of stop-line and geometric delays) Page 8 of 12 Lane Queues (Vehicles) Site:FH-n-HR Weekday PM Deg. Ovrfl. Back of Queue (veh) Queue Prob. P'ile Cyc-Av. Queue Lane Satn Queue Stor. Block Block No. x No Nb1 Nb2 Nb 95% Ratio % % Nc 95% South: Fischer Hallman Road 1 LT T R East: Huron Road 1 LT T R North: Fischer Hallman Road 1 LT T R West: Huron Road 1 LT TR HCM Delay Formula option used: Cycle-Average Queue is calculated using average delay from the HCM equation. (i.e. HCM delays are treated as stop-line delays for this purpose). SIDRA Standard models are used for Back of Queue estimation since HCM only gives Cycle-Average Queues for unsignalised intersections. Lane Queues (Distance) Site:FH-n-HR Weekday PM Deg. Ovrfl. Back of Queue (m) Queue Prob. P'ile Cyc-Av. Queue Lane Satn Queue Stor. Block Block No. x No Nb1 Nb2 Nb 95% Ratio % % Nc 95% South: Fischer Hallman Road 1 LT T R East: Huron Road 1 LT T R /09/29
333 North: Fischer Hallman Road 1 LT T R West: Huron Road 1 LT TR Page 9 of 12 HCM Delay Formula option used: Cycle-Average Queue is calculated using average delay from the HCM equation. (i.e. HCM delays are treated as stop-line delays for this purpose). SIDRA Standard models are used for Back of Queue estimation since HCM only gives Cycle-Average Queues for unsignalised intersections. Lane Queue Percentiles (Vehicles) Site:FH-n-HR Weekday PM Deg. Percentile Back of Queue (veh) Lane Satn No. x 50% 70% 85% 90% 95% 98% South: Fischer Hallman Road 1 LT T R East: Huron Road 1 LT T R North: Fischer Hallman Road 1 LT T R West: Huron Road 1 LT TR SIDRA Standard models are used for Back of Queue estimation since HCM only gives Cycle-Average Queues for unsignalised intersections. Lane Queue Percentiles (Distance) Site:FH-n-HR Weekday PM Deg. Percentile Back of Queue (metres) Lane Satn No. x 50% 70% 85% 90% 95% 98% South: Fischer Hallman Road 1 LT T R East: Huron Road 1 LT T R North: Fischer Hallman Road 1 LT T R West: Huron Road 2011/09/29
334 1 LT TR Page 10 of 12 SIDRA Standard models are used for Back of Queue estimation since HCM only gives Cycle-Average Queues for unsignalised intersections. Lane Stops Site:FH-n-HR Weekday PM Queue Total Deg. -- Effective Stop Rate -- Total Move-up Queue Prop. Lane Satn Geom. Overall Stops Rate Move-ups Queued No. x he1 he2 hig h H hqm Hqm pq South: Fischer Hallman Road 1 LT T R East: Huron Road 1 LT T R North: Fischer Hallman Road 1 LT T R West: Huron Road 1 LT TR hig is the average value for all movements in a shared lane hqm is average queue move-up rate for all vehicles queued and unqueued Flow Rates and Demand Analysis Movement Definitions and Flow Rates (O-D) Site:FH-n-HR Weekday PM From To Mov Flow Rate Flow Scale Peak Flow Approach Approach ID Turn LV HV Fixed Var Factor South: Fischer Hallman Road East 8R Right North 8T Thru West 3L Left East: Huron Road South 1L Left North 6R Right West 6T Thru North: Fischer Hallman Road South 4T Thru East 7L Left West 4R Right West: Huron Road South 2R Right East 2T Thru North 5L Left Unit Time for Volumes = 60 minutes Peak Flow Period = 15 minutes 2011/09/29
335 2011/09/29 Detailed Output Flow Rates include effects of Flow Scale and Peak Flow Factor Page 11 of 12 Flow Rates (Separate Light and Heavy Vehicles) Site:FH-n-HR Weekday PM 2018 Mov Left Through Right ID LV HV LV HV LV HV Demand flows in veh/h as used by the program South: Fischer Hallman Road 3L L T T R R East: Huron Road 1L L T T R R North: Fischer Hallman Road 7L L T T R R West: Huron Road 5L L T T R R Unit Time for Volumes = 60 minutes Peak Flow Period = 15 minutes Flow Rates include effects of Flow Scale and Peak Flow Factor Flow Rates (Total Vehicles and Percent Heavy) Site:FH-n-HR Weekday PM Mov Left Through Right ID Total %HV Total %HV Total %HV --- Demand flows in veh/h as used by the program South: Fischer Hallman Road 3L L T T R R East: Huron Road 1L L T T R R North: Fischer Hallman Road 7L L T T R R West: Huron Road 5L L T T R R Unit Time for Volumes = 60 minutes Peak Flow Period = 15 minutes Flow Rates include effects of Flow Scale and Peak Flow Factor
336 Page 12 of 12 Other Model Settings Site:FH-n-HR Weekday PM 2018 * Basic Parameters: Intersection Type: Driving on the right-hand side of the road Input data specified in Metric units Model Defaults: US HCM (Metric) Peak Flow Period (for performance): 15 minutes Unit time (for volumes): 60 minutes. HCM Delay Model option used HCM Queue Model option used Level of Service based on: Delay (HCM 2000) Queue percentile: 95% Parameters Used in Cost Calculations Site:FH-n-HR Weekday PM 2018 Pump price of fuel ($/L) = Fuel resource cost factor = 0.70 Ratio of running cost to fuel cost = 3.0 Average income ($/h) = Time value factor = 0.40 Light vehicle mass (1000 kg) = 1.4 Heavy vehicle mass (1000 kg) = 11.0 Light vehicle idle fuel rate (L/h) = Heavy vehicle idle fuel rate (L/h) = Diagnostics Site:FH-n-HR Weekday PM 2018 Processed: September 28, :25:03 PM SIDRA INTERSECTION Copyright Akcelik and Associates Pty Ltd Project: H:\DATA\ Transportation Planning\Working\Strasburg Road\SIDRA Files\PC\Fischer Hallman and Huron-Future Op 1.sip , SNC-LAVALIN INC, SINGLE 2011/09/29
337 Page 1 of /09/29 DETAILED OUTPUT Huron Road-N-Strasburg Road Option 1 Huron Road-N-Strasburg Road AM 2018 OUTPUT TABLE LINKS s Basic Parameters Gap Acceptance Parameters Movements Movement Capacity Parameters Movement Performance Fuel Consumption, Emissions and Cost (Total) Fuel Consumption, Emissions and Cost (Rate) Intersection Negotiation Data Movement Speeds and Geometric Delay Lanes Lane Performance Lane Flow and Capacity Information Lane, Approach and Intersection Performance Driver Characteristics Lane Delays Lane Queues (Vehicles) Lane Queues (Distance) Lane Queue Percentiles (Vehicles) Lane Queue Percentiles (Distance) Lane Stops Flow Rates and Demand Analysis Movement Definitions and Flow Rates (O-D) Flow Rates (Separate Light and Heavy Vehicles) Flow Rates (Total Vehicles and Percent Heavy) Other Model Settings Parameters Used in Cost Calculations Diagnostics s Basic Parameters Site:Huron Road-N-Strasburg Road AM Circulating/Exiting Stream Cent Circ Insc Ent Ent Cir Ent Av.Ent Island Width Diam. Rad Ang Lan Lan Lane Flow %HV Adjust. %Exit Cap. O-D Diam Width Flow Incl. Constr. Factor m m m m deg m veh/h pcu/h Effect Environment Factor: 1.20 Entry/Circulating Flow Adjustment: Medium N Exclusive Slip lane (exiting flow): N East: Huron Road Environment Factor: 1.20 Entry/Circulating Flow Adjustment: Medium N Exclusive Slip lane (exiting flow): N
338 Page 2 of /09/29 Environment Factor: 1.20 Entry/Circulating Flow Adjustment: Medium N Exclusive Slip lane (exiting flow): N West: Huron Road Environment Factor: 1.20 Entry/Circulating Flow Adjustment: Medium N Exclusive Slip lane (exiting flow): N Capacity Model: SIDRA Standard HV Method for Gap Acceptance: Include HV Effect for all percentages Gap Acceptance Parameters Site:Huron Road-N-Strasburg Road AM Turn Lane Lane ---- Circulating/Exiting Stream --- Critical Gap No. Type Flow Aver Aver In-Bnch Prop Foll-up Rate Speed Dist Headway Bunched Hdwy Dist Headway pcu/h km/h m sec sec m sec Environment Factor: 1.20 Entry/Circulating Flow Adjustment: Medium Left 1 Subdominant Thru 1 Subdominant Dominant Right 3 Excl. Slip 1343E East: Huron Road Environment Factor: 1.20 Entry/Circulating Flow Adjustment: Medium Left 1 Subdominant Thru 1 Subdominant Dominant Right 3 Excl. Slip 896E Environment Factor: 1.20 Entry/Circulating Flow Adjustment: Medium Left 1 Subdominant Thru 1 Subdominant Dominant Right 3 Excl. Slip 883E West: Huron Road Environment Factor: 1.20 Entry/Circulating Flow Adjustment: Medium Left 1 Subdominant Thru 1 Subdominant Dominant Right 3 Excl. Slip 438E Capacity Model: SIDRA Standard P Priority sharing is implied for some movements (Follow-up Headway plus Intra-bunch Headway is larger than the Critical Gap). The O-D Factor ( Basic Parameters table) allows for priority sharing and priority emphasis. E Exiting flow for slip lane traffic Dist (Distance): Spacing, i.e. distance between the front ends of two successive vehicles across all lanes in the circulating or exiting stream Movements Movement Capacity Parameters Site:Huron Road-N-Strasburg Road AM Mov Opposing Movement Total Prac. Prac. Lane Deg.
339 Page 3 of /09/29 ID Demand Adjust. Cap. Deg. Spare Util Satn Flow HV Flow HV Flow Satn Cap. veh/h % veh/h % pcu/h veh/h xp % % x L L * 8T T * 8R R East: Huron Road 1L L T T R R L L T T R R West: Huron Road 5L L T T R R * Maximum degree of saturation Movement Performance Site:Huron Road-N-Strasburg Road AM Mov Total Total Aver. Eff. Total Perf. Tot.Trav. Tot.Trav. Aver. ID Delay Delay Delay Stop Stops Index Distance Time Speed (veh-h/h)(pers-h/h)(sec) Rate (veh-km/h)(veh-h/h) (km/h) L L T T R R East: Huron Road 1L L T T R R L L T T R R West: Huron Road 5L L T T R R Fuel Consumption, Emissions and Cost (Total) Site:Huron Road-N-Strasburg Road AM 2018 Mov Cost Fuel CO2 CO HC NOX ID Total Total Total Total Total Total $/h L/h kg/h kg/h kg/h kg/h 3L L T T R R
340 Page 4 of /09/ East: Huron Road 1L L T T R R L L T T R R West: Huron Road 5L L T T R R INTERSECTION: Fuel Consumption, Emissions and Cost (Rate) Site:Huron Road-N-Strasburg Road AM 2018 Mov Cost Fuel CO2 CO HC NOX ID Rate Rate Rate Rate Rate Rate $/km L/100km g/km g/km g/km g/km 3L L T T R R East: Huron Road 1L L T T R R L L T T R R West: Huron Road 5L L T T R R INTERSECTION: Intersection Negotiation Data Site:Huron Road-N-Strasburg Road AM 2018
341 Page 5 of /09/ Negn Negn Negn Appr. Downstream Distance From To Radius Speed Dist. Dist Approach Approach Turn m km/h m m m User Spec? East Right No North Thru No West Left No East: Huron Road South Left No North Right No West Thru No South Thru No East Left No West Right No West: Huron Road South Right No East Thru No North Left No Maximum Negotiation (Design) Speed = 50.0 km/h Downstream distance is distance travelled from the stopline until exit cruise speed is reached (includes negotiation distance). Acceleration distance is weighted for light and heavy vehicles. The same distance applies for both stopped and unstopped vehicles. Movement Speeds and Geometric Delay Site:Huron Road-N-Strasburg Road AM Queue Move-up App. Speeds Exit Speeds Av. Section Spd Geom Mov st 2nd Delay ID Cruise Negn Negn Cruise Grn Grn Running Overall sec L L T T R R East: Huron Road 1L L T T R R L L T T R R West: Huron Road 5L L T T R R "Running Speed" is the average speed excluding stopped periods. HCM Delay Formula option used: Geometric Delay is not included in Control Delay. Lanes Lane Performance Site:Huron Road-N-Strasburg Road AM 2018
342 Page 6 of /09/29 Q u e u e Flow Cap Deg. Aver. Eff. 95% Back Lane Lane Satn Delay Stop Length No. veh/h veh/h x sec Rate veh m m 1 LT T R T East: Huron Road 1 LT T R T 1 LT T R T West: Huron Road 1 LT T R T T Short lane due to specification of Turn Bay Lane Flow and Capacity Information Site:Huron Road-N-Strasburg Road AM Lane Dem Flow (veh/h) Min Tot Deg. Lane No Cap Cap Satn Util Lef Thru Rig Tot veh/h veh/h x % LT T R East: Huron Road 1 LT T R LT T R West: Huron Road 1 LT T R The capacity value for priority and continuous movements is obtained by adjusting the basic saturation flow for heavy vehicle and turning vehicle effects. Saturation flow scale applies if specified. Lane, Approach and Intersection Performance Site:Huron Road-N-Strasburg Road AM 2018
343 Page 7 of /09/ Lane Demand Flow (veh/h) Adj. Eff Grn Deg Aver. Longest Shrt No %HV Basic (sec) Sat Delay Queue Lane L T R Tot Satf. 1st 2nd x sec m m LT T R East: Huron Road 1 LT T R LT T R West: Huron Road 1 LT T R ========================================================================== ALL VEHICLES Total % Max Aver. Max Flow HV X Delay Queue ========================================================================== Peak flow period = 15 minutes. Queue values in this table are 95% queue (metres) Note: Basic Saturation Flows are not adjusted at roundabouts or signcontrolled intersections and apply only to continuous lanes. Driver Characteristics Site:Huron Road-N-Strasburg Road AM Average Driver Lane Satn Satn Satn Satn Queue Response No. Speed Flow Hdwy Spacing Space Time km/h veh/h sec m m sec LT T R NA - Short Lane East: Huron Road 1 LT T R NA - Short Lane LT T R NA - Short Lane West: Huron Road 1 LT T R NA - Short Lane Saturation Flow and Saturation Headway are derived from follow-up headway.
344 Page 8 of /09/29 Lane Delays Site:Huron Road-N-Strasburg Road AM Delay (seconds/veh) Deg. Stop-line Delay Acc. Queuing Stopd Lane Satn 1st 2nd Total Dec. Total MvUp (Idle) Geom Control No. x d1 d2 dsl dn dq dqm di dig dic LT T R East: Huron Road 1 LT T R LT T R West: Huron Road 1 LT T R HCM Delay Formula option used: (i) Control Delay does not include Geometric Delay, (ii) Stop-line Delay is treated as being same as Control Delay. dsl: Stop-line delay (=d1+d2) dn: Average stop-start delay for all vehicles queued and unqueued dq: Queuing delay (the part of the stop-line delay that includes stopped delay and queue move-up delay) dqm: Queue move-up delay di: Stopped delay (stopped (idling) time at near-zero speed) dig: Geometric delay dic: Intersection control delay (sum of stop-line and geometric delays) Lane Queues (Vehicles) Site:Huron Road-N-Strasburg Road AM Deg. Ovrfl. Back of Queue (veh) Queue Prob. P'ile Cyc-Av. Queue Lane Satn Queue Stor. Block Block No. x No Nb1 Nb2 Nb 95% Ratio % % Nc 95% LT T R East: Huron Road 1 LT T R LT T R West: Huron Road 1 LT T
345 Page 9 of /09/29 3 R HCM Delay Formula option used: Cycle-Average Queue is calculated using average delay from the HCM equation. (i.e. HCM delays are treated as stop-line delays for this purpose). SIDRA Standard models are used for Back of Queue estimation since HCM only gives Cycle-Average Queues for unsignalised intersections. Lane Queues (Distance) Site:Huron Road-N-Strasburg Road AM Deg. Ovrfl. Back of Queue (m) Queue Prob. P'ile Cyc-Av. Queue Lane Satn Queue Stor. Block Block No. x No Nb1 Nb2 Nb 95% Ratio % % Nc 95% LT T R East: Huron Road 1 LT T R LT T R West: Huron Road 1 LT T R HCM Delay Formula option used: Cycle-Average Queue is calculated using average delay from the HCM equation. (i.e. HCM delays are treated as stop-line delays for this purpose). SIDRA Standard models are used for Back of Queue estimation since HCM only gives Cycle-Average Queues for unsignalised intersections. Lane Queue Percentiles (Vehicles) Site:Huron Road-N-Strasburg Road AM Deg. Percentile Back of Queue (veh) Lane Satn No. x 50% 70% 85% 90% 95% 98% LT T R East: Huron Road 1 LT T R LT T R West: Huron Road
346 Page 10 of /09/29 1 LT T R SIDRA Standard models are used for Back of Queue estimation since HCM only gives Cycle-Average Queues for unsignalised intersections. Lane Queue Percentiles (Distance) Site:Huron Road-N-Strasburg Road AM Deg. Percentile Back of Queue (metres) Lane Satn No. x 50% 70% 85% 90% 95% 98% LT T R East: Huron Road 1 LT T R LT T R West: Huron Road 1 LT T R SIDRA Standard models are used for Back of Queue estimation since HCM only gives Cycle-Average Queues for unsignalised intersections. Lane Stops Site:Huron Road-N-Strasburg Road AM Queue Total Deg. -- Effective Stop Rate -- Total Move-up Queue Prop. Lane Satn Geom. Overall Stops Rate Move-ups Queued No. x he1 he2 hig h H hqm Hqm pq LT T R East: Huron Road 1 LT T R LT T R West: Huron Road 1 LT T R
347 Page 11 of /09/ hig is the average value for all movements in a shared lane hqm is average queue move-up rate for all vehicles queued and unqueued Flow Rates and Demand Analysis Movement Definitions and Flow Rates (O-D) Site:Huron Road-N-Strasburg Road AM From To Mov Flow Rate Flow Scale Peak Flow Approach Approach ID Turn LV HV Fixed Var Factor East 8R Right North 8T Thru West 3L Left East: Huron Road South 1L Left North 6R Right West 6T Thru South 4T Thru East 7L Left West 4R Right West: Huron Road South 2R Right East 2T Thru North 5L Left Unit Time for Volumes = 60 minutes Peak Flow Period = 15 minutes Flow Rates include effects of Flow Scale and Peak Flow Factor Flow Rates (Separate Light and Heavy Vehicles) Site:Huron Road-N-Strasburg Road AM 2018 Mov Left Through Right ID LV HV LV HV LV HV Demand flows in veh/h as used by the program 3L L T T R R East: Huron Road 1L L T T R R L L T T R R West: Huron Road 5L L T T R R
348 Page 12 of /09/29 Unit Time for Volumes = 60 minutes Peak Flow Period = 15 minutes Flow Rates include effects of Flow Scale and Peak Flow Factor Flow Rates (Total Vehicles and Percent Heavy) Site:Huron Road-N-Strasburg Road AM Mov Left Through Right ID Total %HV Total %HV Total %HV --- Demand flows in veh/h as used by the program 3L L T T R R East: Huron Road 1L L T T R R L L T T R R West: Huron Road 5L L T T R R Unit Time for Volumes = 60 minutes Peak Flow Period = 15 minutes Flow Rates include effects of Flow Scale and Peak Flow Factor Other Model Settings Site:Huron Road-N-Strasburg Road AM 2018 * Basic Parameters: Intersection Type: Driving on the right-hand side of the road Input data specified in Metric units Model Defaults: US HCM (Metric) Peak Flow Period (for performance): 15 minutes Unit time (for volumes): 60 minutes. HCM Delay Model option used HCM Queue Model option used Level of Service based on: Delay (HCM 2000) Queue percentile: 95% Parameters Used in Cost Calculations Site:Huron Road-N-Strasburg Road AM 2018
349 Page 13 of 13 Pump price of fuel ($/L) = Fuel resource cost factor = 0.70 Ratio of running cost to fuel cost = 3.0 Average income ($/h) = Time value factor = 0.40 Light vehicle mass (1000 kg) = 1.4 Heavy vehicle mass (1000 kg) = 11.0 Light vehicle idle fuel rate (L/h) = Heavy vehicle idle fuel rate (L/h) = Diagnostics Site:Huron Road-N-Strasburg Road AM 2018 Processed: September 28, :35:45 PM SIDRA INTERSECTION Copyright Akcelik and Associates Pty Ltd Project: H:\DATA\ Transportation Planning\Working\Strasburg Road\SIDRA Files\PC\Huron Road and Strasburg Road Op 1.sip , SNC-LAVALIN INC, SINGLE 2011/09/29
350 DETAILED OUTPUT Huron Road-N-Strasburg Road Option 1 Page 1 of 12 Huron Road-N-Strasburg Road PM 2018 OUTPUT TABLE LINKS s Basic Parameters Gap Acceptance Parameters Movements Movement Capacity Parameters Movement Performance Fuel Consumption, Emissions and Cost (Total) Fuel Consumption, Emissions and Cost (Rate) Intersection Negotiation Data Movement Speeds and Geometric Delay Lanes Lane Performance Lane Flow and Capacity Information Lane, Approach and Intersection Performance Driver Characteristics Lane Delays Lane Queues (Vehicles) Lane Queues (Distance) Lane Queue Percentiles (Vehicles) Lane Queue Percentiles (Distance) Lane Stops Flow Rates and Demand Analysis Movement Definitions and Flow Rates (O-D) Flow Rates (Separate Light and Heavy Vehicles) Flow Rates (Total Vehicles and Percent Heavy) Other Model Settings Parameters Used in Cost Calculations Diagnostics s Basic Parameters Site:Huron Road-N-Strasburg Road PM Circulating/Exiting Stream Cent Circ Insc Ent Ent Cir Ent Av.Ent Island Width Diam. Rad Ang Lan Lan Lane Flow %HV Adjust. %Exit Cap. O-D Diam Width Flow Incl. Constr. Factor m m m m deg m veh/h pcu/h Effect Environment Factor: 1.20 Entry/Circulating Flow Adjustment: Medium Y Exclusive Slip lane (exiting flow): Y East: Huron Road Environment Factor: 1.20 Entry/Circulating Flow Adjustment: Medium N Exclusive Slip lane (exiting flow): N Environment Factor: 1.10 Entry/Circulating Flow Adjustment: High N Exclusive Slip lane (exiting flow): N /09/29
351 West: Huron Road Environment Factor: 1.20 Entry/Circulating Flow Adjustment: Medium Y Exclusive Slip lane (exiting flow): Y Capacity Model: SIDRA Standard HV Method for Gap Acceptance: Include HV Effect for all percentages Page 2 of 12 Gap Acceptance Parameters Site:Huron Road-N-Strasburg Road PM Turn Lane Lane ---- Circulating/Exiting Stream --- Critical Gap No. Type Flow Aver Aver In-Bnch Prop Foll-up Rate Speed Dist Headway Bunched Hdwy Dist Headway pcu/h km/h m sec sec m sec Environment Factor: 1.20 Entry/Circulating Flow Adjustment: Medium Left 1 Subdominant Thru 2 Dominant Right 3 Excl. Slip 927E East: Huron Road Environment Factor: 1.20 Entry/Circulating Flow Adjustment: Medium Left 1 Subdominant Thru 1 Subdominant Dominant Right 3 Excl. Slip 533E Environment Factor: 1.10 Entry/Circulating Flow Adjustment: High Left 1 Subdominant Thru 1 Subdominant Dominant * Right 3 Excl. Slip 1577E West: Huron Road Environment Factor: 1.20 Entry/Circulating Flow Adjustment: Medium Left 1 Subdominant Thru 1 Subdominant Dominant Right 3 Excl. Slip 965E Capacity Model: SIDRA Standard P Priority sharing is implied for some movements (Follow-up Headway plus Intra-bunch Headway is larger than the Critical Gap). The O-D Factor ( Basic Parameters table) allows for priority sharing and priority emphasis. * Critical gap or follow-up headway set to MINIMUM value E Exiting flow for slip lane traffic Dist (Distance): Spacing, i.e. distance between the front ends of two successive vehicles across all lanes in the circulating or exiting stream Movements Movement Capacity Parameters Site:Huron Road-N-Strasburg Road PM Mov Opposing Movement Total Prac. Prac. Lane Deg. ID Demand Adjust. Cap. Deg. Spare Util Satn Flow HV Flow HV Flow Satn Cap. veh/h % veh/h % pcu/h veh/h xp % % x L L /09/29
352 8T T R R East: Huron Road 1L L T T R R L L * 4T T * 4R R West: Huron Road 5L L T T R R * Maximum degree of saturation Page 3 of 12 Movement Performance Site:Huron Road-N-Strasburg Road PM Mov Total Total Aver. Eff. Total Perf. Tot.Trav. Tot.Trav. Aver. ID Delay Delay Delay Stop Stops Index Distance Time Speed (veh-h/h)(pers-h/h)(sec) Rate (veh-km/h)(veh-h/h) (km/h) L L T T R R East: Huron Road 1L L T T R R L L T T R R West: Huron Road 5L L T T R R Fuel Consumption, Emissions and Cost (Total) Site:Huron Road-N-Strasburg Road PM 2018 Mov Cost Fuel CO2 CO HC NOX ID Total Total Total Total Total Total $/h L/h kg/h kg/h kg/h kg/h 3L L T T R R East: Huron Road 1L L T T R R /09/29
353 7L L T T R R West: Huron Road 5L L T T R R INTERSECTION: Page 4 of 12 Fuel Consumption, Emissions and Cost (Rate) Site:Huron Road-N-Strasburg Road PM 2018 Mov Cost Fuel CO2 CO HC NOX ID Rate Rate Rate Rate Rate Rate $/km L/100km g/km g/km g/km g/km 3L L T T R R East: Huron Road 1L L T T R R L L T T R R West: Huron Road 5L L T T R R INTERSECTION: Intersection Negotiation Data Site:Huron Road-N-Strasburg Road PM Negn Negn Negn Appr. Downstream Distance From To Radius Speed Dist. Dist Approach Approach Turn m km/h m m m User Spec? East Right No North Thru No West Left No East: Huron Road South Left No 2011/09/29
354 North Right No West Thru No South Thru No East Left No West Right No West: Huron Road South Right No East Thru No North Left No Page 5 of 12 Maximum Negotiation (Design) Speed = 50.0 km/h Downstream distance is distance travelled from the stopline until exit cruise speed is reached (includes negotiation distance). Acceleration distance is weighted for light and heavy vehicles. The same distance applies for both stopped and unstopped vehicles. Movement Speeds and Geometric Delay Site:Huron Road-N-Strasburg Road PM Queue Move-up App. Speeds Exit Speeds Av. Section Spd Geom Mov st 2nd Delay ID Cruise Negn Negn Cruise Grn Grn Running Overall sec L L T T R R East: Huron Road 1L L T T R R L L T T R R West: Huron Road 5L L T T R R "Running Speed" is the average speed excluding stopped periods. HCM Delay Formula option used: Geometric Delay is not included in Control Delay. Lanes Lane Performance Site:Huron Road-N-Strasburg Road PM 2018 Q u e u e Flow Cap Deg. Aver. Eff. 95% Back Lane Lane Satn Delay Stop Length No. veh/h veh/h x sec Rate veh m m 1 L T R T 2011/09/29
355 East: Huron Road 1 LT T R T 1 LT T R T West: Huron Road 1 LT T R T T Short lane due to specification of Turn Bay Page 6 of 12 Lane Flow and Capacity Information Site:Huron Road-N-Strasburg Road PM Lane Dem Flow (veh/h) Min Tot Deg. Lane No Cap Cap Satn Util Lef Thru Rig Tot veh/h veh/h x % L T P 3 R East: Huron Road 1 LT T R LT T R West: Huron Road 1 LT T R P Lane under-utilisation found by the "Program". This includes cases where the value of lane under-utilisation due to downstream effects has been modified by the program during lane flow calculations (e.g. a de facto exclusive lane has been found). The capacity value for priority and continuous movements is obtained by adjusting the basic saturation flow for heavy vehicle and turning vehicle effects. Saturation flow scale applies if specified. Lane, Approach and Intersection Performance Site:Huron Road-N-Strasburg Road PM Lane Demand Flow (veh/h) Adj. Eff Grn Deg Aver. Longest Shrt No %HV Basic (sec) Sat Delay Queue Lane L T R Tot Satf. 1st 2nd x sec m m L T R East: Huron Road 1 LT /09/29
356 2 T R LT T R West: Huron Road 1 LT T R ========================================================================== ALL VEHICLES Total % Max Aver. Max Flow HV X Delay Queue ========================================================================== Peak flow period = 15 minutes. Page 7 of 12 Queue values in this table are 95% queue (metres) Note: Basic Saturation Flows are not adjusted at roundabouts or signcontrolled intersections and apply only to continuous lanes. Driver Characteristics Site:Huron Road-N-Strasburg Road PM Average Driver Lane Satn Satn Satn Satn Queue Response No. Speed Flow Hdwy Spacing Space Time km/h veh/h sec m m sec L T R NA - Short Lane East: Huron Road 1 LT T R NA - Short Lane LT T R NA - Short Lane West: Huron Road 1 LT T R NA - Short Lane Saturation Flow and Saturation Headway are derived from follow-up headway. Lane Delays Site:Huron Road-N-Strasburg Road PM Delay (seconds/veh) Deg. Stop-line Delay Acc. Queuing Stopd Lane Satn 1st 2nd Total Dec. Total MvUp (Idle) Geom Control No. x d1 d2 dsl dn dq dqm di dig dic /09/29
357 1 L T R East: Huron Road 1 LT T R LT T R West: Huron Road 1 LT T R HCM Delay Formula option used: (i) Control Delay does not include Geometric Delay, (ii) Stop-line Delay is treated as being same as Control Delay. dsl: Stop-line delay (=d1+d2) dn: Average stop-start delay for all vehicles queued and unqueued dq: Queuing delay (the part of the stop-line delay that includes stopped delay and queue move-up delay) dqm: Queue move-up delay di: Stopped delay (stopped (idling) time at near-zero speed) dig: Geometric delay dic: Intersection control delay (sum of stop-line and geometric delays) Page 8 of 12 Lane Queues (Vehicles) Site:Huron Road-N-Strasburg Road PM Deg. Ovrfl. Back of Queue (veh) Queue Prob. P'ile Cyc-Av. Queue Lane Satn Queue Stor. Block Block No. x No Nb1 Nb2 Nb 95% Ratio % % Nc 95% L T R East: Huron Road 1 LT T R LT T R West: Huron Road 1 LT T R HCM Delay Formula option used: Cycle-Average Queue is calculated using average delay from the HCM equation. (i.e. HCM delays are treated as stop-line delays for this purpose). SIDRA Standard models are used for Back of Queue estimation since HCM only gives Cycle-Average Queues for unsignalised intersections. Lane Queues (Distance) Site:Huron Road-N-Strasburg Road PM Deg. Ovrfl. Back of Queue (m) Queue Prob. P'ile Cyc-Av. Queue 2011/09/29
358 Lane Satn Queue Stor. Block Block No. x No Nb1 Nb2 Nb 95% Ratio % % Nc 95% L T R East: Huron Road 1 LT T R LT T R West: Huron Road 1 LT T R Page 9 of 12 HCM Delay Formula option used: Cycle-Average Queue is calculated using average delay from the HCM equation. (i.e. HCM delays are treated as stop-line delays for this purpose). SIDRA Standard models are used for Back of Queue estimation since HCM only gives Cycle-Average Queues for unsignalised intersections. Lane Queue Percentiles (Vehicles) Site:Huron Road-N-Strasburg Road PM Deg. Percentile Back of Queue (veh) Lane Satn No. x 50% 70% 85% 90% 95% 98% L T R East: Huron Road 1 LT T R LT T R West: Huron Road 1 LT T R SIDRA Standard models are used for Back of Queue estimation since HCM only gives Cycle-Average Queues for unsignalised intersections. Lane Queue Percentiles (Distance) Site:Huron Road-N-Strasburg Road PM Deg. Percentile Back of Queue (metres) Lane Satn No. x 50% 70% 85% 90% 95% 98% /09/29
359 1 L T R East: Huron Road 1 LT T R LT T R West: Huron Road 1 LT T R Page 10 of 12 SIDRA Standard models are used for Back of Queue estimation since HCM only gives Cycle-Average Queues for unsignalised intersections. Lane Stops Site:Huron Road-N-Strasburg Road PM Queue Total Deg. -- Effective Stop Rate -- Total Move-up Queue Prop. Lane Satn Geom. Overall Stops Rate Move-ups Queued No. x he1 he2 hig h H hqm Hqm pq L T R East: Huron Road 1 LT T R LT T R West: Huron Road 1 LT T R hig is the average value for all movements in a shared lane hqm is average queue move-up rate for all vehicles queued and unqueued Flow Rates and Demand Analysis Movement Definitions and Flow Rates (O-D) Site:Huron Road-N-Strasburg Road PM From To Mov Flow Rate Flow Scale Peak Flow Approach Approach ID Turn LV HV Fixed Var Factor East 8R Right North 8T Thru West 3L Left /09/29
360 East: Huron Road South 1L Left North 6R Right West 6T Thru South 4T Thru East 7L Left West 4R Right West: Huron Road South 2R Right East 2T Thru North 5L Left Unit Time for Volumes = 60 minutes Peak Flow Period = 15 minutes Flow Rates include effects of Flow Scale and Peak Flow Factor Page 11 of 12 Flow Rates (Separate Light and Heavy Vehicles) Site:Huron Road-N-Strasburg Road PM 2018 Mov Left Through Right ID LV HV LV HV LV HV Demand flows in veh/h as used by the program 3L L T T R R East: Huron Road 1L L T T R R L L T T R R West: Huron Road 5L L T T R R Unit Time for Volumes = 60 minutes Peak Flow Period = 15 minutes Flow Rates include effects of Flow Scale and Peak Flow Factor Flow Rates (Total Vehicles and Percent Heavy) Site:Huron Road-N-Strasburg Road PM Mov Left Through Right ID Total %HV Total %HV Total %HV --- Demand flows in veh/h as used by the program 3L L T T R R East: Huron Road 1L L T T /09/29
361 2011/09/29 Detailed Output 6R R L L T T R R West: Huron Road 5L L T T R R Unit Time for Volumes = 60 minutes Peak Flow Period = 15 minutes Flow Rates include effects of Flow Scale and Peak Flow Factor Page 12 of 12 Other Model Settings Site:Huron Road-N-Strasburg Road PM 2018 * Basic Parameters: Intersection Type: Driving on the right-hand side of the road Input data specified in Metric units Model Defaults: US HCM (Metric) Peak Flow Period (for performance): 15 minutes Unit time (for volumes): 60 minutes. HCM Delay Model option used HCM Queue Model option used Level of Service based on: Delay (HCM 2000) Queue percentile: 95% Parameters Used in Cost Calculations Site:Huron Road-N-Strasburg Road PM 2018 Pump price of fuel ($/L) = Fuel resource cost factor = 0.70 Ratio of running cost to fuel cost = 3.0 Average income ($/h) = Time value factor = 0.40 Light vehicle mass (1000 kg) = 1.4 Heavy vehicle mass (1000 kg) = 11.0 Light vehicle idle fuel rate (L/h) = Heavy vehicle idle fuel rate (L/h) = Diagnostics Site:Huron Road-N-Strasburg Road PM 2018 Processed: September 28, :36:34 PM SIDRA INTERSECTION Copyright Akcelik and Associates Pty Ltd Project: H:\DATA\ Transportation Planning\Working\Strasburg Road\SIDRA Files\PC\Huron Road and Strasburg Road Op 1.sip , SNC-LAVALIN INC, SINGLE
362 Page 1 of /09/29 DETAILED OUTPUT New Dundee Road and Strasburg Road Option 1 New Dundee Road -N-Strasburg Road - Weekday AM 2018 OUTPUT TABLE LINKS s Basic Parameters Gap Acceptance Parameters Movements Movement Capacity Parameters Movement Performance Fuel Consumption, Emissions and Cost (Total) Fuel Consumption, Emissions and Cost (Rate) Intersection Negotiation Data Movement Speeds and Geometric Delay Lanes Lane Performance Lane Flow and Capacity Information Lane, Approach and Intersection Performance Driver Characteristics Lane Delays Lane Queues (Vehicles) Lane Queues (Distance) Lane Queue Percentiles (Vehicles) Lane Queue Percentiles (Distance) Lane Stops Flow Rates and Demand Analysis Movement Definitions and Flow Rates (O-D) Flow Rates (Separate Light and Heavy Vehicles) Flow Rates (Total Vehicles and Percent Heavy) Other Model Settings Parameters Used in Cost Calculations Diagnostics s Basic Parameters Site:New Dundee Road -N-Strasburg Road - Weekday AM Circulating/Exiting Stream Cent Circ Insc Ent Ent Cir Ent Av.Ent Island Width Diam. Rad Ang Lan Lan Lane Flow %HV Adjust. %Exit Cap. O-D Diam Width Flow Incl. Constr. Factor m m m m deg m veh/h pcu/h Effect East: New Dundee Road Environment Factor: 1.20 Entry/Circulating Flow Adjustment: Medium N Environment Factor: 1.20 Entry/Circulating Flow Adjustment: Medium N West: New Dundee Road Environment Factor: 1.20 Entry/Circulating Flow Adjustment: Medium N 0.702
363 Page 2 of /09/ Capacity Model: SIDRA Standard HV Method for Gap Acceptance: Include HV Effect for all percentages Gap Acceptance Parameters Site:New Dundee Road -N-Strasburg Road - Weekday AM Turn Lane Lane ---- Circulating/Exiting Stream --- Critical Gap No. Type Flow Aver Aver In-Bnch Prop Foll-up Rate Speed Dist Headway Bunched Hdwy Dist Headway pcu/h km/h m sec sec m sec East: New Dundee Road Environment Factor: 1.20 Entry/Circulating Flow Adjustment: Medium Thru 1 Subdominant Right 2 Dominant Environment Factor: 1.20 Entry/Circulating Flow Adjustment: Medium Left 1 Dominant Right 2 Subdominant West: New Dundee Road Environment Factor: 1.20 Entry/Circulating Flow Adjustment: Medium Left 1 Subdominant Thru 1 Subdominant Dominant Capacity Model: SIDRA Standard P Priority sharing is implied for some movements (Follow-up Headway plus Intra-bunch Headway is larger than the Critical Gap). The O-D Factor ( Basic Parameters table) allows for priority sharing and priority emphasis. Dist (Distance): Spacing, i.e. distance between the front ends of two successive vehicles across all lanes in the circulating or exiting stream Movements Movement Capacity Parameters Site:New Dundee Road -N-Strasburg Road - Weekday AM Mov Opposing Movement Total Prac. Prac. Lane Deg. ID Demand Adjust. Cap. Deg. Spare Util Satn Flow HV Flow HV Flow Satn Cap. veh/h % veh/h % pcu/h veh/h xp % % x East: New Dundee Road 6T T R R L L * 4R R West: New Dundee Road 5L L T T * Maximum degree of saturation
364 Page 3 of /09/29 Movement Performance Site:New Dundee Road -N-Strasburg Road - Weekday AM Mov Total Total Aver. Eff. Total Perf. Tot.Trav. Tot.Trav. Aver. ID Delay Delay Delay Stop Stops Index Distance Time Speed (veh-h/h)(pers-h/h)(sec) Rate (veh-km/h)(veh-h/h) (km/h) East: New Dundee Road 6T T R R L L R R West: New Dundee Road 5L L T T Fuel Consumption, Emissions and Cost (Total) Site:New Dundee Road -N-Strasburg Road - Weekday AM 2018 Mov Cost Fuel CO2 CO HC NOX ID Total Total Total Total Total Total $/h L/h kg/h kg/h kg/h kg/h East: New Dundee Road 6T T R R L L R R West: New Dundee Road 5L L T T INTERSECTION: Fuel Consumption, Emissions and Cost (Rate) Site:New Dundee Road -N-Strasburg Road - Weekday AM 2018 Mov Cost Fuel CO2 CO HC NOX ID Rate Rate Rate Rate Rate Rate $/km L/100km g/km g/km g/km g/km East: New Dundee Road 6T T R R
365 Page 4 of /09/29 7L L R R West: New Dundee Road 5L L T T INTERSECTION: Intersection Negotiation Data Site:New Dundee Road -N-Strasburg Road - Weekday AM Negn Negn Negn Appr. Downstream Distance From To Radius Speed Dist. Dist Approach Approach Turn m km/h m m m User Spec? East: New Dundee Road North Right No West Thru No East Left No West Right No West: New Dundee Road East Thru No North Left No Maximum Negotiation (Design) Speed = 50.0 km/h Downstream distance is distance travelled from the stopline until exit cruise speed is reached (includes negotiation distance). Acceleration distance is weighted for light and heavy vehicles. The same distance applies for both stopped and unstopped vehicles. Movement Speeds and Geometric Delay Site:New Dundee Road -N-Strasburg Road - Weekday AM Queue Move-up App. Speeds Exit Speeds Av. Section Spd Geom Mov st 2nd Delay ID Cruise Negn Negn Cruise Grn Grn Running Overall sec East: New Dundee Road 6T T R R L L R R West: New Dundee Road 5L L T T "Running Speed" is the average speed excluding stopped periods. HCM Delay Formula option used: Geometric Delay is not included in Control Delay.
366 Page 5 of /09/29 Lanes Lane Performance Site:New Dundee Road -N-Strasburg Road - Weekday AM 2018 Q u e u e Flow Cap Deg. Aver. Eff. 95% Back Lane Lane Satn Delay Stop Length No. veh/h veh/h x sec Rate veh m m East: New Dundee Road 1 T R L R West: New Dundee Road 1 LT T Lane Flow and Capacity Information Site:New Dundee Road -N-Strasburg Road - Weekday AM Lane Dem Flow (veh/h) Min Tot Deg. Lane No Cap Cap Satn Util Lef Thru Rig Tot veh/h veh/h x % East: New Dundee Road 1 T P 2 R L R West: New Dundee Road 1 LT T P Lane under-utilisation found by the "Program". This includes cases where the value of lane under-utilisation due to downstream effects has been modified by the program during lane flow calculations (e.g. a de facto exclusive lane has been found). The capacity value for priority and continuous movements is obtained by adjusting the basic saturation flow for heavy vehicle and turning vehicle effects. Saturation flow scale applies if specified. Lane, Approach and Intersection Performance Site:New Dundee Road -N-Strasburg Road - Weekday AM Lane Demand Flow (veh/h) Adj. Eff Grn Deg Aver. Longest Shrt No %HV Basic (sec) Sat Delay Queue Lane L T R Tot Satf. 1st 2nd x sec m m
367 Page 6 of /09/29 East: New Dundee Road 1 T R L R West: New Dundee Road 1 LT T ========================================================================== ALL VEHICLES Total % Max Aver. Max Flow HV X Delay Queue ========================================================================== Peak flow period = 15 minutes. Queue values in this table are 95% queue (metres) Note: Basic Saturation Flows are not adjusted at roundabouts or signcontrolled intersections and apply only to continuous lanes. Driver Characteristics Site:New Dundee Road -N-Strasburg Road - Weekday AM Average Driver Lane Satn Satn Satn Satn Queue Response No. Speed Flow Hdwy Spacing Space Time km/h veh/h sec m m sec East: New Dundee Road 1 T R L R West: New Dundee Road 1 LT T Saturation Flow and Saturation Headway are derived from follow-up headway. Lane Delays Site:New Dundee Road -N-Strasburg Road - Weekday AM Delay (seconds/veh) Deg. Stop-line Delay Acc. Queuing Stopd Lane Satn 1st 2nd Total Dec. Total MvUp (Idle) Geom Control No. x d1 d2 dsl dn dq dqm di dig dic East: New Dundee Road 1 T R L R
368 Page 7 of /09/ West: New Dundee Road 1 LT T HCM Delay Formula option used: (i) Control Delay does not include Geometric Delay, (ii) Stop-line Delay is treated as being same as Control Delay. dsl: Stop-line delay (=d1+d2) dn: Average stop-start delay for all vehicles queued and unqueued dq: Queuing delay (the part of the stop-line delay that includes stopped delay and queue move-up delay) dqm: Queue move-up delay di: Stopped delay (stopped (idling) time at near-zero speed) dig: Geometric delay dic: Intersection control delay (sum of stop-line and geometric delays) Lane Queues (Vehicles) Site:New Dundee Road -N-Strasburg Road - Weekday AM Deg. Ovrfl. Back of Queue (veh) Queue Prob. P'ile Cyc-Av. Queue Lane Satn Queue Stor. Block Block No. x No Nb1 Nb2 Nb 95% Ratio % % Nc 95% East: New Dundee Road 1 T R L R West: New Dundee Road 1 LT T HCM Delay Formula option used: Cycle-Average Queue is calculated using average delay from the HCM equation. (i.e. HCM delays are treated as stop-line delays for this purpose). SIDRA Standard models are used for Back of Queue estimation since HCM only gives Cycle-Average Queues for unsignalised intersections. Lane Queues (Distance) Site:New Dundee Road -N-Strasburg Road - Weekday AM Deg. Ovrfl. Back of Queue (m) Queue Prob. P'ile Cyc-Av. Queue Lane Satn Queue Stor. Block Block No. x No Nb1 Nb2 Nb 95% Ratio % % Nc 95% East: New Dundee Road 1 T R L R West: New Dundee Road 1 LT T HCM Delay Formula option used: Cycle-Average Queue is calculated using average delay from the HCM equation. (i.e. HCM delays are treated as stop-line delays for this purpose).
369 Page 8 of /09/29 SIDRA Standard models are used for Back of Queue estimation since HCM only gives Cycle-Average Queues for unsignalised intersections. Lane Queue Percentiles (Vehicles) Site:New Dundee Road -N-Strasburg Road - Weekday AM Deg. Percentile Back of Queue (veh) Lane Satn No. x 50% 70% 85% 90% 95% 98% East: New Dundee Road 1 T R L R West: New Dundee Road 1 LT T SIDRA Standard models are used for Back of Queue estimation since HCM only gives Cycle-Average Queues for unsignalised intersections. Lane Queue Percentiles (Distance) Site:New Dundee Road -N-Strasburg Road - Weekday AM Deg. Percentile Back of Queue (metres) Lane Satn No. x 50% 70% 85% 90% 95% 98% East: New Dundee Road 1 T R L R West: New Dundee Road 1 LT T SIDRA Standard models are used for Back of Queue estimation since HCM only gives Cycle-Average Queues for unsignalised intersections. Lane Stops Site:New Dundee Road -N-Strasburg Road - Weekday AM Queue Total Deg. -- Effective Stop Rate -- Total Move-up Queue Prop. Lane Satn Geom. Overall Stops Rate Move-ups Queued No. x he1 he2 hig h H hqm Hqm pq East: New Dundee Road 1 T
370 Page 9 of /09/29 2 R L R West: New Dundee Road 1 LT T hig is the average value for all movements in a shared lane hqm is average queue move-up rate for all vehicles queued and unqueued Flow Rates and Demand Analysis Movement Definitions and Flow Rates (O-D) Site:New Dundee Road -N-Strasburg Road - Weekday AM From To Mov Flow Rate Flow Scale Peak Flow Approach Approach ID Turn LV HV Fixed Var Factor East: New Dundee Road North 6R Right West 6T Thru East 7L Left West 4R Right West: New Dundee Road East 2T Thru North 5L Left Unit Time for Volumes = 60 minutes Peak Flow Period = 15 minutes Flow Rates include effects of Flow Scale and Peak Flow Factor Flow Rates (Separate Light and Heavy Vehicles) Site:New Dundee Road -N-Strasburg Road - Weekday AM 2018 Mov Left Through Right ID LV HV LV HV LV HV Demand flows in veh/h as used by the program East: New Dundee Road 6T T R R L L R R West: New Dundee Road 5L L T T Unit Time for Volumes = 60 minutes Peak Flow Period = 15 minutes Flow Rates include effects of Flow Scale and Peak Flow Factor
371 Page 10 of /09/29 Flow Rates (Total Vehicles and Percent Heavy) Site:New Dundee Road -N-Strasburg Road - Weekday AM Mov Left Through Right ID Total %HV Total %HV Total %HV --- Demand flows in veh/h as used by the program East: New Dundee Road 6T T R R L L R R West: New Dundee Road 5L L T T Unit Time for Volumes = 60 minutes Peak Flow Period = 15 minutes Flow Rates include effects of Flow Scale and Peak Flow Factor Other Model Settings Site:New Dundee Road -N-Strasburg Road - Weekday AM 2018 * Basic Parameters: Intersection Type: Driving on the right-hand side of the road Input data specified in Metric units Model Defaults: US HCM (Metric) Peak Flow Period (for performance): 15 minutes Unit time (for volumes): 60 minutes. HCM Delay Model option used HCM Queue Model option used Level of Service based on: Delay (HCM 2000) Queue percentile: 95% Parameters Used in Cost Calculations Site:New Dundee Road -N-Strasburg Road - Weekday AM 2018 Pump price of fuel ($/L) = Fuel resource cost factor = 0.70 Ratio of running cost to fuel cost = 3.0 Average income ($/h) = Time value factor = 0.40 Light vehicle mass (1000 kg) = 1.4 Heavy vehicle mass (1000 kg) = 11.0 Light vehicle idle fuel rate (L/h) = Heavy vehicle idle fuel rate (L/h) = Diagnostics
372 Page 11 of /09/29 Site:New Dundee Road -N-Strasburg Road - Weekday AM 2018 Processed: September 28, :44:59 PM Copyright Akcelik and Associates Pty Ltd SIDRA INTERSECTION Project: H:\DATA\ Transportation Planning\Working\Strasburg Road\SIDRA Files\PC\New Dundee Road and Strasburg Road Op 1.sip , SNC-LAVALIN INC, SINGLE
373 Page 1 of /09/29 DETAILED OUTPUT New Dundee Road and Strasburg Road Option 1 New Dundee Road -N-Strasburg Road - Weekday PM 2018 OUTPUT TABLE LINKS s Basic Parameters Gap Acceptance Parameters Movements Movement Capacity Parameters Movement Performance Fuel Consumption, Emissions and Cost (Total) Fuel Consumption, Emissions and Cost (Rate) Intersection Negotiation Data Movement Speeds and Geometric Delay Lanes Lane Performance Lane Flow and Capacity Information Lane, Approach and Intersection Performance Driver Characteristics Lane Delays Lane Queues (Vehicles) Lane Queues (Distance) Lane Queue Percentiles (Vehicles) Lane Queue Percentiles (Distance) Lane Stops Flow Rates and Demand Analysis Movement Definitions and Flow Rates (O-D) Flow Rates (Separate Light and Heavy Vehicles) Flow Rates (Total Vehicles and Percent Heavy) Other Model Settings Parameters Used in Cost Calculations Diagnostics s Basic Parameters Site:New Dundee Road -N-Strasburg Road - Weekday PM Circulating/Exiting Stream Cent Circ Insc Ent Ent Cir Ent Av.Ent Island Width Diam. Rad Ang Lan Lan Lane Flow %HV Adjust. %Exit Cap. O-D Diam Width Flow Incl. Constr. Factor m m m m deg m veh/h pcu/h Effect East: New Dundee Road Environment Factor: 1.20 Entry/Circulating Flow Adjustment: Medium N Environment Factor: 1.20 Entry/Circulating Flow Adjustment: Medium N West: New Dundee Road Environment Factor: 1.20 Entry/Circulating Flow Adjustment: Medium Y 0.789
374 Page 2 of /09/ Capacity Model: SIDRA Standard HV Method for Gap Acceptance: Include HV Effect for all percentages Gap Acceptance Parameters Site:New Dundee Road -N-Strasburg Road - Weekday PM Turn Lane Lane ---- Circulating/Exiting Stream --- Critical Gap No. Type Flow Aver Aver In-Bnch Prop Foll-up Rate Speed Dist Headway Bunched Hdwy Dist Headway pcu/h km/h m sec sec m sec East: New Dundee Road Environment Factor: 1.20 Entry/Circulating Flow Adjustment: Medium Thru 1 Subdominant Dominant Right 2 Dominant Environment Factor: 1.20 Entry/Circulating Flow Adjustment: Medium Left 1 Dominant Right 2 Subdominant West: New Dundee Road Environment Factor: 1.20 Entry/Circulating Flow Adjustment: Medium Left 1 Subdominant Thru 1 Subdominant Dominant Capacity Model: SIDRA Standard P Priority sharing is implied for some movements (Follow-up Headway plus Intra-bunch Headway is larger than the Critical Gap). The O-D Factor ( Basic Parameters table) allows for priority sharing and priority emphasis. Dist (Distance): Spacing, i.e. distance between the front ends of two successive vehicles across all lanes in the circulating or exiting stream Movements Movement Capacity Parameters Site:New Dundee Road -N-Strasburg Road - Weekday PM Mov Opposing Movement Total Prac. Prac. Lane Deg. ID Demand Adjust. Cap. Deg. Spare Util Satn Flow HV Flow HV Flow Satn Cap. veh/h % veh/h % pcu/h veh/h xp % % x East: New Dundee Road 6T T R R L L * 4R R West: New Dundee Road 5L L T T * Maximum degree of saturation
375 Page 3 of /09/29 Movement Performance Site:New Dundee Road -N-Strasburg Road - Weekday PM Mov Total Total Aver. Eff. Total Perf. Tot.Trav. Tot.Trav. Aver. ID Delay Delay Delay Stop Stops Index Distance Time Speed (veh-h/h)(pers-h/h)(sec) Rate (veh-km/h)(veh-h/h) (km/h) East: New Dundee Road 6T T R R L L R R West: New Dundee Road 5L L T T Fuel Consumption, Emissions and Cost (Total) Site:New Dundee Road -N-Strasburg Road - Weekday PM 2018 Mov Cost Fuel CO2 CO HC NOX ID Total Total Total Total Total Total $/h L/h kg/h kg/h kg/h kg/h East: New Dundee Road 6T T R R L L R R West: New Dundee Road 5L L T T INTERSECTION: Fuel Consumption, Emissions and Cost (Rate) Site:New Dundee Road -N-Strasburg Road - Weekday PM 2018 Mov Cost Fuel CO2 CO HC NOX ID Rate Rate Rate Rate Rate Rate $/km L/100km g/km g/km g/km g/km East: New Dundee Road 6T T R R
376 Page 4 of /09/29 7L L R R West: New Dundee Road 5L L T T INTERSECTION: Intersection Negotiation Data Site:New Dundee Road -N-Strasburg Road - Weekday PM Negn Negn Negn Appr. Downstream Distance From To Radius Speed Dist. Dist Approach Approach Turn m km/h m m m User Spec? East: New Dundee Road North Right No West Thru No East Left No West Right No West: New Dundee Road East Thru No North Left No Maximum Negotiation (Design) Speed = 50.0 km/h Downstream distance is distance travelled from the stopline until exit cruise speed is reached (includes negotiation distance). Acceleration distance is weighted for light and heavy vehicles. The same distance applies for both stopped and unstopped vehicles. Movement Speeds and Geometric Delay Site:New Dundee Road -N-Strasburg Road - Weekday PM Queue Move-up App. Speeds Exit Speeds Av. Section Spd Geom Mov st 2nd Delay ID Cruise Negn Negn Cruise Grn Grn Running Overall sec East: New Dundee Road 6T T R R L L R R West: New Dundee Road 5L L T T "Running Speed" is the average speed excluding stopped periods. HCM Delay Formula option used: Geometric Delay is not included in Control Delay.
377 Page 5 of /09/29 Lanes Lane Performance Site:New Dundee Road -N-Strasburg Road - Weekday PM 2018 Q u e u e Flow Cap Deg. Aver. Eff. 95% Back Lane Lane Satn Delay Stop Length No. veh/h veh/h x sec Rate veh m m East: New Dundee Road 1 T TR L R West: New Dundee Road 1 LT T Lane Flow and Capacity Information Site:New Dundee Road -N-Strasburg Road - Weekday PM Lane Dem Flow (veh/h) Min Tot Deg. Lane No Cap Cap Satn Util Lef Thru Rig Tot veh/h veh/h x % East: New Dundee Road 1 T TR L R West: New Dundee Road 1 LT T The capacity value for priority and continuous movements is obtained by adjusting the basic saturation flow for heavy vehicle and turning vehicle effects. Saturation flow scale applies if specified. Lane, Approach and Intersection Performance Site:New Dundee Road -N-Strasburg Road - Weekday PM Lane Demand Flow (veh/h) Adj. Eff Grn Deg Aver. Longest Shrt No %HV Basic (sec) Sat Delay Queue Lane L T R Tot Satf. 1st 2nd x sec m m East: New Dundee Road 1 T TR
378 Page 6 of /09/ L R West: New Dundee Road 1 LT T ========================================================================== ALL VEHICLES Total % Max Aver. Max Flow HV X Delay Queue ========================================================================== Peak flow period = 15 minutes. Queue values in this table are 95% queue (metres) Note: Basic Saturation Flows are not adjusted at roundabouts or signcontrolled intersections and apply only to continuous lanes. Driver Characteristics Site:New Dundee Road -N-Strasburg Road - Weekday PM Average Driver Lane Satn Satn Satn Satn Queue Response No. Speed Flow Hdwy Spacing Space Time km/h veh/h sec m m sec East: New Dundee Road 1 T TR L R West: New Dundee Road 1 LT T Saturation Flow and Saturation Headway are derived from follow-up headway. Lane Delays Site:New Dundee Road -N-Strasburg Road - Weekday PM Delay (seconds/veh) Deg. Stop-line Delay Acc. Queuing Stopd Lane Satn 1st 2nd Total Dec. Total MvUp (Idle) Geom Control No. x d1 d2 dsl dn dq dqm di dig dic East: New Dundee Road 1 T TR L R West: New Dundee Road 1 LT
379 Page 7 of /09/29 2 T HCM Delay Formula option used: (i) Control Delay does not include Geometric Delay, (ii) Stop-line Delay is treated as being same as Control Delay. dsl: Stop-line delay (=d1+d2) dn: Average stop-start delay for all vehicles queued and unqueued dq: Queuing delay (the part of the stop-line delay that includes stopped delay and queue move-up delay) dqm: Queue move-up delay di: Stopped delay (stopped (idling) time at near-zero speed) dig: Geometric delay dic: Intersection control delay (sum of stop-line and geometric delays) Lane Queues (Vehicles) Site:New Dundee Road -N-Strasburg Road - Weekday PM Deg. Ovrfl. Back of Queue (veh) Queue Prob. P'ile Cyc-Av. Queue Lane Satn Queue Stor. Block Block No. x No Nb1 Nb2 Nb 95% Ratio % % Nc 95% East: New Dundee Road 1 T TR L R West: New Dundee Road 1 LT T HCM Delay Formula option used: Cycle-Average Queue is calculated using average delay from the HCM equation. (i.e. HCM delays are treated as stop-line delays for this purpose). SIDRA Standard models are used for Back of Queue estimation since HCM only gives Cycle-Average Queues for unsignalised intersections. Lane Queues (Distance) Site:New Dundee Road -N-Strasburg Road - Weekday PM Deg. Ovrfl. Back of Queue (m) Queue Prob. P'ile Cyc-Av. Queue Lane Satn Queue Stor. Block Block No. x No Nb1 Nb2 Nb 95% Ratio % % Nc 95% East: New Dundee Road 1 T TR L R West: New Dundee Road 1 LT T HCM Delay Formula option used: Cycle-Average Queue is calculated using average delay from the HCM equation. (i.e. HCM delays are treated as stop-line delays for this purpose). SIDRA Standard models are used for Back of Queue estimation since HCM only gives Cycle-Average Queues for unsignalised intersections.
380 Page 8 of /09/29 Lane Queue Percentiles (Vehicles) Site:New Dundee Road -N-Strasburg Road - Weekday PM Deg. Percentile Back of Queue (veh) Lane Satn No. x 50% 70% 85% 90% 95% 98% East: New Dundee Road 1 T TR L R West: New Dundee Road 1 LT T SIDRA Standard models are used for Back of Queue estimation since HCM only gives Cycle-Average Queues for unsignalised intersections. Lane Queue Percentiles (Distance) Site:New Dundee Road -N-Strasburg Road - Weekday PM Deg. Percentile Back of Queue (metres) Lane Satn No. x 50% 70% 85% 90% 95% 98% East: New Dundee Road 1 T TR L R West: New Dundee Road 1 LT T SIDRA Standard models are used for Back of Queue estimation since HCM only gives Cycle-Average Queues for unsignalised intersections. Lane Stops Site:New Dundee Road -N-Strasburg Road - Weekday PM Queue Total Deg. -- Effective Stop Rate -- Total Move-up Queue Prop. Lane Satn Geom. Overall Stops Rate Move-ups Queued No. x he1 he2 hig h H hqm Hqm pq East: New Dundee Road 1 T TR
381 Page 9 of /09/29 1 L R West: New Dundee Road 1 LT T hig is the average value for all movements in a shared lane hqm is average queue move-up rate for all vehicles queued and unqueued Flow Rates and Demand Analysis Movement Definitions and Flow Rates (O-D) Site:New Dundee Road -N-Strasburg Road - Weekday PM From To Mov Flow Rate Flow Scale Peak Flow Approach Approach ID Turn LV HV Fixed Var Factor East: New Dundee Road North 6R Right West 6T Thru East 7L Left West 4R Right West: New Dundee Road East 2T Thru North 5L Left Unit Time for Volumes = 60 minutes Peak Flow Period = 15 minutes Flow Rates include effects of Flow Scale and Peak Flow Factor Flow Rates (Separate Light and Heavy Vehicles) Site:New Dundee Road -N-Strasburg Road - Weekday PM 2018 Mov Left Through Right ID LV HV LV HV LV HV Demand flows in veh/h as used by the program East: New Dundee Road 6T T R R L L R R West: New Dundee Road 5L L T T Unit Time for Volumes = 60 minutes Peak Flow Period = 15 minutes Flow Rates include effects of Flow Scale and Peak Flow Factor Flow Rates (Total Vehicles and Percent Heavy)
382 Page 10 of /09/29 Site:New Dundee Road -N-Strasburg Road - Weekday PM Mov Left Through Right ID Total %HV Total %HV Total %HV --- Demand flows in veh/h as used by the program East: New Dundee Road 6T T R R L L R R West: New Dundee Road 5L L T T Unit Time for Volumes = 60 minutes Peak Flow Period = 15 minutes Flow Rates include effects of Flow Scale and Peak Flow Factor Other Model Settings Site:New Dundee Road -N-Strasburg Road - Weekday PM 2018 * Basic Parameters: Intersection Type: Driving on the right-hand side of the road Input data specified in Metric units Model Defaults: US HCM (Metric) Peak Flow Period (for performance): 15 minutes Unit time (for volumes): 60 minutes. HCM Delay Model option used HCM Queue Model option used Level of Service based on: Delay (HCM 2000) Queue percentile: 95% Parameters Used in Cost Calculations Site:New Dundee Road -N-Strasburg Road - Weekday PM 2018 Pump price of fuel ($/L) = Fuel resource cost factor = 0.70 Ratio of running cost to fuel cost = 3.0 Average income ($/h) = Time value factor = 0.40 Light vehicle mass (1000 kg) = 1.4 Heavy vehicle mass (1000 kg) = 11.0 Light vehicle idle fuel rate (L/h) = Heavy vehicle idle fuel rate (L/h) = Diagnostics Site:New Dundee Road -N-Strasburg Road - Weekday PM 2018
383 Page 11 of 11 Processed: September 28, :45:40 PM SIDRA INTERSECTION Copyright Akcelik and Associates Pty Ltd Project: H:\DATA\ Transportation Planning\Working\Strasburg Road\SIDRA Files\PC\New Dundee Road and Strasburg Road Op 1.sip , SNC-LAVALIN INC, SINGLE 2011/09/29
384 Page 1 of /09/29 DETAILED OUTPUT Robert Ferrie Drive and New Dundee Road Option 1 Robert Ferrie-N-New Dundee- Weekday AM 2018 OUTPUT TABLE LINKS s Basic Parameters Gap Acceptance Parameters Movements Movement Capacity Parameters Movement Performance Fuel Consumption, Emissions and Cost (Total) Fuel Consumption, Emissions and Cost (Rate) Intersection Negotiation Data Movement Speeds and Geometric Delay Lanes Lane Performance Lane Flow and Capacity Information Lane, Approach and Intersection Performance Driver Characteristics Lane Delays Lane Queues (Vehicles) Lane Queues (Distance) Lane Queue Percentiles (Vehicles) Lane Queue Percentiles (Distance) Lane Stops Flow Rates and Demand Analysis Movement Definitions and Flow Rates (O-D) Flow Rates (Separate Light and Heavy Vehicles) Flow Rates (Total Vehicles and Percent Heavy) Other Model Settings Parameters Used in Cost Calculations Diagnostics s Basic Parameters Site:Robert Ferrie-N-New Dundee-Weekday AM Circulating/Exiting Stream Cent Circ Insc Ent Ent Cir Ent Av.Ent Island Width Diam. Rad Ang Lan Lan Lane Flow %HV Adjust. %Exit Cap. O-D Diam Width Flow Incl. Constr. Factor m m m m deg m veh/h pcu/h Effect East: New Dundee Road Environment Factor: 1.20 Entry/Circulating Flow Adjustment: Medium N North: Robert Ferrie Drive Environment Factor: 1.20 Entry/Circulating Flow Adjustment: Medium N West: New Dundee Road Environment Factor: 1.20 Entry/Circulating Flow Adjustment: Medium N 0.987
385 Page 2 of /09/ Capacity Model: SIDRA Standard HV Method for Gap Acceptance: Include HV Effect for all percentages Gap Acceptance Parameters Site:Robert Ferrie-N-New Dundee-Weekday AM Turn Lane Lane ---- Circulating/Exiting Stream --- Critical Gap No. Type Flow Aver Aver In-Bnch Prop Foll-up Rate Speed Dist Headway Bunched Hdwy Dist Headway pcu/h km/h m sec sec m sec East: New Dundee Road Environment Factor: 1.20 Entry/Circulating Flow Adjustment: Medium Thru 1 Subdominant Dominant Right 2 Dominant North: Robert Ferrie Drive Environment Factor: 1.20 Entry/Circulating Flow Adjustment: Medium Left 1 Dominant Right 1 Dominant West: New Dundee Road Environment Factor: 1.20 Entry/Circulating Flow Adjustment: Medium Left 1 Subdominant Thru 1 Subdominant Dominant Capacity Model: SIDRA Standard P Priority sharing is implied for some movements (Follow-up Headway plus Intra-bunch Headway is larger than the Critical Gap). The O-D Factor ( Basic Parameters table) allows for priority sharing and priority emphasis. Dist (Distance): Spacing, i.e. distance between the front ends of two successive vehicles across all lanes in the circulating or exiting stream Movements Movement Capacity Parameters Site:Robert Ferrie-N-New Dundee-Weekday AM Mov Opposing Movement Total Prac. Prac. Lane Deg. ID Demand Adjust. Cap. Deg. Spare Util Satn Flow HV Flow HV Flow Satn Cap. veh/h % veh/h % pcu/h veh/h xp % % x East: New Dundee Road 6T T R R North: Robert Ferrie Drive 7L L R R West: New Dundee Road 5L L * 2T T * * Maximum degree of saturation
386 Page 3 of /09/29 Movement Performance Site:Robert Ferrie-N-New Dundee-Weekday AM Mov Total Total Aver. Eff. Total Perf. Tot.Trav. Tot.Trav. Aver. ID Delay Delay Delay Stop Stops Index Distance Time Speed (veh-h/h)(pers-h/h)(sec) Rate (veh-km/h)(veh-h/h) (km/h) East: New Dundee Road 6T T R R North: Robert Ferrie Drive 7L L R R West: New Dundee Road 5L L T T Fuel Consumption, Emissions and Cost (Total) Site:Robert Ferrie-N-New Dundee-Weekday AM 2018 Mov Cost Fuel CO2 CO HC NOX ID Total Total Total Total Total Total $/h L/h kg/h kg/h kg/h kg/h East: New Dundee Road 6T T R R North: Robert Ferrie Drive 7L L R R West: New Dundee Road 5L L T T INTERSECTION: Fuel Consumption, Emissions and Cost (Rate) Site:Robert Ferrie-N-New Dundee-Weekday AM 2018 Mov Cost Fuel CO2 CO HC NOX ID Rate Rate Rate Rate Rate Rate $/km L/100km g/km g/km g/km g/km East: New Dundee Road 6T T R R
387 Page 4 of /09/29 North: Robert Ferrie Drive 7L L R R West: New Dundee Road 5L L T T INTERSECTION: Intersection Negotiation Data Site:Robert Ferrie-N-New Dundee-Weekday AM Negn Negn Negn Appr. Downstream Distance From To Radius Speed Dist. Dist Approach Approach Turn m km/h m m m User Spec? East: New Dundee Road North Right No West Thru No North: Robert Ferrie Drive East Left No West Right No West: New Dundee Road East Thru No North Left No Maximum Negotiation (Design) Speed = 50.0 km/h Downstream distance is distance travelled from the stopline until exit cruise speed is reached (includes negotiation distance). Acceleration distance is weighted for light and heavy vehicles. The same distance applies for both stopped and unstopped vehicles. Movement Speeds and Geometric Delay Site:Robert Ferrie-N-New Dundee-Weekday AM Queue Move-up App. Speeds Exit Speeds Av. Section Spd Geom Mov st 2nd Delay ID Cruise Negn Negn Cruise Grn Grn Running Overall sec East: New Dundee Road 6T T R R North: Robert Ferrie Drive 7L L R R West: New Dundee Road 5L L T T "Running Speed" is the average speed excluding stopped periods. HCM Delay Formula option used: Geometric Delay is not included in Control Delay.
388 Page 5 of /09/29 Lanes Lane Performance Site:Robert Ferrie-N-New Dundee-Weekday AM 2018 Q u e u e Flow Cap Deg. Aver. Eff. 95% Back Lane Lane Satn Delay Stop Length No. veh/h veh/h x sec Rate veh m m East: New Dundee Road 1 T TR North: Robert Ferrie Drive 1 LR West: New Dundee Road 1 LT T Lane Flow and Capacity Information Site:Robert Ferrie-N-New Dundee-Weekday AM Lane Dem Flow (veh/h) Min Tot Deg. Lane No Cap Cap Satn Util Lef Thru Rig Tot veh/h veh/h x % East: New Dundee Road 1 T TR North: Robert Ferrie Drive 1 LR West: New Dundee Road 1 LT T The capacity value for priority and continuous movements is obtained by adjusting the basic saturation flow for heavy vehicle and turning vehicle effects. Saturation flow scale applies if specified. Lane, Approach and Intersection Performance Site:Robert Ferrie-N-New Dundee-Weekday AM Lane Demand Flow (veh/h) Adj. Eff Grn Deg Aver. Longest Shrt No %HV Basic (sec) Sat Delay Queue Lane L T R Tot Satf. 1st 2nd x sec m m East: New Dundee Road 1 T TR
389 Page 6 of /09/ North: Robert Ferrie Drive 1 LR West: New Dundee Road 1 LT T ========================================================================== ALL VEHICLES Total % Max Aver. Max Flow HV X Delay Queue ========================================================================== Peak flow period = 15 minutes. Queue values in this table are 95% queue (metres) Note: Basic Saturation Flows are not adjusted at roundabouts or signcontrolled intersections and apply only to continuous lanes. Driver Characteristics Site:Robert Ferrie-N-New Dundee-Weekday AM Average Driver Lane Satn Satn Satn Satn Queue Response No. Speed Flow Hdwy Spacing Space Time km/h veh/h sec m m sec East: New Dundee Road 1 T TR North: Robert Ferrie Drive 1 LR West: New Dundee Road 1 LT T Saturation Flow and Saturation Headway are derived from follow-up headway. Lane Delays Site:Robert Ferrie-N-New Dundee-Weekday AM Delay (seconds/veh) Deg. Stop-line Delay Acc. Queuing Stopd Lane Satn 1st 2nd Total Dec. Total MvUp (Idle) Geom Control No. x d1 d2 dsl dn dq dqm di dig dic East: New Dundee Road 1 T TR North: Robert Ferrie Drive 1 LR West: New Dundee Road 1 LT T HCM Delay Formula option used: (i) Control Delay does not include Geometric Delay, (ii) Stop-line Delay is treated as being same as Control Delay.
390 Page 7 of /09/29 dsl: Stop-line delay (=d1+d2) dn: Average stop-start delay for all vehicles queued and unqueued dq: Queuing delay (the part of the stop-line delay that includes stopped delay and queue move-up delay) dqm: Queue move-up delay di: Stopped delay (stopped (idling) time at near-zero speed) dig: Geometric delay dic: Intersection control delay (sum of stop-line and geometric delays) Geometric delay is less than 2 seconds for some movements. The negotiation speed may be too high or the approach and exit speeds may be too low for given geometric design (e.g. for a large roundabout). Check Detailed Output for geometric delay data including negotiation speeds. If necessary, specify appropriate values of approach and exit speeds, negotiation radius or negotiation speed data in the Path Data dialog. Lane Queues (Vehicles) Site:Robert Ferrie-N-New Dundee-Weekday AM Deg. Ovrfl. Back of Queue (veh) Queue Prob. P'ile Cyc-Av. Queue Lane Satn Queue Stor. Block Block No. x No Nb1 Nb2 Nb 95% Ratio % % Nc 95% East: New Dundee Road 1 T TR North: Robert Ferrie Drive 1 LR West: New Dundee Road 1 LT T HCM Delay Formula option used: Cycle-Average Queue is calculated using average delay from the HCM equation. (i.e. HCM delays are treated as stop-line delays for this purpose). SIDRA Standard models are used for Back of Queue estimation since HCM only gives Cycle-Average Queues for unsignalised intersections. Lane Queues (Distance) Site:Robert Ferrie-N-New Dundee-Weekday AM Deg. Ovrfl. Back of Queue (m) Queue Prob. P'ile Cyc-Av. Queue Lane Satn Queue Stor. Block Block No. x No Nb1 Nb2 Nb 95% Ratio % % Nc 95% East: New Dundee Road 1 T TR North: Robert Ferrie Drive 1 LR West: New Dundee Road 1 LT T HCM Delay Formula option used: Cycle-Average Queue is calculated using average delay from the HCM equation. (i.e. HCM delays are treated as stop-line delays for this purpose). SIDRA Standard models are used for Back of Queue estimation since HCM only gives Cycle-Average Queues for unsignalised intersections.
391 Page 8 of /09/29 Lane Queue Percentiles (Vehicles) Site:Robert Ferrie-N-New Dundee-Weekday AM Deg. Percentile Back of Queue (veh) Lane Satn No. x 50% 70% 85% 90% 95% 98% East: New Dundee Road 1 T TR North: Robert Ferrie Drive 1 LR West: New Dundee Road 1 LT T SIDRA Standard models are used for Back of Queue estimation since HCM only gives Cycle-Average Queues for unsignalised intersections. Lane Queue Percentiles (Distance) Site:Robert Ferrie-N-New Dundee-Weekday AM Deg. Percentile Back of Queue (metres) Lane Satn No. x 50% 70% 85% 90% 95% 98% East: New Dundee Road 1 T TR North: Robert Ferrie Drive 1 LR West: New Dundee Road 1 LT T SIDRA Standard models are used for Back of Queue estimation since HCM only gives Cycle-Average Queues for unsignalised intersections. Lane Stops Site:Robert Ferrie-N-New Dundee-Weekday AM Queue Total Deg. -- Effective Stop Rate -- Total Move-up Queue Prop. Lane Satn Geom. Overall Stops Rate Move-ups Queued No. x he1 he2 hig h H hqm Hqm pq East: New Dundee Road 1 T TR North: Robert Ferrie Drive 1 LR
392 Page 9 of /09/29 West: New Dundee Road 1 LT T hig is the average value for all movements in a shared lane hqm is average queue move-up rate for all vehicles queued and unqueued Flow Rates and Demand Analysis Movement Definitions and Flow Rates (O-D) Site:Robert Ferrie-N-New Dundee-Weekday AM From To Mov Flow Rate Flow Scale Peak Flow Approach Approach ID Turn LV HV Fixed Var Factor East: New Dundee Road North 6R Right West 6T Thru North: Robert Ferrie Drive East 7L Left West 4R Right West: New Dundee Road East 2T Thru North 5L Left Unit Time for Volumes = 60 minutes Peak Flow Period = 15 minutes Flow Rates include effects of Flow Scale and Peak Flow Factor Flow Rates (Separate Light and Heavy Vehicles) Site:Robert Ferrie-N-New Dundee-Weekday AM 2018 Mov Left Through Right ID LV HV LV HV LV HV Demand flows in veh/h as used by the program East: New Dundee Road 6T T R R North: Robert Ferrie Drive 7L L R R West: New Dundee Road 5L L T T Unit Time for Volumes = 60 minutes Peak Flow Period = 15 minutes Flow Rates include effects of Flow Scale and Peak Flow Factor Flow Rates (Total Vehicles and Percent Heavy) Site:Robert Ferrie-N-New Dundee-Weekday AM 2018
393 Page 10 of /09/ Mov Left Through Right ID Total %HV Total %HV Total %HV --- Demand flows in veh/h as used by the program East: New Dundee Road 6T T R R North: Robert Ferrie Drive 7L L R R West: New Dundee Road 5L L T T Unit Time for Volumes = 60 minutes Peak Flow Period = 15 minutes Flow Rates include effects of Flow Scale and Peak Flow Factor Other Model Settings Site:Robert Ferrie-N-New Dundee-Weekday AM 2018 * Basic Parameters: Intersection Type: Driving on the right-hand side of the road Input data specified in Metric units Model Defaults: US HCM (Metric) Peak Flow Period (for performance): 15 minutes Unit time (for volumes): 60 minutes. HCM Delay Model option used HCM Queue Model option used Level of Service based on: Delay (HCM 2000) Queue percentile: 95% Parameters Used in Cost Calculations Site:Robert Ferrie-N-New Dundee-Weekday AM 2018 Pump price of fuel ($/L) = Fuel resource cost factor = 0.70 Ratio of running cost to fuel cost = 3.0 Average income ($/h) = Time value factor = 0.40 Light vehicle mass (1000 kg) = 1.4 Heavy vehicle mass (1000 kg) = 11.0 Light vehicle idle fuel rate (L/h) = Heavy vehicle idle fuel rate (L/h) = Diagnostics Site:Robert Ferrie-N-New Dundee-Weekday AM 2018 Geometric delay is less than 2 seconds for some movements. The negotiation speed may be too high or the approach and exit speeds may be too low for given geometric design (e.g. for a large roundabout). Check Detailed Output for geometric delay data including negotiation speeds.
394 Page 11 of /09/29 If necessary, specify appropriate values of approach and exit speeds, negotiation radius or negotiation speed data in the Path Data dialog. Processed: September 28, :51:48 PM Copyright Akcelik and Associates Pty Ltd SIDRA INTERSECTION Project: H:\DATA\ Transportation Planning\Working\Strasburg Road\SIDRA Files\PC\Robert Ferrie Drive and New Dundee Road Op 1.sip , SNC-LAVALIN INC, SINGLE
395 Page 1 of /09/29 DETAILED OUTPUT Robert Ferrie Drive and New Dundee Road Option 1 Robert Ferrie-N-New Dundee- Weekday PM 2018 OUTPUT TABLE LINKS s Basic Parameters Gap Acceptance Parameters Movements Movement Capacity Parameters Movement Performance Fuel Consumption, Emissions and Cost (Total) Fuel Consumption, Emissions and Cost (Rate) Intersection Negotiation Data Movement Speeds and Geometric Delay Lanes Lane Performance Lane Flow and Capacity Information Lane, Approach and Intersection Performance Driver Characteristics Lane Delays Lane Queues (Vehicles) Lane Queues (Distance) Lane Queue Percentiles (Vehicles) Lane Queue Percentiles (Distance) Lane Stops Flow Rates and Demand Analysis Movement Definitions and Flow Rates (O-D) Flow Rates (Separate Light and Heavy Vehicles) Flow Rates (Total Vehicles and Percent Heavy) Other Model Settings Parameters Used in Cost Calculations Diagnostics s Basic Parameters Site:Robert Ferrie-N-New Dundee-Weekday PM Circulating/Exiting Stream Cent Circ Insc Ent Ent Cir Ent Av.Ent Island Width Diam. Rad Ang Lan Lan Lane Flow %HV Adjust. %Exit Cap. O-D Diam Width Flow Incl. Constr. Factor m m m m deg m veh/h pcu/h Effect East: New Dundee Road Environment Factor: 1.20 Entry/Circulating Flow Adjustment: Medium N North: Robert Ferrie Drive Environment Factor: 1.20 Entry/Circulating Flow Adjustment: Medium N West: New Dundee Road Environment Factor: 1.20 Entry/Circulating Flow Adjustment: Medium N 0.987
396 Page 2 of /09/ Capacity Model: SIDRA Standard HV Method for Gap Acceptance: Include HV Effect for all percentages Gap Acceptance Parameters Site:Robert Ferrie-N-New Dundee-Weekday PM Turn Lane Lane ---- Circulating/Exiting Stream --- Critical Gap No. Type Flow Aver Aver In-Bnch Prop Foll-up Rate Speed Dist Headway Bunched Hdwy Dist Headway pcu/h km/h m sec sec m sec East: New Dundee Road Environment Factor: 1.20 Entry/Circulating Flow Adjustment: Medium Thru 1 Subdominant Dominant Right 2 Dominant North: Robert Ferrie Drive Environment Factor: 1.20 Entry/Circulating Flow Adjustment: Medium Left 1 Dominant Right 1 Dominant West: New Dundee Road Environment Factor: 1.20 Entry/Circulating Flow Adjustment: Medium Left 1 Subdominant Thru 1 Subdominant Dominant Capacity Model: SIDRA Standard P Priority sharing is implied for some movements (Follow-up Headway plus Intra-bunch Headway is larger than the Critical Gap). The O-D Factor ( Basic Parameters table) allows for priority sharing and priority emphasis. Dist (Distance): Spacing, i.e. distance between the front ends of two successive vehicles across all lanes in the circulating or exiting stream Movements Movement Capacity Parameters Site:Robert Ferrie-N-New Dundee-Weekday PM Mov Opposing Movement Total Prac. Prac. Lane Deg. ID Demand Adjust. Cap. Deg. Spare Util Satn Flow HV Flow HV Flow Satn Cap. veh/h % veh/h % pcu/h veh/h xp % % x East: New Dundee Road 6T T * 6R R * North: Robert Ferrie Drive 7L L R R West: New Dundee Road 5L L T T * Maximum degree of saturation
397 Page 3 of /09/29 Movement Performance Site:Robert Ferrie-N-New Dundee-Weekday PM Mov Total Total Aver. Eff. Total Perf. Tot.Trav. Tot.Trav. Aver. ID Delay Delay Delay Stop Stops Index Distance Time Speed (veh-h/h)(pers-h/h)(sec) Rate (veh-km/h)(veh-h/h) (km/h) East: New Dundee Road 6T T R R North: Robert Ferrie Drive 7L L R R West: New Dundee Road 5L L T T Fuel Consumption, Emissions and Cost (Total) Site:Robert Ferrie-N-New Dundee-Weekday PM 2018 Mov Cost Fuel CO2 CO HC NOX ID Total Total Total Total Total Total $/h L/h kg/h kg/h kg/h kg/h East: New Dundee Road 6T T R R North: Robert Ferrie Drive 7L L R R West: New Dundee Road 5L L T T INTERSECTION: Fuel Consumption, Emissions and Cost (Rate) Site:Robert Ferrie-N-New Dundee-Weekday PM 2018 Mov Cost Fuel CO2 CO HC NOX ID Rate Rate Rate Rate Rate Rate $/km L/100km g/km g/km g/km g/km East: New Dundee Road 6T T R R
398 Page 4 of /09/29 North: Robert Ferrie Drive 7L L R R West: New Dundee Road 5L L T T INTERSECTION: Intersection Negotiation Data Site:Robert Ferrie-N-New Dundee-Weekday PM Negn Negn Negn Appr. Downstream Distance From To Radius Speed Dist. Dist Approach Approach Turn m km/h m m m User Spec? East: New Dundee Road North Right No West Thru No North: Robert Ferrie Drive East Left No West Right No West: New Dundee Road East Thru No North Left No Maximum Negotiation (Design) Speed = 50.0 km/h Downstream distance is distance travelled from the stopline until exit cruise speed is reached (includes negotiation distance). Acceleration distance is weighted for light and heavy vehicles. The same distance applies for both stopped and unstopped vehicles. Movement Speeds and Geometric Delay Site:Robert Ferrie-N-New Dundee-Weekday PM Queue Move-up App. Speeds Exit Speeds Av. Section Spd Geom Mov st 2nd Delay ID Cruise Negn Negn Cruise Grn Grn Running Overall sec East: New Dundee Road 6T T R R North: Robert Ferrie Drive 7L L R R West: New Dundee Road 5L L T T "Running Speed" is the average speed excluding stopped periods. HCM Delay Formula option used: Geometric Delay is not included in Control Delay.
399 Page 5 of /09/29 Lanes Lane Performance Site:Robert Ferrie-N-New Dundee-Weekday PM 2018 Q u e u e Flow Cap Deg. Aver. Eff. 95% Back Lane Lane Satn Delay Stop Length No. veh/h veh/h x sec Rate veh m m East: New Dundee Road 1 T TR North: Robert Ferrie Drive 1 LR West: New Dundee Road 1 LT T Lane Flow and Capacity Information Site:Robert Ferrie-N-New Dundee-Weekday PM Lane Dem Flow (veh/h) Min Tot Deg. Lane No Cap Cap Satn Util Lef Thru Rig Tot veh/h veh/h x % East: New Dundee Road 1 T TR North: Robert Ferrie Drive 1 LR West: New Dundee Road 1 LT T The capacity value for priority and continuous movements is obtained by adjusting the basic saturation flow for heavy vehicle and turning vehicle effects. Saturation flow scale applies if specified. Lane, Approach and Intersection Performance Site:Robert Ferrie-N-New Dundee-Weekday PM Lane Demand Flow (veh/h) Adj. Eff Grn Deg Aver. Longest Shrt No %HV Basic (sec) Sat Delay Queue Lane L T R Tot Satf. 1st 2nd x sec m m East: New Dundee Road 1 T TR
400 Page 6 of /09/ North: Robert Ferrie Drive 1 LR West: New Dundee Road 1 LT T ========================================================================== ALL VEHICLES Total % Max Aver. Max Flow HV X Delay Queue ========================================================================== Peak flow period = 15 minutes. Queue values in this table are 95% queue (metres) Note: Basic Saturation Flows are not adjusted at roundabouts or signcontrolled intersections and apply only to continuous lanes. Driver Characteristics Site:Robert Ferrie-N-New Dundee-Weekday PM Average Driver Lane Satn Satn Satn Satn Queue Response No. Speed Flow Hdwy Spacing Space Time km/h veh/h sec m m sec East: New Dundee Road 1 T TR North: Robert Ferrie Drive 1 LR West: New Dundee Road 1 LT T Saturation Flow and Saturation Headway are derived from follow-up headway. Lane Delays Site:Robert Ferrie-N-New Dundee-Weekday PM Delay (seconds/veh) Deg. Stop-line Delay Acc. Queuing Stopd Lane Satn 1st 2nd Total Dec. Total MvUp (Idle) Geom Control No. x d1 d2 dsl dn dq dqm di dig dic East: New Dundee Road 1 T TR North: Robert Ferrie Drive 1 LR West: New Dundee Road 1 LT T HCM Delay Formula option used: (i) Control Delay does not include Geometric Delay, (ii) Stop-line Delay is treated as being same as Control Delay.
401 Page 7 of /09/29 dsl: Stop-line delay (=d1+d2) dn: Average stop-start delay for all vehicles queued and unqueued dq: Queuing delay (the part of the stop-line delay that includes stopped delay and queue move-up delay) dqm: Queue move-up delay di: Stopped delay (stopped (idling) time at near-zero speed) dig: Geometric delay dic: Intersection control delay (sum of stop-line and geometric delays) Geometric delay is less than 2 seconds for some movements. The negotiation speed may be too high or the approach and exit speeds may be too low for given geometric design (e.g. for a large roundabout). Check Detailed Output for geometric delay data including negotiation speeds. If necessary, specify appropriate values of approach and exit speeds, negotiation radius or negotiation speed data in the Path Data dialog. Lane Queues (Vehicles) Site:Robert Ferrie-N-New Dundee-Weekday PM Deg. Ovrfl. Back of Queue (veh) Queue Prob. P'ile Cyc-Av. Queue Lane Satn Queue Stor. Block Block No. x No Nb1 Nb2 Nb 95% Ratio % % Nc 95% East: New Dundee Road 1 T TR North: Robert Ferrie Drive 1 LR West: New Dundee Road 1 LT T HCM Delay Formula option used: Cycle-Average Queue is calculated using average delay from the HCM equation. (i.e. HCM delays are treated as stop-line delays for this purpose). SIDRA Standard models are used for Back of Queue estimation since HCM only gives Cycle-Average Queues for unsignalised intersections. Lane Queues (Distance) Site:Robert Ferrie-N-New Dundee-Weekday PM Deg. Ovrfl. Back of Queue (m) Queue Prob. P'ile Cyc-Av. Queue Lane Satn Queue Stor. Block Block No. x No Nb1 Nb2 Nb 95% Ratio % % Nc 95% East: New Dundee Road 1 T TR North: Robert Ferrie Drive 1 LR West: New Dundee Road 1 LT T HCM Delay Formula option used: Cycle-Average Queue is calculated using average delay from the HCM equation. (i.e. HCM delays are treated as stop-line delays for this purpose). SIDRA Standard models are used for Back of Queue estimation since HCM only gives Cycle-Average Queues for unsignalised intersections.
402 Page 8 of /09/29 Lane Queue Percentiles (Vehicles) Site:Robert Ferrie-N-New Dundee-Weekday PM Deg. Percentile Back of Queue (veh) Lane Satn No. x 50% 70% 85% 90% 95% 98% East: New Dundee Road 1 T TR North: Robert Ferrie Drive 1 LR West: New Dundee Road 1 LT T SIDRA Standard models are used for Back of Queue estimation since HCM only gives Cycle-Average Queues for unsignalised intersections. Lane Queue Percentiles (Distance) Site:Robert Ferrie-N-New Dundee-Weekday PM Deg. Percentile Back of Queue (metres) Lane Satn No. x 50% 70% 85% 90% 95% 98% East: New Dundee Road 1 T TR North: Robert Ferrie Drive 1 LR West: New Dundee Road 1 LT T SIDRA Standard models are used for Back of Queue estimation since HCM only gives Cycle-Average Queues for unsignalised intersections. Lane Stops Site:Robert Ferrie-N-New Dundee-Weekday PM Queue Total Deg. -- Effective Stop Rate -- Total Move-up Queue Prop. Lane Satn Geom. Overall Stops Rate Move-ups Queued No. x he1 he2 hig h H hqm Hqm pq East: New Dundee Road 1 T TR North: Robert Ferrie Drive 1 LR
403 Page 9 of /09/29 West: New Dundee Road 1 LT T hig is the average value for all movements in a shared lane hqm is average queue move-up rate for all vehicles queued and unqueued Flow Rates and Demand Analysis Movement Definitions and Flow Rates (O-D) Site:Robert Ferrie-N-New Dundee-Weekday PM From To Mov Flow Rate Flow Scale Peak Flow Approach Approach ID Turn LV HV Fixed Var Factor East: New Dundee Road North 6R Right West 6T Thru North: Robert Ferrie Drive East 7L Left West 4R Right West: New Dundee Road East 2T Thru North 5L Left Unit Time for Volumes = 60 minutes Peak Flow Period = 15 minutes Flow Rates include effects of Flow Scale and Peak Flow Factor Flow Rates (Separate Light and Heavy Vehicles) Site:Robert Ferrie-N-New Dundee-Weekday PM 2018 Mov Left Through Right ID LV HV LV HV LV HV Demand flows in veh/h as used by the program East: New Dundee Road 6T T R R North: Robert Ferrie Drive 7L L R R West: New Dundee Road 5L L T T Unit Time for Volumes = 60 minutes Peak Flow Period = 15 minutes Flow Rates include effects of Flow Scale and Peak Flow Factor Flow Rates (Total Vehicles and Percent Heavy) Site:Robert Ferrie-N-New Dundee-Weekday PM 2018
404 Page 10 of /09/ Mov Left Through Right ID Total %HV Total %HV Total %HV --- Demand flows in veh/h as used by the program East: New Dundee Road 6T T R R North: Robert Ferrie Drive 7L L R R West: New Dundee Road 5L L T T Unit Time for Volumes = 60 minutes Peak Flow Period = 15 minutes Flow Rates include effects of Flow Scale and Peak Flow Factor Other Model Settings Site:Robert Ferrie-N-New Dundee-Weekday PM 2018 * Basic Parameters: Intersection Type: Driving on the right-hand side of the road Input data specified in Metric units Model Defaults: US HCM (Metric) Peak Flow Period (for performance): 15 minutes Unit time (for volumes): 60 minutes. HCM Delay Model option used HCM Queue Model option used Level of Service based on: Delay (HCM 2000) Queue percentile: 95% Parameters Used in Cost Calculations Site:Robert Ferrie-N-New Dundee-Weekday PM 2018 Pump price of fuel ($/L) = Fuel resource cost factor = 0.70 Ratio of running cost to fuel cost = 3.0 Average income ($/h) = Time value factor = 0.40 Light vehicle mass (1000 kg) = 1.4 Heavy vehicle mass (1000 kg) = 11.0 Light vehicle idle fuel rate (L/h) = Heavy vehicle idle fuel rate (L/h) = Diagnostics Site:Robert Ferrie-N-New Dundee-Weekday PM 2018 Geometric delay is less than 2 seconds for some movements. The negotiation speed may be too high or the approach and exit speeds may be too low for given geometric design (e.g. for a large roundabout). Check Detailed Output for geometric delay data including negotiation speeds.
405 Page 11 of /09/29 If necessary, specify appropriate values of approach and exit speeds, negotiation radius or negotiation speed data in the Path Data dialog. Processed: September 29, :56:58 AM Copyright Akcelik and Associates Pty Ltd SIDRA INTERSECTION Project: H:\DATA\ Transportation Planning\Working\Strasburg Road\SIDRA Files\PC\Robert Ferrie Drive and New Dundee Road Op 1.sip , SNC-LAVALIN INC, SINGLE
406 Page 1 of /09/29 DETAILED OUTPUT Strasburg Road-N-Robert Ferrie Drive Option 1 Strasburg Road-N-Robert Ferrie Drive-Weekday AM 2018 OUTPUT TABLE LINKS s Basic Parameters Gap Acceptance Parameters Movements Movement Capacity Parameters Movement Performance Fuel Consumption, Emissions and Cost (Total) Fuel Consumption, Emissions and Cost (Rate) Intersection Negotiation Data Movement Speeds and Geometric Delay Lanes Lane Performance Lane Flow and Capacity Information Lane, Approach and Intersection Performance Driver Characteristics Lane Delays Lane Queues (Vehicles) Lane Queues (Distance) Lane Queue Percentiles (Vehicles) Lane Queue Percentiles (Distance) Lane Stops Flow Rates and Demand Analysis Movement Definitions and Flow Rates (O-D) Flow Rates (Separate Light and Heavy Vehicles) Flow Rates (Total Vehicles and Percent Heavy) Other Model Settings Parameters Used in Cost Calculations Diagnostics s Basic Parameters Site:Strasburg Road-N-Robert Ferrie Drive-Weekday AM Circulating/Exiting Stream Cent Circ Insc Ent Ent Cir Ent Av.Ent Island Width Diam. Rad Ang Lan Lan Lane Flow %HV Adjust. %Exit Cap. O-D Diam Width Flow Incl. Constr. Factor m m m m deg m veh/h pcu/h Effect Environment Factor: 1.20 Entry/Circulating Flow Adjustment: Medium N East: Robert Ferrie Drive Environment Factor: 1.20 Entry/Circulating Flow Adjustment: Medium N Environment Factor: 1.20 Entry/Circulating Flow Adjustment: Medium N 0.964
407 Page 2 of /09/ Capacity Model: SIDRA Standard HV Method for Gap Acceptance: Include HV Effect for all percentages Gap Acceptance Parameters Site:Strasburg Road-N-Robert Ferrie Drive-Weekday AM Turn Lane Lane ---- Circulating/Exiting Stream --- Critical Gap No. Type Flow Aver Aver In-Bnch Prop Foll-up Rate Speed Dist Headway Bunched Hdwy Dist Headway pcu/h km/h m sec sec m sec Environment Factor: 1.20 Entry/Circulating Flow Adjustment: Medium Thru 1 Subdominant D 2 Dominant Right 2 Dominant East: Robert Ferrie Drive Environment Factor: 1.20 Entry/Circulating Flow Adjustment: Medium Left 1 Subdominant Right 2 Dominant Environment Factor: 1.20 Entry/Circulating Flow Adjustment: Medium Left 1 Subdominant D Thru 1 Subdominant D 2 Dominant Capacity Model: SIDRA Standard P Priority sharing is implied for some movements (Follow-up Headway plus Intra-bunch Headway is larger than the Critical Gap). The O-D Factor ( Basic Parameters table) allows for priority sharing and priority emphasis. D Subdominant lane follow-up headway was calculated as less than the dominant lane value and was set to the dominant lane value Dist (Distance): Spacing, i.e. distance between the front ends of two successive vehicles across all lanes in the circulating or exiting stream Movements Movement Capacity Parameters Site:Strasburg Road-N-Robert Ferrie Drive-Weekday AM Mov Opposing Movement Total Prac. Prac. Lane Deg. ID Demand Adjust. Cap. Deg. Spare Util Satn Flow HV Flow HV Flow Satn Cap. veh/h % veh/h % pcu/h veh/h xp % % x T T R R East: Robert Ferrie Drive 1L L R R * L L T T * Maximum degree of saturation
408 Page 3 of /09/29 Movement Performance Site:Strasburg Road-N-Robert Ferrie Drive-Weekday AM Mov Total Total Aver. Eff. Total Perf. Tot.Trav. Tot.Trav. Aver. ID Delay Delay Delay Stop Stops Index Distance Time Speed (veh-h/h)(pers-h/h)(sec) Rate (veh-km/h)(veh-h/h) (km/h) T T R R East: Robert Ferrie Drive 1L L R R L L T T Fuel Consumption, Emissions and Cost (Total) Site:Strasburg Road-N-Robert Ferrie Drive-Weekday AM 2018 Mov Cost Fuel CO2 CO HC NOX ID Total Total Total Total Total Total $/h L/h kg/h kg/h kg/h kg/h 8T T R R East: Robert Ferrie Drive 1L L R R L L T T INTERSECTION: Fuel Consumption, Emissions and Cost (Rate) Site:Strasburg Road-N-Robert Ferrie Drive-Weekday AM 2018 Mov Cost Fuel CO2 CO HC NOX ID Rate Rate Rate Rate Rate Rate $/km L/100km g/km g/km g/km g/km 8T T R R
409 Page 4 of /09/ East: Robert Ferrie Drive 1L L R R L L T T INTERSECTION: Intersection Negotiation Data Site:Strasburg Road-N-Robert Ferrie Drive-Weekday AM Negn Negn Negn Appr. Downstream Distance From To Radius Speed Dist. Dist Approach Approach Turn m km/h m m m User Spec? East Right No North Thru No East: Robert Ferrie Drive South Left No North Right No South Thru No East Left No Maximum Negotiation (Design) Speed = 50.0 km/h Downstream distance is distance travelled from the stopline until exit cruise speed is reached (includes negotiation distance). Acceleration distance is weighted for light and heavy vehicles. The same distance applies for both stopped and unstopped vehicles. Movement Speeds and Geometric Delay Site:Strasburg Road-N-Robert Ferrie Drive-Weekday AM Queue Move-up App. Speeds Exit Speeds Av. Section Spd Geom Mov st 2nd Delay ID Cruise Negn Negn Cruise Grn Grn Running Overall sec T T R R East: Robert Ferrie Drive 1L L R R L L T T "Running Speed" is the average speed excluding stopped periods. HCM Delay Formula option used: Geometric Delay is not included in Control Delay.
410 Page 5 of /09/29 Lanes Lane Performance Site:Strasburg Road-N-Robert Ferrie Drive-Weekday AM 2018 Q u e u e Flow Cap Deg. Aver. Eff. 95% Back Lane Lane Satn Delay Stop Length No. veh/h veh/h x sec Rate veh m m 1 T TR East: Robert Ferrie Drive 1 L R T 1 LT T T Short lane due to specification of Turn Bay Lane Flow and Capacity Information Site:Strasburg Road-N-Robert Ferrie Drive-Weekday AM Lane Dem Flow (veh/h) Min Tot Deg. Lane No Cap Cap Satn Util Lef Thru Rig Tot veh/h veh/h x % T TR East: Robert Ferrie Drive 1 L R LT T The capacity value for priority and continuous movements is obtained by adjusting the basic saturation flow for heavy vehicle and turning vehicle effects. Saturation flow scale applies if specified. Lane, Approach and Intersection Performance Site:Strasburg Road-N-Robert Ferrie Drive-Weekday AM Lane Demand Flow (veh/h) Adj. Eff Grn Deg Aver. Longest Shrt No %HV Basic (sec) Sat Delay Queue Lane L T R Tot Satf. 1st 2nd x sec m m
411 Page 6 of /09/29 1 T TR East: Robert Ferrie Drive 1 L R LT T ========================================================================== ALL VEHICLES Total % Max Aver. Max Flow HV X Delay Queue ========================================================================== Peak flow period = 15 minutes. Queue values in this table are 95% queue (metres) Note: Basic Saturation Flows are not adjusted at roundabouts or signcontrolled intersections and apply only to continuous lanes. Driver Characteristics Site:Strasburg Road-N-Robert Ferrie Drive-Weekday AM Average Driver Lane Satn Satn Satn Satn Queue Response No. Speed Flow Hdwy Spacing Space Time km/h veh/h sec m m sec T TR East: Robert Ferrie Drive 1 L R NA - Short Lane LT T Saturation Flow and Saturation Headway are derived from follow-up headway. Lane Delays Site:Strasburg Road-N-Robert Ferrie Drive-Weekday AM Delay (seconds/veh) Deg. Stop-line Delay Acc. Queuing Stopd Lane Satn 1st 2nd Total Dec. Total MvUp (Idle) Geom Control No. x d1 d2 dsl dn dq dqm di dig dic T TR East: Robert Ferrie Drive 1 L R
412 Page 7 of /09/29 1 LT T HCM Delay Formula option used: (i) Control Delay does not include Geometric Delay, (ii) Stop-line Delay is treated as being same as Control Delay. dsl: Stop-line delay (=d1+d2) dn: Average stop-start delay for all vehicles queued and unqueued dq: Queuing delay (the part of the stop-line delay that includes stopped delay and queue move-up delay) dqm: Queue move-up delay di: Stopped delay (stopped (idling) time at near-zero speed) dig: Geometric delay dic: Intersection control delay (sum of stop-line and geometric delays) Lane Queues (Vehicles) Site:Strasburg Road-N-Robert Ferrie Drive-Weekday AM Deg. Ovrfl. Back of Queue (veh) Queue Prob. P'ile Cyc-Av. Queue Lane Satn Queue Stor. Block Block No. x No Nb1 Nb2 Nb 95% Ratio % % Nc 95% T TR East: Robert Ferrie Drive 1 L R LT T HCM Delay Formula option used: Cycle-Average Queue is calculated using average delay from the HCM equation. (i.e. HCM delays are treated as stop-line delays for this purpose). SIDRA Standard models are used for Back of Queue estimation since HCM only gives Cycle-Average Queues for unsignalised intersections. Lane Queues (Distance) Site:Strasburg Road-N-Robert Ferrie Drive-Weekday AM Deg. Ovrfl. Back of Queue (m) Queue Prob. P'ile Cyc-Av. Queue Lane Satn Queue Stor. Block Block No. x No Nb1 Nb2 Nb 95% Ratio % % Nc 95% T TR East: Robert Ferrie Drive 1 L R LT T HCM Delay Formula option used: Cycle-Average Queue is calculated using average delay from the HCM equation. (i.e. HCM delays are treated as stop-line delays for this purpose). SIDRA Standard models are used for Back of Queue estimation since
413 Page 8 of /09/29 HCM only gives Cycle-Average Queues for unsignalised intersections. Lane Queue Percentiles (Vehicles) Site:Strasburg Road-N-Robert Ferrie Drive-Weekday AM Deg. Percentile Back of Queue (veh) Lane Satn No. x 50% 70% 85% 90% 95% 98% T TR East: Robert Ferrie Drive 1 L R LT T SIDRA Standard models are used for Back of Queue estimation since HCM only gives Cycle-Average Queues for unsignalised intersections. Lane Queue Percentiles (Distance) Site:Strasburg Road-N-Robert Ferrie Drive-Weekday AM Deg. Percentile Back of Queue (metres) Lane Satn No. x 50% 70% 85% 90% 95% 98% T TR East: Robert Ferrie Drive 1 L R LT T SIDRA Standard models are used for Back of Queue estimation since HCM only gives Cycle-Average Queues for unsignalised intersections. Lane Stops Site:Strasburg Road-N-Robert Ferrie Drive-Weekday AM Queue Total Deg. -- Effective Stop Rate -- Total Move-up Queue Prop. Lane Satn Geom. Overall Stops Rate Move-ups Queued No. x he1 he2 hig h H hqm Hqm pq T TR
414 Page 9 of /09/ East: Robert Ferrie Drive 1 L R LT T hig is the average value for all movements in a shared lane hqm is average queue move-up rate for all vehicles queued and unqueued Flow Rates and Demand Analysis Movement Definitions and Flow Rates (O-D) Site:Strasburg Road-N-Robert Ferrie Drive-Weekday AM From To Mov Flow Rate Flow Scale Peak Flow Approach Approach ID Turn LV HV Fixed Var Factor East 8R Right North 8T Thru East: Robert Ferrie Drive South 1L Left North 6R Right South 4T Thru East 7L Left Unit Time for Volumes = 60 minutes Peak Flow Period = 15 minutes Flow Rates include effects of Flow Scale and Peak Flow Factor Flow Rates (Separate Light and Heavy Vehicles) Site:Strasburg Road-N-Robert Ferrie Drive-Weekday AM 2018 Mov Left Through Right ID LV HV LV HV LV HV Demand flows in veh/h as used by the program 8T T R R East: Robert Ferrie Drive 1L L R R L L T T Unit Time for Volumes = 60 minutes Peak Flow Period = 15 minutes Flow Rates include effects of Flow Scale and Peak Flow Factor
415 Page 10 of /09/29 Flow Rates (Total Vehicles and Percent Heavy) Site:Strasburg Road-N-Robert Ferrie Drive-Weekday AM Mov Left Through Right ID Total %HV Total %HV Total %HV --- Demand flows in veh/h as used by the program 8T T R R East: Robert Ferrie Drive 1L L R R L L T T Unit Time for Volumes = 60 minutes Peak Flow Period = 15 minutes Flow Rates include effects of Flow Scale and Peak Flow Factor Other Model Settings Site:Strasburg Road-N-Robert Ferrie Drive-Weekday AM 2018 * Basic Parameters: Intersection Type: Driving on the right-hand side of the road Input data specified in Metric units Model Defaults: US HCM (Metric) Peak Flow Period (for performance): 15 minutes Unit time (for volumes): 60 minutes. HCM Delay Model option used HCM Queue Model option used Level of Service based on: Delay (HCM 2000) Queue percentile: 95% Parameters Used in Cost Calculations Site:Strasburg Road-N-Robert Ferrie Drive-Weekday AM 2018 Pump price of fuel ($/L) = Fuel resource cost factor = 0.70 Ratio of running cost to fuel cost = 3.0 Average income ($/h) = Time value factor = 0.40 Light vehicle mass (1000 kg) = 1.4 Heavy vehicle mass (1000 kg) = 11.0 Light vehicle idle fuel rate (L/h) = Heavy vehicle idle fuel rate (L/h) = Diagnostics
416 Page 11 of /09/29 Site:Strasburg Road-N-Robert Ferrie Drive-Weekday AM 2018 Processed: September 28, :58:21 PM Copyright Akcelik and Associates Pty Ltd SIDRA INTERSECTION Project: H:\DATA\ Transportation Planning\Working\Strasburg Road\SIDRA Files\PC\Robert Ferrie Drive and Strasburg Road Op 1.sip , SNC-LAVALIN INC, SINGLE
417 Page 1 of /09/29 DETAILED OUTPUT Strasburg Road-N-Robert Ferrie Drive Option 1 Strasburg Road-N-Robert Ferrie Drive-Weekday PM 2018 OUTPUT TABLE LINKS s Basic Parameters Gap Acceptance Parameters Movements Movement Capacity Parameters Movement Performance Fuel Consumption, Emissions and Cost (Total) Fuel Consumption, Emissions and Cost (Rate) Intersection Negotiation Data Movement Speeds and Geometric Delay Lanes Lane Performance Lane Flow and Capacity Information Lane, Approach and Intersection Performance Driver Characteristics Lane Delays Lane Queues (Vehicles) Lane Queues (Distance) Lane Queue Percentiles (Vehicles) Lane Queue Percentiles (Distance) Lane Stops Flow Rates and Demand Analysis Movement Definitions and Flow Rates (O-D) Flow Rates (Separate Light and Heavy Vehicles) Flow Rates (Total Vehicles and Percent Heavy) Other Model Settings Parameters Used in Cost Calculations Diagnostics s Basic Parameters Site:Strasburg Road-N-Robert Ferrie Drive-Weekday PM Circulating/Exiting Stream Cent Circ Insc Ent Ent Cir Ent Av.Ent Island Width Diam. Rad Ang Lan Lan Lane Flow %HV Adjust. %Exit Cap. O-D Diam Width Flow Incl. Constr. Factor m m m m deg m veh/h pcu/h Effect Environment Factor: 1.20 Entry/Circulating Flow Adjustment: Medium N East: Robert Ferrie Drive Environment Factor: 1.20 Entry/Circulating Flow Adjustment: Medium N Environment Factor: 1.20 Entry/Circulating Flow Adjustment: Medium N 0.971
418 Page 2 of /09/ Capacity Model: SIDRA Standard HV Method for Gap Acceptance: Include HV Effect for all percentages Gap Acceptance Parameters Site:Strasburg Road-N-Robert Ferrie Drive-Weekday PM Turn Lane Lane ---- Circulating/Exiting Stream --- Critical Gap No. Type Flow Aver Aver In-Bnch Prop Foll-up Rate Speed Dist Headway Bunched Hdwy Dist Headway pcu/h km/h m sec sec m sec Environment Factor: 1.20 Entry/Circulating Flow Adjustment: Medium Thru 1 Subdominant D 2 Dominant Right 2 Dominant East: Robert Ferrie Drive Environment Factor: 1.20 Entry/Circulating Flow Adjustment: Medium Left 1 Subdominant Right 2 Dominant Environment Factor: 1.20 Entry/Circulating Flow Adjustment: Medium Left 1 Subdominant Thru 1 Subdominant Dominant Capacity Model: SIDRA Standard P Priority sharing is implied for some movements (Follow-up Headway plus Intra-bunch Headway is larger than the Critical Gap). The O-D Factor ( Basic Parameters table) allows for priority sharing and priority emphasis. D Subdominant lane follow-up headway was calculated as less than the dominant lane value and was set to the dominant lane value Dist (Distance): Spacing, i.e. distance between the front ends of two successive vehicles across all lanes in the circulating or exiting stream Movements Movement Capacity Parameters Site:Strasburg Road-N-Robert Ferrie Drive-Weekday PM Mov Opposing Movement Total Prac. Prac. Lane Deg. ID Demand Adjust. Cap. Deg. Spare Util Satn Flow HV Flow HV Flow Satn Cap. veh/h % veh/h % pcu/h veh/h xp % % x T T R R East: Robert Ferrie Drive 1L L R R L L * 4T T * * Maximum degree of saturation
419 Page 3 of /09/29 Movement Performance Site:Strasburg Road-N-Robert Ferrie Drive-Weekday PM Mov Total Total Aver. Eff. Total Perf. Tot.Trav. Tot.Trav. Aver. ID Delay Delay Delay Stop Stops Index Distance Time Speed (veh-h/h)(pers-h/h)(sec) Rate (veh-km/h)(veh-h/h) (km/h) T T R R East: Robert Ferrie Drive 1L L R R L L T T Fuel Consumption, Emissions and Cost (Total) Site:Strasburg Road-N-Robert Ferrie Drive-Weekday PM 2018 Mov Cost Fuel CO2 CO HC NOX ID Total Total Total Total Total Total $/h L/h kg/h kg/h kg/h kg/h 8T T R R East: Robert Ferrie Drive 1L L R R L L T T INTERSECTION: Fuel Consumption, Emissions and Cost (Rate) Site:Strasburg Road-N-Robert Ferrie Drive-Weekday PM 2018 Mov Cost Fuel CO2 CO HC NOX ID Rate Rate Rate Rate Rate Rate $/km L/100km g/km g/km g/km g/km 8T T R R
420 Page 4 of /09/ East: Robert Ferrie Drive 1L L R R L L T T INTERSECTION: Intersection Negotiation Data Site:Strasburg Road-N-Robert Ferrie Drive-Weekday PM Negn Negn Negn Appr. Downstream Distance From To Radius Speed Dist. Dist Approach Approach Turn m km/h m m m User Spec? East Right No North Thru No East: Robert Ferrie Drive South Left No North Right No South Thru No East Left No Maximum Negotiation (Design) Speed = 50.0 km/h Downstream distance is distance travelled from the stopline until exit cruise speed is reached (includes negotiation distance). Acceleration distance is weighted for light and heavy vehicles. The same distance applies for both stopped and unstopped vehicles. Movement Speeds and Geometric Delay Site:Strasburg Road-N-Robert Ferrie Drive-Weekday PM Queue Move-up App. Speeds Exit Speeds Av. Section Spd Geom Mov st 2nd Delay ID Cruise Negn Negn Cruise Grn Grn Running Overall sec T T R R East: Robert Ferrie Drive 1L L R R L L T T "Running Speed" is the average speed excluding stopped periods. HCM Delay Formula option used: Geometric Delay is not included in Control Delay.
421 Page 5 of /09/29 Lanes Lane Performance Site:Strasburg Road-N-Robert Ferrie Drive-Weekday PM 2018 Q u e u e Flow Cap Deg. Aver. Eff. 95% Back Lane Lane Satn Delay Stop Length No. veh/h veh/h x sec Rate veh m m 1 T TR East: Robert Ferrie Drive 1 L R T 1 LT T T Short lane due to specification of Turn Bay Lane Flow and Capacity Information Site:Strasburg Road-N-Robert Ferrie Drive-Weekday PM Lane Dem Flow (veh/h) Min Tot Deg. Lane No Cap Cap Satn Util Lef Thru Rig Tot veh/h veh/h x % T TR East: Robert Ferrie Drive 1 L R LT T The capacity value for priority and continuous movements is obtained by adjusting the basic saturation flow for heavy vehicle and turning vehicle effects. Saturation flow scale applies if specified. Lane, Approach and Intersection Performance Site:Strasburg Road-N-Robert Ferrie Drive-Weekday PM Lane Demand Flow (veh/h) Adj. Eff Grn Deg Aver. Longest Shrt No %HV Basic (sec) Sat Delay Queue Lane L T R Tot Satf. 1st 2nd x sec m m
422 Page 6 of /09/29 1 T TR East: Robert Ferrie Drive 1 L R LT T ========================================================================== ALL VEHICLES Total % Max Aver. Max Flow HV X Delay Queue ========================================================================== Peak flow period = 15 minutes. Queue values in this table are 95% queue (metres) Note: Basic Saturation Flows are not adjusted at roundabouts or signcontrolled intersections and apply only to continuous lanes. Driver Characteristics Site:Strasburg Road-N-Robert Ferrie Drive-Weekday PM Average Driver Lane Satn Satn Satn Satn Queue Response No. Speed Flow Hdwy Spacing Space Time km/h veh/h sec m m sec T TR East: Robert Ferrie Drive 1 L R NA - Short Lane LT T Saturation Flow and Saturation Headway are derived from follow-up headway. Lane Delays Site:Strasburg Road-N-Robert Ferrie Drive-Weekday PM Delay (seconds/veh) Deg. Stop-line Delay Acc. Queuing Stopd Lane Satn 1st 2nd Total Dec. Total MvUp (Idle) Geom Control No. x d1 d2 dsl dn dq dqm di dig dic T TR East: Robert Ferrie Drive 1 L R
423 Page 7 of /09/29 1 LT T HCM Delay Formula option used: (i) Control Delay does not include Geometric Delay, (ii) Stop-line Delay is treated as being same as Control Delay. dsl: Stop-line delay (=d1+d2) dn: Average stop-start delay for all vehicles queued and unqueued dq: Queuing delay (the part of the stop-line delay that includes stopped delay and queue move-up delay) dqm: Queue move-up delay di: Stopped delay (stopped (idling) time at near-zero speed) dig: Geometric delay dic: Intersection control delay (sum of stop-line and geometric delays) Lane Queues (Vehicles) Site:Strasburg Road-N-Robert Ferrie Drive-Weekday PM Deg. Ovrfl. Back of Queue (veh) Queue Prob. P'ile Cyc-Av. Queue Lane Satn Queue Stor. Block Block No. x No Nb1 Nb2 Nb 95% Ratio % % Nc 95% T TR East: Robert Ferrie Drive 1 L R LT T HCM Delay Formula option used: Cycle-Average Queue is calculated using average delay from the HCM equation. (i.e. HCM delays are treated as stop-line delays for this purpose). SIDRA Standard models are used for Back of Queue estimation since HCM only gives Cycle-Average Queues for unsignalised intersections. Lane Queues (Distance) Site:Strasburg Road-N-Robert Ferrie Drive-Weekday PM Deg. Ovrfl. Back of Queue (m) Queue Prob. P'ile Cyc-Av. Queue Lane Satn Queue Stor. Block Block No. x No Nb1 Nb2 Nb 95% Ratio % % Nc 95% T TR East: Robert Ferrie Drive 1 L R LT T HCM Delay Formula option used: Cycle-Average Queue is calculated using average delay from the HCM equation. (i.e. HCM delays are treated as stop-line delays for this purpose). SIDRA Standard models are used for Back of Queue estimation since
424 Page 8 of /09/29 HCM only gives Cycle-Average Queues for unsignalised intersections. Lane Queue Percentiles (Vehicles) Site:Strasburg Road-N-Robert Ferrie Drive-Weekday PM Deg. Percentile Back of Queue (veh) Lane Satn No. x 50% 70% 85% 90% 95% 98% T TR East: Robert Ferrie Drive 1 L R LT T SIDRA Standard models are used for Back of Queue estimation since HCM only gives Cycle-Average Queues for unsignalised intersections. Lane Queue Percentiles (Distance) Site:Strasburg Road-N-Robert Ferrie Drive-Weekday PM Deg. Percentile Back of Queue (metres) Lane Satn No. x 50% 70% 85% 90% 95% 98% T TR East: Robert Ferrie Drive 1 L R LT T SIDRA Standard models are used for Back of Queue estimation since HCM only gives Cycle-Average Queues for unsignalised intersections. Lane Stops Site:Strasburg Road-N-Robert Ferrie Drive-Weekday PM Queue Total Deg. -- Effective Stop Rate -- Total Move-up Queue Prop. Lane Satn Geom. Overall Stops Rate Move-ups Queued No. x he1 he2 hig h H hqm Hqm pq T TR
425 Page 9 of /09/ East: Robert Ferrie Drive 1 L R LT T hig is the average value for all movements in a shared lane hqm is average queue move-up rate for all vehicles queued and unqueued Flow Rates and Demand Analysis Movement Definitions and Flow Rates (O-D) Site:Strasburg Road-N-Robert Ferrie Drive-Weekday PM From To Mov Flow Rate Flow Scale Peak Flow Approach Approach ID Turn LV HV Fixed Var Factor East 8R Right North 8T Thru East: Robert Ferrie Drive South 1L Left North 6R Right South 4T Thru East 7L Left Unit Time for Volumes = 60 minutes Peak Flow Period = 15 minutes Flow Rates include effects of Flow Scale and Peak Flow Factor Flow Rates (Separate Light and Heavy Vehicles) Site:Strasburg Road-N-Robert Ferrie Drive-Weekday PM 2018 Mov Left Through Right ID LV HV LV HV LV HV Demand flows in veh/h as used by the program 8T T R R East: Robert Ferrie Drive 1L L R R L L T T Unit Time for Volumes = 60 minutes Peak Flow Period = 15 minutes Flow Rates include effects of Flow Scale and Peak Flow Factor
426 Page 10 of /09/29 Flow Rates (Total Vehicles and Percent Heavy) Site:Strasburg Road-N-Robert Ferrie Drive-Weekday PM Mov Left Through Right ID Total %HV Total %HV Total %HV --- Demand flows in veh/h as used by the program 8T T R R East: Robert Ferrie Drive 1L L R R L L T T Unit Time for Volumes = 60 minutes Peak Flow Period = 15 minutes Flow Rates include effects of Flow Scale and Peak Flow Factor Other Model Settings Site:Strasburg Road-N-Robert Ferrie Drive-Weekday PM 2018 * Basic Parameters: Intersection Type: Driving on the right-hand side of the road Input data specified in Metric units Model Defaults: US HCM (Metric) Peak Flow Period (for performance): 15 minutes Unit time (for volumes): 60 minutes. HCM Delay Model option used HCM Queue Model option used Level of Service based on: Delay (HCM 2000) Queue percentile: 95% Parameters Used in Cost Calculations Site:Strasburg Road-N-Robert Ferrie Drive-Weekday PM 2018 Pump price of fuel ($/L) = Fuel resource cost factor = 0.70 Ratio of running cost to fuel cost = 3.0 Average income ($/h) = Time value factor = 0.40 Light vehicle mass (1000 kg) = 1.4 Heavy vehicle mass (1000 kg) = 11.0 Light vehicle idle fuel rate (L/h) = Heavy vehicle idle fuel rate (L/h) = Diagnostics
427 Page 11 of /09/29 Site:Strasburg Road-N-Robert Ferrie Drive-Weekday PM 2018 Processed: September 28, :58:54 PM Copyright Akcelik and Associates Pty Ltd SIDRA INTERSECTION Project: H:\DATA\ Transportation Planning\Working\Strasburg Road\SIDRA Files\PC\Robert Ferrie Drive and Strasburg Road Op 1.sip , SNC-LAVALIN INC, SINGLE
428 Strasburg Road Extension Rush Meadow Street to New Dundee Road City of Kitchener Alternative Route Study Report Final (Rev 02) APPENDIX C ROAD GEOMETRIC DESIGN FIGURES July 2012
429 ACTIVA HOLDINGS STRASBURG ROAD EXTENSION OPTION 1 PART A PART B (FOR OPTION 1 ALTERNATE ALIGNMENT) ACTIVA HOLDINGS FREURE DEVELOPMENTS LTD. (NORTH LANDS) FREURE DEVELOPMENTS LTD. (SOUTH LANDS) BIEHN DRIVE EXTENSION (FOR OPTION 1 ALTERNATE ALIGNMENT) CITY OF KITCHENER STONEFIELD DEVELOPMENT CORP. NOTE: FUTURE BIEHN DRIVE ALIGNMENT TO THE NORTHEAST SUBJECT TO SEPARATE STUDIES BY OTHERS. HALLMAN CONSTRUCTION LTD. SUNVEST REID LTD. STRASBURG ROAD EXTENSION BASE CASE (ORGINAL O.P. ALIGNMENT) ACTIVA HOLDINGS STAUFFER DRIVE (FOR OPTION 1 ALTERNATE ALIGNMENT) EAST-WEST COLLECTOR EXTENSION NEW DUNDEE ROAD ACTIVA HOLDINGS ROBERT FERRIE DRIVE EXTENSION (ALTERNATE ALIGNMENT) RUTTKOWSKI NOTE: FUTURE ROBERT FERRIE DRIVE ALIGNMENT TO THE EAST SUBJECT TO SEPARATE STUDIES BY OTHERS. STRASBURG ROAD ALTERNATE ROUTE STUDY 07/12
430 Strasburg Road Extension Rush Meadow Street to New Dundee Road City of Kitchener Alternative Route Study Report Final (Rev 02) APPENDIX D VEGETATION COMMUNITY IMPACTS July 2012
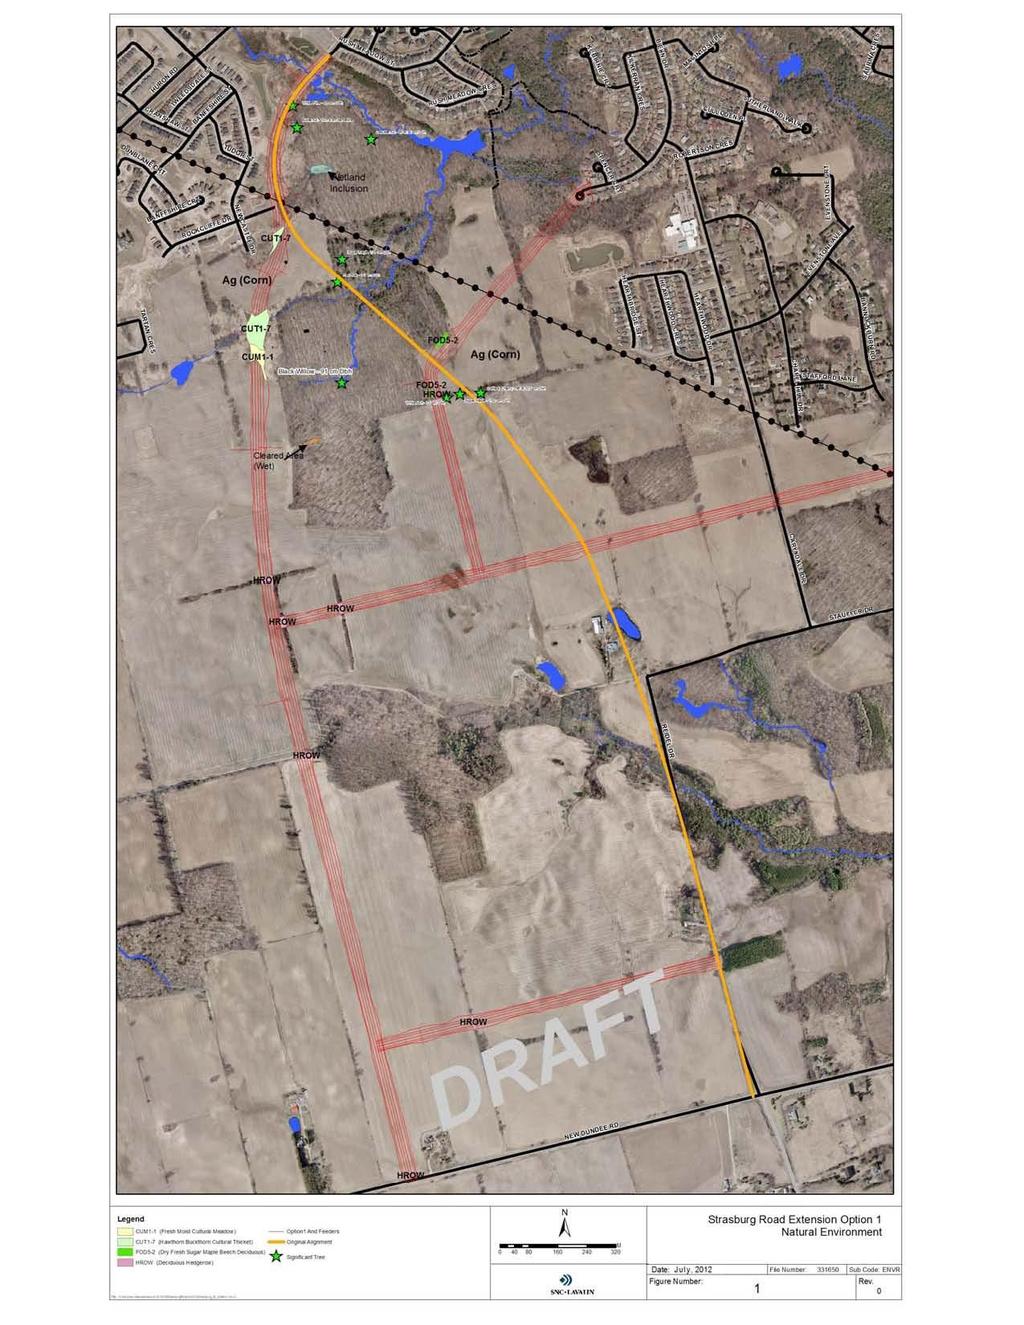
431
ENVIRONMENTAL STUDY REPORT
 Strasburg Road Extension From North of Stauffer Drive To New Dundee Road Class Environmental Assessment ENVIRONMENTAL STUDY REPORT APPENDICES Volume II October 2013 Strasburg Road Extension Environmental
Shannon Noonan, City of Cambridge Don Drackley, IBI Group Scott Johnson, IBI Group PTSL
 100 175 Galaxy Boulevard Toronto ON M9W 0C9 Canada tel 416 679 1930 fax 416 675 4620 ibigroup.com Memorandum To/Attention From cc Shannon Noonan, City of Cambridge Don Drackley, IBI Group Scott Johnson,
Traffic Impact Study Guidelines. City of Guelph
 Traffic Impact Study Guidelines City of Guelph April 2016 Engineering and Capital Infrastructure Services Infrastructure, Development & Enterprise 1 Carden Street Guelph, Ontario Canada N1H 3A1 Page 1
SITE AREA AERIAL PHOTO
 ward consulting group EXHIBIT 1.2 SITE AREA AERIAL PHOTO 168 STREET 164 STREET 32 AVENUE 28 AVENUE 24 AVENUE 160 STREET HIGHWAY 99 156 STREET HIGHWAY 99A PHOTO DATE: YEAR 2004 152 STREET 1480 ward consulting
Transportation and Works Department The Regional Municipality of York Yonge Street Newmarket, Ontario L3Y 6Z1
 TRANSPORTATION IMPACT STUDY (TIS) GUIDELINES FOR DEVELOPMENT APPLICATIONS Transportation and Works Department The Regional Municipality of York 17250 Yonge Street Newmarket, Ontario L3Y 6Z1 August, 2007
UPTOWN TRAFFIC IMPACT ANALYSIS
 UPTOWN TRAFFIC IMPACT ANALYSIS This memorandum summarizes the results of the traffic analysis conducted to evaluate the traffic operations of the intersections along Post Oak Boulevard within Uptown Houston
RE: A Traffic Impact Statement for the Proposed Fall River South Development
 James J. Copeland, P.Eng. GRIFFIN transportation group inc. 30 Bonny View Drive Fall River, NS B2T 1R2 June 20, 2016 Chris Boudreau, P.Eng. Manager Engineering Strum Consulting Railside, 1355 Bedford Highway
The Folded Interchange: An Unconventional Design for the Reconstruction of Cloverleaf Interchanges
 The Folded Interchange: An Unconventional Design for the Reconstruction of Cloverleaf Interchanges I. ABSTRACT Keith A. Riniker, PE, PTOE This paper presents the Folded Interchange design and compares
Traffic Impact Studies
 G U I D E Ministry of Transportation General Guidelines for the Preparation of Traffic Impact Studies L I N E S January 2008 1.0 Introduction: The main purpose of a Traffic Impact Study (TIS) is to demonstrate
ALBION FLATS DEVELOPMENT EXISTING TRAFFIC CONDITIONS AND POTENTIAL IMPACTS
 EXISTING TRAFFIC CONDITIONS AND POTENTIAL IMPACTS FINAL REPORT SEPTEMBER 2010 TABLE OF CONTENTS 1.0 INTRODUCTION 1 2.0 EXISTING TRAFFIC CONDITIONS 2 3.0 FUTURE TRAFFIC CONDITIONS 3 4.0 POTENTIAL IMPACTS
BCEO TRAFFIC IMPACT STUDY GUIDELINES
 BCEO TRAFFIC IMPACT STUDY GUIDELINES February 2006 TABLE OF CONTENTS INTRODUCTION..... i TRAFFIC IMPACT STUDY STRUCTURE... 1 WHEN IS A TRAFFIC IMPACT STUDY NEEDED?..... 1 STUDY AREA, SITE PLAN & HORIZON
CITY OF LETHBRIDGE TRAFFIC IMPACT STUDY GUIDELINES
 CITY OF LETHBRIDGE TRAFFIC IMPACT STUDY GUIDELINES March 2008 0526 TABLE OF CONTENTS Section Contents Page 1.0 INTRODUCTION 1 1.1 Traffic Impact Study 1 1.2 Need and Justification 2 1.3 Purpose of Guidelines
APPENDIX B. Public Works and Development Engineering Services Division Guidelines for Traffic Impact Studies
 APPENDIX B Public Works and Development Engineering Services Division Guidelines for Traffic Impact Studies Revised December 7, 2010 via Resolution # 100991 Reformatted March 18, 2011 TABLE OF CONTENTS
CHAPTER 2: MODELING METHODOLOGY
 CHAPTER 2: MODELING METHODOLOGY 2.1 PROCESS OVERVIEW The methodology used to forecast future conditions consisted of traditional traffic engineering practices and tools with enhancements to more accurately
City of Brantford Chapter 3 TABLE OF CONTENTS
 Chapter 3 The Land Use & Transportation Connection TABLE OF CONTENTS 3.1 THE LAND USE & TRANSPORTATION LINK... 1 3.2 POPULATION & EMPLOYMENT GROWTH FORECASTS... 3 3.2.1 Proposed Places to Grow Plan Forecasts
CITY OF CLOVIS Traffic Impact Study Guidelines
 CITY OF CLOVIS Traffic Impact Study Guidelines CLOVIS, A WAY OF LIFE Approved August 25, 2014 City Council Resolution 2014-79 Prepared by City of Clovis Engineering Division Steve White, City Engineer
Guidelines for the Submission of a Transportation Study Level 2
 Guidelines for the Submission of a Transportation Study Level 2 For Site Development Applications in the City of North Vancouver Transportation Group, City of North Vancouver Engineering, Parks & Environment
RE: A Traffic Impact Statement for a Proposed Mixed-use Development at 400 Windmill Road
 James J. Copeland, P.Eng. GRIFFIN transportation group inc. 30 Bonny View Drive Fall River, NS B2T 1R2 June 27, 2016 Stephanie Nowe-Morris, NSAA LEED AP SNMArchitect Limited 27 DeWolfe Court Bedford, NS
Future Build Alternative Traffic Forecasts and Level of Service Analysis
 4.2.10 Future Build Alternative Traffic Forecasts and Level of Service Analysis For the five Build Alternatives, study intersections within one mile of potential station locations were analyzed, as it
TECHNICAL MEMORANDUM #3
 TECHNICAL MEMORANDUM #3 Date: November 2, 2005 Project #: 6389 To: US 97 & US 20 Refinement Plan Project Management Team (PMT) From: Sonia Hennum, P.E., Andrew Cibor, E.I.T., & Julia Kuhn, P.E. Project:
Woodburn Interchange Project Transportation Technical Report
 Final Report Woodburn Interchange Project Transportation Technical Report Prepared for Oregon Department of Transportation April 212 Prepared by DKS Associates Contents Methodologies... 4 Volume Development...
Appendix C - Highway 400 Widening and Interchange Evaluation Summary Tables
 Highway 400 Improvements from 1 km South of Highway 89 to the Junction of Highway 11 Appendix C - Highway 400 Widening and Interchange Tables Prepared for: Ontario Ministry of Transportation Four General
VIII. LAND USE ISSUES
 VIII. LAND USE ISSUES The & Route 57 Land Use and Circulation Study (Land Use Study, Figure 6) was completed for the Town of Clay in November 1999 (Clough, Harbour & Associates). This study investigated
HALDIMAND COUNTY DESIGN CRITERIA SECTION T TRAFFIC IMPACT STUDY GUIDELINES
 HALDIMAND COUNTY DESIGN CRITERIA SECTION T TRAFFIC IMPACT STUDY GUIDELINES Revised 2015 TRAFFIC IMPACT STUDIES PAGE 1 T 1.00 T 1.01 INTRODUCTION TRAFFIC IMPACT STUDY One of Haldimand County s key objectives
OFFICIAL PLAN AMENDMENT AND SCHEDULE C CLASS ENVIRONMENTAL ASSESSMENT
 ROBERT FERRIE DRIVE OFFICIAL PLAN AMENDMENT AND SCHEDULE C CLASS ENVIRONMENTAL ASSESSMENT Presentation to Planning and Strategic Initiatives Committee June 9 th, 2014 1 Background Official Plan requires
2017 TIGER DISCRETIONARY GRANT APPLICATION
 2017 TIGER DISCRETIONARY GRANT APPLICATION Spokane International Airport Spokane, WA APPENDIX D 2015 Airport Drive Couplet at Spotted Road Airport Drive Couplet at Spotted Road April 2015 Prepared for:
WOO-SR Feasibility Study (PID 90541) Feasibility Study Report April 22, 2011
 Feasibility Study Report April 22, 2011") TABLE OF CONTENTS EXECUTIVE SUMMARY... 1 CHAPTER 1: INTRODUCTION... 5 1.1 Study Purpose and background... 5 1.2 Study Approach... 6 1.3 Study Area... 6 CHAPTER 2: DESCRIPTIONS OF ALTERNATIVES... 7 2.1
TABLE OF CONTENTS EXECUTIVE SUMMARY... 1 CHAPTER 1: INTRODUCTION... 5 1.1 Study Purpose and background... 5 1.2 Study Approach... 6 1.3 Study Area... 6 CHAPTER 2: DESCRIPTIONS OF ALTERNATIVES... 7 2.1
M D 355 [FR E D E R IC K R O A D] OVER
![M D 355 [FR E D E R IC K R O A D] OVER](/thumbs/79/79553721.jpg "M D 355 [FR E D E R IC K R O A D] OVER") M D 355 [FR E D E R IC K R O A D] OVER LITTLE BENNETT CREEK MAINTENANCE OF TRAFFIC ALTERNATIVE ANA LYSIS Prepared by: INTRODUCTION The purpose of this report is to present the results of traffic analyses
M D 355 [FR E D E R IC K R O A D] OVER LITTLE BENNETT CREEK MAINTENANCE OF TRAFFIC ALTERNATIVE ANA LYSIS Prepared by: INTRODUCTION The purpose of this report is to present the results of traffic analyses
GUIDE FOR THE PREPARATION OF TRAFFIC IMPACT STUDIES
 GUIDE FOR THE PREPARATION OF TRAFFIC IMPACT STUDIES Adopted by Town Council on November 25, 2008 Prepared By: HNTB Engineering Department Planning Department TABLE OF CONTENTS I. INTRODUCTION... 1 II.
CHAPTER 5 PARALLEL PARKWAY CORRIDOR IMPROVEMENTS
 HPTER 5 PRLLEL PRKWY ORRIDOR IMPROVEMENTS nother key area within the Village West study area is the Parallel Parkway corridor. This chapter focuses on the segment of Parallel Parkway between 106 th Street
Functional Planning Study Highway 15:06 From Range Road 220 to Highway 830
 Functional Planning Study :06 December 2016 E00311A Executive Summary Strathcona County, as requirement of the roadside development permit from Alberta Transportation for the intersection upgrade of
Traffic Impact Analysis Guidelines. Town of Queen Creek
 Traffic Impact Analysis Guidelines Town of Queen Creek January 2016 1. INTRODUCTION The purpose of this document is to outline the procedures and requirements for preparing a Transportation Impact Analysis
TRANSPORTATION PROJECT REPORT DRAFT CONCEPTUAL ACCESS MODIFICATION PROPOSAL OCTOBER 2002
 TRANSPORTATION INTERSTATE 87 INTERCHANGE 11A TOWN OF MALTA SARATOGA COUNTY, NY DRAFT CONCEPTUAL ACCESS MODIFICATION PROPOSAL OCTOBER 2002 PROJECT REPORT NEW YORK STATE DEPARTMENT OF TRANSPORTATION JOSEPH
TRAFFIC STUDY GUIDELINES
 TRAFFIC STUDY GUIDELINES December 2013 The scope of the traffic impact analysis (TIA) should follow these guidelines and the requirements of VMC 11.80.130 and VMC 11.70, transportation concurrency (attached
6.0 CONGESTION HOT SPOT PROBLEM AND IMPROVEMENT TRAVEL DEMAND MODEL ANALYSIS
 6.0 CONGESTION HOT SPOT PROBLEM AND IMPROVEMENT TRAVEL DEMAND MODEL ANALYSIS 6.1 MODEL RUN SUMMARY NOTEBOOK The Model Run Summary Notebook (under separate cover) provides documentation of the multiple
January 16, Rhode Island Energy Facilities Siting Board 89 Jefferson Boulevard Warwick, Rhode Island 02888
 INVENERGY 196 January 16, 2019 Rhode Island Energy Facilities Siting Board 89 Jefferson Boulevard Warwick, Rhode Island 02888 Re: Clear River Energy Center Invenergy Docket No. SB-2015-06 When Invenergy
Rivers Edge Alternative Urban Areawide Review (AUAR) Traffic Study
 Traffic Study") Appendix F Rivers Edge Alternative Urban Areawide Review (AUAR) Traffic Study Prepared by Westwood Professional Services, Inc. for City of St. Paul Park Grey Cloud Island Township October 14, 2003 Introduction
Appendix F Rivers Edge Alternative Urban Areawide Review (AUAR) Traffic Study Prepared by Westwood Professional Services, Inc. for City of St. Paul Park Grey Cloud Island Township October 14, 2003 Introduction
CITY OF DRAPER TRAFFIC IMPACT STUDY DESIGN GUIDELINES
 CITY OF DRAPER TRAFFIC IMPACT STUDY DESIGN GUIDELINES June 1, 2012 Draper City Traffic Impact Study Guidelines Table of Contents Introduction... 1 Traffic Impact Classification Levels... 1 Analysis Approach
Dated: January 2015 TRANSPORTATION IMPACT STUDY GUIDELINES
 Dated: January 2015 TRANSPORTATION IMPACT STUDY GUIDELINES TABLE OF CONTENTS 1.0 Introduction.. 2 1.1 Transportation Impact Study...... 2 1.2 Need and Justification... 2 1.3 Purpose of Guidelines... 2
INTERCHANGE MODIFICATION REPORT
 INTERSTATE 75 AND STATE ROAD 884 (COLONIAL BOULEVARD) INTERCHANGE LEE COUNTY, FLORIDA INTERCHANGE MODIFICATION REPORT Prepared for: Florida Department of Transportation District One May 2017 Interchange
City of Berkeley. Guidelines for Development of Traffic Impact Reports
 Office of Transportation (OOT) City of Berkeley Guidelines for Development of Traffic Impact Reports Office of Transportation, City of Berkeley 1 1. Overview These guidelines provide a framework to help
3.6 GROUND TRANSPORTATION
 3.6.1 Environmental Setting 3.6.1.1 Area of Influence The area of influence for ground transportation consists of the streets and intersections that could be affected by automobile or truck traffic to
TOWN OF MOORESVILLE TRANSPORTATION IMPACT ANALYSIS PROCEDURES MANUAL TOWN OF MOORESVILLE, NORTH CAROLINA
 TOWN OF MOORESVILLE TRANSPORTATION IMPACT ANALYSIS PROCEDURES MANUAL TOWN OF MOORESVILLE, NORTH CAROLINA Effective August 1, 2007 Amended March 4, 2013, December 1, 2014, May 1, 2017 TOWN OF MOORESVILLE,
4.11 TRANSPORTATION AND CIRCULATION
 4.11 TRANSPORTATION AND CIRCULATION 4.11.1 INTRODUCTION This section addresses the potential for the Proposed Project to impact traffic and circulation. Information in this section is summarized from the
CITY OF LA MESA MIXED-USE OVERLAY ZONE PROJECT La Mesa, California August 15, 2007 Revised January 16, 2008
 TRAFFIC IMPACT STUDY CITY OF LA MESA MIXED-USE OVERLAY ZONE PROJECT La Mesa, California August 15, 2007 Revised January 16, 2008 Prepared for: DUDEK & ASSOCIATES 605 Third Street Encinitas, California
III. ENVIRONMENTAL IMPACT ANALYSIS F. TRAFFIC
 III. ENVIRONMENTAL IMPACT ANALYSIS F. TRAFFIC This section summarizes the traffic impact analysis prepared by Kaku Associates in May, 2002. Detailed calculation worksheets are contained in Appendix D to
RE: A Traffic Impact Statement for the newly proposed Fall River South Development
 James J. Copeland, P.Eng. GRIFFIN transportation group inc. 30 Bonny View Drive Fall River, NS B2T 1R2 May 15, 2018 Chris Boudreau, P.Eng. Manager Engineering Strum Consulting Railside, 1355 Bedford Highway
City of Lake Forest SERRANO SUMMIT (IRWD SITE) Traffic Study. April 2010
 Traffic Study. April 2010") G: Traffic Study City of Lake Forest SERRANO SUMMIT (IRWD SITE) Traffic Study April 2010 Draft City of Lake Forest SERRANO SUMMIT (IRWD SITE) Traffic Study Prepared by: Austin-Foust Associates, Inc. 2223
G: Traffic Study City of Lake Forest SERRANO SUMMIT (IRWD SITE) Traffic Study April 2010 Draft City of Lake Forest SERRANO SUMMIT (IRWD SITE) Traffic Study Prepared by: Austin-Foust Associates, Inc. 2223
FINAL PROJECT PRIORITIZATION PLAN FOR THE NM 599 CORRIDOR
 FINAL PROJECT PRIORITIZATION PLAN FOR THE NM 599 CORRIDOR PROJECT NO. WIP-599-1(102) CONTROL NO. D5SF2 APRIL 2010 Prepared for: New Mexico Department of Transportation Northern Design Bureau P.O. Box 1149
Appendix F: Noise Report
 Appendix F: Noise Report HIGHWAY 404 HIGHWAY 407 TO GREEN LANE (W.O. 03-20024) REGIONAL MUNICIPALITY OF YORK NOISE REPORT Preliminary Design and Class Environmental Assessment Study Class Environmental
The TIS is to be signed and sealed by a Florida Registered Professional Engineer.
 CHAPTER 900. SECTION 901. DEVELOPMENT STANDARDS INFRASTRUCTURE STANDARDS 901.5. Transportation Impact Study A. Intent and Purpose The intent and purpose of the Traffic Impact Study (TIS) is to identify
TRANSPORTATION IMP ACT MITIGATION FEE (TIMF) NEXUS S TUDY
 NEXUS S TUDY") COUNCIL OF S AN BENITO COUNTY GOVERNMENTS TRANSPORTATION IMP ACT MITIGATION FEE (TIMF) NEXUS S TUDY FINAL REPORT MARCH 21, 2011 ii Table of Contents EXECUTIVE SUMMARY... 1 Study Objectives 1 Projects Included
COUNCIL OF S AN BENITO COUNTY GOVERNMENTS TRANSPORTATION IMP ACT MITIGATION FEE (TIMF) NEXUS S TUDY FINAL REPORT MARCH 21, 2011 ii Table of Contents EXECUTIVE SUMMARY... 1 Study Objectives 1 Projects Included
TRAFFIC IMPACT ASSESSMENT GUIDELINE
 Ministry of Public Infrastructure & Land Transport [Land Transport Division] TRAFFIC IMPACT ASSESSMENT GUIDELINE Traffic Management and Road Safety Unit Samlo Tower Aurelle Feillafe Street Port Louis Tel:
I 75 PD&E STUDIES TABLE OF CONTENTS DTTM, TECHNICAL REPORT No. 2 TABLE OF CONTENTS
 TABLE OF CONTENTS DTTM, TECHNICAL REPORT No. 2 TABLE OF CONTENTS SECTION PAGE NO. SECTION TITLE NO. EXECUTIVE SUMMARY -------------------------------------------------------------------- ES-1 1.0 INTRODUCTION
Appendix G: Travel Demand Model Documentation
 Appendix G: Travel Demand Model Documentation Skagit Council of Governments TRAVEL DEMAND MODEL DOCUMENTATION August 2015 Prepared by: 11730 118 th Avenue NE, Suite 600 Kirkland, WA 98034-7120 Phone: 425-821-3665
MEMORANDUM. Date: July 14, 2006 Project #: To: US 97 & US 20 Refinement Plan Steering Committee
 MEMORANDUM Date: July 14, 2006 Project #: 6389 To: US 97 & US 20 Refinement Plan Steering Committee From: Sonia Hennum, P.E., Andrew Cibor, E.I.T., & Julia Kuhn, P.E. Project: US 97 & US 20 Refinement
Article 16 Traffic Impact Analysis
 Article 16 Traffic Impact Analysis Table of Contents... 16-1 Chapter 16.1 Purpose and Intent... 16-2 Chapter 16.2 Applicability... 16-2 Chapter 16.3 Exemptions... 16-2 Chapter 16.4 Trip Generation Data...
CITY OF THOROLD GUIDELINES FOR TRANSPORTATION IMPACT STUDIES
 CITY OF THOROLD GUIDELINES FOR TRANSPORTATION IMPACT STUDIES MARCH 2018 Table of Contents 1 Introduction... 3 1.1 Purpose of a Transportation Impact Study... 3 2 General Study Requirements... 4 2.1 Need
Demand Reduction Assumptions Used For Travel Demand Analysis of EIS Alternatives
 M E M O R A N D U M Demand Reduction Assumptions Used For Travel Demand Analysis of EIS Alternatives TO: FROM: Project Management Team Steve Perone/PTV America DATE: Revised: February 6, 2009 Background
MOBILITY AND ALTERNATIVES ANALYSIS
 6 MOBILITY AND ALTERNATIVES ANALYSIS BACK OF SECTION DIVIDER 6.0 Mobility and Alternatives Analysis Travel demand analysis provides a framework for the identification of transportation facilities and services
Calibration of a Micro-Simulation Model in a Large Urban Network
 in a Large Urban Network Timothy Oketch, Ph.D., P. Eng., Director, TIMCON Associates, 37 Portelli Crescent, Ajax, Ontario, LZ1 0C4, Email: TOketch@timcon.net, http://www.timcon.net (formerly Senior Project
CITY OF MARIANNA MUNICIPAL DEVELOPMENT DEPARTMENT Post Office Box 936 Marianna, FL (850)
") CITY OF MARIANNA MUNICIPAL DEVELOPMENT DEPARTMENT Post Office Box 936 Marianna, FL 32447 (850) 482-2786 TRANSPORTATION CONCURRENCY ANALYSIS CITY OF MARIANNA CONCURRENCY MANAGEMENT SYSTEM (CMS) This form
CITY OF MARIANNA MUNICIPAL DEVELOPMENT DEPARTMENT Post Office Box 936 Marianna, FL 32447 (850) 482-2786 TRANSPORTATION CONCURRENCY ANALYSIS CITY OF MARIANNA CONCURRENCY MANAGEMENT SYSTEM (CMS) This form
FOR INTERSTATE 81 AND ROUTE 37 INTERCHANGE FREDERICK COUNTY, VIRGINIA MILEPOST 310
 INTERCHANGE MODIFICATION REPORT FOR INTERSTATE 81 AND ROUTE 37 INTERCHANGE FREDERICK COUNTY, VIRGINIA MILEPOST 310 PREPARED BY: VIRGINIA DEPARTMENT OF TRANSPORTATION STAUNTON DISTRICT DECEMBER 13, 2006
Transportation Model Report
 1. Introduction The traffic impacts of the future developments in the IL130/High Cross Road corridor for different scenarios were analyzed using a Travel Demand Model (TDM). A four step modeling process
LAS VEGAS STREET RAILROAD CROSSING RR/PUC CONNECTION AND PRELIMINARY DESIGN
 LAS VEGAS STREET RAILROAD CROSSING RR/PUC CONNECTION AND PRELIMINARY DESIGN Prepared for: City of Colorado Springs Prepared by: Felsburg Holt & Ullevig 508 South Tejon Street Colorado Springs, CO 80903
MULTIMODAL TRANSPORTATION IMPACT STUDY GUIDELINES
 MULTIMODAL TRANSPORTATION IMPACT STUDY GUIDELINES 1 st Edition City of San Luis Obispo 2035 Circulation Element 1 Table of Contents Introduction... 2 Process... 2 When Impact Studies Are Required... 3
CITY OF VALLEJO PUBLIC WORKS DEPARTMENT TRAFFIC IMPACT Analysis/Study GUIDELINES
 The City Engineer, under the authority of the Public Works Director and recommendations from the Traffic Engineer, will make the final decision on the need for a traffic study. The purpose of the traffic
NORTHWEST CORRIDOR PROJECT. NOISE TECHNICAL REPORT 2015 Addendum Phase IV
 Noise Technical Report 2015 Addendum NOISE TECHNICAL REPORT 2015 Addendum PREPARED FOR: Federal Highway Administration and Georgia Department of Transportation PREPARED BY: Parsons Brinckerhoff Project
DRAFT. SR-60 7 th Avenue Intersection Control Evaluation (ICE) I-605 Corridor Improvement Project (CIP) I-605/SR-60 EA# 3101U0
 I-605 Corridor Improvement Project (CIP) I-605/SR-60 EA# 3101U0") SR-60 7 th Avenue Intersection Control Evaluation (ICE) I-605/SR-60 EA# 3101U0 October 9, 2017 Contents 1 Purpose of ICE Memo... 1 2 Background... 1 3 Existing Interchange Deficiencies... 1 4 Context Sensitive
SR-60 7 th Avenue Intersection Control Evaluation (ICE) I-605/SR-60 EA# 3101U0 October 9, 2017 Contents 1 Purpose of ICE Memo... 1 2 Background... 1 3 Existing Interchange Deficiencies... 1 4 Context Sensitive
Database and Travel Demand Model
 Database and Travel Demand Model 7 The CMP legislation requires every CMA, in consultation with the regional transportation planning agency (the Metropolitan Transportation Commission (MTC) in the Bay
9. TRAVEL FORECAST MODEL DEVELOPMENT
 9. TRAVEL FORECAST MODEL DEVELOPMENT To examine the existing transportation system and accurately predict impacts of future growth, a travel demand model is necessary. A travel demand model is a computer
Quantifying the performance of a traffic data collection system: Scout Connect match rate evaluation
 Technology Showcase Miovision Scout Quantifying the performance of a traffic data collection system: Scout Connect match rate evaluation Contents Executive summary 2 Elements of the study 2 Objectives
CITY OF SARNIA TRANSPORTATION MASTER PLAN: TRANSPORTATION IMPACT STUDY GUIDELINES
 CITY OF SARNIA TRANSPORTATION MASTER PLAN: TRANSPORTATION IMPACT STUDY GUIDELINES REPORT JULY 2013 I B I G R O U P R E P O R T TABLE OF CONTENTS 1. INTRODUCTION... 1 1.1 Why is a Transportation Impact
APPENDIX D. Glossary D-1
 APPENDIX D Glossary D-1 Glossary of Transportation Planning Terms ANNUAL AVERAGE DAILY TRAFFIC (AADT): The total number of vehicles passing a given location on a roadway over the course of one year, divided
TRANSPORTATION DEMAND FORECASTING INFORMATION SESSION
 GTA WEST CORRIDOR PLANNING AND EA STUDY-STAGE STAGE 1 TRANSPORTATION DEMAND FORECASTING INFORMATION SESSION JUNE 2008 Topics for this Session 1. The Challenge of Growth 2. Overview of GTAW Study 3. The
RESOLUTION NO
 RESOLUTION NO. 2017- A RESOLUTION OF THE BOARD OF COUNTY COMMISSIONERS OF SARASOTA COUNTY, FLORIDA PROVIDING FINDINGS OF FACT; ESTABLISHING A UNIFORM METHODOLOGY FOR MULTIMODAL MOBILITY ANALYSES ; AND
PORT OF FERNANDINA TRUCK CIRCULATION STUDY
 OCTOBER 2015 PREPARED FOR: I. Introduction... 1 II. Study Area... 1 III. Field Data Collection... 3 IV. Existing Traffic... 5 V. Truck Circulation Analysis... 8 VI. Peak Hour Intersection Analysis... 10
TRAFFIC IMPACT STATEMENT SOUTHERN WASTEWATER TREATMENT WORKS
 TRAFFIC IMPACT STATEMENT SOUTHERN WASTEWATER TREATMENT WORKS MARCH 2015 Prepared by: Royal HaskoningDHV (Pty) Ltd RHDHV Pinetown 6 Payne Street Pinetown 3610 VERIFICATION PAGE PROJECT NAME: Traffic Impact
Chapter 3: Growth Forecasts and Model Assumptions
 Chapter 3: Growth Forecasts and Model Assumptions A. Introduction A new transportation demand model was created in 2008 as part of the analysis that is the foundation of this plan. The City s transportation
TABLE OF CONTENTS TABLE OF CONTENTS... I APPENDICES... III LIST OF EXHIBITS... V LIST OF TABLES... VII LIST OF ABBREVIATED TERMS...
 Amendment No. 2 to Reclamation Plan 2006-01 Traffic Impact Analysis TABLE OF CONTENTS TABLE OF CONTENTS... I APPENDICES... III LIST OF EXHIBITS... V LIST OF TABLES... VII LIST OF ABBREVIATED TERMS... IX
Crawford Drive and Harper Road Class Environmental Assessment
 Crawford Drive and Harper Road Class Environmental Assessment Project#: P-06-11 FINAL N O V E M E B E R 2 0 1 2 ENVIROMENTAL FILE REPORT GENIVAR Inc. 600 Cochrane Drive, 5th Floor, Markham, Ontario L3R
Traffic Impact Study Requirements
 [TYPE THE COMPANY NAME] Traffic Impact Study Requirements County of San Mateo Department of Public Works Roadway Services 9/1/2013 I. Introduction The County of San Mateo (County), Department of Public
SOUTHWEST LRT (METRO GREEN LINE EXTENSION)
") 8 Evaluation of Alternatives This chapter evaluates the effectiveness of the No Build Alternative and the Southwest Light Rail Transit (LRT) Project (the Project) based on the information contained in
8 Evaluation of Alternatives This chapter evaluates the effectiveness of the No Build Alternative and the Southwest Light Rail Transit (LRT) Project (the Project) based on the information contained in
PEER REVIEW FOR TRANSPORTATION ASSESSMENT ZONING APPLICATION REVIEW
 PEER REVIEW FOR TRANSPORTATION ASSESSMENT ZONING APPLICATION REVIEW REPORT MARCH 2011 I B I G R O U P R E P O R T TABLE OF CONTENTS 1. INTRODUCTION... 1 2. SYNOPSIS OF APPLICANT S ASSESSMENT... 1 2.1 Transportation
APPENDIX 4 TRANSPORTATION IMPACT ASSESSMENT GUIDELINES. IBI GROUP REPORT TRANSPORTATION MASTER PLAN UPDATE Submitted to The City of Brantford
 IBI GROUP REPORT TRANSPORTATION MASTER PLAN UPDATE Submitted to The City of Brantford APPENDIX 4 TRANSPORTATION IMPACT ASSESSMENT GUIDELINES July 2014 1 City of Brantford DRAFT REPORT JUNE 2014 I B I
4. ENVIRONMENTAL IMPACT ANALYSIS 11. TRANSPORTATION AND CIRCULATION 1. TRAFFIC
 4. EVIROMETAL IMPACT AALYSIS 11. TRASPORTATIO AD CIRCULATIO 1. TRAFFIC 1. ITRODUCTIO The following section summarizes the information provided in the Traffic Impact Study, SMC Malibu Satellite Campus Project,
22 September 2016 OUR REF:
 22 September 2016 OUR REF: 602263-01000 Huntington Properties 878 Boyd Avenue Ottawa, ON K2A 2E3 Attention: Lisa Westphal Dear Lisa: Re: 30 Highbury Park Transportation Impact Study Addendum #1 This Addendum
SECTION VII TRAFFIC IMPACT ANALYSIS GUIDELINES
 SECTION VII TRAFFIC IMPACT ANALYSIS GUIDELINES A. GENERAL Traffic Impact Analyses (TIAs) are tools that have historically been utilized to evaluate the interaction between existing transportation infrastructures
Consideration of a Diverging Diamond Interchange in Saskatchewan. Paul H. A. Steel, Project Manager, M. Eng., P.Eng., Tetra Tech EBA Inc.
 Consideration of a Diverging Diamond Interchange in Saskatchewan Paul H. A. Steel, Project Manager, M. Eng., P.Eng., Tetra Tech EBA Inc. Terry Schmidt, P.Eng., MBA, Senior Project Director, Tetra Tech
Vicinity Map. Interstate 605 (I-605) and State Route 91 (SR-91) in Los Angeles County
 and State Route 91 (SR-91) in Los Angeles County") 07 - LA - 605 - PM 2.87/PM 6.36 07 - LA - 91 - PM 14.10/PM 19.81 Vicinity Map N On Routes Interstate 605 (I-605) and State Route 91 (SR-91) in Los Angeles County I-605 between Excelsior Dr UC (PM 6.36)
07 - LA - 605 - PM 2.87/PM 6.36 07 - LA - 91 - PM 14.10/PM 19.81 Vicinity Map N On Routes Interstate 605 (I-605) and State Route 91 (SR-91) in Los Angeles County I-605 between Excelsior Dr UC (PM 6.36)
McTAVISH ROAD INTERCHANGE A ROUNDABOUT SOLUTION. Tim Blackburn, P.Eng., Urban Systems Ltd.
 McTAVISH ROAD INTERCHANGE A ROUNDABOUT SOLUTION Tim Blackburn, P.Eng., Urban Systems Ltd. Jose Pinto, P.Eng., P.T.O.E., McElhanney Consulting Services Ltd. Paper Prepared for Presentation at the Innovation
Transit Service Guidelines
 G R E AT E R VA N CO U V E R T R A N S P O RTAT I O N A U T H O R I T Y Transit Service Guidelines PUBLIC SUMMARY REPORT JUNE 2004 Greater Vancouver Transportation Authority TRANSIT SERVICE GUIDELINES
APPENDIX H: TRAVEL DEMAND MODEL VALIDATION AND ANALYSIS
 APPENDIX H: TRAVEL DEMAND MODEL VALIDATION AND ANALYSIS Travel demand models (TDM) simulate current travel conditions and forecast future travel patterns and conditions based on planned system improvements
Environmental Consequences and Mitigation
 Chapter 4 Environmental Consequences and Mitigation 4.1 Introduction This chapter provides a detailed description of the impacts (and indirect impacts where applicable) associated with the alternatives
Town of Lakeshore TRANSPORTATION IMPACT STUDY GUIDELINES
 FEBRUARY 2010 TABLE OF CONTENTS 1. INTRODUCTION... 1 1.1 Why is a Transportation Impact Study Required?... 1 1.2 Applicability... 1 1.3 Acknowledgement of Responsibility... 2 2. TIS REQUIREMENTS AND SCOPE...
Appendix B Highway 407 Interchange Review - Cochrane Street Area
 Appendix B Highway 407 Interchange Review - Cochrane Street Area AECOM 300 ater Street hitby, ON, Canada L1N 9J2 www.aecom.com Memorandum To Michael May, P.Eng., Town of hitby Page 1 CC Subject Greg Hardy,
DIVISION I TRAFFIC IMPACT STUDY GUIDELINES ENGINEERING STANDARDS
 CITY OF ALBANY DEPARTMENT OF PUBLIC WORKS DIVISION I TRAFFIC IMPACT STUDY GUIDELINES ENGINEERING STANDARDS Prepared By PUBLIC WORKS DEPARTMENT ALBANY, OREGON 97321 Telephone: (541) 917-7676 TABLE OF CONTENTS
Recommended Roadway Plan Section 3 Existing Facilities & System Performance
 Recommended Roadway Plan Section 3 Existing Facilities & System Performance RECOMMENDED ROADWAY PLAN SECTION 3 Existing Facilities and System Performance 3.1 Introduction An important prerequisite to transportation
DEVELOPMENT, ANALYSIS, AND DESIGN OF A NEW PARKWAY AT GRADE INTERSECTION (PAGI)
") 2013 ITE Western District Annual Meeting COCEPT DEVELOPMET, AALYSIS, AD DESIG OF A EW PARKWAY AT GRADE ITERSECTIO (PAGI) Lead Author: James M. Witkowski, PhD Supporting Author: Darrell Truitt, PE The Pima
2013 ITE Western District Annual Meeting COCEPT DEVELOPMET, AALYSIS, AD DESIG OF A EW PARKWAY AT GRADE ITERSECTIO (PAGI) Lead Author: James M. Witkowski, PhD Supporting Author: Darrell Truitt, PE The Pima
City of Menifee. Public Works Department. Traffic Impact Analysis Guidelines
 Public Works Department Traffic Impact Analysis Guidelines Revised: August 2015 TABLE OF CONTENTS INTRODUCTION... 3 PURPOSE... 3 EXEMPTIONS... 3 SCOPING... 4 METHODOLOGY... 5 STUDY AREA... 6 STUDY SCENARIOS...