The Regional Transportation Plan Appendix I. State Facilities Action Plan. Puget Sound Regional Council. May 2018
|
|
|
- Samuel Lamb
- 5 years ago
- Views:
Transcription


1 The 2018 Appendix I State Facilities Action Plan May 2018 Puget Sound Regional Council
2 May 2018 Funding for this document provided in part by member jurisdictions, grants from U.S. Department of Transportation, Federal Transit Administration, Federal Highway Administration and Washington State Department of Transportation. PSRC fully complies with Title VI of the Civil Rights Act of 1964 and related statutes and regulations in all programs and activities. For more information, or to obtain a Title VI Complaint Form, see or call Americans with Disabilities Act (ADA) Information: Individuals requiring reasonable accommodations may request written materials in alternate formats, sign language interpreters, physical accessibility accommodations, or other reasonable accommodations by contacting the ADA Coordinator, Thu Le, at , with two weeks advance notice. Persons who are deaf or hard of hearing may contact the ADA Coordinator, Thu Le, through TTY Relay 711. Additional copies of this document may be obtained by contacting: Puget Sound Regional Council Information Center 1011 Western Avenue, Suite 500 Seattle, Washington info@psrc.org psrc.org
3 APPENDIX I: State Facilities Action Plan What is the State Facilities Action Plan? PSRC requested the Washington State Department of Transportation (WSDOT) to: document state efforts to develop an I-5 action plan identifying low cost operational improvements and a clear I-5 preservation plan, improve the flow of HOV lanes, and accelerate seismic retrofits. State plans for future projects beyond those in Connecting Washington will also be covered. These are some of WSDOT s most pressing strategic planning issues for highway facilities in the Puget Sound region. The State Facilities Action Plan describes background on these questions, discusses current activities to address them, and proposes a work program to resolve them before the next update of the expected four years from now. While WSDOT has delivered one of its most aggressive improvement programs in its history over the past ten years, I-5 and local state highways have not had the same level of attention. As the region recovers from a lengthy recession and is now overtaken by rapid growth, a renewed planning emphasis is needed to keep the region s most critical lifelines in good condition, resilient, operating efficiently and accommodating meeting the diverse transportation and economic needs of a growing region. The document is organized into four sections that provide background and status of the specific issues raised by PSRC, and proposed work programs to resolve them, including: WSDOT s Approach, including Practical Solutions and organizational change to implement it High Occupancy Vehicle (HOV) Solutions and Congestion Management Strategies addressing performance challenges in HOV lanes I-5 Action Plan, addressing roadway and bridge preservation needs, seismic preparedness, near-term operational improvements, and a framework for developing a longer-range vision for the corridor Beyond Connecting Washington, on how WSDOT will address emerging needs and solutions, refresh previously identified solutions, and collaborate with the region to obtain funding for local priority state highways. The work programs described are preliminary, and require funding that has not yet fully been identified. Outcomes from these work efforts will be queued up for incorporation into the next update of the. Comments are Welcome If you have questions or comments on the work program proposals included in this document, please contact Robin Mayhew, Management of Mobility Division Director, at (206) or MayhewR@wsdot.wa.gov. Appendix I: State Facilities Action Plan 1
4 Contents What is the State Facilities Action Plan?... 1 Comments are Welcome WSDOT s Approach... 3 Practical Solutions... 3 Introducing the Office of Urban Mobility and Access HOV Solutions and Congestion Management Strategies... 5 Background... 5 What are HOV speed and reliability standards (and are they always achievable?)... 5 How have HOV lanes been performing?... 6 What strategies has WSDOT implemented to improve HOV speed and reliability?... 7 Are I-405 express toll lanes meeting HOV speed and reliability standards?... 7 Proposed Work Program to Address HOV Speed and Reliability I-5 Action Plan...10 Asset Management and Preservation...10 What is the current age and condition of I-5 through the Puget Sound region?...10 What are strategies and estimates for maintaining a state of good repair?...11 What are risks or challenges associated with these strategies?...13 Seismic Preparedness and Resilience...14 What has WSDOT done to date in regards to seismic preparedness?...14 What is WSDOT doing to increase seismic preparedness?...18 What additional study or action could increase seismic preparedness?...18 Near-Term Operational Efficiency and Demand Management Actions...19 How are central Puget Sound freeways performing operationally?...20 What work is underway to pilot near-term I-5 improvements?...21 Proposed Work Plan for a Long Range Corridor Vision Planning Beyond Connected Washington...24 What is causing increased demand on local priority state highways?...24 What policies guide planning for local priority state highways?...26 What strategies have potential to address mobility needs?...26 Proposed Planning Work Program for Local-Interest State Routes...28 Appendix I: State Facilities Action Plan 2
5 1. WSDOT s Approach Practical Solutions WSDOT has adopted Practical Solutions as an organizing principle for all agency functions, including all elements of planning, design, engineering, and delivering transportation solutions. WSDOT is using the Practical Solutions approach to increase the focus on transportation system performance and enable more flexible and sustainable transportation investment decisions. The approach includes increasing collaboration with communities and partners as we identify needs and develop coordinated strategies to address the needs. By using this approach, WSDOT can make transportation investments at the right place and time for the lowest cost. Introducing the Office of Urban Mobility and Access (UMA) The Washington State Department of Transportation has set up a new office based in the central Puget Sound region to manage coordination of a significant number of projects coming online in the next six years. This includes close collaboration with cities, counties and other partners. One of the main drivers for UMA is the enormous amount of transportation investment taking place in the Puget Sound region. At WSDOT alone, we re working on the Alaskan Way Viaduct, rebuilding Colman Dock, continuing major rehab of Interstate 5 in Seattle, finishing HOV on I-5 in Pierce County, extending express lanes on I-405, getting I-90 ready for light rail, re-paving Aurora Avenue and continuing work on the SR 167/SR 509 Puget Sound Gateway. In addition to this work, our transportation partners in the Seattle area are building bus rapid transit (RapidRide) lines, continuing construction in the bus tunnel, and let s not forget Sound Transit s new $54 billion program. Much of this work will be happening all at the same time. With so many projects overlapping and affecting multiple jurisdictions and stakeholders, we need significant coordination and consistent messaging. That s a key role and responsibility for UMA s three divisions: Management of Mobility, Toll Division, and Regional Transit Coordination. The Management of Mobility (MoM) Division will play a significant role in coordinating and integrating transportation projects, traffic operations, incident response, and programs with internal and external partners in the Puget Sound region. The division will be responsible for planning and coordinating work operations in key corridors to make sure that there is alignment between the various offices of WSDOT and between WSDOT and our partner jurisdictions. Operations review will include work being done by WSDOT, SDOT, King County and others within the central Puget Sound area. The division works closely with Mega Projects and regions to ensure operational features meet performance goals and staged implementation of projects align with the strategies and needs of the overall transportation system. The division will ensure that WSDOT partners appropriately as lead agency or supporting other agencies in lead roles in regional planning for transportation, land use and economic development. In addition, it will position WSDOT and its partners to take advantage of opportunities related to new technology, such as smart applications, autonomous vehicles, and system management innovations. Appendix I: State Facilities Action Plan 3
6 The Toll Division will have leadership and oversight responsibilities for all aspects of the state s tolling program, including operations, engineering, maintenance and issues relevant to customer service. The Toll Division is responsible for revenue collection on various toll facilities including: SR 16, SR 520, SR 167, I-405, SR 99 and others as requested. The Regional Transit Coordination Division will work to coordinate and facilitate Sound Transit s light rail, bus, and commuter train modes of service within and adjacent to WSDOT s rights of way, including work along I-5 from Everett to DuPont, I-90 from Seattle to Issaquah, as well as SR 520, I-405, SR 522, SR 523 and SR 518. The RTC Division will also coordinate with King County Metro, Community Transit, Everett Transit, and Pierce Transit. Division staff will engage and coordinate with WSDOT s transit and local agency partners to support an integrated multimodal transportation network that utilizes all modes and reflects the needs of the customer. The division will work toward regional integration of transportation solutions, including use of technology, for seamless connections and accessibility for travelers. Appendix I: State Facilities Action Plan 4

7 2. HOV Solutions and Congestion Management Strategies The HOV Policy/Managed Lanes Strategy section of the State Facilities Action Plan proposes a work plan to address declining speed and reliability in HOV and general-purpose lanes in the Puget Sound area. WSDOT envisions a regional dialogue that recognizes the limits of the HOV strategy and changing uses of HOV lanes, and which considers a range of alternative policy and strategy responses. Recognizing that more work is needed to develop agreement on HOV and managed lanes operation, WSDOT recommends that the Regional Transportation Plan be modeled to assume HOV lanes will be managed appropriately to achieve desired performance, coupled with a commitment to work together with regional partners on the best implementation approach to achieve that outcome. Background WSDOT implemented high occupancy vehicle (HOV) lanes in the 1980 s decade to give Blue Streak park-and-ride express buses faster service on the new I-5 express lanes and to avoid congestion approaching the SR 520 Evergreen Point Floating Bridge. In the 1990 s WSDOT planned a Core HOV program to add HOV lanes to primary freeways throughout the Puget Sound region. Express buses on HOV lanes have provided fast and reliable transit service to regional centers, and HOV lanes have supported carpooling and vanpooling programs resulting in the highest vanpool use in the United States. While general-purpose freeway lane volumes have been constrained by capacity, HOV lane traffic volumes have continued to grow to the point where they are also near capacity. During the great recession traffic subsided, but more recent economic recovery and travel growth have brought new levels of congestion to both general purpose and HOV facilities. At the same time, the region has voted to replace many express bus routes with rail transit over the next decades. What are HOV speed and reliability standards (and are they always achievable?) Originally, HOV lanes on I-5 and SR 520 were opened with a three- or-more (3+) person carpool definition, while I-90 and I-405 opened with a two-person (2+) carpool definition. In 1991, the Legislature added a proviso to the transportation budget directing WSDOT to reduce the carpool definition to 2+ on all facilities 1. WSDOT argued at the time that a 3+ definition would be needed in the future, and a 3+ carpool definition was reflected in regional environmental documents, policies and plans. WSDOT worked with agency partners to develop comprehensive policies for HOV lanes, including an HOV lane speed and reliability standard to gauge when a switch to 3+ carpools should be considered. Appendix I: State Facilities Action Plan 5
8 WSDOT adopted HOV policies in 1992 that included an HOV speed and reliability standard requiring HOV lanes to operate at 45 mph during 90 percent of peak hours measured over a six- month period. Subsequently this same standard was adopted in federal law to define the conditions under which HOV lanes are considered to be degraded. When HOV lanes allow access to single- occupant users in either low-emission vehicles or high occupancy toll lanes, federal law requires certification that this standard continues to be met, or that an action plan be implemented to remedy degraded operation. There have been serious challenges using this policy to trigger policy change: There are places where 45 mph cannot be achieved. Bus drivers are sometimes reticent to operate faster than adjacent traffic, so 45 mph is infeasible for buses if general traffic is in a stop and go condition. Some buses also cannot maintain 45 mph up steep hills. Once HOV lanes are congested, the impact of changing to 3+ has been considered unacceptable. Changing to 3+ would move most HOV traffic into congested general-purpose lanes, and leave the HOV lane seeming to be underutilized. How have HOV lanes been performing? HOV lanes continue to provide a speed and reliability advantage to transit and carpools compared to general-purpose lanes. The Corridor Capacity Report shows that in some corridors HOV lanes are less congested than adjacent general-purpose lanes, and that the duration of congestion is shorter. HOV lanes continue to carry more people than an adjacent general-purpose lane due to the higher number of people in vehicles that are in HOV lanes. However, achievement of WSDOT HOV speed and reliability standards has fallen significantly, particularly on I-5 and I-405, due to renewed economic and traffic growth as shown in the 2016 Corridor Capacity Report 2 : Carpool violations are also a growing concern and contribute to reduced speed and reliability performance. The following table shows that HOV lanes are performing far below the 45 mph/90% of peak periods standard in most corridors. High occupancy vehicle lane speed and reliability performance on major central Puget Sound corridors 2011 through 2015; Goal is to maintain 45 mph for 90% of peak hour; Percent shown is percent of the time this goal was met during the morning and afternoon peak hour. Commute routes Commute routes Morning commutes Evening commutes I-5, Everett to Seattle SB 64% 54% 42% 28% 26% I-5, Everett to Seattle NB 76% 68% 66% 46% 36% I-5, Federal Way to Seattle NB 72% 51% 43% 30% 18% I-5, Seattle to Federal Way SB 82% 63% 53% 40% 32% I-405, Tukwila to Bellevue NB 98% 93% 65% 35% 26% I-405, Bellevue to Tukwila SB 60% 43% 41% 26% 21% I-90, Issaquah to Seattle WB 100% 100% 100% 98% 98% I-90, Seattle to Issaquah EB 99% 100% 99% 100% 99% SR 520, Redmond to Bellevue WB 97% 51% 50% 44% 63% SR 520, Redmond to Bellevue WB 70% 54% 52% 52% 73% SR 167, Auburn to Renton NB * 99% 96% 94% 86% 66% SR 167, Renton to Auburn SB * 99% 98% 98% 98% 95% 1 Governor Gardner vetoed this proviso, but directed WSDOT to implement the intent of the Legislature wherever feasible. WSDOT lowered the carpool definition on I-5 to 2+, but left the SR 520 standard at 3+ west of I For full report, see Detailed performance information for specific HOV facilities can be found in the Appendix.at Data source: Washington State Transportation Center. Notes: The above HOV reliability performance standards are based on the peak hour, when average travel time is slowest. To meet the standard, an average speed of 45 mph must be maintained for 90% of five-minute periods during the peak hour on weekdays. Numbers represent the percentage of these periods when speeds are 45 mph or faster. The Washington State Transportation Center analyzes performance data for all complete Appendix I: State Facilities Action Plan 6


9 segments of HOV lanes that have a loop detector. In some cases, like southbound SR 167, data cannot be analyzed for the very beginning and ends of the lanes because there are no detectors at these locations. I-405 commutes between Lynnwood and Bellevue are no longer listed above, as they now have different legislatively mandated speed and reliability performance measures per RCW For performance information, see *High occupancy toll lanes replaced regular HOV lanes on SR 167 between Auburn and Renton in What strategies has WSDOT implemented to improve HOV speed and reliability? HOV lanes are one form of a broader category of highway facilities called managed lanes, which manage volumes entering a roadway by (1) controlling where and when vehicles can access the roadway, (2) which vehicles can use the roadway, and/or (3) what price is required. HOV s are managed solely through limiting access to vehicles with a specified occupancy, sometimes during specific time periods. Managing by occupancy alone does not allow for fine-tuning; either there are too many vehicles in the HOV lane (at 2+) or far too few (at 3+). HOV lanes are only over-utilized when adjacent traffic is congested, so shifting traffic from the HOV lane to general-purpose lanes makes this congestion worse while leaving HOV lanes seeming empty. Because of this dynamic, no known example exists of a transportation agency changing from 2+ to 3+ HOV. Like other transportation agencies across the country, WSDOT has proposed to evolve HOV lanes to manage volumes, speeds and throughput more effectively using all the management tools available, including access control and pricing as well as occupancy. WSDOT introduced HOT lanes in a pilot project in 2008 and express toll lanes opened on the north end of I-405 in WSDOT believes that transit and HOV benefits on highways rely on being able to manage traffic effectively in managed lanes. Are I-405 express toll lanes meeting HOV speed and reliability standards? When traffic breaks down, the effective roadway capacity is reduced, collisions increase, and fewer vehicles get through. These effects worsens congestion and extends the rush hour. This dynamic is illustrated in the graphic at left, which shows actual values for volumes and speeds on I-405 in all lanes in afternoons over two years prior to implementing express toll lanes. When traffic is badly congested, lane throughput can be as little as half or less of theoretical capacity. The theory behind express toll lanes is that the number of non-carpool users can be managed by changing the toll rate based on traffic conditions. Appendix I: State Facilities Action Plan 7


10 If the number of vehicles entering the facility can remain less than or equal to capacity, the roadway will operate most efficiently and the full theoretical capacity will be achieved at a reliable speed. By exempting carpools from tolls, express toll lanes also provide an incentive for transit and ridesharing to make better use of vehicle capacity and move the most people through the corridor. This approach to managing traffic volumes can only work if the number of toll-exempt carpools does not exceed lane capacity, so if an HOV lane that s too crowded will become an express toll lane, the number of carpools must be reduced or the number of lanes must be increased. The first two years of I-405 express toll lane operation have proven that the theory can work. While tolling has been controversial, and added vehicles from widening the segment south of SR 522 exacerbated a general purpose lane bottleneck in the Bothell to Lynnwood segment, the express toll lanes have achieved better reliability and higher vehicle throughput than either the general purpose lanes or the HOV lane that existed previously. The figure at right shows volume and speed data for the express toll lanes (in blue) and the HOV lane in the previous year (in brown) in the dual- lane segment of I-405 express toll lanes south of SR 522. While the prior HOV lane carried only 1300 cars per hour and were often below 45 mph, the blue dots show that the far left express toll lane is achieving the theoretical lane capacity of 2000 vehicles/hour most of the time, and the lane adjacent to general-purpose traffic is achieving around 1600, while remaining above 45 mph most of the time. In the dual-lane segment, express toll lanes achieve the 45 mph, 90 percent standard. In the single lane segment, express toll lanes are achieving the standard northbound, but dropping below this standard southbound. Express toll lane speeds and reliability are significantly better than the previous HOV lane, but for the single lane section to meet the current standard, a second express toll lane, a higher toll rate, improved enforcement, or increased separation from general-purpose traffic may be needed. Proposed Work Program to Address HOV Speed and Reliability When the HOV lanes were planned, it was assumed that the carpool definition would be adjusted as needed over time to ensure that a reliable speed advantage would be maintained. Regional and corridor-specific plans and environmental documents made long-range projections assuming a three-person carpool definition. Implementing that policy has been more difficult than expected at the time. After over 35 years of HOV program development and operation, it is important to conduct a comprehensive policy review to develop a more workable strategy to maintain HOV lane effectiveness, and to reflect adoption of the Sound Transit program to replace regional express bus service with rail. With I-405 express toll lanes in operation in the north end of the corridor and Appendix I: State Facilities Action Plan 8
11 under development in the south, the biggest remaining issues regarding HOV lanes apply to I-5. These issues must be resolved prior to making other long-range plans for the I-5 corridor. Considering this, WSDOT will address HOV lane policy issues and congestion management strategies concurrently with regional consultation on the future of I-5. WSDOT is at the initial stage of developing plans and scope for these efforts, discussed in more detail in the next section. The Department will consult with key regional legislators, policy-makers, technical specialists, stakeholders and partner agency staff to develop our approach to the efforts described below. Proposed Work Plan for Developing a Regional Managed System Plan Section 3 of this document discusses a proposed work plan for a long range I-5 corridor vision. As part of this look at the I-5 corridor, this project will also evaluate opportunities for improving the regional HOV system. WSDOT will work with PSRC to convene a working group in 2018 comprised of elected officials, stakeholders and technical experts to develop a future vision for I-5. Their work will include the evaluation of alternative policies to improve system-wide HOV lane speed and reliability, and other approaches to operating the state s highway network in the Puget Sound. This effort is anticipated to assist in identifying near term actions that will improve or sustain HOV facilities performance, and lead to additional work to develop an integrated transition plan for regional corridors ultimately to implement the overall regional managed system plan. Appendix I: State Facilities Action Plan 9
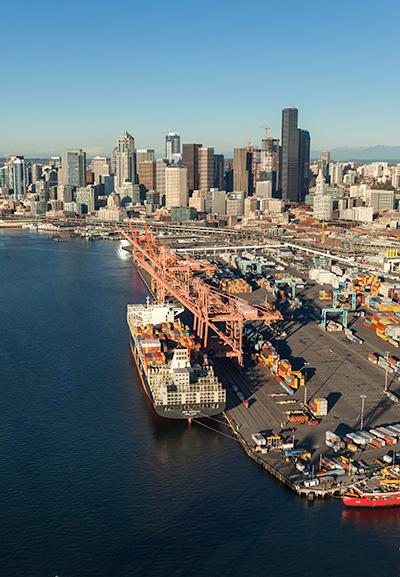
12 3. I-5 Action Plan I-5 is the most critical transportation asset for economic development in the state. It is also the state s most congested roadway, and has the greatest share of bridges and concrete pavement preservation needs. I-5 serves many of the fastest growing centers in the Puget Sound, and provides a lifeline for freight and transit service. This section describes the current status of I-5 infrastructure and performance, and WSDOT s proposed approach for developing strategies to manage and maintain mobility and a longer-term vision for the corridor. Asset Management and Preservation Interstate 5 through the Puget Sound region is the busiest route in the state, with its busiest sections carrying over 200,000 vehicles per day between Kent and Shoreline, and over 250,000 through downtown Seattle. This corridor is the most important north-south freight corridor in the Puget Sound region, moving the highest volumes of freight in the state. The preservation of this vital route is critical to the state s economic well-being. I-5 through the Puget Sound region was built in the 1960s as a result of the Federal-Aid Highway Act of 1956 (National Interstate and Defense Highways Act). On the mainline, there are over 800 lane miles of roadway and 147 bridges from the southern Pierce county border to the northern Snohomish county border. Additionally, there are multiple interchanges adding an additional 200 lane miles and 178 bridge structures. Five decades later, much of this infrastructure is nearing the end of its service life, while the rapid growth in the region is adding additional demand on the transportation system in the region. These combined factors mean planning to preserve the infrastructure must also occur in conjunction with regional planning to improve overall system performance. A balanced delivery that avoids excessive delays for its users, also called construction fatigue, is essential. What is the current age and condition of I-5 through the Puget Sound region? The majority of I-5 pavement was constructed with Portland Cement Concrete Pavement. When constructed in the 1960s, engineers estimated its service life to be 20 years before needing rehabilitation or replacement. Concrete used in Washington is exceptionally strong, and this pavement has performed much better than anticipated. The vast majority of the pavement built in the 1960s through this corridor is still in service today. However, this pavement is nearing the end of its service life. As of 2015, 9% was rated in poor or worse condition, which indicates a rough and cracked structure. More pavement would be rated as poor if not for proactive preservation. WSDOT has been actively preserving this pavement through dowel bar retrofit, select panel replacement, and diamond grinding, correcting rough road and cracked panels since the late 1990s. The majority of bridge structures in this corridor were also constructed in the 1960s, although some bridge structures were constructed earlier, especially structures that are part of the interchanges and cross-over routes. Appendix I: State Facilities Action Plan 10
13 The figure below shows the age profile of Puget Sound bridges along the I-5 corridor in In 2016, 1.4% of bridges were rated in poor condition. Bridges in poor condition have advanced deficiencies such as section loss, deterioration, scour or seriously affected structural components. However, bridges in poor condition are still safe for travel. Safety for travel is a separate assessment 3. What are strategies and estimates for maintaining a state of good repair? WSDOT uses similar strategies for preserving assets across its network. It does this by properly timed, cost-effective activities. Pavement Assets For pavements, WSDOT will continue to use select panel replacement and diamond grinding to preserve concrete pavement, allowing much of it to reach a service life of 55 to 70 years. Once sections reach the end of their life and need replacement, WSDOT compares replacement alternatives using Life Cycle Cost Analysis (LCCA). This methodology accounts for the initial construction costs and user delay costs plus O&M lifecycle costs over a 50-year design life. Resulting strategies include remove and replace with asphalt; remove and replace with concrete; or crack, seat and overlay (CSOL) with asphalt. Using CSOL, the existing concrete pavement is broken up to settle into cracks and crevices in the roadway foundation to form a solid base for a layer of asphalt above. For sections of asphalt pavement throughout the corridor, WSDOT will use properly timed resurfacing, usually occurring between 15 and 18 years. This is where the top two inches of asphalt are removed and replaced, preserving the whole asphalt structure, usually eight or more inches, for many decades. This is the lowest-cost life-cycle methodology for preserving this type of pavement. Using these strategies, an estimated $1.2 billion is needed to preserve pavements through See Gray Notebook ( #62 pg for more information on statewide bridge assessment. Appendix I: State Facilities Action Plan 11
14 Bridge Assets WSDOT estimates an 80-year service life for bridges. Once a bridge is approaching 80 years in age, it is necessary to plan for its replacement. As many of the bridges in this corridor were built in the late 1950s and early 1960s, a number of them will be nearing the time of replacement in the 2040 timeframe. However, in the decade after 2040, over 75% of the I-5 bridges will turn 80 years old, creating a much higher need than within the 2040 timeframe. Additionally, the 80-year life assumes properly timed preservation activities including expansion joint replacement, bridge deck overlays, and steel bridge painting. Expansion joint replacement is necessary as failed joints can cause vehicle damage and emergency work, leading to long traffic delays. Bridge deck overlays are necessary to keep the driving surface in adequate condition and to protect the sub-structure from further damage. Steel-bridge painting extends the steel truss life by preventing corrosion and preserving its structural integrity. Using these strategies, an estimated $675 million is needed to preserve bridges through Other Highway Assets In addition to pavements and bridges, several other types of assets make this highway function properly. The three major types are drainage, electrical, and barriers. Major drainage includes culverts and storm water systems. There are approximately 600 culverts identified through this corridor and 94 fish passage structures. There are over $100 million identified needs of fish barriers to correct along this corridor. WSDOT is working to develop life cycle management plans for the culvert and storm water systems assets through this corridor as part of its asset management implementation in Major electrical includes illumination, signals, and Intelligent Transportation Systems (ITS). Often, these types of structures are monitored until they need to be replaced. There are over 1,700 different inventoried assets as part of these systems in the corridor, with an estimated $468 million preservation need through Barriers include guardrail, cable median barriers, concrete barriers and impact attenuators. Similar to major drainage assets, WSDOT is working to develop life cycle management plans for these barrier assets. Total Preservation Need When accounting for all the assets within the corridor, an estimated $2.5 billion is needed through Compare this with approximately $14 billion of estimated statewide preservation need through 2040, and I-5 in the Puget Sound corridor is 18%, or almost one fifth of the total statewide preservation needs. It is important to note that these needs do not include estimated costs of seismic retrofit, mobility or other improvements. The table below summarizes the breakdown of need by asset type. Estimated need is based on current dollars and is not inflated to year of expenditure, because year of expenditure is unknown at this time. The final State Facilities Action Plan will address what portion of these needs are likely to be funded under current revenue assumptions. Appendix I: State Facilities Action Plan 12
15 I-5 Puget Sound Preservation Needs through 2040 Asset Type Estimated Preservation Need through 2040 (millions of dollars) Pavement $ 1,200 Bridges $ 675 Major Drainage Including Fish Barriers $ 100+ Major Electrical $ 468 Barriers Total TBD Approximately $ 2.5 Billion What are risks or challenges associated with these strategies? There are several risks and challenges to preserving the Puget Sound I-5 corridor. The three greatest risks are lack of funding, balanced delivery, and regional transportation system demand. The primary way to mitigate these risks is through a Practical Solutions approach built on robust asset management practices, and proactive public communications. As shown in the table above, there are substantial needs for preservation through this corridor. Limited funding jeopardizes opportunities to minimize life cycle costs because the proper timing for treatments may be missed. Asset management through Practical Solutions will help to mitigate this risk by identifying lowest life cycle costs and communicating this information in a timely manner that allows for better financial planning. These preservation needs must be delivered in a balanced manner that considers regional transportation system demand. First, needs across years must be planned so that excessive needs do not come due at the same time. Second, needs across assets must be balanced so that cross-asset considerations lower overall preservation costs. Third, needs across the region must be planned and balanced so that construction fatigue is minimized. Construction along the I-5 corridor must not just balance the delivery along I-5, but also consider projects planned on adjacent routes. Practical Solutions and asset management will ensure a balanced delivery for these considerations. Needs across years will be balanced by life cycle planning and forecasting. For example, the WSDOT Pavement Office is already developing a 30-year concrete plan to manage the state s aging concrete pavements 4. Needs across asset types will be made more visible by robust inventories necessary for asset management, allowing WSDOT more time to plan to deliver several preservation activities simultaneously, increasing construction cost efficiency and reducing construction fatigue. Finally, the Corridor Sketch Initiative will give planners early information to develop strategies along corridors. Having this information available will allow WSDOT to quickly compare the identified strategies of adjacent corridors and plan a more balanced delivery. 4 See Gray Notebook ( #64 pg. 18 for an explanation of Practical Solutions and the concrete preservation plan Appendix I: State Facilities Action Plan 13
16 Seismic Preparedness and Resilience Washington State is susceptible to and has experienced earthquakes for millennia. It is considered one of the five states facing the greatest seismic hazards in the United States. Of the ten active faults in western Washington State, seven are most likely to impact the main roadways that run through heavily populated urban areas. While earthquakes and tsunamis cannot be prevented, we can be better prepared to respond and recover quickly when these natural disasters occur. Washington State and WSDOT are actively engaged in making sure the state is resilient when these seismic events occur. What has WSDOT done to date in regards to seismic preparedness? WSDOT has engaged in seismic preparedness in three primary ways; bridge seismic retrofit 5, Washington State Ferries (WSF) seismic retrofit, and active participation in several emergency management and resilience programs. In general, WSDOT is not creating a distinction between the Puget Sound region and the statewide resilience effort. Therefore, numbers presented in this section are statewide, except where noted. However, due to the geographic features and population concentration in the Puget Sound region, the nature of most of the seismic preparedness work is focused on the Puget Sound region. Bridge Seismic Retrofit The first step in seismic retrofit is to perform an engineering analysis to determine if an existing bridge can resist a design level earthquake. Computer models are used to apply a force to each bridge pier. This is also call a Push-Over analysis. The capacity of the bridge pier is then compared to the demand of the design level earthquake forces. WSDOT uses the American Association of State Highway and Transportation Officials (AASHTO) adopted 1,000-year return period seismic standard (7% probability of exceeding in 75 years) to determine the forces (stress) the bridge must resist. Structures in the Puget Sound and coastal region are expected to experience the most stress, based on peak ground motion analysis during such an event. See the Seismic Lifeline Routes folio 5 for a map that shows the peak ground motion based on a 1,000-year return period analysis for Washington. WSDOT has addressed bridge seismic retrofit needs for the past two decades, including identifying and retrofitting all or part of more than 400 bridges 6. The agency has invested more than $195 million to strengthen our bridges in order to better withstand major earthquakes. Accomplishments as of March 2017 include: 316 bridges have been seismically retrofit with one currently under contract Another 119 have been partially retrofit, but require more work to meet current standards Invested more than $195 million on projects to strengthen bridges Construction of all new bridges to 1,000-year seismic standards Constructed the following bridges to incorporate Cascadia Subduction Zone (CSZ) 2,500-year earthquake event seismic standards: the new SR 99 Tunnel, SR 520 floating bridge, and the new Tacoma Narrows Bridge 5 More information is found at the Seismic Lifeline Routes folio and the Bridge Seismic Retrofit Program at 6 A little less than one third of WSDOT s over 3,100 vehicular bridge structures have been or are in need of seismic retrofit. Appendix I: State Facilities Action Plan 14
17 These accomplishments followed a three-phase seismic retrofit plan. Phase 1: Secure the superstructures to piers/columns to withstand horizontal movement Phase 2: Address single column bridges since there is no redundant support for the structure, primarily with steel jacketing Phase 3: Address multi-column bridge piers by jacketing the column with steel Phases 1 and 2 have mostly been completed, while there is still substantial work to complete Phase 3. An initial estimate for retrofitting all 594 bridges in need of seismic retrofit is $1.5 billion, with $1.1 billion of this work focused in the Puget Sound region. Seismic Lifeline Routes To manage this large need and provide a resilience goal of providing or restoring essential services within 3-7 days and be fully operational within 3 months, WSDOT identified a network of mainline routes that can provide the critical corridors needed. This network is called the Seismic Lifeline routes. The routes initially were identified in 2012 with priority travel from JBLM to Everett, with a main focus of ground transportation routes between airfields: McChord Field, Paine Field, SeaTac and Moses Lake. These airfields are essential in providing emergency services and supply relief in the event of a major earthquake in the Puget Sound region. Within this defined Seismic Lifeline, 49 bridges are identified as critically important and 22 of them have been retrofitted at a cost of $39 million. The cost estimate to address the remaining bridges identified in the current Seismic Lifeline is $161 million. The map on the following page shows the current status of the Seismic Lifeline. This includes: The portion of the lifeline that is mostly complete today (brown sections). - From the south, I-5 from JBLM to the junction of I-5 and I-405. The Puyallup River bridges will be completed soon, and other key overcrossings are planned for retrofit. - From the north, SR 529 from the Port Everett to the northern junction of I-5 and I-405. The portion of the lifeline that is planned to be complete by 2027 (orange sections). - Retrofitting two remaining structures on SR 518 for SeaTac airport. - Retrofitting SR 526, to complete the segment between Paine Field and I-5. - Retrofit I-405, in conjunction with the other construction in the I-405 corridor. - Retrofit I-90 from the junction with I-405 east to Snoqualmie Pass. The I-5 High Cost Corridor (black sections). At this time, this corridor is not funded for retrofit because of the high cost, estimated at over $550 M, to do so. Potential Lifeline additions (pink sections). This includes an SR 99 alternate to the High Cost Corridor and I-90 from its beginning to the junction with I-405. More analysis is required to properly assess the strategy and estimate the cost of adding these to the seismic lifeline. Appendix I: State Facilities Action Plan 15

18 Appendix I: State Facilities Action Plan 16
19 Washington State Ferries Seismic Retrofit Program Washington State Ferries has had a Seismic Retrofit program for almost a decade. Accomplishments to date (March 2017) include: The Vashon terminal has been modified to structurally withstand a 1,000-year event earthquake. Both the Vashon and Point Defiance terminals can remain operational immediately after a 100-year event earthquake. The Mukilteo Ferry Terminal scheduled to open in 2019 will be able to remain operational after a level 100-year event earthquake, and able to structurally withstand a level 1,000-year event earthquake. The Seattle Terminal currently under design is funded to address the critical life safety elements of an occupied facility. This funding only partially addresses the need to remain in operation after a 100-year event, and only partially addresses the code requirements for a 1000-year event. Construction will be completed by WSF has a two-stage Seismic Retrofit Plan: Phase 1: Design the superstructure bridge seat piers to handle horizontal movement from seismic events. Phase 2: Prioritize deficiencies in the ferry terminal foundation structures including effects of liquefaction. WSF has completed Phase 1 at all terminals. WSF is in the process of identifying, prioritizing and estimating costs for Phase 2. Participation in Emergency Management and Resilience Programs WSDOT is very actively participating in emergency management and resilience programs. This allows WSDOT to coordinate with federal, other state, regional and local stakeholders and collaborate to maximize resilience across modes and networks. This coordination includes: WA State Emergency Management Department WSDOT is a member of several planning efforts and work groups with EMD, including development of a Catastrophic Incident Plan, the Statewide Catastrophic Incident Planning Team, and the Infrastructure Resilience Sub-Committee.( Seismic Safety Committee WSDOT is a participant of the multi-jurisdictional committee under the guidance of the Emergency Management Council. ( Washington CSZ Transportation Systems Regional Resiliency Assessment Program which includes the Department of Homeland Security IP Region 10, WA EMD, FEMA Region 10, US Coast Guard District 13, and USDOT Region 10. ( Local emergency planners coordinating with King County, City of Seattle, Snohomish County, and Pierce County on seismic retrofit and identification of local lifeline corridors. Appendix I: State Facilities Action Plan 17
20 Planning and Preparedness: WSDOT s Continuity of Operations Plan and Emergency Operations Plan both identify seismic response and recovery. WSDOT has regional support to devolve during a seismic incident, with 10 available Emergency Operations Centers (EOCs) located statewide. All six WSDOT Regions and WSF have Incident Management Team (IMT) personnel to staff regional EOCs and support seismic response actions. What is WSDOT doing to increase seismic preparedness? WSDOT is increasing seismic preparedness by continuing the work of bridge seismic retrofit and its participation in emergency management and resilience programs. For bridge seismic retrofit, in 2016 the state legislature provided approximately $170 million for stand-alone seismic retrofit work in a 16-year investment plan. This investment will allow WSDOT to continue to address seismic retrofit needs within the Seismic Lifeline. As noted previously, all new bridges are constructed to 1,000-year event seismic standards, following standards adopted by AASHTO and implemented by WSDOT in WSDOT continues its participation in emergency management and resilience programs. One primary way it is doing this is by providing input to update Recommendation #6, Strengthen regional transportation networks, of the 2012 Resilient Washington report. This is in direct response to the Governor s Directive issued November 4, Recommendation #6 includes the following four priority actions, of which WSDOT is reviewing items 6a through 6c: 6. Priority Actions to strengthen regional transportation networks: Responsibility 6a. Further define critical state routes into and out of ports, airports, and other key areas (e.g. the Kent/Duwamish Valley) and identify priority routes for retrofitting/hardening as a systematic approach that includes 6b. Decisions about these routes should be made in consultation with all necessary administrative levels/jurisdictions. 6b. Facilitate collaboration between state and local jurisdictions to identify regional lifeline routes and prioritize retrofitting of city and county roads and bridges. Incorporate this into the Transportation Improvement Program. 6c. Develop interagency agreements between WSDOT and local jurisdictions to facilitate the rerouting of traffic following an earthquake. 6d. Require that transit agencies (both large and small) develop robust continuity of operations plans. What additional study or action could increase seismic preparedness? As WSDOT prepares input to update Resilient Washington, gaps have been identified that inform policy makers where to focus attention. The primary gaps include: WSDOT WSDOT; Regional & Metropolitan Transportation Planning Organizations State Legislature Appendix I: State Facilities Action Plan 18
21 1. Research for the specific impacts from a CSZ event (2,500- year event) are limited and not incorporated into the current seismic retrofit plan. 2. No retrofit work has been done to address liquefaction. This includes both the retrofit work and estimates. 3. There is still a need to expand efforts on the identification of Tsunami threats and impacts to transportation facilities 4. Locally-owned roadways will also need to be utilized for response in a seismic event. More coordination needs to occur with local agencies, especially the development of additional lifeline routes and written interagency agreements for traffic routing in emergency events. 5. The WSDOT Catastrophic Incident Plan has not been completed. Current plans do not explicitly account for a catastrophic level event. The Catastrophic Incident Plan is planned for completion in summer Lifeline routes have focused on structures, as they are the most vulnerable points during these events. More work needs to be done across all components of the transportation system, including WSF, to ensure resiliency. Near-Term Operational Efficiency and Demand Management Actions This section provides an overview of operational and demand issues on I-5 in the Puget Sound region and work currently underway to assess and recommend near-term actions that could be implemented to address them. In this context, operational improvements and demand management generally refer to changes to use available highway, street and transit capacity to better meet the needs of people and communities served by I-5. Operational issues specific to HOV lanes are described in the previous section. Examples of operational and demand management improvements include: Ramp meters to reduce delay and collisions due to merging traffic, improve traffic flow and, in some locations, provide a time and reliability advantage to transit and other high occupancy vehicles Active traffic management to help manage traffic flow coming into congested areas or around blocked lanes Commute trip reduction to engage local communities and employers to increase the number of people who ride transit, carpool, vanpool, bicycle, walk, telework and shift their work schedules Incident response to clear blockages to reduce duration of congestion Buffer separation of portions of the HOV lane system Technology to support HOV monitoring and enforcement Enforcement collaboration enhancements with the Washington State Patrol Integrated corridor management to coordinate traffic controls on parallel roadways to help manage diversion around incidents Appendix I: State Facilities Action Plan 19


22 Traveler information to advise drivers to use less congested routes, transit, carpools, vanpools, bicycles, walking, telework, shift their travel time, etc. Increased transit, vanpools and carpools to move more people in fewer vehicles Changes in geometrics or striping to limit weaving, improve safety and smooth the flow of transit Hard Shoulder Running (paved and reinforced shoulders) or auxiliary lanes to provide added capacity in spot locations to remove bottlenecks, improve transit speed and reliability, and/or improve safety Peak period managed lanes to provide improved speed, reliability and person throughput by limiting demand to within available capacity and improving transit, vanpool, and 3+ carpool speed and reliability How are central Puget Sound freeways performing operationally? During the recession from 2007 to 2011, traffic volumes decreased throughout the Puget Sound region, but since then traffic has increased rapidly as the economy recovered. Traffic and associated delay grew rapidly in the region, and the greatest share of congestions was on I-5. In 2015, I-5 experienced an average of 16,810 vehicle hours of delay each weekday, or 56.6% of all delay on the major urban freeways in the region. The graph below shows the significant increases in regional freeway vehicle miles traveled and delay from 2011 to Average daily weekday delay on freeway corridors (Interstate 5, I-405, I-90, State Route 520 and SR 167) in King and Snohomish counties grew roughly 35.7% from 21,855 daily vehicle hours of delay in 2013 to 29,656 hours in This growth can be partially attributed to growing population and employment during this period. Appendix I: State Facilities Action Plan 20


23 Pierce County corridor conditions King and Snohomish counties corridor conditions From 2013 to 2015, the Tacoma Dome and Fife areas experienced increases in delay of about 375% and 140%, respectively. Construction on I-5 in this area led to higher than normal traffic friction in 2015, which contributed to the delay increases. Despite these growth challenges to the north, the Joint Base Lewis McChord (JBLM) area saw an approximate 16% decrease in congestion compared to This can partially be attributed to the implementation of 18 new ramp meters through the JBLM corridor in May The majority of the Fife area congestion is in the southbound direction, which is likely due to the relocation of a bottleneck, along with the end of HOV lane restrictions. In 2015, I-5 between Federal Way and Everett experienced vehicle delay northbound around the I-90 interchange and between Northgate and downtown Seattle. Southbound delays occurred at SeaTac and the SR 520 interchange. Vehicle delay along the I-5 corridor was consistently equal to or higher in 2015 than in Delay significantly increased between 2013 and 2015 at specific locations on the I-5 corridor including: southbound at SeaTac (up 105%), northbound at the I-90 interchange (up 33%), and in both directions near Northgate (up 25%). Delay would have been worse without transit. Data shows that even with conservative assumptions, transit ridership along the I-5 corridor translates to a capacity savings equivalent to more than four additional lanes of traffic during peak commute periods. Improvements at key congestion areas, such as the transit access ramps from I-90 to downtown Seattle that bypass the I-5 interchange, provide significant benefits in capacity and reducing travel delay. What work is underway to pilot near-term I-5 improvements? WSDOT is working with local organizations to develop an I-5 near-term action plan that will enhance near-term transportation system performance by improving street, transit and/or highway operations and increasing the use of transit, carpooling, vanpooling, bicycling, walking, compressed work week, telework, shifting work schedules, etc. The I-5 pilot project will produce a suite of projects to complement previously approved projects and services. These projects will be tailored for communities on two corridors: Seattle (Georgetown) to the King/Snohomish county line and Tumwater-DuPont in Thurston and Pierce counties. Appendix I: State Facilities Action Plan 21
Assessment of Current Status, Plans, and Preliminary Alternatives for High Capacity Transportation in the I-5 Corridor
 CONNECTING THURSTON COUNTY AND THE CENTRAL PUGET SOUND Alternatives to Meet Transportation Needs in the I-5 Corridor Working Paper #1 June 2011 Assessment of Current Status, Plans, and Preliminary Alternatives
Mega Projects at WSDOT
 Mega Projects at WSDOT Managing multiple projects in major urban corridors LINEA LAIRD, WSDOT ASSISTANT SECRETARY ENGINEERING & OPERATIONS Presentation to Oregon State Legislature Congestion Work Group
WASHINGTON STATE TRANSPORTATION COMMISSION Mission, Roles and Responsibilities. Presentation to Eastside Transportation Association April 26, 2011
 WASHINGTON STATE TRANSPORTATION COMMISSION Mission, Roles and Responsibilities Presentation to Eastside Transportation Association April 26, 2011 Washington State Transportation Commission Seven members
The Regional Transportation Plan Appendix K. System Performance Report. Puget Sound Regional Council. May 2018
 The 2018 Appendix K System Performance Report May 2018 Puget Sound Regional Council May 2018 Funding for this document provided in part by member jurisdictions, grants from U.S. Department of Transportation,
Implementing Asset Management: WSDOT s Experience
 Implementing Asset Management: WSDOT s Experience 6 th National Conference on Transportation Asset Management Aaron Butters, P.E. Systems Analysis and Program Development Manager November 2, 2005 1 Highway
Highway Construction Program
 Highway Construction Program Monthly Delivery Progress Report Watch List February 2017 This report focuses on Capital Highway Program projects, which have, or may have significant changes in scope, schedule,
State Facilities Action Plan
 Briefing: Strategic Issues Facing WSDOT in the Puget Sound Region PSRC Transportation Policy Board July 13, 2017 Overview PSRC has requested that WSDOT produce a : Addresses some of the most strategic
APPENDIX N East King County Subarea High Capacity Transit (HCT) Analysis: Approach to Assessing System-Level Alternatives
 Analysis: Approach to Assessing System-Level Alternatives") Sound Transit Regional Transit Long-Range Plan Draft Supplemental Environmental Impact Statement APPENDIX N East King County Subarea High Capacity Transit (HCT) Analysis: Approach to Assessing System-Level
Sound Transit Regional Transit Long-Range Plan Draft Supplemental Environmental Impact Statement APPENDIX N East King County Subarea High Capacity Transit (HCT) Analysis: Approach to Assessing System-Level
Progress Report Regional Express & Bus Rapid Transit Program
 Progress Report Regional Express & Bus Rapid Transit Program ST Express Bus routes serve urban centers in Snohomish, King, and Pierce. March 2018 Prepared by Project Control & VE l Design, Engineering
TRANSPORTATION 101 Today and Tomorrow. Moving People and Goods
 TRANSPORTATION 101 Today and Tomorrow Moving People and Goods What is the Transportation Commission? An independent, seven-member body of citizens appointed by the Governor for six-year terms and representing
Transportation Planning and Climate Change
 Transportation Planning and Climate Change Analysis and Use of New Tools in the Central Puget Sound Region New Partners for Smart Growth Conference February 4, 2010 2 Agenda Setting the Stage Climate Change
Los Angeles County Congestion Reduction Demonstration Project
 Los Angeles County Congestion Reduction Demonstration Project frequently asked questions update #1 /august 2008 Los Angeles County Metropolitan Transportation Authority (Metro), California Department of
APPENDIX B PROJECT PROBLEM STATEMENT AND PURPOSE AND NEED STATEMENT
 DRAFT Feasibility Report APPENDIX B PROJECT PROBLEM STATEMENT AND PURPOSE AND NEED STATEMENT B-1: Project Problem Statement, June 2017 B-2: Draft Purpose and Need Statement, August 2018 August 2018 B1
Performance Based Planning and Federal Target Setting. Transportation Policy Board September 13, 2018
 Performance Based Planning and Federal Target Setting Transportation Policy Board September 13, 2018 Federal Requirements - Background MAP-21 and the FAST Act established new emphasis on performance and
Making Connections Sound Transit 2 The Regional Transit System Plan For Central Puget Sound
 Making Connections Sound Transit 2 The Regional Transit System Plan For Central Puget Sound 1 Sound Transit 2 Contents Introduction...4 ST2: The Future...6 The ST2 Plan...9 Light Rail Extensions in ST2...109
Highway Construction Program
 Highway Construction Program Monthly Delivery Progress Report Watch List October 2018 This report focuses on Capital Highway Program projects, which have, or may have significant changes in scope, schedule,
Transportation 2040 Toward a Sustainable Transportation System. Toward a Sustainable Transportation System. Sultan Planning Board.
 1 Transportation 2040 Toward a Sustainable Transportation System Sultan Planning Board February 1, 2011 PSRC - Who We Represent 2 Our Region 4 Counties 82 Cities and Towns Urban & Rural Our Members Cities,
9.0 Meeting the Challenges
 9.0 Meeting the Challenges 9.1 SLRTP Goals The SLRTP is built around the six TxDOT Strategic Plan goals. 1. Develop an organizational structure and strategies designed to address the future multimodal
COFFEE WITH THE MAYOR. September 10, 2010
 COFFEE WITH THE MAYOR September 10, 2010 JBLM LOCATION TACOMA 163 road miles Part of Seattle-Tacoma-Olympia metropolitan region Bisected by Interstate 5 JBLM - 86, 176 Acres Yakima Training Center - 323,651
Appendix A: Project Planning and Development A-1 White Paper on Transit and the Tappan Zee Hudson River Crossing Project
 Appendix A: Project Planning and Development A-1 White Paper on Transit and the Tappan Zee Hudson River Crossing Project Purpose of White Paper White Paper on Transit and the Tappan Zee Hudson River Crossing
Operations in the 21st Century DOT Meeting Customers Needs and Expectations
 Operations in the 21st Century DOT Meeting Customers Needs and Expectations 1 Purpose of this Meeting: Share Thoughts & Discuss Challenges brought about by the changing transportation environment and public
1.1 Purpose of the Project
 Chapter 1 Purpose and Need for East Link Project 1.1 Purpose of the Project The purpose of the East Link Project is to expand the Sound Transit Link light rail system from Seattle to Mercer Island, Bellevue
2. Guiding Principles, Objectives, and Policies
 2. Guiding Principles, Objectives, and Policies INTRODUCTION The guiding principles for the 2040 MTP Update establish the vision and key focus areas for this planning effort. They combine the guidance
CENTRAL AND EAST CORRIDORS
 HIGH-CAPACITY TRANSIT STUDY CENTRAL AND EAST CORRIDORS SEPTEMBER 2014 CORRIDOR REPORT: KIRKLAND-BELLEVUE-ISSAQUAH HIGH-CAPACITY TRANSIT CORRIDOR STUDY Kirkland-Bellevue-Issaquah Corridor Sound Transit
Sound Transit is updating its Regional Transit Long-Range Plan, which
 Final Supplemental Environmental Impact Statement EXECUTIVE SUMMARY INTRODUCTION Sound Transit is updating its Regional Transit Long-Range Plan, which outlines the agency s vision for a high-capacity transit
Alternatives Evaluation Report. Appendix C. Alternatives Evaluation Report
 s Evaluation Report Appendix C s Evaluation Report I-35W North Corridor Project EA Minnesota Department of Transportation Final Project s Report I-35W North Corridor Preliminary Design Project Report Version
Strategies to keep people and goods moving in and through Seattle
 Strategies to keep people and goods moving in and through Seattle Period of Maximum Constraint and the Permanent Viaduct Closure 2018-2024 West Seattle Transportation Coalition September 27, 2018 Department
SEISMIC OPTIONS REPORT A PLAN FOR SEISMIC RETROFIT OF OREGON BRIDGES. Bruce V. Johnson, P.E. 1 Craig Shike, P.E. Albert Nako, P.E. Jan Six, P.E.
 SEISMIC OPTIONS REPORT A PLAN FOR SEISMIC RETROFIT OF OREGON BRIDGES Bruce V. Johnson, P.E. 1 Craig Shike, P.E. Albert Nako, P.E. Jan Six, P.E. Abstract The seismic risk in Oregon is significant. However,
With the challenges facing Washington s transportation
 CHAPTER 5 REACHING THE VISION HOW WILL WE GUIDE OURSELVES MOVING FORWARD? With the challenges facing Washington s transportation system, the project team and partners identified four focus areas that consistently
Appendix L Greenhouse Gas 4-part Strategy
 Appendix L Greenhouse Gas 4-part Strategy Supplementary information regarding options for further reducing greenhouse gas emissions in the Puget Sound region State and Federal Greenhouse Gas Emissions
South Sounder Capital Improvements Program
 Subarea South King/Pierce Primary Mode Commuter Rail Facility Type Infrastructure Improvement Length Date Last Modified July 1, 2016 PROJECT AREA AND REP RESENTATIVE ALIGNMENT SHORT PROJECT DESCRIPTION
ODOT Asset Management Plan 0
 ODOT Asset Management Plan 0 Table of Contents Executive Summary... 1 ODOT s Experience with Asset Management... 1 A New Way of Doing Business... 2 ODOT s Investment Plans... 3 Moving Forward... 5 1.0
Chapter 5 Transportation Draft
 Chapter 5 Transportation Draft Discussion Similar to the other elements in the Comprehensive Plan, the transportation element impacts the quality of life, economic development and public safety of the
EXAMPLES OF COMPREHENSIVE PLAN POLICIES HOW TO ESTIMATE THE BENEFITS OF THE CTR PROGRAM
 TABLE OF CONTENTS INTRODUCTION... I BACKGROUND OF THE COMMUTE TRIP REDUCTION EFFICIENCY ACT... II MAKING THE CONNECTION BETWEEN COMMUTE TRIP REDUCTION AND THE GROWTH MANAGEMENT ACT... IV CTR PLANNING AND
2040 Long Range Transportation Plan
 2040 Long Range Transportation Plan Executive Summary Adopted April 15, 2013 The Current Situation The George Washington Region includes the City of Fredericksburg and the counties of Caroline, King George,
May 24, 2007 Board Meeting. Making Connections Sound Transit 2 The Regional Transit System Plan For Central Puget Sound
 Making Connections Sound Transit 2 The Regional Transit System Plan For Central Puget Sound 1 Sound Transit 2 Contents Introduction...4 ST2: The Future...6 The ST2 Plan...9 Light Rail Extensions in ST2...9
6.0 CONGESTION HOT SPOT PROBLEM AND IMPROVEMENT TRAVEL DEMAND MODEL ANALYSIS
 6.0 CONGESTION HOT SPOT PROBLEM AND IMPROVEMENT TRAVEL DEMAND MODEL ANALYSIS 6.1 MODEL RUN SUMMARY NOTEBOOK The Model Run Summary Notebook (under separate cover) provides documentation of the multiple
Transportation Problems and Issues Excerpts from WWW Links
 Transportation Problems and Issues Excerpts from WWW Links Reference Bok, D. (2018). Transportation policy and planning. https://www.hks.harvard.edu/courses/transportation-policy-and-planning Transportation
Congestion Management Process (CMP)
") Congestion Management Process (CMP) Introduction The Congestion Management Process (CMP) is a systematic, data-driven, and regionally accepted approach that aims to improve the performance of the transportation
Congestion Management Process (CMP) Introduction The Congestion Management Process (CMP) is a systematic, data-driven, and regionally accepted approach that aims to improve the performance of the transportation
RESOLUTION NO
 RESOLUTION NO. 2018-12 RESOLUTION OF THE SOUTHEASTERN WISCONSIN REGIONAL PLANNING COMMISSION AMENDING THE TRANSPORTATION IMPROVEMENT PROGRAM FOR SOUTHEASTERN WISCONSIN: 2017-2020 WHEREAS, the Southeastern
FEDERAL HIGHWAY ADMINISTRATION RECORD OF DECISION FOR THE LYNNWOOD LINK EXTENSION
 FEDERAL HIGHWAY ADMINISTRATION RECORD OF DECISION FOR THE LYNNWOOD LINK EXTENSION AUGUST 2015 Table of Contents 1 Decision... 1 1.1 Project Description... 2 1.2 Basis for the FHWA Decision... 7 1.2.1
The Regional Transportation Plan Appendix D. Regional Air Quality Conformity Analysis. Puget Sound Regional Council.
 The 2018 Appendix D Regional Air Quality Conformity Analysis May 2018 Puget Sound Regional Council May 2018 Funding for this document provided in part by member jurisdictions, grants from U.S. Department
Transportation A Conversation on Regional Transportation. Tacoma City Manager April 15, Update to the Regional Transportation Plan
 Transportation 2040 Update to the Regional Transportation Plan A Conversation on Regional Transportation Tacoma City Manager April 15, 2009 1 Puget Sound Regional Council The Region: 4 counties 82 cities
I-91 Viaduct Public Information Briefing
 I-91 Viaduct Public Information Briefing Project File No. 607731 MassDOT Contract No. 85020 Briefing no. 9 September 13, 2017 Agenda Welcome and Presenter Introductions Update on Construction and Demolition
Puget Sound Regional ITS Architecture Update. Why does the region need an ITS Architecture?
 IBI GROUP 801 Second Avenue Suite 1400 Seattle WA 98104 USA tel 206 521 9091 fax 206 521 9095 ibigroup.com Memorandum To/Attention Puget Sound Regional Council Date May 26, 2015 (PSRC) From IBI Group Project
Chapter 2 Transportation Policy Plan Strategies
 Chapter 2 Transportation Policy Plan Strategies As discussed in Chapter 1, the current federal transportation law, Fixing America s Surface Transportation Act (FAST Act), mandates a streamlined and performance-based
Addendum #3 to the Regional Transportation Plan
 Nashville Area Metropolitan Planning Organization Addendum #3 to the Regional Transportation Plan Effective November 21, 2018 Nashville Area Metropolitan Planning Organization 138 Second Avenue North Nashville,
Contra Costa Transportation Authority STAFF REPORT February 15, 2017 Page 2 of 3 Background MTC is expected to seek authorization from the State Legis
 Contra Costa Transportation Authority STAFF REPORT Meeting Date: February 15, 2017 Subject Summary of Issues Regional Measure 3 (RM3) Candidate Projects for Submittal to the Metropolitan Transportation
Safety. Introduction. Total System
 Safety Introduction Ohio is the 35 th largest state in the nation based on geographic size, however it carries the 5 th largest total traffic volume and the 4 th largest truck traffic volume. With such
SOUND TRANSIT RESOLUTION NO. R Adoption of 1999 Regional Express Bus Service Plan BACKGROUND AND COMMENTS
 SOUND TRANSIT RESOLUTION NO. R99-15 Adoption of 1999 Regional Express Bus Service Plan BACKGROUND AND COMMENTS Meeting: Date: Type of Action: Staff Contact: Phone: Finance Executive 6/3/99 6/4/99 Recommend
Guidance for Responding to the Transportation 2040 Prioritization Measures
 2018 Transportation 2040 Update January 2017 Call for Projects Guidance for Responding to the Transportation 2040 Prioritization Measures Introduction The purpose of this document is to give project sponsors
CLA /10.54, PID Project Description:
 Project Description: The proposed project will consist of widening IR 70 to three lanes from Enon Road (SLM 06.75) to the US 68 interchange ramps (SLM 10.55). IR 70 is a component of the Strategic Highway
extent feasible. Per the and low constructability,
 RELEVANT PUBLIC PROJECTS AND REFERENCES TranTech is proud of its accomplishments in structural engineering. Our staff members have provided design servicess to numerous public agencies on very successful
South Sounder Capital Improvements Program
 South Sounder Capital Improvements Program Subarea South King/Pierce Primary Mode Commuter Rail Facility Type Infrastructure Improvement Length Version Draft ST3 Plan Date Last Modified March 28, 2016
12 Evaluation of Alternatives
 12 Evaluation of Alternatives This chapter evaluates the effectiveness of the No-Build Alternative and the proposed METRO Blue Line Light Rail Transit (BLRT) Extension project based on the information
Summary of transportation-related goals and objectives from existing regional plans
 SMTC 2050 Long Range Transportation Plan Appendix A: Summary of transportation-related goals and objectives from existing regional plans SMTC 2050 Long Range Transportation Plan Summary of transportation-related
WTP 2035 DRAFT STRATEGIES AND ACTIONS
 INTRODUCTION This Working Paper presents draft strategies and actions to be considered for inclusion in the draft Washington Transportation Plan 2035. It includes reference to the existing WTP 2030 strategies
MONITORING IMPLEMENTATION AND PERFORMANCE
 12 MONITORING IMPLEMENTATION AND PERFORMANCE The FAST Act continues the legislation authorized under MAP-21, which created a data-driven, performance-based multimodal program to address the many challenges
The Ohio Department of Transportation Asset Management Playbook Plays for Success
 The Ohio Department of Transportation Asset Management Playbook 2017 8 Plays for Success The Ohio Department of Transportation Asset Management Playbook 1 Contents Introduction 2 Challenge 1: Flat Funding
THE PROJECT. Executive Summary. City of Industry. City of Diamond Bar. 57/60 Confluence.
 THE PROJECT A freeway segment ranked 6th worst in the Nation, with levels of congestion, pollution and accidents that are simply unacceptable and which have Statewide and National implications. Executive
MAP-21 themes. Strengthens America s highway and public transportation systems. Creates jobs and supports economic growth
 MAP-21 themes Strengthens America s highway and public transportation systems Creates jobs and supports economic growth Supports the Department s aggressive safety agenda Simplifies and focuses the Federal
Highway and Freight Current Investment Direction and Plan. TAB September 20, 2017
 Highway and Freight Current Investment Direction and Plan TAB September 20, 2017 Today s Topics Where are we now, what are the current issues? Where do we want to go? How will we get there? What are the
PROPOSED AMENDMENT OF THE I 76 INTEGRATED CORRIDOR MANAGEMENT PROJECT TO THE CONNECTIONS 2040 PLAN FOR GREATER PHILADELPHIA
 PROPOSED AMENDMENT OF THE I 76 INTEGRATED CORRIDOR MANAGEMENT PROJECT TO THE CONNECTIONS 2040 PLAN FOR GREATER PHILADELPHIA Background and Project Description In July 2013, the Delaware Valley Regional
Conceptual Design Report
 Conceptual Design Report I-244/Arkansas River Multimodal Bridge Tulsa, Oklahoma Prepared for the Oklahoma Department of Transportation Prepared by: August 2009 I-244 / ARKANSAS RIVER MULTIMODAL BRIDGE
Policy Research CENTER
 TRANSPORTATION Policy Research CENTER New Approaches to Transportation Management (Task 1) Congestion continues to be a challenge in Texas and throughout the United States, and it is increasing, leading
Environmental Scoping Information Report
 LINK OPERATIONS AND MAINTENANCE SATELLITE FACILITY Environmental Scoping Information Report CENTRAL PUGET SOUND REGIONAL TRANSIT AUTHORITY This page intentionally left blank Table of Contents Introduction...
Washington State DOT: Pavement and Bridge Performance NPRM Comments for federal docket,
 MAP-21 NPRM for National Performance Management Measures; Assessing Pavement Condition for the National Highway Performance Program and Bridge Condition for the National Highway Performance Program The
Washington State Department of Transportation Case Study. Guidelines for the Preservation of High-Traffic-Volume Roadways (R26)
") Washington State Department of Transportation Case Study Guidelines for the Preservation of High-Traffic-Volume Roadways (R26) Background Stretching the time between major rehabilitation projects can save
Washington State Department of Transportation Case Study Guidelines for the Preservation of High-Traffic-Volume Roadways (R26) Background Stretching the time between major rehabilitation projects can save
MULTI-MODAL TRANSPORTATION SYSTEM
 MULTI-MODAL TRANSPORTATION SYSTEM The population of Pierce County and the demand on the transportation system are both expected to increase significantly over the 20-year planning period. To keep our economy
CHAPTER 2. VISION, GOALS AND MTP FRAMEWORK
 CHAPTER 2. VISION, GOALS AND MTP FRAMEWORK MTP VISION In order to create a framework for the 2040 Metropolitan Transportation Plan (MTP), a vision statement was drafted by the Vision/Goals Committee and
Proposed Comprehensive Update to the State of Rhode Island s Congestion Management Process
 Proposed Comprehensive Update to the State of Rhode Island s Statewide Planning Program January 2018 Summary Outline of of Action Steps 1. Develop Objectives for Congestion Management What is the desired
What is the Transportation Policy Plan (TPP)?
?") Summary What is the Transportation Policy Plan (TPP)? The region s long range transportation plan Includes all modes of transportation: highways, transit, airports, freight, biking, pedestrians Meets the
Summary What is the Transportation Policy Plan (TPP)? The region s long range transportation plan Includes all modes of transportation: highways, transit, airports, freight, biking, pedestrians Meets the
Minnesota Statewide Freight Bottlenecks
 Minnesota Statewide Freight Bottlenecks Transportation Performance Measures Reporting for MAP21 Compliance Oct. 1, 2018 2018 Minnesota Statewide Freight Bottlenecks Report Report Prepared by: Minnesota
NEW MEXICO LAND OF ENCHANTMENT
 Bridges CENTENNIAL 1912-2012 NM C - NEW MEXICO LAND OF ENCHANTMENT Las Cruces viaduct; finishing floor. Source: NM Department of Transportation New Mexico Infrastructure Report Card 2012: 34 Overview:
A RESOLUTION of the Board of the Central Puget Sound Regional Transit Authority adopting a revised Sound Transit 2 Regional Transit System Plan.
 SOUND TRANSIT RESOLUTION No. R2008 1 0. A RESOLUTION of the Board of the Central Puget Sound Regional Transit Authority adopting a revised Sound Transit 2 Regional Transit System Plan. WHEREAS, the Central
Appendix A Transportation Technical Analysis Methodology
 Appendix A Transportation Technical Analysis Methodology Appendix A Transportation Technical Analysis Methodology and Assumptions and Updates 1.0 Introduction The Transportation Technical Analysis Methodology
Congestion Management Process 2013 Update
 OVERVIEW OF THE DALLAS-FORT WORTH CONGESTION MANAGEMENT PROCESS Traffic Congestion In The Dallas-Fort Worth Region With the Dallas-Fort Worth (DFW) urban area as its center, the North Central Texas region
SECTION II CONTROLLED ACCESS FACILITIES
 SECTION II CONTROLLED ACCESS FACILITIES SYSTEM IDENTIFICATION A critical component of the Dallas-Fort Worth (DFW) Metropolitan Transportation System is the regional freeway and tollway systems, which are
Transportation 2040 UPDATE
 Transportation 2040 UPDATE toward a sustainable transportation system Appendix D: The Metropolitan Transportation System MAY 29, 2014 Puget Sound Regional Council Appendix D: The Metropolitan Transportation
Rail Freight and Passenger
 Take Care of the System Critical Investments in the areas of: Rail Freight rehabilitate rail bridges o Rail Bridge Inventory Database... $0.5 - $1.0 million (one time) Rail Freight rail replacement and
Corpus Christi Metropolitan Transportation Plan Fiscal Year Introduction:
 Introduction: Traffic congestion in the Corpus Christi Metropolitan area is not as much a function of population growth as the function of the increase in single occupant trips. Using census data, the
Performance Measures Workshop, May 18, 2017
 Measuring What Matters: Above and Beyond Requirements Performance Measures Workshop, May 18, 2017 Presentation Overview Background - origin and evolution of the Regional Outcomes Framework. Regional Outcomes
EXECUTIVE SUMMARY REGIONAL TRANSPORTATION PLAN 2050
 EXECUTIVE SUMMARY REGIONAL TRANSPORTATION PLAN 2050 Introduction Goals Policies, and Performance Measures Growth Forecast and Planned Land Use Development Key Recommendations i Executive Summary April
IMPROVING I 81 IN MARYLAND
 IMPROVING I 81 IN MARYLAND April 25, 2017 Stephen A. Bucy, P.E. Improving I 81 in Maryland Overview: Facts SHA s Comprehensive I 81 Strategy Current Phase 1 Widening Project Update Closing Improving I
REPORT TO THE CITY COUNCIL rd Avenue NE, Woodinville, WA
 To: From: Subject: CJTYOFWOODINVILLE, WA REPORT TO THE CITY COUNCIL 17301 133rd Avenue NE, Woodinville, WA 98072 WWW.CI.WOODINVILLE.WA.US Q Honorable City Council Richard A. Leahy, City Manager f"-v Sound
MEMORANDUM: INITIAL CONCEPTS SUMMARY
 MEMORANDUM: INITIAL CONCEPTS SUMMARY INTRODUCTION This memo presents a summary of initial concepts that have been identified as development of the project study has progressed, along with a recommendations
2016 Transit Integration Report October Puget Sound Regional Council
 October 2016 Puget Sound Regional Council Puget Sound Regional Council 2016 TRAnsIT IntegRATIon RepoRT / October 2016 Funding for this document provided in part by member jurisdictions, grants from U.S.
LOU LAMBERT, DEPUTY DIRECTOR BUREAU OF TRANSPORTATION PLANNING
 LOU LAMBERT, DEPUTY DIRECTOR BUREAU OF TRANSPORTATION PLANNING FIVE MAJOR AREAS Evolving Process of Strategic Analysis New Paradigm in Transportation Current Activities in Asset Management Michigan Business
Highway and Freight Current Investment Direction and Plan. TAC August 2, 2017
 Highway and Freight Current Investment Direction and Plan TAC August 2, 2017 Today s Topics Highway & Freight Where are we now? The Highway Story What are the issues? How is the system performing? Where
I-66 Corridor Improvements Outside the Capital Beltway in Northern Virginia, USA
 15th International Conference on Managed Lanes I-66 Corridor Improvements Outside the Capital Beltway in Northern Virginia, USA Case Study for Funding of Transit Service and Transportation Demand Management
Management. VA SITE Annual Meeting June 27, 2013 Jay Styles Performance and Strategic t Planning Manager, Business Transformation Office
 VDOT and MAP-21 Performance Management VA SITE Annual Meeting June 27, 2013 Jay Styles Performance and Strategic t Planning Manager, Business Transformation Office Overview Map-21- How is VDOT Preparing?
Going Forward The Plan to Maintain & Improve Mobility Frequently Asked Questions (FAQs)
") Going Forward The Plan to Maintain & Improve Mobility Frequently Asked Questions (FAQs) What is Going Forward The Plan to Maintain & Improve Mobility (Plan) and why does the region need a Long Range Transportation
Going Forward The Plan to Maintain & Improve Mobility Frequently Asked Questions (FAQs) What is Going Forward The Plan to Maintain & Improve Mobility (Plan) and why does the region need a Long Range Transportation
VTrans2040 Multimodal Transportation Plan Corridors of Statewide Significance Needs Assessment Western Mountain Corridor (L)
") VTrans2040 Multimodal Transportation Plan Corridors of Statewide Significance Needs Assessment Western Mountain Corridor (L) 77 Table of Contents I. Corridor Overview Land Use and Demographics Corridor
VTrans2040 Multimodal Transportation Plan Corridors of Statewide Significance Needs Assessment Western Mountain Corridor (L) 77 Table of Contents I. Corridor Overview Land Use and Demographics Corridor
35 Moving Forward. O p t i m i z a t i o n P l a n E x e c u t i v e S u m m a r y. Project # KA Johnson and Wyandotte Counties
 Moving Forward Johnson and Wyandotte Counties Project # -106-KA-2597-01 O p t i m i z a t i o n P l a n E x e c u t i v e S u m m a r y June 2013 I- Corridor Optimization Plan Executive Summary Study Purpose
Future System Planning (ST4)
") Future System Planning (ST4) Subarea All Primary Mode Policies and Programs Facility Type Length Version Draft ST3 Plan Date Last Modified March 28, 2016 PROJECT AREA AND REPRESENTATIVE ALIGNMENT SHORT
Future System Planning (ST4) Subarea All Primary Mode Policies and Programs Facility Type Length Version Draft ST3 Plan Date Last Modified March 28, 2016 PROJECT AREA AND REPRESENTATIVE ALIGNMENT SHORT
MOBILITY 2045: A FOCUS ON TRANSPORTATION CHOICE:
 Mobility 2045: The Metropolitan Transportation Plan for North Central Texas is the defining vision for the multimodal transportation system in the Dallas- Fort Worth Metropolitan Planning Area. The plan,
Chapter 5: Highway Investment Direction and Plan
 5.1 Chapter 5: Highway Investment Direction and Plan 2040 2040 TRANSPORTATION POLIC PLAN version 1.0 5.2 Chapter 5: Highway Investment Direction and Plan Highway Investment Direction 3 Current Revenue
Jacobs Engineering Group Inc. 319 E. Warm Springs Road, Suite 200 Las Vegas, NV 89119
 Managed Lanes and Ramp Metteriing Manuall Parrtt 1:: IInttrroducttiion and Polliiciies Prreparred fforr:: Nevada Department of Transportatiion December 2013 Jacobs Engineering Group Inc. 319 E. Warm Springs
INVESTMENT SCENARIOS CHAPTER Illustrative Investment Approaches Public Outreach 6-1
 CHAPTER 6 As detailed in Chapters 4 and 5, Texas multimodal transportation needs estimated at $21 billion annually (2014 constant dollars) illustrated in Exhibit 4-12 far outstrip the approximately $9.1
Intelligent Transportation Systems
 Intelligent Transportation Systems TABLE OF CONTENTS Introduction... 3 Background... 3 Existing Conditions... 4 Traffic Signals... 4 Transit... 6 Parking... 6 Staffing... 7 Best Practices... 8 Recommendations...