State of the Practice in Freight Modeling at State DOT s
|
|
|
- Frederick Rose
- 5 years ago
- Views:
Transcription
1 State of the Practice in Freight Modeling at State DOT s Presented to the Freight Demand Modeling: Tools for Public-Sector Decision Making Conference Washington DC September 25, 2006 By Gregory Giaimo, PE Ohio Department of Transportation
2 Context of Freight Modeling at State DOT s Almost invariably part of a larger statewide passenger and freight model Models developed primarily to study intercity highway corridors Prior to 1990 s, very few such models due to lack of computers and methods Since then about half the states have developed or are developing models
3 Statewide Model Status Source: NCHRP Synthesis 358, Statewide Travel Forecasting Models
4 Freight Model Types Freight modeling is handled in one of four ways by state DOT models 1. None 2. Traditional 3. Commodity Based 4. Integrated Land Use/ Economic/ Commodity Based
5 Freight Model Type by Peer Exchange Participants and NonParticipants Not 4 Peer Exchange None Traditional Commodity Econometric Unknown Source: TRB Electronic Circular E-C075: Statewide Travel Demand Modeling A Peer Exchange
6 Statewide Freight Model Components Summary VI. Freight/ Commercial FL IN KY LA MA MO Modes Included Modes Excluded Commodity Based Matrix Estimation HWY (net based), RR, Intermodal All others excluded because no sig. impact and difficult to estimate Yes New model may HW Y (commercial & heavy trk) HWY HWY HWY None Model built in response to All others due to needs which All others by budget & focus were hwy based design of project Data & project focus No No (but see below) Yes Yes No No Yes, original seed based on commodity flow Yes, to estimate trucks not covered by Transearch Yes, to estimate trucks not covered by Transearch No No For portion not covered by Transearch Yes, QRM methods No QRM for non-freight Fratar/QRM for Traditional Methods trucks forecasts No Transearch/CFS Yes/Transearch No Yes/Transearch Yes/Transearch No No NH NJ OH OR VA WI Modes Included None HWY HWY, RR, H2O, AIR emphases is trucks Gen1:HWY Gen2: Multimodal HWY HWY, RR, H2O, AIR Modes Excluded No Pipeline Gen1 for time/cost RR, H2O, AIR not explicitly model due to budget but forecasts from Transearch are Pipeline Commodity Based No No Yes Yes Yes Yes Matrix Estimation No No Interim model only No Yes, for portion not covered by Transearch No Traditional Methods No QRM Techniques Interim model only No Yes, estimates of non-freight components not included in Transearch are made Yes, 4 step techniques used at commodity level, VIUS and AADT factors Transearch/CFS No No Yes/Transearch Yes/CFS Yes/Transearch Yes/Transearch Source: TRB Electronic Circular E-C075: Statewide Travel Demand Modeling A Peer Exchange
7 Statewide Models with No Freight Component Some small states have models exactly analogous to urban passenger travel demand models Example: New Hampshire
8 Traditional Models Smaller states and states with more mature statewide models sometimes employ traditional methods from passenger demand forecasting This involves direct generation of trucks, generally using regression equations or trip rates Distribution via gravity model or Fratar methods Often employs Quick Response methods from the Quick Response Freight Manual (Report DOT-T-97-10) Example: New Jersey
9 Traditional Truck Modeling Input Data 1 Trip Generation 2 Daily. Economic Activity Data. # of Employees and Households by Traffic Analysis Zone (TAZ) and by Land Use (SIC). Trip Generation Rate by Truck Type and Land Use Classification Trips at External Stations 3 Daily. Internal-to-external trips. External-to-internal trips. External-to-external (through) trips j Trip Distribution 4 Daily i. Gravity Model (Travel Time t ij ). Zone to Zone / Station to Station Peak Off-Peak tij Trip Assignment 5 Daily Load Truck VMT onto Network Peak Off-Peak Control VMT 6 Compare Control VMT with Estimated VMT 7 Daily. Regional VMT Estimates. Vehicle Classification Data Convergence Criteria Met? Yes No Peak Off-Peak OUTPUT Daily Balanced Truck Trip Table and Truck Flows Peak Off-Peak Source: Quick Response Freight Manual, Report DOT-T-97-10
10 Traditional Truck Modeling Gravity Model Functions Source: Quick Response Freight Manual, Report DOT-T-97-10
11 Commodity Based Models This approach models commodity flows These flows are then converted to trucks, trains etc., generally using static mode and payload factors by commodity (and sometimes distance) This is the most common approach
12 Commodity Based Models (cont.) Almost universally, these approaches obtain their commodity flow data from the Commodity Flow Survey or the Transearch database The Vehicle Inventory and Use survey is often used to develop payload factors IO tables are typically needed to relate production and consumption industries
13 Commodity Based Models (cont.) These methods suffer from 2 main data limitations: 1. Lack of geographic specificity Commodity flow data is typically at the county level requiring disaggregation of flows to TAZ level using employment factors by industry 2. Missing industries/commodities These sources do not have universal coverage, thus this approach is often combined with matrix estimation techniques to account for the missing movements

14 Data Sources and Modes in Statewide Freight Models Payload Factors for Statewide Models Modes Represented in Statewide Freight Models Source: NCHRP Synthesis 358, Statewide Travel Forecasting Models
15 Commodity Based Models (cont.) There are 2 general approaches employed in this category 1. Use growth factors to project base year commodity flows to the future 2. Develop a model relating base year commodity flows to socio-economic variables and apply in the future
16 Commodity Based Models (cont.) 1. Growth Factor Method Commodity flows converted to trucks and assigned Missing trucks accounted for using matrix estimation techniques (some states such as Florida and Indiana use QRFM techniques to account for the missing trucks) Fratar method used to adjust commodity and truck flows in the future based on growth in socio-economic indicators Example: Virginia
17 Virginia Statewide Model Freight Component Source: NCHRP Synthesis 358, Statewide Travel Forecasting Models

18 Virginia Statewide Model Zones Source: NCHRP Synthesis 358, Statewide Travel Forecasting Models
19 Commodity Types and Payload Factors for Virginia Source: NCHRP Synthesis 358, Statewide Travel Forecasting Models
20 Commodity Based Models (cont.) 2. Commodity Demand Model Method Relationships between commodity flows and industry specific socio-economic variables developed This results in traditional generation and distribution models at the commodity level Special generators and labor force productivity must be explicitly taken into account Commodities converted to mode using fixed shares Example: Wisconsin

21 Wisconsin Statewide Model Freight Component Source: NCHRP Synthesis 358, Statewide Travel Forecasting Models
22 Trip Generation, Commodity Types and Payload Factors for Wisconsin Source: NCHRP Synthesis 358, Statewide Travel Forecasting Models
23 Integrated Land Use/ Economic/ Commodity Models This approach also models commodity flows The main difference from the previous type is the explicit econometric and land use models which feed commodity flows to the transport models Thus base year commodity flows are used to estimate these economic models rather than as an exogenous input Examples: Ohio, Oregon
24 Comparison of Oregon and Ohio Implementations Both have land use and economic models feeding them There are two main differences: 1. Ohio s approach accounts for non-freight travel in its disaggregate commercial vehicle model This model, estimated from establishment surveys, explicitly accounts for the commercial vehicle travel (including much short distance goods movement) not covered in the national commodity flow sources This then also represents a major point of departure from the other commodity based models which typically use matrix estimation or quick response techniques to account for this travel (if at all) 2. Oregon s approach contains a more detailed representation of the multi-modal, inter-modal system and seeks a more explicit treatment of the routing/mode choice/shipment size behavior of the freight system Does not include the non-freight commercial vehicle travel
25 Ohio Model Elements of the Ohio Model related to freight will be demonstrated for illustrative purposes The four components directly related to the creation of freight flows will be hi-lighted: 1. Interregional Economic Model 2. Activity Allocation Model 3. Aggregate Commercial Vehicle Model 4. Disaggregate Commercial Vehicle Model
26 Ohio Integrated Land Use/Economic/Transport Model Interregional Economic Model Aggregate Demographic Model Land Development Model Activity Allocation Model Disaggregate Household Synthesis and Employment Spatial Disaggregation Models Short Distance Travel Model Long Distance Travel Model Visitor Model Aggregate Commercial Vehicle Model Disaggregate Commercial Vehicle Model Assignment Model
27 Model Modules Interregional economic model of production & consumption by economic sector reflecting national forecasts Demographic model tied to economic activity reflecting migration and changes in population & household composition Activity allocation model to distribute model area economic and demographic forecasts to analysis zones with the related flows of goods, services & labor among zones from which travel demands are derived Land development model simulating developer behavior in response to demands & prices by type by zone consistent with zoning & other development constraints Personal & household travel model reflecting person & household characteristics, zonal characteristics, inter-zonal economic flows & transport system supply characteristics, 2 components: short distance which looks like an activity/tour based urban area model and long distance, also tour based with purposes: business, recreation, other
28 Model Modules Aggregate model of goods and services transport arising from economic and demographic activity by zone very similar to the typical DOT commodity based transport model Disaggregate model of business-related person travel related to management functions, sales & support activities, provision of services and some short distance goods delivery. Model of visitor travel within and into the model area made by nonresidents Transport system supply model incorporating air, intercity bus/rail, MPO transit & roadway networks with their corresponding level-ofservice characteristics
29 Interregional Economic Model Establishes forecast flows of goods, services and labor (in $) between 14 regions of North America Uses exogenous national economic conditions and production composite utilities from the previous time step of the lower level models An inter-regions social accounting matrix based primarily upon IMPLAN data
30 Industry Employee Proprietor Indirect Total Output* Employment Compensation* Income* Income* Business Tax* Value Added* Region1 $716,166 7,966,019 $228,234 $21,666 $97,448 $27,562 $374,910 Region2 $549,640 5,250,326 $175,241 $11,328 $71,412 $19,524 $277,505 Region3 $1,631,352 16,534,837 $580,641 $70,729 $272,386 $75,873 $999,630 Region4 $1,258,568 12,878,897 $444,828 $47,631 $217,457 $61,111 $771,027 Region5 $1,315,875 15,632,564 $464,473 $40,713 $211,292 $57,678 $774,155 Region6 $159,981 1,927,710 $48,863 $5,282 $21,446 $7,229 $82,820 Region7 $1,578,235 19,633,779 $533,452 $55,056 $245,220 $72,198 $905,927 Region8 $277,576 3,077,661 $85,579 $8,885 $36,968 $9,938 $141,370 Region9 $987,168 10,362,852 $323,315 $32,811 $149,933 $41,378 $547,438 Region10 $3,841,148 43,334,759 $1,251,396 $172,516 $613,615 $173,929 $2,211,456 Region11 $1,814,957 20,563,180 $554,248 $84,581 $305,219 $80,778 $1,024,826 *Millions of dollars

31 Exogenous Economic Indicators Nation Economic Forecast Variables National Economic Growth Billions $20,000 $19,000 $18,000 $17,000 $16,000 $15,000 $14,000 $13,000 $12,000 $11,000 $10, Slow Growth Moderate Growth High Growth
32 Industry Groups and Their Relation to IMPLAN Sectors Industry Code Industry IMPLAN Sectors Production Non- Production 1 Agriculture, Forestry and Fisheries 1-27 Agricultural land Office land 2 Primary Metal Products Heavy industrial land Office land 3 Light Industry 4 Heavy Industry , , , ,58-60, , , , Transportation Equipment Light industrial land Heavy industrial land Heavy industrial land Office land Office land Office land 6 Wholesale 447 Warehouse land Office land 7 Retail Retail land Office land 8 Hotel and Accommodation 463 Accommodation land 9 Construction Construction 10 Health Care Hospital and institutional land 11 Transportation Handling Depot land 12 Utilities Services Heavy industrial land 13 Other Services , , ,494, Retail land 14 Gradeschool Education Gradeschool land Post-Secondary 15 Education Institutional space 16 Government and Other , Government support space 17 Dummy NA NA NA 18 Inventory Valuation Adjustment NA NA NA
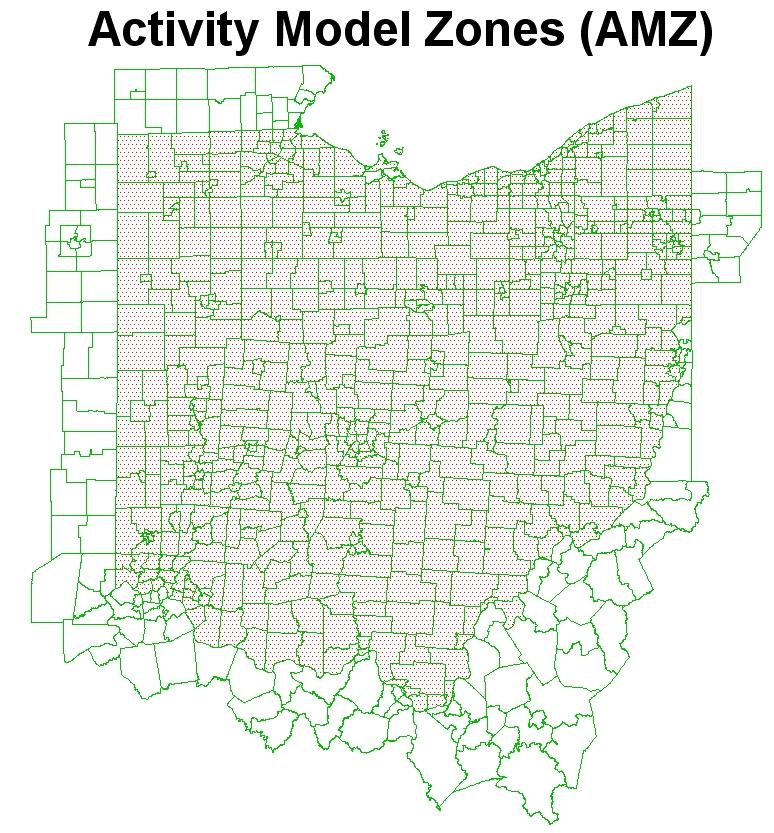
33 Activity Allocation Model Subdivides economic activities to ~700 activity model zones (AMZ) within the internal model area Logit Model with terms for: Size (amount of stuff in the zone) Inertia (previous period amount) Buying/selling utilities including cost of transport Additional taxes, subsidies etc.
34 Activity Allocation Model Inputs include: Regional flows from Interregional Economic Model Land by category by AMZ from Land Use Model People from Aggregate Demographic Model Transport costs from previous iteration of Transport Models
35
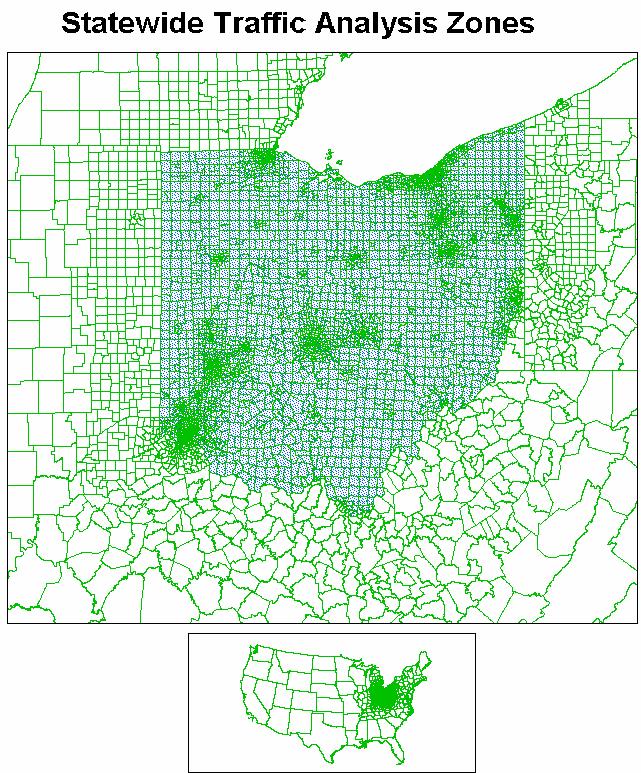
36 Aggregate Commercial Vehicle Model With the commodity flows established, the aggregate commercial vehicle model itself is very similar to the commodity representation in other statewide models Input is dollars of flow of goods, services and labor at the AMZ level Output is flows of trucks between Traffic Analysis zones (TAZ) Note: the distinction between AMZ and TAZ was due to computation times only, there was no theoretical or data limitation reason why the AA model could not produce TAZ level flows directly)
37 Aggregate Commercial Vehicle Model Flow Chart Total Dollars flows by AMZ Determine Mode By commodity class, by distance with a variable to relate train to highway impedance, based on CFS Convert Goods Flows to Tons By commodity class and distance, from CFS Determine Truck Type By commodity class and distance, from VIUS Determine Number of Truck Loads By commodity class and truck type, from VIUS Determine TAZ Based on employment levels by industry class Determine Trucks by Hour of Day Trucks by type by hour by OD TAZ Based on traffic counts, conversion from annual to weekday assumes 300 equivalent week days per year. This value is obtained as follows: (52 * 5) weekdays plus (52 * 2 * 0.44) weekday equivalents for weekends minus 6 holidays.
38
39 Rail Network & Intermodals

40 Highway Network

41 Truck Mode Shares by Distance and Commodity < 50 SCTG DESCRIPTION 01 Live animals and fish Cereal grains Other ag products Animal feed and products Meat/fish/seafood Milled grain and bakery products Prepared foodstuffs, n.e.c Alcoholic beverages Tobacco products Monumental or building stone Natural sands Gravel or crushed stone Non-metallic minerals, nec Metallic ores Coal Gasoline and aviation fuel Fuel oils Petroleum products, n.e.c Basic chemicals Pharmaceutical products Fertilizers Chemical products Plastics and rubber Forest products Wood products Pulp/newsprint/paper Converted paper products Printed products Textiles and leather products Non-metallic mineral products Base metals Metal articles Machinery Computer equipment and software Vehicles and parts Transport equipment, n.e.c Precision instruments Furniture and furnishings Misc manufactured products Waste or scrap Mixed freight ALL to to to to to Total

42 Dollar to Ton Conversion by Distance and Commodity < to 99 SCTG DESCRIPTION 01 Live animals and fish 850 1,000 1,040 1,190 1,380 1,630 1,590 1, Cereal grains , Other ag products , Animal feed and products , Meat/fish/seafood 2,410 2,130 2,040 2,090 2,300 2,720 2,760 2, Milled grain and bakery products 1,210 1,160 1,220 1,210 1,350 1,350 1,440 1, Prepared foodstuffs, n.e.c ,150 1,420 1,580 1, Alcoholic beverages 1,260 1, , ,350 1, Tobacco products 9,260 11,680 13,150 26,200 29,690 31,440 31,380 13, Monumental or building stone , Natural sands Gravel or crushed stone Non-metallic minerals, nec Metallic ores ,340 1,150 1,660 9, Coal Gasoline and aviation fuel Fuel oils Petroleum products, n.e.c Basic chemicals ,170 1,730 1,580 7, Pharmaceutical products 19,230 26,980 31,330 20,790 14,860 23,020 25,070 22, Fertilizers Chemical products 2,310 1,980 1,970 2,270 2,710 3,100 3,710 2, Plastics and rubber 2,360 1,750 1,870 2,670 2,900 3,010 3,630 2, Forest products , Wood products ,000 1, Pulp/newsprint/paper 1, , , Converted paper products 1,110 1,110 1,320 1,660 1,890 1,850 2,280 1, Printed products 2,010 3,880 5,280 4,390 4,520 6,760 5,900 3, Textiles and leather products 6,710 8,510 6,460 7,620 8,830 10,740 13,260 8, Non-metallic mineral products , Base metals ,110 1,350 1,790 2, Metal articles 2,330 1,940 1,950 2,140 2,190 2,170 4,050 2, Machinery 7,800 8,310 7,270 8,160 8,210 9,340 10,220 8, Computer equip. and software 20,990 16,760 17,150 15,310 15,140 23,000 28,350 20, Vehicles and parts 4,510 5,530 5,450 5,470 6,450 7,200 7,440 5, Transport equipment, n.e.c. 27,040 21,280 11,160 11,350 13,140 22,280 47,590 18, Precision instruments 54,400 27,600 39,850 50,200 37,240 64,300 68,480 50, Furniture and furnishings 5,330 4,440 4,590 4,680 4,610 4,780 5,120 4, Misc. manufactured products 1,620 3,850 3,970 5,080 6,080 6,860 9,800 3, Waste or scrap Mixed freight 1,960 1,960 2,270 2,640 1, ,620 3,600 2,110 TOTAL ,220 2,050 2,760 3,310 5, to to to to or more TOTAL
43 Truck Type by Distance and Commodity LIGHT TRUCKS MILECLASS SCTGRP ALL ALL MEDIUM TRUCKS MILECLASS SCTGRP ALL ALL LT-HVY TRUCKS MILECLASS SCTGRP ALL ALL HEAVY TRUCKS MILECLASS SCTGRP ALL ALL

44 Payload Factors by Distance and Commodity VIUS2002 VEHICLE SIZE PROD# SCTG# SCTG DESCRIPTION LT MED LTHVY HVY ALL Live animals and fish Cereal grains Other ag products Animal feed and products Meat/fish/seafood Milled grain and bakery products Prepared foodstuffs, n.e.c Alcoholic beverages Tobacco products Monumental or building stone Natural sands Gravel or crushed stone Non-metallic minerals, nec Metallic ores Coal Gasoline and aviation fuel Fuel oils Petroleum products, n.e.c Basic chemicals Pharmaceutical products Fertilizers Chemical products Plastics and rubber Forest products Wood products Pulp/newsprint/paper Converted paper products Printed products Textiles and leather products Non-metallic mineral products Base metals Metal articles Machinery Computer equipment and software Vehicles and parts Transport equipment, n.e.c Precision instruments Furniture and furnishings , 23, Misc manufactured products , Waste or scrap Mixed freight X2 Hazardous Waste X3 Mail X4 Empty Containers X5 Passengers X6 Multiple Categories X7 Other ALL
45 Disaggregate Commercial Vehicle Model DCOM is designed to account for short distance commercial travel not related to the long distance shipping of freight (accounted for in ACOM) Long distance business travel is accounted for in the Long Distance Travel model of the personal transport model since these trips were obtained in the special long distance travel survey
46 Disaggregate Commercial Vehicle Model Employs a tour based microsimulation of employees Based on establishment surveys Analogous to HH based tour based model but based at the place of work Does not include route delivery vehicles
47 Disaggregate Commercial Vehicle Model Employment categorized as: Industrial Wholesale Retail Transportation Handling Service
48 Disaggregate Commercial Vehicle Trip purposes: Model Service Meeting Goods (delivery) Other (includes such things as stopping for lunch or fuel)
49 Disaggregate Commercial Vehicle Model Zonal Land Use Data Worker Traveler Generation Vehicle Assignment Starting Time Assignment Dynamic Activity Pattern Generation Next Stop Purpose Choice Model Next Stop Location Choice Model Post-Processor Commercial Vehicle Trip List
50 Disaggregate Commercial Vehicle Model Generation of a traveler done via logit Vehicle type by logit (light, medium, heavy) Start time from static distributions by industry and vehicle type Heart of the model is the next stop purpose choice model, decision to change to another purpose/location is made at 5 minute intervals based on activity state transitions Next stop location choice is a destination choice model
51 Possible Activity State Transitions with Intensity Rates, π(k k) Starting Activity States k' Stay at Current Activity New Goods Stop Destination Activity States k New Service New Other Stop Stop New Meeting Stop Return to Establishment At Establishment π(k',k) π(k',k) π(k',k) π(k',k) π(k',k) n/a 1.00 At Goods Stop π(k',k) π(k',k) π(k',k) π(k',k) π(k',k) π(k',k) 1.00 At Service Stop π(k',k) π(k',k) π(k',k) π(k',k) π(k',k) π(k',k) 1.00 At Other Stop π(k',k) π(k',k) π(k',k) π(k',k) π(k',k) π(k',k) 1.00 At Meeting Stop π(k',k) π(k',k) π(k',k) π(k',k) π(k',k) π(k',k) 1.00 Sum
52 Top 10 Challenges Impeding Development of Freight Models by State DOT s 1. Lack of DATA 2. Lack of DATA 3. Lack of DATA 4. Lack of DATA 5. Lack of DATA 6. Lack of DATA 7. Lack of DATA 8. Lack of DATA 9. Lack of Money 10.Lack of better theoretical formulations (but see 1-8 for why this is the case)
53 Questions?
Importance of the Commodity Flow Survey (CFS) in Developing the Freight Analysis Framework (FAF)
 in Developing the Freight Analysis Framework (FAF)") Bureau of Transportation Statistics Importance of the Commodity Flow Survey (CFS) in Developing the Freight Analysis Framework (FAF) Annual Meeting Transportation Research Board January 14, 2015 Michael
Bureau of Transportation Statistics Importance of the Commodity Flow Survey (CFS) in Developing the Freight Analysis Framework (FAF) Annual Meeting Transportation Research Board January 14, 2015 Michael
Evolutionary Development of Revolutionary Models. Presentation Overview
 Evolutionary Development of Revolutionary s The experience of Ohio DOT in the development of an advanced practice model Presented at the TRB Conference on Meeting Federal Surface Transportation Requirements
Statewide Multi-Modal Freight Model
 Statewide Multi-Modal Freight Model presented to MTF Freight Modeling Session presented by Maren Outwater and Colin Smith, RSG June 19, 2013 Outline Supply Chain and Logistics Models Model steps Integration
Maryland Statewide Transportation Model (MSTM)
") Maryland State Highway Administration (MD SHA) Maryland Statewide Transportation Model (MSTM) TRB Meeting Federal Surface Transportation Requirements in Statewide and Metropolitan Transportation Planning:
Maryland State Highway Administration (MD SHA) Maryland Statewide Transportation Model (MSTM) TRB Meeting Federal Surface Transportation Requirements in Statewide and Metropolitan Transportation Planning:
THE TRANSSHIPMENT PROBLEM IN TRAVEL FORECASTING: PRELIMINARY ANALYSIS OF THE ONTARIO COMMERCIAL VEHICLE SURVEY
 THE TRANSSHIPMENT PROBLEM IN TRAVEL FORECASTING: PRELIMINARY ANALYSIS OF THE ONTARIO COMMERCIAL VEHICLE SURVEY University of Wisconsin Milwaukee Paper No. 09-2 National Center for Freight & Infrastructure
Freight Transportation Planning and Modeling Spring 2012
 Freight Model Validation Techniques Abstract Several reviews of validation techniques for statewide passenger and freight models have been published over the past several years. In this paper I synthesize
Florida Multimodal Statewide Freight Model
 Florida Multimodal Statewide Freight Model Model inputs and structure, and integration with regional truck-touring models Presented by Colin Smith, RSG Freight Issues in Florida Florida has a large, complex,
THE TRANSSHIPMENT PROBLEM IN TRAVEL FORECASTING: TOUR STRUCTURES FROM THE ONTARIO COMMERCIAL VEHICLE SURVEY
 THE TRANSSHIPMENT PROBLEM IN TRAVEL FORECASTING: TOUR STRUCTURES FROM THE ONTARIO COMMERCIAL VEHICLE SURVEY University of Wisconsin Milwaukee Paper No. 09-3 National Center for Freight & Infrastructure
Task 6.4 Freight Trends and Forecasts
 Task 6.4 Freight Trends and Forecasts AMATS Freight Mobility Study Prepared for AMATS Prepared by Anchorage, AK March 15, 2016 Contents 1 Introduction... 1 2 All Modes... 1 3 Highway Cargo... 8 3.1 Base
New Mexico Statewide Model
 New Mexico Statewide Model Fifth Largest State in land area 2005 Population 1.97 million 42% of state in Albuquerque and Santa Fe area Outside urban areas population density very low New Mexico Planning
Kentucky Statewide Travel Model (KYSTM) Rob Bostrom Wilbur Smith Associates Combined Kentucky-Tennessee Model Users Group Meeting Bowling Green, KY
 Rob Bostrom Wilbur Smith Associates Combined Kentucky-Tennessee Model Users Group Meeting Bowling Green, KY") Kentucky Statewide Travel Model (KYSTM) Rob Bostrom Wilbur Smith Associates Combined Kentucky-Tennessee Model Users Group Meeting Bowling Green, KY October 26, 2006 Presentation Overview Overview of statewide
Kentucky Statewide Travel Model (KYSTM) Rob Bostrom Wilbur Smith Associates Combined Kentucky-Tennessee Model Users Group Meeting Bowling Green, KY October 26, 2006 Presentation Overview Overview of statewide
Residential Multifamily res. Retail Industrial Vacant
 Land Use Zone Residential Multifamily res. Retail Industrial Vacant Residential Multifamily res. Retail Industrial Vacant Residential Multifamily res. Retail Industrial Vacant Make and use coefficients
FDOT FREIGHT PERFORMANCE MEASURES
 FDOT FREIGHT PERFORMANCE MEASURES 1 PEOPLE FREIGHT Transit MODE QUANTITY QUALITY ACCESSIBILITY UTILIZATION Auto/Truck Pedestrian Bicycle Aviation Rail Seaports Truck Aviation Rail Seaports Vehicle Miles
Central Minnesota. Regional Freight Profile
 Central Minnesota Regional Freight Profile Working DRAFT May 21 Minnesota Department of Transportation The purpose of the Central Regional Freight Profile is to document freight movement trends in the
Technical Team Meeting #1 September 4, 2014
 Technical Team Meeting #1 September 4, 2014 Bill Gardner Minnesota DOT Director, Office of Freight and Commercial Vehicle Operations Align with MAP-21 recommendations and other Federal and State guidelines
CHAPTER 9 TRAVEL DEMAND MODEL SUMMARY
 CHAPTER 9 TRAVEL DEMAND MODEL SUMMARY This chapter describes the OKI / MVRPC regional travel demand model, used to support traffic and transit forecasts for the NSTI study. This model is based on version
Florida Freight Supplychain Intermodal Model
 Florida Freight Supplychain Intermodal Model Innovations in Travel Modeling 2014 April 29, 2014 Introduction Support freight plan development Office of Freight Logistics and Passenger Operations Evaluate
This table has been produced by. The State & Regional Fiscal Studies Unit, University of Missouri-Columbia
 Table B-39 NAICS Component *1987 1988 1989 1990 1991 1992 All industry total 6,076,695 6,398,624 6,540,047 6,638,210 6,627,809 6,828,525 Private industries 5,195,468 5,492,391 5,612,260 5,690,087 5,677,736
Wisconsin Statewide Model
 Wisconsin Statewide Model Outline of a Proposed Approach presented by Kimon Proussaloglou Cambridge Systematics, Inc. January 12, 2004 Project Team Wisconsin DOT Doug Dalton, Project Manager Don Uelmen,
NC State Freight Plan
 NC State Freight Plan NCARPO Quarterly Meeting January 26, 2017 Agenda NC Freight Tool Freight System Designation Update on Schedule and Tasks Next Steps 1 NC FREIGHT TOOL NC Freight Tool Overview Based
Modeling Truck Movements: A Comparison between the Quick Response Freight Manual (QRFM) and Tour-Based Approaches
 and Tour-Based Approaches") International Journal of Engineering Science Invention ISSN (Online): 2319 6734, ISSN (Print): 2319 6726 Volume 5 Issue 11 November 2016 PP. 45-51 Modeling Truck Movements: A Comparison between the Quick
International Journal of Engineering Science Invention ISSN (Online): 2319 6734, ISSN (Print): 2319 6726 Volume 5 Issue 11 November 2016 PP. 45-51 Modeling Truck Movements: A Comparison between the Quick
3.0 Trends and Forecasts
 3.0 Trends and Forecasts 3.1 Metropolitan Planning Area... 3-1 3.2 Population & Employment... 3-3 3.3 Land Use and Real Estate Development... 3-5 3.4 Freight Commodities... 3-10 3.1 Metropolitan Planning
9. TRAVEL FORECAST MODEL DEVELOPMENT
 9. TRAVEL FORECAST MODEL DEVELOPMENT To examine the existing transportation system and accurately predict impacts of future growth, a travel demand model is necessary. A travel demand model is a computer
CALIBRATION OF THE GRAVITY MODEL FOR TRUCK FREIGHT FLOW DISTRIBUTION
 Research Report No. UVACTS-5-14-14 August 2002 CALIBRATION OF THE GRAVITY MODEL FOR TRUCK FREIGHT FLOW DISTRIBUTION by Shaohui Mao Dr. Michael J. Demetsky II A Research Project Report For the Mid-Atlantic
TRANSEARCH Data for Planning in Tennessee. By Jerry Everett The University of Tennessee, Knoxville
 TRANSEARCH Data for Planning in Tennessee By Jerry Everett The University of Tennessee, Knoxville Scope of My Presentation Our Data Related Project Tasks The Data s Characteristics Examples of Analysis
Intermodal Freight Transportation Planning Using Commodity Flow Data. Final Report
 Intermodal Freight Transportation Planning Using Commodity Flow Data Final Report Yunlong Zhang Department of Civil Engineering Mississippi State University Royce O. Bowden, Jr. Department of Industrial
1. INTRODUCTION AND BACKGROUND
 1. INTRODUCTION AND BACKGROUND Transportation planning has focused on moving people efficiently and safely. Freight demand modeling and assignment have received limited attention with little or no integration
This table has been produced by. The State & Regional Fiscal Studies Unit, University of Missouri-Columbia
 Table B-39 NAICS Component 1963 1964 1965 1966 1967 1968 1969 1970 1971 All industry total 607,008 650,513 704,697 767,075 811,782 887,569 962,902 1,012,299 1,097,173 Private industries 534,043 572,138
California Statewide Interregional Integrated Modeling (SIIM) Framework. California STDM. HBA Specto Incorporated ULTRANS, UC Davis
 Framework. California STDM. HBA Specto Incorporated ULTRANS, UC Davis") California Statewide Interregional Integrated Modeling (SIIM) Framework California STDM HBA Specto Incorporated ULTRANS, UC Davis SIIM Advisory Group Meeting June 2010 model-wide economic / demographic
California Statewide Interregional Integrated Modeling (SIIM) Framework California STDM HBA Specto Incorporated ULTRANS, UC Davis SIIM Advisory Group Meeting June 2010 model-wide economic / demographic
Development of a Statewide Freight Trip Forecasting Model for Utah
 Development of a Statewide Freight Trip Forecasting Model for Utah Kaveh Shabani (Corresponding Author) Resource Systems Group Salt Lake City, Utah Phone: 0--00 Email: kaveh.shabani@rsginc.com Chad Worthen
Subtask Report - Review of Sub-National Commodity Flow Data Development Efforts and National Freight-Related Data Sets.
 NCFRP 20: Developing Sub-National Commodity Flow Data Subtask Report Subtask Report - Review of Sub-National Commodity Flow Data Development Efforts and National Freight-Related Data Sets literature review
BTS State and Freight Data Products. Freight in the Southeast Biloxi, MS March 19, 2015
 BTS State and Freight Data Products Freight in the Southeast Biloxi, MS March 19, 2015 Major BTS Freight Data Programs Commodity Flow Survey (CFS) Freight Analysis Framework (FAF) Cooperative effort with
NEW YORK TRANSPORTATION FACTS ECONOMIC IMPACTS
 The 2015 U.S. Transportation Construction Industry Profile: New York page 1 NEW YORK TRANSPORTATION FACTS ECONOMIC IMPACTS The design, construction and maintenance of transportation infrastructure in New
FORECASTING FUTURE FREIGHT GROWTH
 Technical Memorandum FORECASTING FUTURE FREIGHT GROWTH Prepared by: June 2014 TABLE OF CONTENTS 1. Purpose and Data Sources... 1 1.1 Purpose... 1 1.2 Data Sources... 1 1.2.1 FAF... 1 1.2.2 LEHD... 3 2.
3.0 FREIGHT FLOW OVERVIEW
 3. FREIGHT FLOW OVERVIEW This analysis primarily uses IHS Global Insight s TRANSEARCH database and the Surface Transportation Board s Rail Waybill Sample. These datasets provide county-level data for freight
Effectively Using the QRFM to Model Truck Trips in Medium-Sized Urban Communities
 Effectively Using the QRFM to Model Truck Trips in Medium-Sized Urban Communities By Dr. Michael Anderson and Mary Catherine Dondapati Department of Civil and Environmental Engineering The University of
Freight Transportation Challenge More Trucks, More Fuel, More GHGs?
 Freight Transportation Challenge More Trucks, More Fuel, More GHGs? presented to Thirteenth Biennial Conference on Transportation Energy and Policy Asilomar Conference Center Pacific Grove, California
TRUCK TRIP ESTIMATION BY FACILITIES USING ARC-INFO
 Golias M, and Boile M. 1 TRUCK TRIP ESTIMATION BY FACILITIES USING ARC-INFO Mihalis Golias (corresponding author) Graduate and Research Assistant CAIT/Maritime Infrastructure Engineering and Management
Chapter 5 Freight Movement
 Chapter 5 Freight Movement Truck passing under I-78 on Route 412 in Hellertown 34 35 Figure 7 Lehigh Valley Percent Freight Tonnage and Value by Direction, and This section details the tonnage and value
INDIANA S INTERMODAL MANAGEMENT SYSTEM Stephen C. Smith Planning Manager, Transportation Planning Division Indiana Department of Transportation
 96 INDIANA S INTERMODAL MANAGEMENT SYSTEM Stephen C. Smith Planning Manager, Transportation Planning Division Indiana Department of Transportation Indiana is in the process of developing an Intermodal
Professor of Civil Engineering and Director, Institute of Transportation Studies University of California, Irvine
 California Statewide Freight Forecasting Model (CSFFM) September 2012 Progress Report Stephen G. Ritchie Professor of Civil Engineering and Director, Institute of Transportation Studies University of California,
Assessing the Impact of The CETA on Canada s Transportation Network
 Assessing the Impact of The CETA on Canada s Transportation Network Mahyar Jahangiriesmaili, University of Toronto Matthew Roorda, University of Toronto Chris Bachmann, University of Waterloo Project Funded
Advanced Freight Forecasting Models
 Advanced Freight Forecasting Models Prepared for: Innovations in Travel Modeling Workshop Prepared by: Maren Outwater April 30, 2012 Advanced Freight Forecasting Models 3 Types Emerging 1. Supply Chain
Missouri Freight Transportation Economy on the Move. Waterway Freight. Missouri Economic Research and Information Center
 Missouri Freight Transportation Economy on the Move Waterway Freight Waterway Industry Missouri is home to 14 public Port Authorities and over 200 private ports operating on over 1,000 miles of waterways
4-Step Commodity Model Freight Forecasting
 Freight Forecasting Neda Masoud (nmasoud@uci.edu) Kate Hyun (khyun1@uci.edu) Professor Ritchie CEE290A University of California Irvine Generation Distribution Mode Split Assignment Total Production and
Kiyoshi Kobayashi (Kyoto University)
") Online Publication Date: 10 March, 2012 Publisher: Asian Economic and Social Society Vietnam Economic Structure Change Based on Input-Output Table (2000-2007) Bui Trinh (National Account Department of
Online Publication Date: 10 March, 2012 Publisher: Asian Economic and Social Society Vietnam Economic Structure Change Based on Input-Output Table (2000-2007) Bui Trinh (National Account Department of
Transportation Model Report
 1. Introduction The traffic impacts of the future developments in the IL130/High Cross Road corridor for different scenarios were analyzed using a Travel Demand Model (TDM). A four step modeling process
Interactive Data Visualization Tools for Travel Demand Model Datasets. Shuyao Hong
 Interactive Data Visualization Tools for Travel Demand Model Datasets Shuyao Hong GIS-T Symposium Phoenix, Arizona April 10-13, 2017 MAG Modeling Area Area: 16,080 Square Miles Population: 4.9 Million
Refined Statewide California Transportation Model. Progress Report November 2009
 Refined Statewide California Transportation Model Progress Report November 2009 Study area - the State of California. Forecast trips made on a typical fall / spring weekday i.e. when schools are in session.
Tour-based and Supply Chain Modeling for Freight
 Tour-based and Supply Chain Modeling for Freight Maren Outwater, Colin Smith, Bhargava Sana, Jason Chen, Supin Yoder, Kermit Wies, Jane Lin, Kouros Mohammadian, Kazuya Kawamura Objectives Despite recent
Logistics Overview for North Carolina
 June 2, 2016 Logistics Overview for North Carolina Charles HW Edwards Outline Evolving Freight Logistics Network Why Logistics Is Important We Now Know Who We Are North Carolina s Supply Chain New Challenges
ABSTRACT. PALADUGU, BHARATH. North Carolina Truck Network Model. (Under the direction of Dr. John R. Stone.)
") ABSTRACT PALADUGU, BHARATH. North Carolina Truck Network Model. (Under the direction of Dr. John R. Stone.) A number of state and regional transportation agencies including USDOT and NCDOT recognize the
ABSTRACT PALADUGU, BHARATH. North Carolina Truck Network Model. (Under the direction of Dr. John R. Stone.) A number of state and regional transportation agencies including USDOT and NCDOT recognize the
THE ECONOMIC IMPACT OF INFORMATION TECHNOLOGIES AFTER THE FINANCIAL CRISIS
 THE ECONOMIC IMPACT OF INFORMATION TECHNOLOGIES AFTER THE FINANCIAL CRISIS Dale W. Jorgenson, Harvard University http://economics.harvard.edu/faculty/jorgenson/ Keynote Lecture to the Annual Conference
Model Characteristics
 1 General Model Design Highway Network/Traffic Analysis Zones (TAZs) Development of Synthetic Trip Tables Validation Procedures & Results Model Application (2003 & 2030) Review 2 Model Characteristics
Appendix B. Commodity Flow Profile
 Appendix B 1.0 Introduction The overall goal of the Kansas Department of Transportation (KDOT) Statewide Freight Plan is to develop a set of infrastructure, operational, and institutional recommendations
A Travel Time Reliability Estimation and Valuation Approach for Transportation Planning Applications
 A Travel Time Reliability Estimation and Valuation Approach for Transportation Planning Applications Sabya Mishra a, Liang Tang b, Sepehr Ghader b, Subrat Mahapatra c, and Lei Zhang b* a University of
Statewide Model Topics
 Statewide Models 1 Statewide Model Topics Why do we need Statewide Models Statewide model theory and typical steps Similarities and differences with urban models Data needs and considerations Validation
Appendix A NAICS Codes and Titles
 Appendix A NAICS Codes and Titles The current analysis of the US economy uses a classification system that is based on the 6-digit North American Industry Classification System (NAICS) introduced in year
PROJECTS. The KIPDA MPO s Central Location
 PROJECTS Freight The economy of the Louisville KY-IN) Metropolitan Planning Area MPA), similar to that of the United States as a whole, is largely dependent on the efficient, reliable, and safe movement
SWOT Analysis of Commodity Flow Datasets
 SWOT Analysis of Commodity Flow Datasets prepared for FDOT Transportation Statistics Office prepared by RS&H, Inc. 5/6/2015 Background Many users work with commodity flow data Modelers GIS analysts Policy
WORLD KLEMS AND ASIA KLEMS
 WORLD KLEMS AND ASIA KLEMS By Dale W. Jorgenson Harvard University First Asia KLEMS Conference Asian Development Bank Institute Tokyo, Japan July 27, 2011 http://economics.harvard.edu/faculty/jorgenson/
4 th TRB International Conference on Innovations in Travel Modeling April 30, Vidya Mysore. presented at. Moderator
 presented at 4 th TRB International Conference on Innovations in Travel Modeling April 30, 2012 Moderator Vidya Mysore Vidya.mysore@dot.state.fl.us Florida DOT 5/16/2012 Agenda Overview Recent Advances
TRANSPORTATION RESEARCH BOARD
 TRANSPORTATION RESEARCH BOARD Data and Tools for Linking Goods Movement, Air Quality, and Transportation Infrastructure Decisions June 2-3, 2009 Overview of the Model Improvement Plan for the SCAG Heavy-Duty
Bilag 2. Standard industrial groupings for publishing purposes
 Standard industrial groupings for publishing purposes 441 Bilag 2. Industries organized into four groupings Groupings used in published statistics 127-grouping is the most detailed Links to DB07 Standard
Turkey. Mustafa Acar The original input-output table
 14.12 Turkey Mustafa Acar 14.12.1 The original input-output table The source table for Turkey s input-output (I/O) table is The Input-Output Structure of the Turkish Economy 1990, published by the State
Database and Travel Demand Model
 Database and Travel Demand Model 7 The CMP legislation requires every CMA, in consultation with the regional transportation planning agency (the Metropolitan Transportation Commission (MTC) in the Bay
6.1 Economic Impact Analysis... 1
 Table of Contents 6.1... 1 Introduction... 1 Economic Multiplier Effect Definitions... 1 Regional Context... 2 Economic Multiplier Findings... 3 6.2 Methodology... 7... 7 Airport Operational Impacts...
TEXAS FREIGHT MOBILITY PLAN 2017
 TEXAS FREIGHT MOBILITY PLAN 2017 Texas Transportation Commission September 28, 2017 Overview of the Texas Freight Mobility Plan 2016 Plan First multimodal freight mobility plan Identified freight network,
6.1 Economic Impact Analysis... 1
 Table of Contents 6.1... 1 Introduction... 1 Economic Multiplier Effect Definitions... 1 Regional Context... 2 Economic Multiplier Findings... 3 6.2 Methodology... 7... 7 Airport Operational Impacts...
Modeling Applications for Freight Tennessee DOT Freight Planning
 Modeling Applications for Freight Tennessee DOT Freight Planning presented to Tennessee Model Users Group presented by Dike Ahanotu Cambridge Systematics, Inc. July 17, 2008 Transportation leadership you
Problem of Transshipment in Travel Forecasting
 Problem of Transshipment in Travel Forecasting Model of Tour Structures William J. Melendez and Alan J. Horowitz The concept of the transshipment of goods has not been widely incorporated into models for
Eight County Freight Plan
 Eight County Freight Plan Blackhawk Hills Regional Council 2017 Fall Summit CPCS Team October 27, 2017 Timber Lake Playhouse Project Sponsors 2 Presentation Map The Eight County Freight Plan Work Plan
Ivan Sanchez-Diaz (corresponding), Rensselaer Polytechnic Institute
, Rensselaer Polytechnic Institute") Paper Author (s) Jose Holguín-Veras, Rensselaer Polytechnic Institute (jhv@rpi.edu) Ivan Sanchez-Diaz (corresponding), Rensselaer Polytechnic Institute (sanchi2@rpi.edu) Miguel Jaller, Rensselaer Polytechnic
Paper Author (s) Jose Holguín-Veras, Rensselaer Polytechnic Institute (jhv@rpi.edu) Ivan Sanchez-Diaz (corresponding), Rensselaer Polytechnic Institute (sanchi2@rpi.edu) Miguel Jaller, Rensselaer Polytechnic
INTERMODAL FREIGHT TRANSFER FACILITY DATABASE
 INTERMODAL FREIGHT TRANSFER FACILITY DATABASE INTERMODAL SURFACE TRANSPORTATION EFFICIENCY ACT (ISTEA) OF 1991 Commitment to a National Intermodal Transportation System that links every point to all the
FHWA Programs Supporting Freight
 FHWA Programs Supporting Freight Institute for Trade and Transportation Studies Conference Office of Operations 1200 New Jersey Avenue S.E. Washington, D.C. 20590 www.ops.fhwa.dot.gov/freight Jeff Purdy,
FREIGHT DATA FUSION FROM MULTIPLE DATA SOURCES FOR FREIGHT PLANNING APPLICATIONS IN FLORIDA
 Final Report Contract BDV24-977-18 FREIGHT DATA FUSION FROM MULTIPLE DATA SOURCES FOR FREIGHT PLANNING APPLICATIONS IN FLORIDA Sponsoring Agency: Florida Department of Transportation, Systems Planning
Travel Forecasting Tutorial
 Travel Forecasting Tutorial Travel Demand Modeling/Forecasting Process by which relationships among causal factors and travel decisions are analyzed and mathematically modeled. Decisions include: Travel
Chapter #9 TRAVEL DEMAND MODEL
 Chapter #9 TRAVEL DEMAND MODEL TABLE OF CONTENTS 9.0 Travel Demand Model...9-1 9.1 Introduction...9-1 9.2 Overview...9-1 9.2.1 Study Area...9-1 9.2.2 Travel Demand Modeling Process...9-3 9.3 The Memphis
Enhanced Travel Modeling Tools at ODOT
 Enhanced Travel Modeling Tools at ODOT Presented to the Ohio Transportation Engineering Conference Gregory Giaimo, PE Rebekah Anderson, PE The Ohio Department of Transportation Division of Planning October
EXISTING AND FUTURE FREIGHT GOODS MOVEMENT ASSESSMENT
 Technical Memorandum EXISTING AND FUTURE FREIGHT GOODS MOVEMENT ASSESSMENT Prepared by: April 2014 TABLE OF CONTENTS 1. Introduction... 3 1.1 Study Purpose... 3 1.2 Data Reference List... 3 2. Data sources...
Interactive Statewide Transportation Planning Modeling Process
 TRANSPORTATION RESEARCH RECORD 1499 Interactive Statewide Transportation Planning Modeling Process JIANGYAN WANG AND EUGENE M. WILSON The Wyoming Multimodal Statewide Transportation Planning (WMSTP) model
Railroads - The Economy and Trade National Coal Transportation Association Denver, Colorado September 19, 2017
 Railroads - The Economy and Trade 2017 National Coal Transportation Association Denver, Colorado September 19, 2017 Railroads and the Economy 2017 SLIDE 2 Coal: 365,806 (14.1%) Railroads Help Keep Coal-
Land Use and Transportation Scenario Analysis and Microsimulation. 14 th TRB National Planning Applications Conference Columbus, OH 2013
 Land Use and Transportation Scenario Analysis and Microsimulation 14 th TRB National Planning Applications Conference Columbus, OH 2013 SMART TRANSPORTATION ANALYSIS Project Need: How to quantify the benefits
Ohio Department of Transportation Ohio Statewide Freight Study/ Plan
 Ohio Statewide Freight Study/ Plan Ohio Planning Conference July, 2014 Statewide Freight Plan Purpose: To understand to the greatest detail possible, how Ohio s freight infrastructure is being utilized.
Table of contents for Statistics Denmark s input-output tables, 69 industries including two preliminary years. New edition in English, June 2016.
 Table of contents for Statistics Denmark s input-output tables, 69 industries including two preliminary years. New edition in English, June 2016. Matricer Name Row Col From To DZB_fyy 69 69 Danish industries
Freight and Rail Stakeholder Webinar. January 7, 2014
 Freight and Rail Stakeholder Webinar January 7, 2014 Agenda Modal Needs Baseline Revenue Modal Scenarios Website Statewide Freight Plan Statewide Rail Plan Jeff Carroll MULTIMODAL TRANSPORTATION NEEDS
Virginia Critical Rural and Urban Freight Corridor Designation WebEx Discussion. September 28, 2017, 10:30 12:00
 Virginia Critical Rural and Urban Freight Corridor Designation WebEx Discussion September 28, 2017, 10:30 12:00 Agenda Introductions Purpose National Highway Freight Network Eligibility requirements Data
GIS-based Modeling for Statewide and Corridor Freight Planning
 GIS-based Modeling for Statewide and Corridor Freight Planning GIS-T T Conference Colorado Springs, CO Presented by Erik Cempel Cambridge Systematics, Inc. March 19, 2003 Outline of Presentation Background
Minnesota Comprehensive Statewide Freight and Passenger Rail Plan
 Minnesota Comprehensive Statewide Freight and Passenger Rail Plan Freight Rail Demand! " What drives demand for freight Ð MinnesotaÕ s economic structure and future industry prospects! " MinnesotaÕ s multimodal
APPENDIX H: TRAVEL DEMAND MODEL VALIDATION AND ANALYSIS
 APPENDIX H: TRAVEL DEMAND MODEL VALIDATION AND ANALYSIS Travel demand models (TDM) simulate current travel conditions and forecast future travel patterns and conditions based on planned system improvements
Truck Modeling and Data Overview. June 14, 2017
 Truck Modeling and Data Overview June 14, 217 T24 Freight Performance Measures Freight Performance Measures Efficient Freight Mobility Performance Trends (Observed Data) Percent of the Interstate System
NYMTC Regional Freight Plan Update Interim Plan Task Commodity Flow Analysis
 TECHNICAL MEMO NYMTC Regional Freight Plan Update 2015-2040 Interim Plan Task 2.2.1 Commodity Flow Analysis REVISED, JANUARY 2014 technical memorandum Task 2.2.1 Technical Memorandum Commodity Flow Analysis
Estimating Freight Activity on Major Highways with the Freight Analysis Framework (FAF)
") Bureau of Transportation Statistics Estimating Freight Activity on Major Highways with the Freight Analysis Framework (FAF) Geospatial Interest Group of the Federal Committee on Statistical Methodology
Bureau of Transportation Statistics Estimating Freight Activity on Major Highways with the Freight Analysis Framework (FAF) Geospatial Interest Group of the Federal Committee on Statistical Methodology
Transportation Research Forum
 Transportation Research Forum Framework for Modeling Statewide Freight Movement Using Publicly Available Data Author(s): Subhro Mitra and Denver Tolliver Source: Journal of the Transportation Research
Validation and Sensitivity Considerations For Statewide Models
 Validation and Sensitivity Considerations For Statewide s NCHRP 836-B Task 91 presented to 2011 TRB 90th Annual Meeting presented by Cambridge Systematics, Inc. Robert G. Schiffer, AICP, Principal January
Performance Measures for Transportation Planning Part 1
 Performance Measures for Transportation Planning Part 1 Flint, MI July 12, 2011 Brian Betlyon FHWA Resource Center Overview Performance Measurement in Transportation Planning Module Outcomes Describe performance
Innovations in Freight Planning and Project Prioritization
 Innovations in Freight Planning and Project Prioritization OTEC Conference Columbus, Ohio Melissa Ziegler Multimodal Transportation Economic Competitiveness Keith Bucklew Freight Planning October 25, 2016
Massachusetts Rail Plan. September 16, 2010
 Massachusetts Rail Plan September 16, 2010 State Freight and Rail Plans State Rail Plan The plan describes state policy for freight and passenger rail transportation, including commuter rail Provides priorities
AUTONOMOUS VTOL SCALABLE LOGISTICS ARCHITECTURE
 AUTONOMOUS VTOL SCALABLE LOGISTICS ARCHITECTURE Phase I Final Report USRA Grant Number 07600-056 EXECUTIVE SUMMARY A study to define the characteristics of an Autonomous VTOL Scalable Logistics Architecture