Model Characteristics
|
|
|
- Ruth Kennedy
- 5 years ago
- Views:
Transcription
1 1
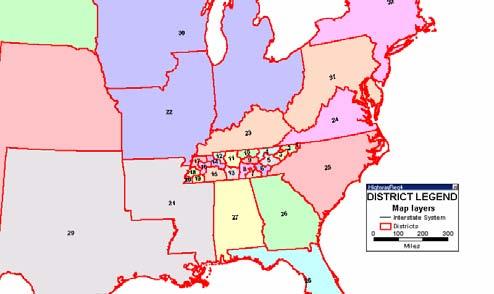
2 General Model Design Highway Network/Traffic Analysis Zones (TAZs) Development of Synthetic Trip Tables Validation Procedures & Results Model Application (2003 & 2030) Review 2
3 Model Characteristics Address Major Corridor Movements Relatively Easy to Maintain and Update Uses Existing Data Resources Uses Existing Software for Application Links to Existing GIS Databases/Software Sensitive to Shifts in Socioeconomic/Land Use Patterns Assess Impacts of Shifts in Travel Modes Assess Freight Movements 3
4 Potential Methodologies Traditional Four Step TDM Procedures Trip Generation Trip Distribution Mode Choice Traffic Assignment Trip Table Expansion (FRATAR) Preparation of Base Trip Table(s) Development of Expansion Factors 4
5 Steps In Model Development Development of Highway Network & TAZs Selection of Detail for Highway Network Definition of TAZs TAZ/Network Compatibility Synthetic Matrix Estimation (SME) Development of Seed Matrices Matrix Estimation Traffic Assignment 5
6 Network/TAZ Definition Incorporate All Roadways in TRIMS 1,283 Miles of Interstate/Freeways 4,300 Miles of Principal Arterials 8,271 Miles of Other Subset of TRIMS Interstate and Freeways Principal Arterials 6
7 TRIMS/Model Comparison ROUTE MILES DVMT NATIONAL FUNCTIONAL NFC Travel Model/TRIMS Travel Model/TRIMS CLASSIFICATION CODE Model TRIMS Ratio Model TRIMS Ratio RURAL INTERSTATE ,901,049 12,901, RURAL OTHER PRINCIPAL ARTERIAL ,693,621 13,693, RURAL MINOR ARTERIAL ,973,803 12,973, RURAL MAJOR COLLECTOR ,940 7,756, RURAL MINOR COLLECTOR , RURAL LOCAL NA NA- URBAN INTERSTATE ,535,171 44,535, URBAN FREEWAY OR EXPRESSWAY ,834,901 10,834, URBAN OTHER PRINCIPAL ARTERIAL ,938,821 51,938, URBAN MINOR ARTERIAL ,744,441 19,718, URBAN COLLECTOR ,203, URBAN LOCAL NA NA- TOTAL 9, , ,262, ,575,
8 REGION 1 Network/TAZs LEGEND: Rural Interstate Rural Principal Arterial Rural Minor Arterial Rural Local Urban Interstate Urban Freeway/Expressway Urban Principal Arterial Urban Minor Arterial TAZ Boundary 8
9 REGION 2 Network/TAZs LEGEND: Rural Interstate Rural Principal Arterial Rural Minor Arterial Rural Local Urban Interstate Urban Freeway/Expressway Urban Principal Arterial Urban Minor Arterial TAZ Boundary 9
10 REGION 3 Network/TAZs LEGEND: Rural Interstate Rural Principal Arterial Rural Minor Arterial Rural Local Urban Interstate Urban Freeway/Expressway Urban Principal Arterial Urban Minor Arterial TAZ Boundary 10
11 LEGEND: REGION 4 Network/TAZs Rural Interstate Rural Principal Arterial Rural Minor Arterial Rural Local Urban Interstate Urban Freeway/Expressway Urban Principal Arterial Urban Minor Arterial TAZ Boundary 11
12 National Network LEGEND: Rural Interstate Rural Principal Arterial Rural Minor Arterial Rural Local Urban Interstate Urban Freeway/Expressway Urban Principal Arterial Urban Minor Arterial 12
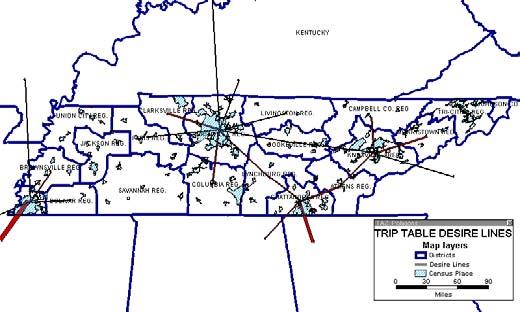
13 Background Trip Tables Are One of the Basic Elements of Travel Demand Models Origin-Destination (O-D) Surveys Traditional Method for Trip Table Development Developing Trip Tables Using Traffic Counts has been Source of Research for Past 30 Years 13
14 Required Inputs Traffic Counts Traffic Assignment Network Seed Trip Table 14
15 Required Inputs Traffic Counts Sample should come from widely dispersed parts of the network Counts on Selected Links and on Screenlines/Cutlines Counts Need to be Directional 15
16 Required Inputs Traffic Assignment Network Traffic Assignment Network MUST Produce Realistic Results Equilibrium Assignment Process 16
17 Required Inputs Seed Matrix Potential Sources of Seed Matrix Default matrix Prior estimate based on survey measurements Synthetically generated (e.g., from a doubly-constrained trip distribution model) 17
18 Seed Matrix Serves Two Purposes Set the dimensions for the output matrix Provide initial values for the estimated trip table O-D Matrix Estimation only accounts for trips between zones (diagonal cells will be ignored trips within a zone) Every cell that is expected to have a positive flow must have a positive number in the base matrix 18
19 Seed Matrix Three Trip Purposes Used Work Other Non-Home Based Used Trip Rates and Lengths From National Household Survey Urban Rural 19
20 Seed Matrix Trip Generation 2001 NHTS Database Purpose Percent HBO 4,341 42% HBW 2,296 22% NHB 3,588 36% Grand 10, % HBW 1.70 trips/household HBO 3.20 trips/household NHB 2.65 trips/household 7.55 trips/household 20
21 Seed Matrix Trip Distribution 2001 NHTS Trip Length Distribution - HBW 20% 18% 16% NHTS Average Trip Length = Min. GM Average Trip Length = Min. 14% Percent of Trips 12% 10% 8% 6% 4% 2% 0% Travel Time (in minutes) 21
22 Seed Matrix Trip Distribution 2001 NHTS Trip Length Distribution - HBO 30.0% 25.0% NHTS Average Trip Length = Min. GM Average Trip Length = Min. 20.0% Percent of Trips 15.0% 10.0% 5.0% 0.0% Travel Time (in minutes) 22
23 Seed Matrix Trip Distribution 2001 NHTS Trip Length Distribution - NHB 30% 25% NHTS Average Trip Length = Min. GM Average Trip Length = Min. 20% Percent of Trips 15% 10% 5% 0% Travel Time (in minutes) 23
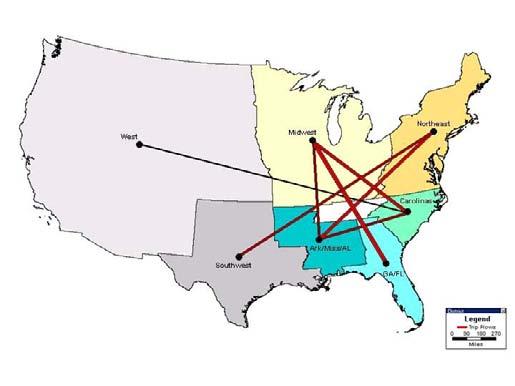
24 Seed Matrix Initial Matrix Not Person Trips; Merging of HBW, HBO, NHB, Internal-External and External-External Trip Tables; Seed Matrix represents Passenger Cars and Light Commercial Vehicle Trips Only; and, Additional Intercity (MPO to MPO) vehicle trips were added in relation to 2000 CTPP Place of Residence and Place of Work Information. 24
25 Traffic Counts Traffic Assignment Network Seed Trip Table Application of TransCAD Matrix Estimation Program 25
26 Application Application of of TransCAD TransCAD Matrix Matrix Estimation Estimation Program Program Trip Trip Table Table Evaluation Evaluation Good?? NO Input Input Adjustments: Adjustments: Network Network Seed Seed Table Table Counts Counts YES Base Base Year Year (2003) (2003) Trip Trip Table Table 26
27 27
28 28
29 29
30 Matrix Evaluation Parameters Trip Length Goodness of Fit Screenlines 30
31 VMT Area National TDOT Synthetic Relative FHWA Type Functional Class TRIMS db (1) Model (1) Difference 2001 (2) Rural Interstate Principal Arterial Minor Arterial Major Collector NA Minor Collector NA Local NA Urban Interstate Freeways/Expressways Principal Arterial Minor Arterial Collector Local NA TOTAL VMT Notes: -NA- denotes that calculation is not applicable for that cell. VMT in millions miles of travel. (1) Includes passenger cars and single unit trucks. (2) Includes all vehicles including multi-unit trucks. 31

32 Screenline Region
33 Screenline Results Region 1 Screenline Observed Model Relative Max. Orientation Number Volume Volume Difference Allowable EW 8 92,568 95, % 24.7% EW , , % 18.3% EW , , % 20.2% NS 64 87,594 90, % 24.7% NS , , % 18.3% NS 82 39,678 44, % 33.3% NS , , % 20.2% NS 94 6,020 6, % 44.9% 1,191,528 1,219, % 18.3% 33
34 Screenline Results Region 1 Screenline Observed Model Relative Max. Number Route Volume Volume Difference Allowable U27 4,916 4, % 47.1% S58 1,378 1, % 76.1% I75 32,680 31, % 23.0% U11 3,572 3, % 53.1% 8 S72 4,726 5, % 47.8% U411 15,588 18, % 30.4% U129 3,932 3, % 51.2% FOOTHI 3,168 2, % 55.6% U441 5,488 6, % 45.1% I40 17,120 17, % 29.4% 92,568 95, % 24.7% U27 3,792 4, % 51.9% S61 7,030 7, % 41.1% S62 22,870 17, % 26.3% S95 22,722 22, % 26.4% U25W 16,898 24, % 29.5% S131 13,990 13, % 31.7% I75 49,314 47, % 19.7% S33 41,650 45, % 21.0% I640 47,520 43, % 20.0% 12 U11W 13,688 15, % 32.0% U11E 18,664 19, % 28.4% S92 9,274 6, % 37.0% U70 6,074 8, % 43.4% U70 3,724 4, % 52.3% I40 19,488 20, % 28.0% U25E 7,072 7, % 41.0% U321 2,010 2, % 66.0% S70 2,214 2, % 63.6% I26 6,490 6, % 42.4% 314, , % 9.4% 34
35 Screenline Results Region 1 Screenline Observed Model Relative Max. Number Route Volume Volume Difference Allowable U27 6,740 9, % 41.8% U25W 8,268 8, % 38.7% I75 25,044 25, % 25.5% U25W 1,294 2, % 77.9% U25E 19,484 22, % 28.0% S % 147.6% 18 I ,960 24, % 25.5% 11,760 11, % 33.9% I81 20,614 25, % 27.4% U11W 22,988 22, % 26.3% U19 18,692 17, % 28.4% S34 9,232 12, % 37.1% U421 6,342 5, % 42.7% U421 6,510 6, % 42.3% 182, , % 20.2% S52 1,268 1, % 78.5% S62 1,146 1, % 81.5% I40 24,428 24, % 25.7% U27 13,456 13, % 32.2% 64 U70 4,150 3, % 50.2% S58 1,378 1, % 76.1% I75 29,668 29, % 23.9% U11 5,054 5, % 46.6% U411 5,748 8, % 44.4% S39 1,298 1, % 77.8% 87,594 90, % 13.9% 35
36 Screenline Results Region 1 Screenline Observed Model Relative Max. Number Route Volume Volume Difference Allowable U25W 2,376 2, % 61.9% S63 19,796 26, % 27.8% U441 1,100 1, % 82.8% I75 35,166 32, % 22.4% S61 25,676 20, % 25.2% U25W 17,344 17, % 29.2% S62 10,812 13, % 34.9% 70 S131 8,694 6, % 37.9% 11,496 16, % 34.1% I75 114, , % 13.4% U70 27,792 24, % 24.5% S332 8,950 8, % 37.5% U321 13,222 12, % 32.4% U411 11,850 11, % 33.8% S % 129.3% 308, , % 18.3% S , % 101.4% U11W 8,180 8, % 38.8% 82 U11E 5,568 6, % 44.9% I81 22,150 22, % 26.7% U321 3,136 6, % 55.8% U25 4,980 4, % 46.8% 44,658 49, % 20.5% 36
37 Screenline Results Region 1 Screenline Observed Model Relative Max. Number Route Volume Volume Difference Allowable U11W 17,820 18, % 28.9% S126 8,360 8, % 38.5% I81 24,040 25, % 25.8% 5,940 8, % 43.8% 88 S75 11,268 17, % 34.4% S36 12,732 9, % 32.9% I181 31,680 30, % 23.3% S354 14,158 12, % 31.6% U321 26,156 25, % 25.0% I26 8,164 8, % 38.9% 160, , % 20.2% U , % 88.6% 94 S67 3,620 3, % 52.8% U321 1,480 1, % 74.0% 6,020 6, % 43.6% 37

38 Screenline Region
39 Screenline Results Region 2 Screenline Observed Model Relative Max. Orientation Number Volume Volume Difference Allowable EW 0 224, , % 18.3% EW 4 139, , % 20.2% EW 12 80,352 84, % 24.7% EW 18 14,010 12, % 44.9% NS 46 93,110 92, % 24.7% NS 54 98,498 92, % 24.7% NS 62 99, , % 24.7% 749, , % 18.3% 39
40 Screenline Results Region 2 Screenline Observed Model Relative Max. Number Route Volume Volume Difference Allowable S % 111.9% S % 121.8% U72 12,882 12, % 32.7% I24 32,026 32, % 23.2% I24 44,956 44, % 20.4% U11 5,318 5, % 45.7% 0 S148 1,614 1, % 71.7% S17 11,762 11, % 33.9% U27 24,250 23, % 25.8% I75 74,568 85, % 15.5% S60 5,162 7, % 46.2% U411 4,442 4, % 48.9% S68 6,990 7, % 41.2% 224, , % 18.3% U41 A 10,642 10, % 35.2% I24 23,962 23, % 25.9% U41 2,704 2, % 59.0% S56 3,636 3, % 52.7% S108 1,246 2, % 79.0% S28 6,092 7, % 43.4% U127 1,962 3, % 66.6% 4 S111 6,444 5, % 42.5% U27 18,304 18, % 28.7% S60 4,926 4, % 47.0% I75 28,080 28, % 24.4% U11 5,234 5, % 46.0% S30 10,024 10, % 36.0% U411 11,146 8, % 34.6% S310 4,892 4, % 47.1% 139, , % 20.2% 40
41 Screenline Results Region 2 Screenline Observed Model Relative Max. Number Route Volume Volume Difference Allowable U70 4,666 4, % 48.0% S56 3,842 3, % 51.7% S111 12,872 12, % 32.7% U70N 3,416 2, % 54.0% 12 I40 23,690 27, % 26.0% U127 10,370 11, % 35.5% S298 2,416 2, % 61.5% S101 14,482 14, % 31.3% 2,772 3, % 58.4% 1,826 1, % 68.4% 80,352 84, % 24.7% S % 95.5% S53 2,784 2, % 58.3% 18 S52 2,988 3, % 56.8% S42 4,042 4, % 50.7% U127 3,442 2, % 53.8% 14,010 12, % 44.9% S96 3,412 4, % 54.0% U70S 11,702 10, % 33.9% I24 28,666 27, % 24.2% U41 7,902 6, % 39.3% 46 S55 14,764 14, % 31.1% U41 A 13,978 14, % 31.7% U41 A 7,596 10, % 39.9% U64 3,298 2, % 54.7% S16 1, % 68.9% 93,110 92, % 24.7% 41
42 Screenline Results Region 2 Screenline Observed Model Relative Max. Number Route Volume Volume Difference Allowable S53 4,750 4, % 47.7% S52 2,988 3, % 56.8% S % 115.5% S85 1,216 1, % 79.7% S111 15,210 12, % 30.7% 0 7,760 7, % 39.6% 54 U70N 8,386 8, % 38.5% I40 27,194 25, % 24.7% U70 11,760 11, % 33.9% S30 1, % 75.9% S111 4,946 4, % 47.0% S28 4,948 4, % 46.9% S283 3,656 3, % 52.6% U41 3,842 3, % 51.7% 98,498 92, % 24.7% S52 1,322 1, % 77.3% S % 102.1% I40 20,866 22, % 27.3% U70 1,822 1, % 68.5% U27 4,916 4, % 47.1% S68 5,218 5, % 46.0% 62 S58 1,840 1, % 68.2% S30 5,636 4, % 44.7% 0 1,826 2, % 68.4% I75 30,040 29, % 23.8% 0 4,950 4, % 46.9% U11 9,526 9, % 36.7% U64 9,304 10, % 37.0% S313 1,682 1, % 70.6% 99, , % 24.7% 42

43 Screenline Region
44 Screenline Results Region 3 Screenline Observed Model Relative Max. Orientation Number Volume Volume Difference Allowable EW 0 45,998 47, % 33.3% EW 6 73,952 67, % 33.3% EW , , % 18.3% EW , , % 20.2% NS 24 34,816 38, % 33.3% NS , , % 18.3% NS , , % 18.3% NS , , % 24.7% 1,493,260 1,513, % 18.3% 44
45 Screenline Results Region 3 Screenline Observed Model Relative Max. Number Route Volume Volume Difference Allowable S69 2,050 1, % 65.5% PNA D 2,232 2, % 63.4% S13 2,502 2, % 60.7% U43 8,142 8, % 38.9% 0 S11 2,382 2, % 61.9% I65 10,028 10, % 36.0% U31 6,106 7, % 43.4% U231 10,184 10, % 35.7% S97 2,372 2, % 62.0% 45,998 47, % 33.3% S % 104.8% S48 1,062 1, % 83.9% S20 2,940 2, % 57.1% U43 11,880 11, % 33.7% U31 2,922 4, % 57.3% 6 I65 13,002 13, % 32.6% U431 1,746 2, % 69.6% U31 A 4,648 4, % 48.1% U41 A 9,800 7, % 36.3% U231 21,782 16, % 26.8% S64 3,580 4, % 53.0% 73,952 67, % 33.3% 45
46 Screenline Results Region 3 Screenline Observed Model Relative Max. Number Route Volume Volume Difference Allowable S69 2,050 1, % 65.5% PNA D 2,232 2, % 63.4% S13 2,502 2, % 60.7% U43 8,142 8, % 38.9% 0 S11 2,382 2, % 61.9% I65 10,028 10, % 36.0% U31 6,106 7, % 43.4% U231 10,184 10, % 35.7% S97 2,372 2, % 62.0% 45,998 47, % 33.3% S % 104.8% S48 1,062 1, % 83.9% S20 2,940 2, % 57.1% U43 11,880 11, % 33.7% U31 2,922 4, % 57.3% 6 I65 13,002 13, % 32.6% U431 1,746 2, % 69.6% U31 A 4,648 4, % 48.1% U41 A 9,800 7, % 36.3% U231 21,782 16, % 26.8% S64 3,580 4, % 53.0% 73,952 67, % 33.3% 46
47 Screenline Results Region 3 Screenline Observed Model Relative Max. Number Route Volume Volume Difference Allowable S13 2,874 2, % 57.6% S48 1,674 1, % 70.7% I40 19,188 19, % 28.1% S46 11,650 12, % 34.0% 0 2,940 2, % 57.1% S96 6,626 7, % 42.0% S96 13,188 15, % 32.4% 12 S96 7,546 11, % 40.0% U431 14,804 15, % 31.0% U31 24,028 21, % 25.9% I65 97,530 98, % 13.7% I24 91,962 91, % 13.9% U41 24,454 16, % 25.7% I840 F 15,404 16, % 30.6% U231 7,566 7, % 40.0% S96 2,834 3, % 57.9% 344, , % 18.3% U79 8,826 7, % 37.7% S13 21,160 25, % 27.1% U41 A 16,276 18, % 29.9% I24 31,500 33, % 23.3% U41 14,896 11, % 31.0% S49 5,430 5, % 45.3% 18 I65 41,380 41, % 21.1% U31W 7,694 7, % 39.7% S25 2,188 2, % 63.9% S109 8,418 9, % 38.4% U31E 9,944 10, % 36.1% S10 5,520 4, % 45.0% S56 2,148 2, % 64.3% 175, , % 20.2% 47
48 Screenline Results Region 3 Screenline Observed Model Relative Max. Number Route Volume Volume Difference Allowable U79 3,696 5, % 52.4% U70 7,084 6, % 41.0% 24 I40 19,564 20, % 27.9% U412 2,246 3, % 63.3% U64 2,226 3, % 63.5% 34,816 38, % 33.3% U41 4,638 4, % 48.1% S49 6,850 6, % 41.5% I24 38,156 37, % 21.7% U41 A 6,584 6, % 42.1% S12 10,780 10, % 35.0% U70 3,900 12, % 51.4% I40 49,216 46, % 19.7% 36 U70S 23,860 24, % 25.9% S100 21,464 21, % 27.0% S96 10,556 10, % 35.3% U31 11,888 17, % 33.7% 23,732 18, % 26.0% U412 13,116 16, % 32.5% S50 8,816 8, % 37.7% U31 A 4,512 4, % 48.6% U31 3,420 3, % 54.0% 241, , % 18.3% 48
49 Screenline Results Region 3 Screenline Observed Model Relative Max. Number Route Volume Volume Difference Allowable I65 37,860 37, % 21.8% U31W 2,756 3, % 58.6% S25 2,376 2, % 61.9% S386 39,542 38, % 21.4% U31E 35,196 45, % 22.4% S45 31,126 31, % 23.4% U70N 29,058 29, % 24.1% I40 91,280 89, % 13.9% 0 5,880 9, % 44.0% 40 U70S 21,384 26, % 27.0% S254 31,108 25, % 23.5% 0 13,258 12, % 32.4% I24 83,660 82, % 14.3% S96 4,342 4, % 49.3% U41 A 3,066 3, % 56.2% S64 2,990 3, % 56.8% U431 3,478 4, % 53.6% U64 4,834 4, % 47.4% U231 12,184 10, % 33.4% 455, , % 18.3% S52 2,736 2, % 58.7% S % 89.6% S % 113.6% S262 2,308 2, % 62.6% S25 8,556 7, % 38.2% U70N 3,584 3, % 53.0% I40 27,004 26, % 24.7% S53 1,854 1, % 68.0% 48 U70 5,126 4, % 46.3% S96 3,872 3, % 51.5% U70S 11,878 12, % 33.7% U41 1,604 1, % 71.8% I24 30,600 30, % 23.6% S64 2,464 2, % 61.1% U41 A 7,962 9, % 39.2% S55 5,482 5, % 45.2% U64 3,662 3, % 52.6% S97 1,920 2, % 67.1% 121, , % 24.7% 49

50 Screenline Region
51 Screenline Results Region 4 Screenline Observed Model Relative Max. Orientation Number Volume Volume Difference Allowable EW 0 178, , % 20.2% EW 10 58,420 69, % 33.3% EW 18 24,914 29, % 44.9% NS 0 116, , % 24.7% NS 4 304, , % 18.3% NS 8 90,818 98, % 24.7% NS 18 64,464 63, % 33.3% NS 22 52,054 47, % 33.3% 890, , % 18.3% 51
52 Screenline Results Region 4 Screenline Observed Model Relative Max. Number Route Volume Volume Difference Allowable U61 21,418 24, % 27.0% 0 3,412 3, % 54.0% U51 12,782 12, % 32.8% I55 54,362 56, % 19.4% 0 13,950 20, % 31.7% U78 32,692 34, % 23.0% 0 0 7,440 8, % 40.2% U72 13,348 15, % 32.3% S18 1,738 1, % 69.7% S125 3,620 3, % 52.8% U45 7,588 10, % 39.9% S22 2,610 2, % 59.8% S57 3,700 3, % 52.4% 178, , % 20.2% U51 10,256 10, % 35.7% U45W 9,618 10, % 36.5% U79 10,322 19, % 35.6% U45E 14,458 14, % 31.3% 10 U70 3,840 3, % 51.7% S22 4,708 5, % 47.8% % 111.9% U641 4,326 4, % 49.4% % 121.8% 58,420 69, % 33.3% 52
53 Screenline Results Region 4 Screenline Observed Model Relative Max. Number Route Volume Volume Difference Allowable S % 110.7% U51 5,404 7, % 45.4% 18 U51 8,436 10, % 38.4% U45E 5,080 4, % 46.5% U641 5,484 5, % 45.2% 24,914 29, % 44.9% I40 42,008 44, % 20.9% 0 I55 38,330 46, % 21.7% 9,500 9, % 36.7% 26,880 27, % 24.8% 116, , % 24.7% 53
54 Screenline Results Region 4 Screenline Observed Model Relative Max. Number Route Volume Volume Difference Allowable U51 18,262 18, % 28.7% S14 7,556 6, % 40.0% S205 8,168 11, % 38.9% U79 16,366 16, % 29.9% 4 U64 34,160 33, % 22.6% I40 86,210 66, % 14.0% S23 15,840 28, % 30.3% U72 36,920 27, % 22.0% S385 67,074 46, % 16.7% 0 13,860 10, % 31.8% 304, , % 18.3% S78 3,308 3, % 54.7% I155 6,414 7, % 42.6% S88 1,026 1, % 85.0% U51 10,520 10, % 35.3% S19 3,250 3, % 55.0% 8 S54 2,106 2, % 64.8% U70 1,436 1, % 74.9% I40 22,740 22, % 26.4% S59 1,960 2, % 66.6% U64 13,680 14, % 32.0% S57 11,030 12, % 34.7% U72 13,348 16, % 32.3% 90,818 98, % 24.7% 54
55 Screenline Results Region 4 Screenline Observed Model Relative Max. Number Route Volume Volume Difference Allowable S54 2,574 2, % 60.1% S22 7,498 8, % 40.1% U79 5,870 5, % 44.0% U70 A 2,406 2, % 61.6% S % 90.3% 18 U70 3,582 3, % 53.0% I40 14,756 17, % 31.1% U412 9,124 7, % 37.3% S100 9,992 6, % 36.0% U64 4,812 4, % 47.4% S57 2,976 3, % 56.9% 64,464 63, % 33.3% U79 6,612 5, % 42.1% U70 6,774 5, % 41.7% I40 22,246 21, % 26.6% 22 U412 7,634 7, % 39.9% S100 3,416 2, % 54.0% % 116.3% U64 2,724 3, % 58.8% S69 2,200 2, % 63.8% 52,054 47, % 33.3% 55
56 Screenline Results River Crossings Screenline Observed Model Relative Max. River Route Volume Volume Difference Allowable S166 3,684 4, % 52.5% I24 31,618 30, % 23.3% U41 3,920 2, % 51.3% U27 60,560 53, % 18.0% U127 18,396 32, % 28.6% S319 30,478 28, % 23.6% S153 41,386 40, % 21.1% S60 3,402 4, % 54.1% Tennessee S30 1,796 2, % 68.8% S68 5,218 5, % 46.0% S58 11,872 9, % 33.7% I75 36,692 36, % 22.0% U11 7,342 9, % 40.4% U321 10,688 12, % 35.1% N140 41,412 43, % 21.1% U129 45,804 46, % 20.3% U441 41,092 50, % 21.1% 11,880 18, % 33.7% 407, , % 18.3% U79 7,446 7, % 40.2% S13 21,160 21, % 27.1% S49 10,732 9, % 35.0% S155 28,520 21, % 24.2% U41 A 41,514 51, % 21.0% I65 86,258 96, % 14.0% U41 27,030 40, % 24.7% Cumberland I24 111, , % 13.5% S155 44,288 42, % 20.5% S45 20,434 20, % 27.5% S109 16,634 16, % 29.7% U231 6,120 6, % 43.3% S25 8,302 8, % 38.6% S262 1,644 1, % 71.2% S56 2,538 1, % 60.4% S52 5,588 6, % 44.8% 439, , % 18.3% 56
57 Screenline Results River Crossings Screenline Observed Model Relative Max. River Route Volume Volume Difference Allowable U70 12,446 8, % 33.1% I40 35,120 36, % 22.4% S58 11,426 12, % 34.2% Clinch S95 8,070 7, % 39.0% S62 33,948 33, % 22.7% U25W 20,534 13, % 27.4% S61 21,580 20, % 26.9% 143, , % 20.2% I40 62,816 63, % 17.5% U70 39,582 39, % 21.4% Holst S92 4,268 7, % 49.6% U25E 21,376 23, % 27.0% S56 11,780 7, % 33.8% S66 5,588 6, % 44.8% 145, , % 20.2% S66 25,236 25, % 25.4% French S92 2,544 4, % 60.3% Broad U25 21,534 21, % 26.9% 49,314 51, % 33.3% 57
58 RMSE by Vol. Grp. Statewide % ROOT NO. OF MEAN VOLUME VOLUME COUNT SQUARE GROUP RANGE STATIONS ERROR % % % % % % % % % 58
59 Observed/Model Correlation 140, , ,000 R 2 = Model 80,000 60,000 40,000 20, ,000 40,000 60,000 80, , ,000 Observed 59
60 Freight Movement From Reebie Data Data Truck (Tons) Rail (Tons) Trucks Rail Cars 60
61 Commodity Categories Statewide Freight Model Commodity Group Commodity Group Flow No. Name (Annual Tons) Petroleum & Minerals Food Products Chemicals Timber & Lumber Agriculture Machinery Paper Products Primary Metal Waste Materials 511,600, ,100, ,300,000 49,100, ,000,000 49,300,000 43,100,000 78,900,000 20,600, Manufactured Household & Other Miscellaneous & Container 34,000, ,500,000 ALL COMMODITY GROUPS 1,279,500,000 61
62 Mode Share By Distance Commodity Shipped by Distance (Truck & Rail) 100,000,000 90,000,000 Truck Rail 80,000,000 70,000,000 Commodity (Tons) 60,000,000 50,000,000 40,000,000 30,000,000 20,000,000 10,000, ,000 1,500 2,000 2,500 3,000 3,500 4,000 Distance (Mile) 62
63 Commodity Growth (Million Tons) Truck and Rail 1, Waste Materials Timber & Lumber Primary Metal Paper Product Mixed Shipment Machinery Household Goods Food Product Construction & Mining Chemicals Agriculture Product Year 2001 Year
64 Commodity Growth (Million Tons) Trucks (78% of ) Year 2003 Year Waste Materials Timber & Lumber Primary Metal Paper Product Mixed Shipment Machinery Household Goods Food Product Construction & Mining Chemicals Agriculture Product 64

65 2003 Truck Assignment 2030 Truck Assignment 65
66 2003 Volume-to-Capacity Ratio Existing Network 2030 Volume-to-Capacity Ratio Existing Network 66
67 2003 Volumes Existing Network 2030 Volumes 2030 Volumes Existing Network 67
APPENDIX H: TRAVEL DEMAND MODEL VALIDATION AND ANALYSIS
 APPENDIX H: TRAVEL DEMAND MODEL VALIDATION AND ANALYSIS Travel demand models (TDM) simulate current travel conditions and forecast future travel patterns and conditions based on planned system improvements
Standardization of Travel Demand Models
 Standardization of Travel Demand Models TNMUG Meeting November 14, 2013 The North Carolina Experience Leta F. Huntsinger, Ph.D., P.E. and Rhett Fussell, P.E. Background } North Carolina Profile } 18 MPOs,
9. TRAVEL FORECAST MODEL DEVELOPMENT
 9. TRAVEL FORECAST MODEL DEVELOPMENT To examine the existing transportation system and accurately predict impacts of future growth, a travel demand model is necessary. A travel demand model is a computer
Kentucky Statewide Travel Model (KYSTM) Rob Bostrom Wilbur Smith Associates Combined Kentucky-Tennessee Model Users Group Meeting Bowling Green, KY
 Rob Bostrom Wilbur Smith Associates Combined Kentucky-Tennessee Model Users Group Meeting Bowling Green, KY") Kentucky Statewide Travel Model (KYSTM) Rob Bostrom Wilbur Smith Associates Combined Kentucky-Tennessee Model Users Group Meeting Bowling Green, KY October 26, 2006 Presentation Overview Overview of statewide
Kentucky Statewide Travel Model (KYSTM) Rob Bostrom Wilbur Smith Associates Combined Kentucky-Tennessee Model Users Group Meeting Bowling Green, KY October 26, 2006 Presentation Overview Overview of statewide
Traffic Data Quality Analysis. James Sturrock, PE, PTOE, FHWA Resource Center Operations Team
 Traffic Analysis James Sturrock, PE, PTOE, FHWA Resource Center Operations Team Source Material Traffic Measurement http://ntl.bts.gov/lib/jpodocs/repts_te/14058.htm Seven DEADLY Misconceptions about Information
Wisconsin Statewide Model
 Wisconsin Statewide Model Outline of a Proposed Approach presented by Kimon Proussaloglou Cambridge Systematics, Inc. January 12, 2004 Project Team Wisconsin DOT Doug Dalton, Project Manager Don Uelmen,
Refined Statewide California Transportation Model. Progress Report November 2009
 Refined Statewide California Transportation Model Progress Report November 2009 Study area - the State of California. Forecast trips made on a typical fall / spring weekday i.e. when schools are in session.
New Mexico Statewide Model
 New Mexico Statewide Model Fifth Largest State in land area 2005 Population 1.97 million 42% of state in Albuquerque and Santa Fe area Outside urban areas population density very low New Mexico Planning
Maryland Statewide Transportation Model (MSTM)
") Maryland State Highway Administration (MD SHA) Maryland Statewide Transportation Model (MSTM) TRB Meeting Federal Surface Transportation Requirements in Statewide and Metropolitan Transportation Planning:
Maryland State Highway Administration (MD SHA) Maryland Statewide Transportation Model (MSTM) TRB Meeting Federal Surface Transportation Requirements in Statewide and Metropolitan Transportation Planning:
Chapter #9 TRAVEL DEMAND MODEL
 Chapter #9 TRAVEL DEMAND MODEL TABLE OF CONTENTS 9.0 Travel Demand Model...9-1 9.1 Introduction...9-1 9.2 Overview...9-1 9.2.1 Study Area...9-1 9.2.2 Travel Demand Modeling Process...9-3 9.3 The Memphis
Section 1.0 INTRODUCTION. Section 2.0 MODEL ARCHITECTURE RECOMMENDATIONS, PHASE I, TIER I - PASSENGER CAR AND TRUCK..
 TABLE OF CONTENTS Section 1.0 INTRODUCTION Section 2.0 MODEL ARCHITECTURE RECOMMENDATIONS, PHASE I, TIER I - PASSENGER CAR AND TRUCK.. Section 2.1 General Software and Forecast Year Recommendations. Section
Transportation Model Report
 1. Introduction The traffic impacts of the future developments in the IL130/High Cross Road corridor for different scenarios were analyzed using a Travel Demand Model (TDM). A four step modeling process
GIS-based Modeling for Statewide and Corridor Freight Planning
 GIS-based Modeling for Statewide and Corridor Freight Planning GIS-T T Conference Colorado Springs, CO Presented by Erik Cempel Cambridge Systematics, Inc. March 19, 2003 Outline of Presentation Background
CHAPTER 7. TRAVEL PATTERNS AND TRAVEL FORECASTING
 CHAPTER 7. TRAVEL PATTERNS AND TRAVEL FORECASTING TRAVEL PATTERNS Northwest Arkansas has experienced unprecedented growth in population and employment in the past 25 years. The economic vitality and diversity
CLARKSVILLE/MONTGOMERY COUNTY TRAVEL DEMAND MODEL MODEL DEVELOPMENT REPORT
 CLARKSVILLE/MONTGOMERY COUNTY TRAVEL DEMAND MODEL MODEL DEVELOPMENT REPORT JULY 2009 CLARKSVILLE / MONTGOMERY COUNTY TRAVEL DEMAND MODEL MODEL DEVELOPMENT REPORT July 2009 Alliance Transportation Group,
Updating Virginia s Statewide Functional. Brad Shelton, VDOT Chris Detmer, VDOT Ben Mannell, VDOT
 Updating Virginia s Statewide Functional Classification System Brad Shelton, VDOT Chris Detmer, VDOT Ben Mannell, VDOT July 18, 2013 What is Functional Classification Use of Functional Classification Today
SHIFT ODME Model & Utilities. Prepared For: Institute for Trade and Transportation Studies
 SHIFT ODME Model & Utilities Prepared For: Institute for Trade and Transportation Studies Developed January 2016 Updated February 2017 Table of Contents Section 1 Introduction... 1-1 1.1 Purpose of Model...
Statewide Model Application Using the Texas SAM
 Statewide Model Application Using the Texas SAM Presented by: William Smithson Wilbur Smith Associates September 2008 Texas Statewide Analysis Model Application Presentation Outline Brief Model Description
A Time Series Approach to Forecast Highway Peak Period Spreading and Its Application in Travel Demand Modeling
 A Time Series Approach to Forecast Highway Peak Period Spreading and Its Application in Travel Demand Modeling Sabya Mishra (University of Memphis) Timothy F. Welch (Georgia Institute of Technology) Subrat
IOWA DEPARTMENT OF TRANSPORTATION. Request for Proposal
 IOWA DEPARTMENT OF TRANSPORTATION Request for Proposal for PHASE II DEVELOPMENT OF A STATEWIDE TRAVEL DEMAND MODEL for THE STATE OF IOWA Table of Contents I. GENERAL... 3 A. Introduction... 3 B. Project
Virginia Critical Rural and Urban Freight Corridor Designation WebEx Discussion. September 28, 2017, 10:30 12:00
 Virginia Critical Rural and Urban Freight Corridor Designation WebEx Discussion September 28, 2017, 10:30 12:00 Agenda Introductions Purpose National Highway Freight Network Eligibility requirements Data
Draft Update Presented to the Grand Forks East Grand Forks MPO TAC
 GRAND FORKS EAST GRAND FORKS 2015 TRAVEL DEMAND MODEL UPDATE DRAFT REPORT Draft Update Presented to the Grand Forks East Grand Forks MPO TAC August 9 th 2017 Diomo Motuba, PhD Advanced Traffic Analysis
Recommended Roadway Plan Section 3 Existing Facilities & System Performance
 Recommended Roadway Plan Section 3 Existing Facilities & System Performance RECOMMENDED ROADWAY PLAN SECTION 3 Existing Facilities and System Performance 3.1 Introduction An important prerequisite to transportation
Statewide Model Topics
 Statewide Models 1 Statewide Model Topics Why do we need Statewide Models Statewide model theory and typical steps Similarities and differences with urban models Data needs and considerations Validation
Bow Concord I-93 Improvements City of Concord Transportation Policy Advisory Committee
 Bow Concord I-93 Improvements City of Concord Transportation Policy Advisory Committee December 15, 2016 Agenda Project History / Project Development Process Traffic Modeling Alternatives Development o
Updating Virginia s Statewide Functional Classification System. Briefing to MPOs, PDCs, and Local Governments
 Updating Virginia s Statewide Functional Classification System Briefing to MPOs, PDCs, and Local Governments October 15 & 19, 2012 Functional Class 101 Shelton s FC Game Research Phase Today s Review New
Travel Demand Modeling At NCTCOG
 Travel Demand Modeling At NCTCOG Arash Mirzaei North Central Texas Council Of Governments For University of Texas at Arlington ITE Student Chapter March 9, 2005 Agenda Background DFW Regional Model Structure
CHAPTER 9 TRAVEL DEMAND MODEL SUMMARY
 CHAPTER 9 TRAVEL DEMAND MODEL SUMMARY This chapter describes the OKI / MVRPC regional travel demand model, used to support traffic and transit forecasts for the NSTI study. This model is based on version
APPENDIX TRAVEL DEMAND MODELING OVERVIEW MAJOR FEATURES OF THE MODEL
 APPENDIX A TRAVEL DEMAND MODELING OVERVIEW The model set that the Central Transportation Planning Staff (CTPS), the Boston Region Metropolitan Planning Organization s (MPO) technical staff, uses for forecasting
MOBILITY AND ALTERNATIVES ANALYSIS
 6 MOBILITY AND ALTERNATIVES ANALYSIS BACK OF SECTION DIVIDER 6.0 Mobility and Alternatives Analysis Travel demand analysis provides a framework for the identification of transportation facilities and services
All Roads Do Not End at the State Line: Methodologies for Enabling Geodata Sharing Across Boundaries
 All Roads Do Not End at the State Line: Methodologies for Enabling Geodata Sharing Across Boundaries presented to 22 nd Geospatial Information Systems for Transportation Symposium presented by Julie Chizmas,
Model Construction and Calibration Technical Documentation Draft
 430 IACC Building Fargo, ND 58105 Tel 701-231-8058 Fax 701-231-1945 www.ugpti.org www.atacenter.org Model Construction and Calibration Technical Documentation Draft January, 2004 Prepared for: Bismarck/Mandan
TM-1 District One Regional Model ( ) Executive Summary. February 2016
 Executive Summary. February 2016") TM-1 District One Regional Model (2010-2040) Executive Summary February 2016 This report: TM-1 Introduction to the D1RPM and Validation Report provides an overall reviews of the model and contains summary
TM-1 District One Regional Model (2010-2040) Executive Summary February 2016 This report: TM-1 Introduction to the D1RPM and Validation Report provides an overall reviews of the model and contains summary
The Rhode Island Statewide Travel Demand Forecasting Model Sudhir Murthy and Rajesh Salem Louis Berger & Associates, Inc. INTRODUCTION.
 The Rhode Island Statewide Travel Demand Forecasting Model Sudhir Murthy and Rajesh Salem Louis Berger & Associates, Inc. INTRODUCTION Purpose The Rhode Island Statewide Travel Demand Forecasting Model
Modeling Applications for Freight Tennessee DOT Freight Planning
 Modeling Applications for Freight Tennessee DOT Freight Planning presented to Tennessee Model Users Group presented by Dike Ahanotu Cambridge Systematics, Inc. July 17, 2008 Transportation leadership you
MINIMUM TRAVEL DEMAND MODEL CALIBRATION and VALIDATION GUIDELINES FOR STATE OF TENNESSEE UPDATED 2012
 MINIMUM TRAVEL DEMAND MODEL CALIBRATION and VALIDATION GUIDELINES FOR STATE OF TENNESSEE UPDATED 2012 By: Dr. Fred Wegmann Dr. Jerry Everett Center for Transportation Research University of Tennessee Knoxville,
TEXAS FREIGHT MOBILITY PLAN 2017
 TEXAS FREIGHT MOBILITY PLAN 2017 Texas Transportation Commission September 28, 2017 Overview of the Texas Freight Mobility Plan 2016 Plan First multimodal freight mobility plan Identified freight network,
Validation and Sensitivity Considerations For Statewide Models
 Validation and Sensitivity Considerations For Statewide s NCHRP 836-B Task 91 presented to 2011 TRB 90th Annual Meeting presented by Cambridge Systematics, Inc. Robert G. Schiffer, AICP, Principal January
Freight Transportation Planning and Modeling Spring 2012
 Freight Model Validation Techniques Abstract Several reviews of validation techniques for statewide passenger and freight models have been published over the past several years. In this paper I synthesize
GDOT-Office of Planning Update
 GDOT-Office of Planning Update GAMPO Conference Athens, Georgia Matthew Fowler, PTP Assistant Planning Administrator November 30, 2010 AGENDA Atlanta Region Managed Lane System Plan I-85 HOV to HOT Conversion
SHOALS AREA Long Range Transportation Plan. Prepared for: Northwest Alabama Council of Local Governments. Prepared by: Skipper Consulting, Inc.
 SHOALS AREA 2030 Long Range Transportation Plan Prepared for: Northwest Alabama Council of Local Governments Prepared by: Skipper Consulting, Inc. December 2005 SHOALS AREA 2030 Long Range Transportation
INDIANA S INTERMODAL MANAGEMENT SYSTEM Stephen C. Smith Planning Manager, Transportation Planning Division Indiana Department of Transportation
 96 INDIANA S INTERMODAL MANAGEMENT SYSTEM Stephen C. Smith Planning Manager, Transportation Planning Division Indiana Department of Transportation Indiana is in the process of developing an Intermodal
VEHICLE PARTICULATE EMISSIONS ANALYSIS
 VEHICLE PARTICULATE EMISSIONS ANALYSIS Prepared for ARIZONA DEPARTMENT OF TRANSPORTATION TRANSPORTATION PLANNING DIVISION MPOs/COGs AIR QUALITY POLICY AND LOCAL PROGRAMS SECTION AND YUMA METROPOLITAN PLANNING
APPENDIX D. Glossary D-1
 APPENDIX D Glossary D-1 Glossary of Transportation Planning Terms ANNUAL AVERAGE DAILY TRAFFIC (AADT): The total number of vehicles passing a given location on a roadway over the course of one year, divided
NC State Freight Plan
 NC State Freight Plan NCARPO Quarterly Meeting January 26, 2017 Agenda NC Freight Tool Freight System Designation Update on Schedule and Tasks Next Steps 1 NC FREIGHT TOOL NC Freight Tool Overview Based
TDOT's New Staffs, Future Plans, and opportunities for Collaboration with MPOs
 TDOT's New Staffs, Future Plans, and opportunities for Collaboration with MPOs David Lee, Assistant Director February 7, 2017 Organizational Chart Long Range Planning Organizational Chart Data Management
Florida Multimodal Statewide Freight Model
 Florida Multimodal Statewide Freight Model Model inputs and structure, and integration with regional truck-touring models Presented by Colin Smith, RSG Freight Issues in Florida Florida has a large, complex,
Contents i Contents Page 1 A New Transportation Plan Community Involvement Goals and Objectives... 11
 Contents i Contents 1 A New Transportation Plan... 1 Why develop a new plan?... 1 What area does the LRTP focus on?... 2 Why is this LRTP important?... 3 Meeting Requirements for Transportation Planning...
PROJECTS. The KIPDA MPO s Central Location
 PROJECTS Freight The economy of the Louisville KY-IN) Metropolitan Planning Area MPA), similar to that of the United States as a whole, is largely dependent on the efficient, reliable, and safe movement
The Policies section will also provide guidance and short range policies in order to accomplish the goals and objectives.
 4 Goals & Objectives INTRODUCTION The 2015-2040 MTP preserves and promotes the quality of life and economic prosperity of the MAB by providing a transportation system consistent with the regional goals.
TRANSEARCH Data for Planning in Tennessee. By Jerry Everett The University of Tennessee, Knoxville
 TRANSEARCH Data for Planning in Tennessee By Jerry Everett The University of Tennessee, Knoxville Scope of My Presentation Our Data Related Project Tasks The Data s Characteristics Examples of Analysis
Memphis and Shelby County. Metropolitan Planning Organization (MPO) Travel Demand Model. Tennessee-Kentucky Model User Group Meeting
 Travel Demand Model. Tennessee-Kentucky Model User Group Meeting") Memphis and Shelby County Metropolitan Planning Organization (MPO) Travel Demand Model Tennessee-Kentucky Model User Group Meeting October 26, 2006 Model Development Team Kimley-Horn and Associates, Inc.
Memphis and Shelby County Metropolitan Planning Organization (MPO) Travel Demand Model Tennessee-Kentucky Model User Group Meeting October 26, 2006 Model Development Team Kimley-Horn and Associates, Inc.
Appendix D: Functional Classification Criteria and Characteristics, and MnDOT Access Guidance
 APPENDICES Appendix D: Functional Classification Criteria and Characteristics, and MnDOT Access Guidance D.1 Functional classification identifies the role a highway or street plays in the transportation
Estimating Freight Activity on Major Highways with the Freight Analysis Framework (FAF)
") Bureau of Transportation Statistics Estimating Freight Activity on Major Highways with the Freight Analysis Framework (FAF) Geospatial Interest Group of the Federal Committee on Statistical Methodology
Bureau of Transportation Statistics Estimating Freight Activity on Major Highways with the Freight Analysis Framework (FAF) Geospatial Interest Group of the Federal Committee on Statistical Methodology
Proposed Comprehensive Update to the State of Rhode Island s Congestion Management Process
 Proposed Comprehensive Update to the State of Rhode Island s Statewide Planning Program January 2018 Summary Outline of of Action Steps 1. Develop Objectives for Congestion Management What is the desired
Presented to : I 710 Project Committee June 30, 2011
 Presented to : I 710 Project Committee June 30, 2011 Overview Metro s Public Private Partnership (PPP) program Traffic Effects of Tolling Trucks on I 710 Statutory Authority for Tolling Interstate Highways
CHAPTER 5. City of Greensburg Comprehensive Plan. Introduction. Transportation Goals & Objectives
 CHAPTER 5 TRANSPORTATION Introduction The transportation system forms the backbone of the community. I-74 provides the community with connections to larger metropolitan areas such as Indianapolis and Cincinnati.
Chapter 8 Travel Demand Forecasting & Modeling
 Chapter 8 Travel Demand Forecasting & Modeling The Travel Demand Forecasting and Modeling process for the Jackson MPO was developed in cooperation between the Region 2 Planning Commission (R2PC) and the
Feasibility of a Statewide Travel
 Contract No. 6 (PS 6); NDSU Project# --FAR Contract No. 6 (PS 6); NDSU Project# --FAR nesota Modeling Group MeetingnPresentation Feasibility of a Statewide Travel Demand Model Contract No. 6-(PS 6) NSDU
Overview of the Draft Highway Primary Freight Network. November 20, :00 2:30 pm ET Coral Torres Ed Strocko
 Overview of the Draft Highway Primary Freight Network November 20, 2013 1:00 2:30 pm ET Coral Torres Ed Strocko 1 MAP-21 Language for Designation of National Freight Network In general: The Secretary shall
Appendix D Functional Classification Criteria and Characteristics, and MnDOT Access Guidance
 Appendix D Functional Classification Criteria and Characteristics, and MnDOT Access Guidance Functional classification identifies the role a highway or street plays in the transportation system. Some highways
A Comparison of CEMDAP Activity-Based Model With DFWRTM 4-Step Model
 A Comparison of CEMDAP Activity-Based Model With DFWRTM 4-Step Model Arash Mirzaei P.E. NCTCOG - Arlington, Texas and Naveen Eluru UT Austin - Austin, Texas for 11 th TRB National Transportation Planning
Effectively Using the QRFM to Model Truck Trips in Medium-Sized Urban Communities
 Effectively Using the QRFM to Model Truck Trips in Medium-Sized Urban Communities By Dr. Michael Anderson and Mary Catherine Dondapati Department of Civil and Environmental Engineering The University of
What is the Dakota County Principal Arterial Study?
 What is the Dakota County Principal Arterial Study? The Dakota County is underway and will address future designations of certain highways as Principal Arterials. What Are Principal Arterials? Principal
Traffic Data Collection Programs for PM 2.5 Non-Attainment Areas
 Traffic Data Collection Programs for PM 2.5 Non-Attainment Areas Jack Stickel Alaska Department of Transportation and Public Facilities NATMEC 23 June, 2010 Traffic Data to Address Air Quality and Climate
Central Minnesota. Regional Freight Profile
 Central Minnesota Regional Freight Profile Working DRAFT May 21 Minnesota Department of Transportation The purpose of the Central Regional Freight Profile is to document freight movement trends in the
MAP 21 Freight Provisions and Seaports
 MAP 21 Freight Provisions and Seaports September 20, 2012 American Association of Port Authorities 703.684.5700 www.aapa-ports.org 3 New Freight Eligibility in Core Highway Formula Programs Surface Transportation
NYSDOT Roadway Inventory. Both On and Off the State System
 NYSDOT Roadway Inventory Both On and Off the State System 1 2 NYSDOT Highway Data Services Bureau Highway Data Traffic Monitoring Pavement Data Inventory of public roads, incl. LHI Systems designations
Statewide Travel Demand Model Update
 Statewide Travel Demand Model Update Request for Proposal Iowa Department of Transportation Introduction The Iowa Department of Transportation s (Iowa DOT) Office of Systems Planning is interested in entering
Travel Demand Modeling Applications How Modeling is Being Used to Address the Big Issues of Transportation Planning
 How Modeling is Being Used to Address the Big Issues of Transportation Planning Presented by: Dean Munn The Corradino Group Topics This Presentation is organized around two main topics: What is a travel
Development of a Statewide Freight Trip Forecasting Model for Utah
 Development of a Statewide Freight Trip Forecasting Model for Utah Kaveh Shabani (Corresponding Author) Resource Systems Group Salt Lake City, Utah Phone: 0--00 Email: kaveh.shabani@rsginc.com Chad Worthen
Congestion Management Process (CMP)
") Congestion Management Process (CMP) Introduction The Congestion Management Process (CMP) is a systematic, data-driven, and regionally accepted approach that aims to improve the performance of the transportation
Congestion Management Process (CMP) Introduction The Congestion Management Process (CMP) is a systematic, data-driven, and regionally accepted approach that aims to improve the performance of the transportation
1. INTRODUCTION AND BACKGROUND
 1. INTRODUCTION AND BACKGROUND Transportation planning has focused on moving people efficiently and safely. Freight demand modeling and assignment have received limited attention with little or no integration
Highest Priority Performance Measures for the TPP
 Highest Priority Performance Measures for the TPP The following list of measures are the highest priority performance measures as identified by modal working groups. These groups consist of staff from
Fargo Moorhead MPO 2010 Regional Travel Demand Model Update Technical Report-DRAFT. June 2013
 430 IACC Building Fargo, ND 58105 Tel 701-231-8058 Fax 701-231-1945 www.ugpti.org www.atacenter.org Fargo Moorhead MPO 2010 Regional Travel Demand Model Update Technical Report-DRAFT June 2013 Prepared
INTERSTATE CORRIDOR PLANNING
 INTERSTATE CORRIDOR PLANNING Prioritization of Corridor Studies July 29, 2015 Importance of the Interstate System Texas is an integral part of the national interstate system. The interstate system provides
INCLUSION OF TIME-DEPENDENT NETWORKS IN MARYLAND STATEWIDE TRANSPORTATION MODEL
 INCLUSION OF TIME-DEPENDENT NETWORKS IN MARYLAND STATEWIDE TRANSPORTATION MODEL Prepared by: The National Center for Smart Growth Research and Education at the University of Maryland* in partnership with
AMPO Annual Conference Session: Performance (Part 1) October 18, 2017 Savannah, GA
 October 18, 2017 Savannah, GA") AMPO Annual Conference Session: Performance (Part 1) October 18, 2017 Savannah, GA Introduction: North Jersey Transportation Planning Authority NJTPA Congestion Management Process Study Goals Analysis
AMPO Annual Conference Session: Performance (Part 1) October 18, 2017 Savannah, GA Introduction: North Jersey Transportation Planning Authority NJTPA Congestion Management Process Study Goals Analysis
AGENDA ITEM A: WELCOME & INTRODUCTIONS
 November 21, 2013 NYBPM Base Year Update & Validation - 2010 1 AGENDA ITEM A: WELCOME & INTRODUCTIONS Michael Chiume November 21, 2013 NYBPM Base Year Update & Validation - 2010 2 AGENDA ITEM B: PROJECT
Performance Based Planning and Federal Target Setting. Transportation Policy Board September 13, 2018
 Performance Based Planning and Federal Target Setting Transportation Policy Board September 13, 2018 Federal Requirements - Background MAP-21 and the FAST Act established new emphasis on performance and
NEW YORK TRANSPORTATION FACTS ECONOMIC IMPACTS
 The 2015 U.S. Transportation Construction Industry Profile: New York page 1 NEW YORK TRANSPORTATION FACTS ECONOMIC IMPACTS The design, construction and maintenance of transportation infrastructure in New
MINNESOTA. Jurisdictional Realignment Project Final Report
 MINNESOTA Jurisdictional Realignment Project Final Report November 2012 Table of Contents Executive Summary... 1 Objective... 1 Approach... 1 Prior studies... 2 Phase 1 Assigning the right roads to the
Regional Performance Measures Annual Progress Report TPO Board - 2/4/2016 Presentation by: Chris Wichman, Senior Planner
 2015 TPO Board - 2/4/2016 Presentation by: Chris Wichman, Senior Planner Overview History and definition of performance-based planning & programming Review of 2015 TPO Board Action Requested 2 History
Regional Transportation Profile Guidelines. final. report. April tpd.azdot.gov
 final report April 2005 tpd.azdot.gov Regional Transportation Profile Guidelines Arizona Department of Transportation Transportation Planning Division April 2005 Table of Contents 1.0 Introduction... 1-1
TECHNICAL MEMORANDUM. The purpose of this memorandum is to document our VMT estimates and reductions for the SEASP project.
 TECHNICAL MEMORANDUM Date: To: From: Nicole Morse, Placeworks Jason D. Pack, P.E. Subject: Vehicle Miles Traveled (VMT) for The SEASP Project Fehr & Peers completed our efforts to assist in quantifying
RTC Position on Pavement Condition Targets
 RTC Position on Pavement Condition Targets NCTCOG Supports TxDOT Statewide 2022 Good Pavement Condition Targets for National Highway System Facilities NCTCOG Supports TxDOT Statewide 2022 Poor Pavement
U.S. 220 Multimodal Corridor
 U.S. 220 Multimodal Corridor Traversing the southwestern part of Virginia from North Carolina to Roanoke, the U.S. 220 Corridor connects to the national freight transportation system via several highway
report final Decennial Model Update Executive Summary Contra Costa Transportation Authority Cambridge Systematics, Inc.
 final report prepared for Contra Costa Transportation Authority prepared by with Dowling Associates Caliper Corporation June 2003 Table of Contents 1.0 Introduction... ES-1 2.0 Data Development... ES-5
technical report KATS Travel Model Update Technical Documentation Kalamazoo Area Transportation Study Cambridge Systematics, Inc.
 Technical Documentation technical report prepared for Kalamazoo Area Transportation Study prepared by Cambridge Systematics, Inc. with Dunbar Transportation Consulting June 29, 2015 www.camsys.com report
GENESEE COUNTY URBAN TRAVEL DEMAND MODEL IMPROVMENTS
 GENESEE COUNTY URBAN TRAVEL DEMAND MODEL IMPROVMENTS Model Development and Validation Report Prepared for the Genesee County Metropolitan Planning Commission January 2009 Revised May 2009 Prepared by Bernardin,
Review of Travel Demand Forecasting Requirements in the SDDOT
 SD2006-06-F SD Department of Transportation Office of Research Review of Travel Demand Forecasting Requirements in the SDDOT Study SD2006-06 Final Report Prepared by Bucher, Willis & Ratliff Corporation
Massive GPS Travel Pattern Data for Urban Congestion Relief in the Twin Cities
 Massive GPS Travel Pattern Data for Urban Congestion Relief in the Twin Cities 27th Annual CTS Transportation Research Conference Paul Morris, PE SRF Consulting Group, Inc. November 3, 2016 Project Location
Appendix G: Travel Demand Model Documentation
 Appendix G: Travel Demand Model Documentation Skagit Council of Governments TRAVEL DEMAND MODEL DOCUMENTATION August 2015 Prepared by: 11730 118 th Avenue NE, Suite 600 Kirkland, WA 98034-7120 Phone: 425-821-3665
The services of the Consultant are outlined in this exhibit by task and will consist of, but not limited to the following:
 Scope of Work: Travel Demand Model Update Phase 2: Southeast Louisiana Travel Model, New Orleans (SELATRAM) RPC Project TDMNO State Project No. H.972274 Project Description The purpose of this contract
2015 AMARILLO MPO EXTERNAL STUDY
 2015 AMARILLO MPO EXTERNAL STUDY Technical Summary August 2018 Prepared by the Texas A&M Transportation Institute 2015 Amarillo MPO External Study Using Cellular and GPS Data Technical Summary Texas Department
Central Data Repository for Traffic Data Collection in Rural Areas and Corridors Supporting Freight Mobility
 Central Data Repository for Traffic Data Collection in Rural Areas and Corridors Supporting Freight Mobility Tuesday, October 23, 2018 Michael Wieck International Road Dynamics Starting Point Technology
Florida Freight Supplychain Intermodal Model
 Florida Freight Supplychain Intermodal Model Innovations in Travel Modeling 2014 April 29, 2014 Introduction Support freight plan development Office of Freight Logistics and Passenger Operations Evaluate
Tennessee Model Users Group. Organizational Meeting December 2, 2004
 Tennessee Model Users Group Organizational Meeting December 2, 2004 Introduction Steve Allen Transportation Manager 2 Traffic Planning & Statistics Office Planning Division TDOT Education Associate of
Multimodal Freight Transportation Policy Overview
 Multimodal Freight Transportation Policy Overview Tiffany Julien U.S. Department of Transportation Federal Highway Administration Transportation Specialist Tiffany.julien@dot.gov Fixing America s Surface