Tennessee Model Users Group. Organizational Meeting December 2, 2004
|
|
|
- Augustus McCormick
- 5 years ago
- Views:
Transcription

1 Tennessee Model Users Group Organizational Meeting December 2, 2004
2 Introduction Steve Allen Transportation Manager 2 Traffic Planning & Statistics Office Planning Division TDOT
3 Education Associate of Engineering: Architectural Engineering Nashville State Technical Institute Bachelor of Science: Civil Engineering Tennessee State University
4 Background 28 year TDOT employee Design and Surveys 11 Years 17 years in Traffic Engineering Associate Member American Society of Civil Engineers Secretary/Treasurer Institute of Transportation Engineers
5 Traffic Planning & Statistics Office Steve Allen, Transportation Manager 2 The objective of our office is to collect, analyze, maintain, and distribute traffic data for the roadway system
6 Traffic Planning & Statistics Office Traffic Planning & Surveys Section Traffic Statstics & Safety Planning Section
7 Traffic Planning & Statistics Office Traffic Planning & Surveys Tony Armstrong Transportation Manager 1 Traffic Planning develops and test assumptions to forecast present and future traffic on Network and Project reports Traffic Surveys collects traffic volumes, vehicle classifications, occupancy, and vehicle weights
8 Traffic Surveys

9 Tube Count There are 11,995 regular counts made with some occurring every year and others occurring on a 2 to 3 year cycle.
10 Ramp Count There are 886 Ramp Counts made every year

11 Weigh-in-Motion Count There were 140 Truck Classification counts and 22 statewide Weigh-in-Motion counts made in 2003

12 Turning Movement Count In 2003 there were 74 Turning Movement Counts executed. There have been 43 so far for 2004
13 Traffic Forecasting Forecasting future traffic in Tennessee Capacity Analysis Traffic Simulation Reviewing and approving traffic data for all users (MPO, Consultants, Counties, Cities, etc.)
14 Traffic Forecasting Transportation Record 1203 Traffic Volume forecasting Methods For Rural State Highways Developing future traffic estimates is not an exact science.
15 Traffic Forecasting Statistics Tennessee traffic monitoring consists of thirty (30) Automatic Traffic Recorders (ATR) and nearly twelvethousand(12,000) coverage count (cycle count) locations on an annual / rotating basis. Chattanooga, Memphis, Knoxville & Nashville feature eight hundred eighty six (886) additional ramp traffic counts
16 The Forecasting group was responsible for 378 projects in 2003
17 Design Hour Volume (DHV) DHV = Peak Hour traffic volume multiplied by the factor TDOT uses the Thirty (30th) highest hour. Allows for fluctuations in daily traffic count.
18 Example: DHV Peak hour/ Total 24 hour volume 3846 / = 6.5% 7% 7% * 1.2 = 8.4% 9% DHV TDOT uses a standard 1.2 factor for 30 th Highest Hour.
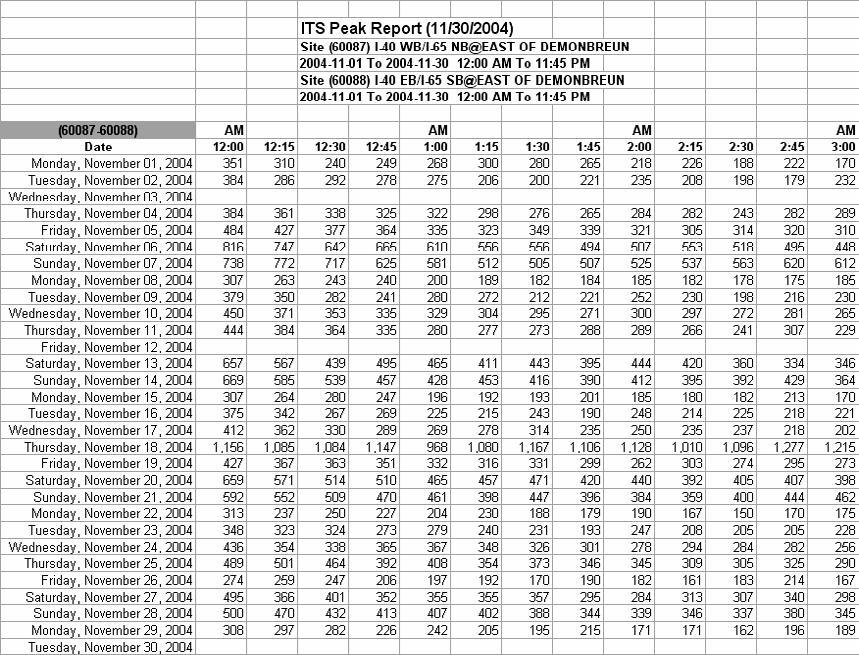
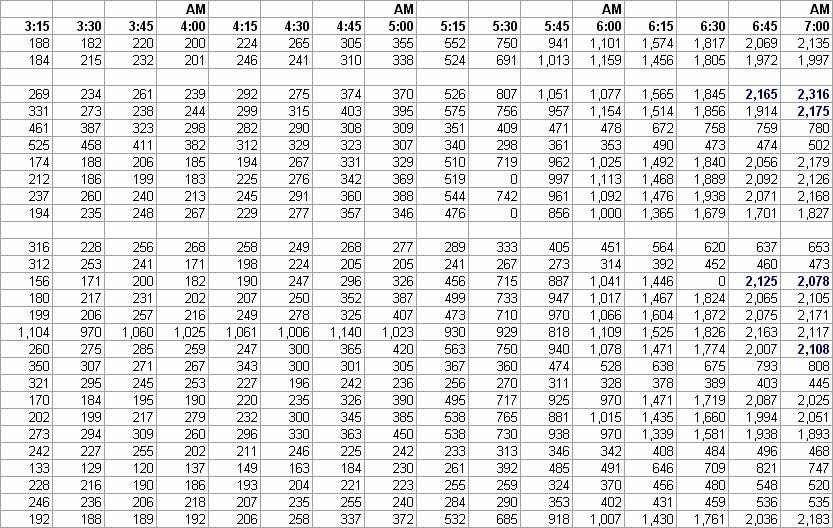
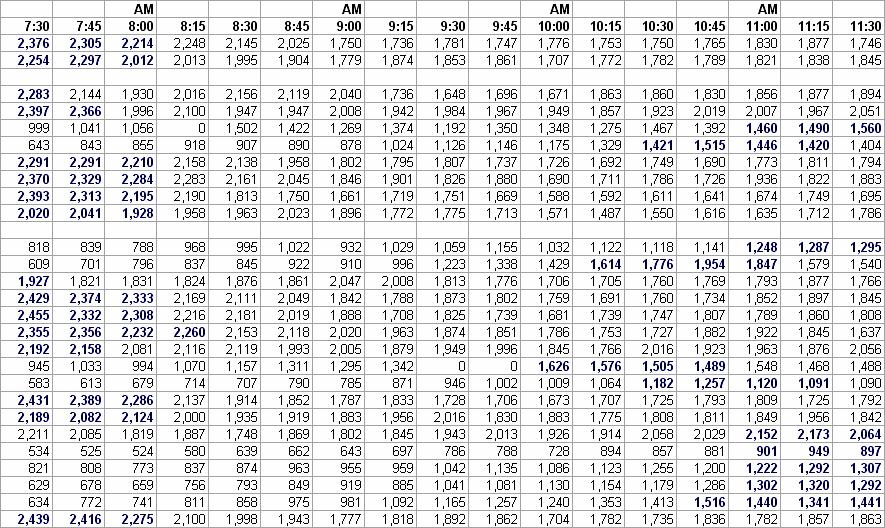
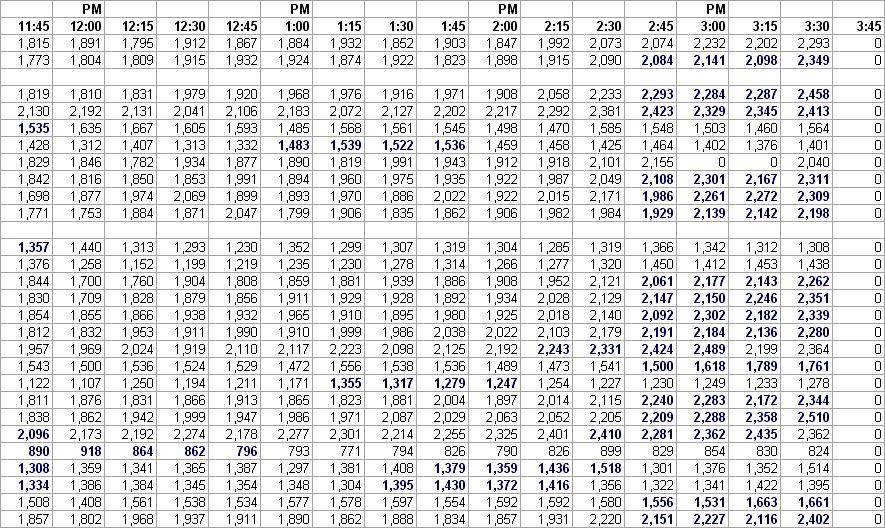
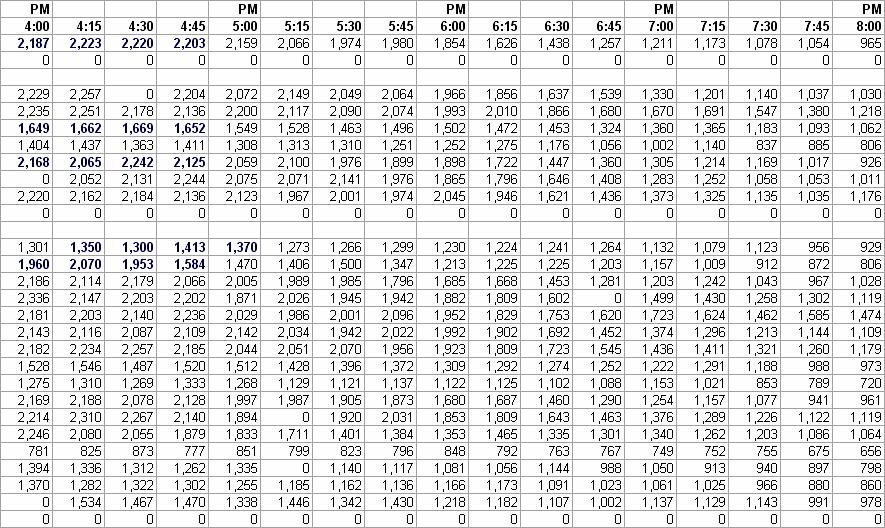
19 Purpose: To measure the traffic fluctuation within one hour Peak Hour Factor (PHF) PHF = HourlyVolu me Max. RateofFlow Explanations: The most complex variation in traffic occurs by hour The peak hour of traffic volume represents the most critical period for traffic operations Capacity and other traffic analysis focus on the peak hour The relationship between hourly traffic volume* and the maximum rate of flow** within the hour is defined as Peak Hour Factor (PHF) Time Period Rate of Flow - Volume (veh.) 5:01 5: :16 5: :31 5: :46 6: Total 8000 PHF = 8000/{4 x 2200} = 0.91 *Traffic volume is the total number of vehicles **Rate of flow is equivalent hourly rate
20 Peak-Hour Factor (PHF) PHF higher for oversaturated conditions PHF lower for under saturated conditions Approximations can be used in the absence of field measurements 0.95 is a reasonable approximation for congested conditions Default Values may be used in absence of local data for Urban Areas 0.88 for Rural Areas Source: Highway Capacity Manual 2000
21 No one can perfectly forecast the future. TDOT has the tools and expertise to provide substantiated traffic volumes and forecasts
22 Traffic Statistics & Safety Planning Section Harold Dilmore, Transportation Manager 1 Traffic Statistics is responsible for maintenance of traffic information in the ADAM and TRIMS systems, annually produces the Tennessee City and County Traffic Maps Book, produces all traffic maps and maintains and updates ADT Book and Traffic History websites, annually produces the HPMS to the FHWA. Safety Planning maintains the state s Traffic Crash Database and prepares Crash statistics in an attempt to identify and evaluate crash sites and hazardous areas to improve overall safety of Tennessee roadways
23 Traffic Statistics

24 ADAM (Advanced traffic Data Analysis and Management)
25 Question: We have access to live data in ADAM and TRIMS through a VPN connection with TDOT although I need some training and/or a user's guide in order to be able to fully utilize these programs.

26 ADAM is best viewed at 1024 x 768 pixels. To Login: Because everyone has viewer rights, you can either enter, in small-case letters, viewer for both User Name & Password or just click on the upper right-hand X.
27 To see the count history: First, Click on Coverage.

28 Next, Click on Trend Data.

29 Choose the County from the drop-down list.
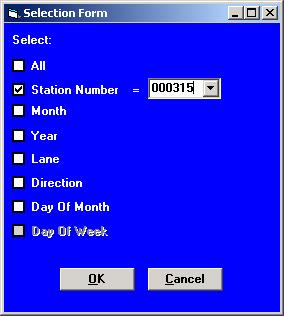
30 Choose the Station Number you want to look at. ( If there is a Y under the Out column, that means that this Station is no longer being counted. There may be a traffic history, but it is no longer an active Count Station.) To see a graph of this location, choose the Graph button in the lower right-hand corner.

31 The red line is a mean average of each of the years. The blue line shows the peaks / valleys of each individual year. To print, choose the Print Graph button. To analyze the yearly growth rate, choose the Trend Analysis button.
32 Question: What is the procedure used by ADAM to "correct" ADT counts (sometimes an "actual" count is given that is quite a bit different)? Are hourly counts going to be made available on the web? Answer: Hourly counts are available through VPN but will probably not be available on the web.

33 Sample print:.
34 The 3rd column is the Average Weekday Traffic. This is the raw (actual) count without any factors applied. The 4th column is the Average Daily Traffic. This is the traffic with the variation (monthly and day-of-week) factor applied. The 5th column is the Adjusted Average Daily traffic. This is the Average Daily Traffic with the Truck factor applied. This is the published traffic; the traffic shown in the ADT Book (Traffic Flow Maps) and the Traffic Maps.
35 Question: What is the mechanism that we have to convert short duration counts into accurate estimates of annual conditions? What adjustment has been made to annual conditions to computer AADT from the short duration counts? Are the short duration counts over 48-hour periods or 24-hour period? What is the range of standard deviations of 24-hour monitoring period (e.g. 2 to 25 percent of variability)? Are there documentations on concerning these data (latest documentation in electronic format)? For example, methodology of calculating the seasonal and Day-of-Week adjustment factors from Automatic Traffic Recorder (ATR) data?
36 Traffic Variation factors Derived from the continuous ATR stations. Based on five year averages TDOT is currently working to expand ATR stations and create more precise variation factors.
37 Traffic Variation Factors (TVF) Purpose: Adjustment of the raw short period counts Explanations: ATR stations are stratified into four functional group Day of the week and month of the year factors are calculated for each functional group These factors are averaged with previous four years factors (Extremely high or low factors are deleted) The factors are rounded to two decimal places and presented in the table form 2003 Monthly Variation Factors by Day of Week January February Rural Interstate Sun Mon Tue Wed Thu Fri Sat Rural Other Urban Recreational
38 Variation Factors
39 Axle-Correction Factor Based on a Machine/Manual Classification Count. The Axle-correction factor is required to adjust for multiple axles. The counters count axles, not vehicles. Axle inflation and over-count error are due to the way the road tube counter operates.

40 O Anderson County Traffic Map
 65,751 51,615 / 65,751 0.")
41 Machine Classification Count Axle-Correction Factor Truck percentage (Combination of Single Unit & Multi Unit) 65,751 51,615 / 65,
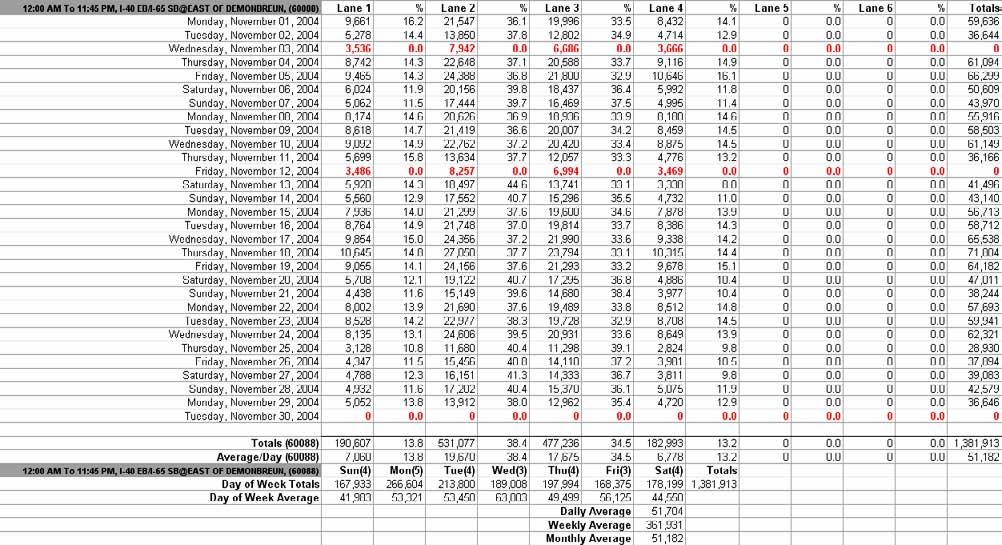
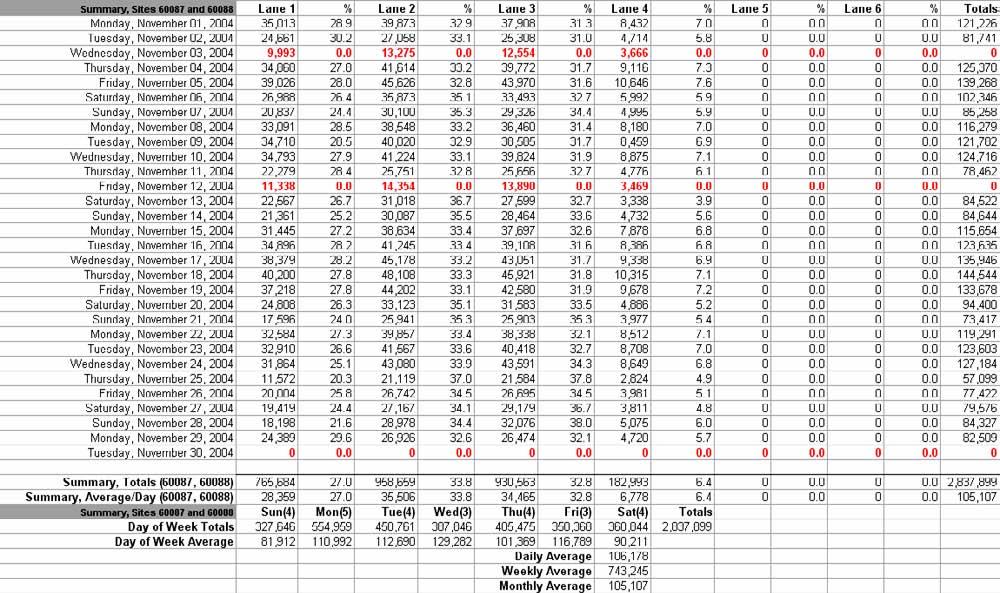
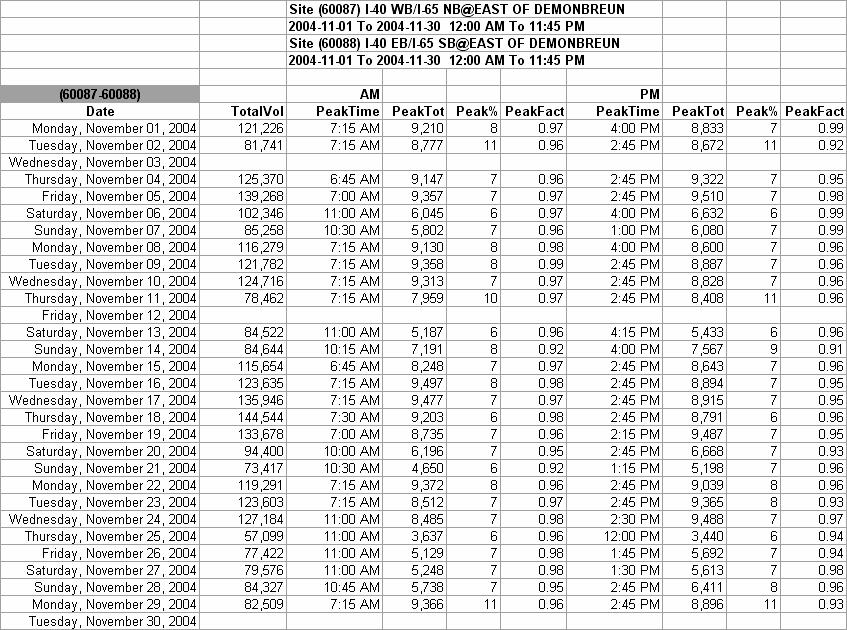
42 This Coverage Count report from ADAM shows 24 hour data for Station Number 84 in Anderson County

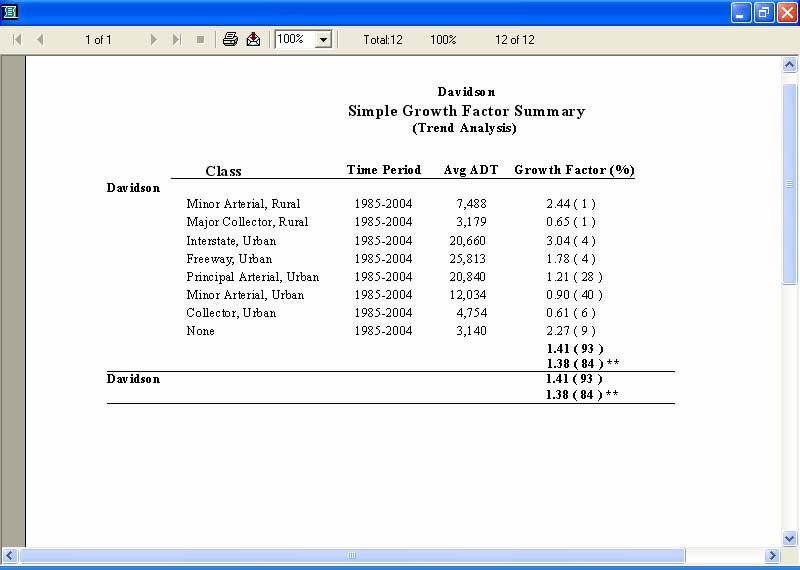
43 Trend Analysis: In the boxes under Enter range of years for forecasting AADT, enter the range of years you would need a forecast. Then choose the Run Analysis button. In this example, you get a Yearly Growth Factor of % per year or 1% as a minimum. (See Slide Number 14 for explanation.)
44 In this example, the graph shows two peak years (1986 & 1995). You may want to exclude these two peaks. To do that, enter the years you want to exclude in the box labeled Excluding: Then choose the Trend Analysis button.
45 By excluding these two years, you now get a different Yearly Growth Factor, which is now 1.717%.
46 Care should be exercised when receiving a negative growth rate. TDOT suggests that you should use caution when a Yearly Growth Factor is less than 1%. You should either use, as a minimum, a 1% growth rate or go back to the Enter Years to be used for Regression Model and enter a range or a start year where it looks like the yearly counts are increasing.

47 While you are on this screen, if you want to see the Yearly Growth Factor for the entire County by total and by type, choose the Detailed Growth button.
48

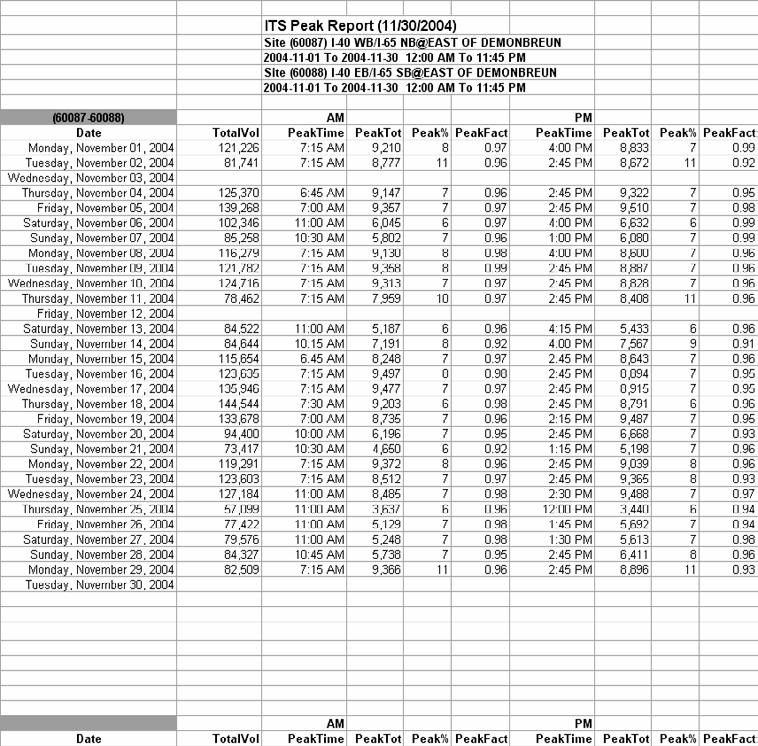
49 Starting in the year 2003 (for some counts in 2002), count information within ADAM contains 15-minute counts. Therefore, peak hour volumes and factors could be derived. This information is displayed, when available.

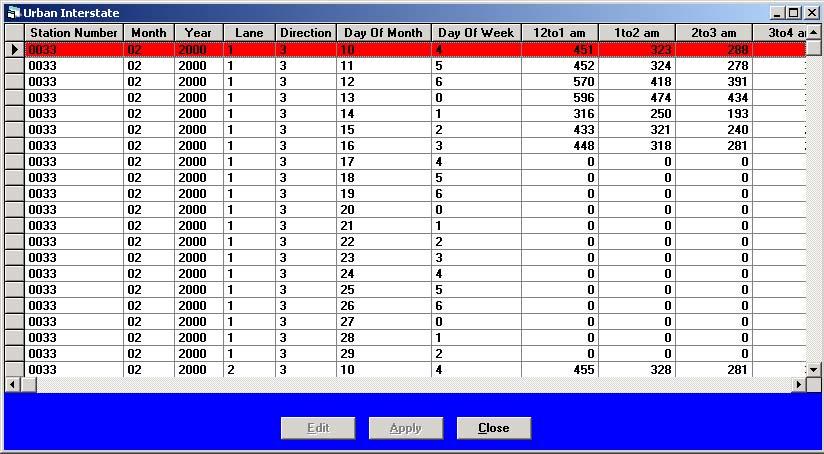
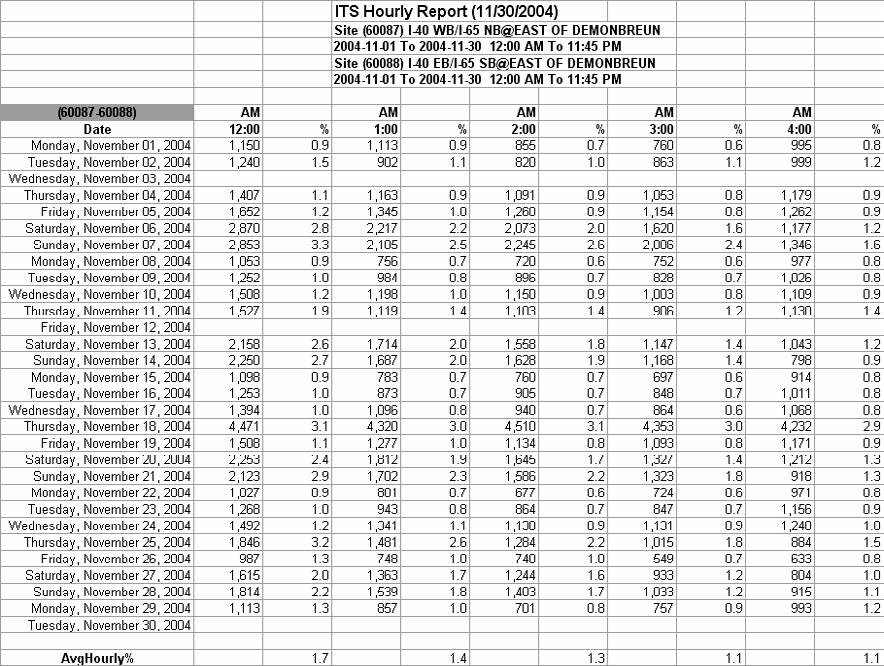
50 24-Hour Data: To see the hourly totals for each of the 24 hours choose the 24-Hour Data button in the lower right-hand corner.

51 24-Hour Data:
52 The ADAM version (Oracle) of the database, stored on TDOT s servers, contains a Map link. Also, on the Trend Data screen there is a button labeled Select by Query (a map function). To obtain the Station Number of the location where you need information, the ADT Book (Traffic Flow Maps) for the year 2003 now contain the majority of these numbers. Traffic maps containing all of the station numbers can be found in the Traffic Statistics Section in the Traffic Planning and Statistics Office of the Planning Division. The Internet has maps showing all of the Traffic Count Station Numbers.
53 ADAM now houses historical records of approximately 14,500 annual cycle traffic counts and 886 ramp traffic counts, dating back to the year ADAM is an evolving database. The database will continue to contain all the cycle counts and ramp counts updated yearly, but will hopefully in the near future also contain modules for all the Automatic Traffic Recorders (ATR), Weigh-in-Motion (WIM), Classification and Structure counts.
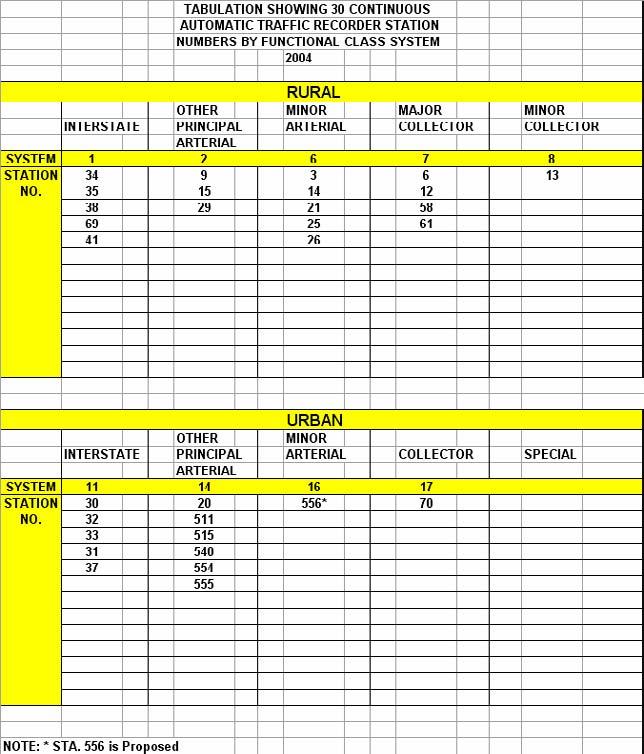
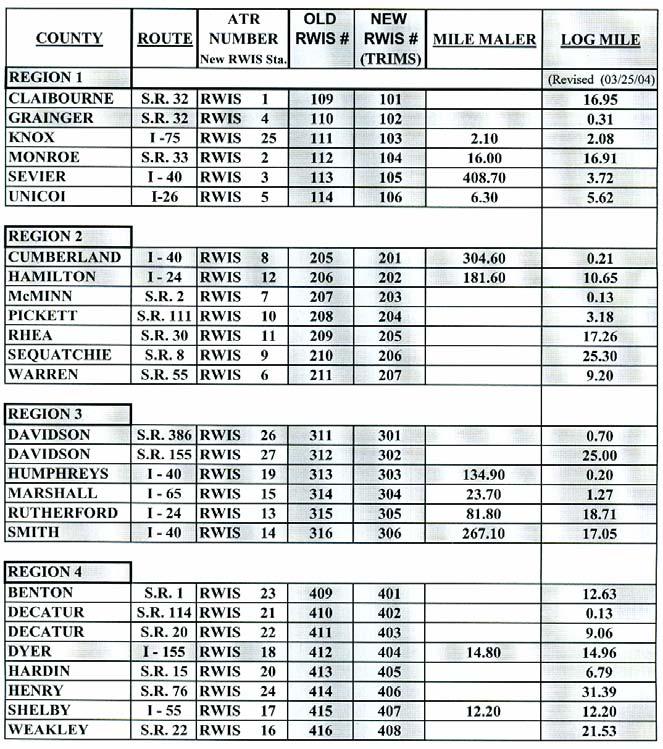
54 ATR Locations
55 Question: How do you determine the appropriate number of continuous ATR locations? How many ATR s are in each group (e.g. Interstate Rural etc.)? Do we have ATR data from several stations and different roadway functional classifications?
56 Question: Do we use the AADT from the ATRs for the sections where the permanent ATR are located? Answer: No, a cycle count is used at each ATR site.
57
58
59
60
61

62 ATR Station Description
63 ADAM: ATR Information

64 ADAM: Continuous ATR Monthly Summary
65 Question: What is the limitation of vehicle automatic vehicle classifiers? What is our state's classification procedure? How are the data collected and summarized? Are the vehicle classification count data by location, by functional classification, by day and by hour? Are the collector and local classes counted? Are Friday, Saturday, and Sundays counted? Etc. etc...
66 Question: TN does have a continuous classification count program, correct? Answer: Yes, approximately 600 classification count locations are performed on a three year rotating basis.
67 Question: Where are these continuous classification count stations located?
68 CLASSIFICATION PROGRAM RURAL 1- INTERSTATE: PRINCIPAL ARTERIAL: MINOR ARTERIAL: MAJOR COLLECTOR: MINOR COLLECTOR: 13 TOTALS: 306 URBAN 11- INTERSTATE: PRINCIPAL ARTERIAL: MINOR ARTERIAL: MAJOR COLLECTOR: MINOR COLLECTOR: LOCAL: 1 TOTALS: 279
69 Question: How are these locations determined? Answer: FHWA statistical sampling. Being reviewed and adjusted. Over 1,000 on state routes and nearly 1400 lower classified routes will have classification counts performed.
70 Question: What types of vehicle classification collection equipment do you use to collect these data? Answer: Diamond Unicorn Counters using dual loops are utilized at sites up to two lanes each direction. 24-hour manual counts are derived on 3+ lanes each direction.
71 Question: How often do we calibrate, test and validate the performance of its classification equipment? Answer: Each counter is visually inspected by the operator at the time of installation. If problems occur, either in house or factory repairs are performed.

72 Weigh in Motion/Classification Station Description

73 Viewing Vehicle Classification information
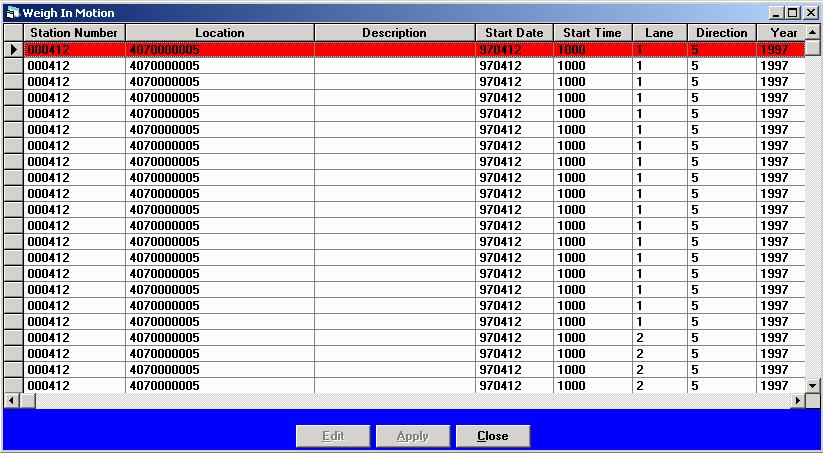
74 Weigh-in-Motion Data
75 Question: What is the range of differences between a mainline volume estimate for the section ending at the end anchor point and the volume computed from data collected at that anchor point? How are the differences handled? Answer: Each anchor point is reviewed for statistical accuracy at a maximum of 15%
76 Question: How do you reconcile of ramp counts to anchor points when using ramp counts to estimate mainline interstate volume? Answer: Manual adjustments to individual ramp counts exceeding allowable percentages are performed.

77 Ramp Stations
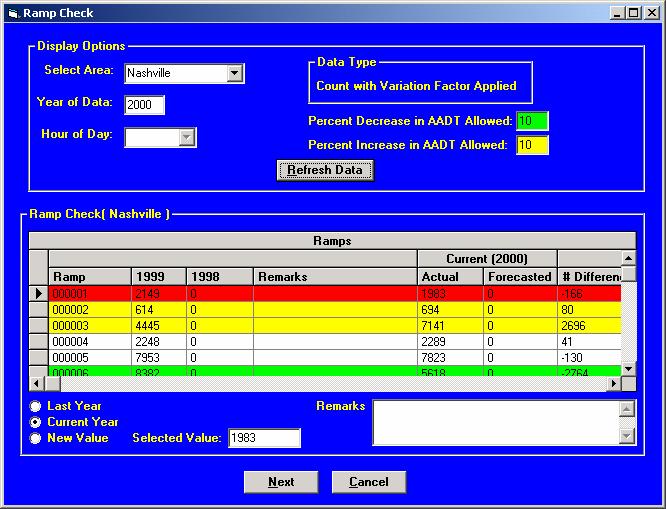
78 Ramp Calibration
79

80 ADT Book on the Internet

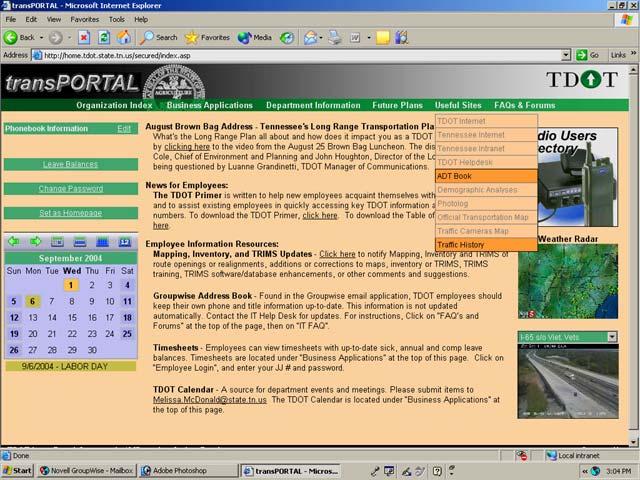
81 Traffic History on the Internet

82 Traffic History on the Internet
83 Question: I have several general questions regarding the HPMS reporting methodology and how the state functional classification system is determined. I think that it would be good to just get a general overview of the methodology that is used to derive the HPMS numbers and also what the process for updating the state functional classification system is.
84 Question: What statistical sampling method is used for the road that are not NHS and other principal arterial; and local roads?
85 HPMS (Highway Performance Monitoring System) The Highway Performance Monitoring System (HPMS) provides data that reflects the extent, condition, performance, use and operating characteristics of the nation s highways Length, lane-mile, and travel data are used for apportionment of Federal-aid highway funds under the Transportation Equity Act for the 21 st century HPMS data are also used for assessing and reporting highway system performance under FHWA s strategic planning process HPMS data form the basis of the analyses that support the Condition and Performance reports to congress HPMS data are the primary source for a substantial portion of the information published in Highway Statistics and other FHWA publications and media HPMS data are widely used throughout the transportation community, including other governmental interests, business and industry, institutions of higher learning, the media and the general public
86 HPMS contains a mix of universe and sample data for arterial and collector functional systems. Limited information on travel and paved miles is included in summary form for the lowest functional systems Roads are classified as to their functional usage. These functional classifications include Interstates, Other Urban Freeways, Principal Arterials, Minor Arterials, Collectors and Local Roads The Rural Functional Classification System is assigned by TDOT s Systems Planning Section. The Urban Functional Classification System is assigned by the individual Small Urban and Urbanized Areas (MPO s) Traffic for the Local functional system is derived from a sampling of counts done at local bridges for the National Bridge Inventory. As more bridges are counted, these estimates will improve HPMS requires a 5-10 percent sample in rural areas and a 10% sample in urban areas The Universe (100% sample) part of HPMS contains general information about the roadway; length, number of lanes, ADT, Functional Class, Ownership The Sample part of HPMS contains more detailed information; Pavement Type, Lane Width, Shoulder Type and Width, Capacity and other information Tennessee uses 100% coverage of traffic data for the arterial and collector functional systems Vehicles are counted on roadway segments to calculate the Average Daily Traffic Daily Vehicle Miles of Travel (DVMT) is calculated for each section of roadway by multiplying the Average Daily Traffic (ADT) by the length of the segment HPMS data is used to produce reports of mileage and travel (DVMT) for Rural, individual Urban Areas and statewide by functional system Traffic data can be combined with other information (such as number of lanes) to provide other reports The traffic data for the local functional system is derived from a sampling procedure The HPMS report is produced each year to represent the state s public road system as of December 31 of that year The HPMS report is to be submitted to FHWA by June 15 of the next year
87 Functional Classification Process The Functional Classification System (FC) is updated two ways; each way dependent on the requesting city being a Large Urban Area or a Small Urban Area. A Small Urban Area may request a change, explain the change, and provide a map in a letter from the mayor. This request is then evaluated by Systems Planning to see if the requirements are met. Each city, regardless if it is large or small, has a percentage of its roads that can be classified. These percentages are established by the Federal Highway Administration. If the percentages are within limits, the section of roadway must meet requirements such as tying into other FC roads and meeting minimum requirements. If the change would put the percentages out of balance a meeting is conducted with the city to remove already classified roads from the system, providing room for the additions. Once these requirements are met, a letter is prepared authorizing the change and published. The FC map is then changed to reflect the revision. For a Small Urban Area, a letter is sent to the Tennessee Regional Development District for delivery to the requesting city. A Large Urban Area would be incorporated into a Metropolitan Planning Organization (MPO). Smaller cities may also be incorporated into the MPO as well (Springfield and Smyrna in Nashville MPO). The request is made through the MPO and comes in the form of a resolution from the MPO Executive Board requesting the change. The same process occurs as happens in the Small Urban Area request. Percentages must be met, road sections must connect, and roads must meet minimum requirements. Upon meeting the requirements, a letter is prepared and published and sent to the MPO. The map is then changed to show the revisions. Should the road sections not meet the minimum requirements, meetings are conducted with the city/mpo and any problems are resolved.
88 Urbanized Areas - MPO Discuss any revisions to the functional classification system with Joe Armstrong or Rusty Staggs before approval by the TCC or the Executive Board. This will insure that all guidelines are met prior to official approval. Any route added as an urban arterial should connect to an equal or higher classified route with the exception of routes entering or leaving the urbanized area boundary. Urban arterials cannot exceed 15% of the total miles within the urbanized area. Any route added as an urban collector should connect to an equal or higher classified route with the exception of routes entering or leaving the urbanized area boundary. Urban collectors cannot exceed 10% of the total miles within the urbanized area. Any functional classification revision has to be approved by the Executive Board with a signed resolution and map. All projects listed in the TIP should be functionally classified.
89 Small Urban Areas Discuss any revisions to the functional classification system with Joe Armstrong or Rusty Staggs before submitting request. This will insure that all guidelines are met prior to official approval. Any revision has to be requested by letter from the Mayor with a route description, and map. Letters can be submitted to Jeanne Stevens, Rusty Staggs, or Joe Armstrong. Any route added as an urban arterial should connect to an equal or higher classified route with the exception of routes entering or leaving the urban boundary. Urban arterials cannot exceed 15% of the total miles within the urban area. Any route added as an urban collector should connect to an equal or higher classified route with the exception of routes entering or leaving the urban boundary. Urban collectors cannot exceed 10% of the total miles within the urban area. Projects have to be classified before federal funds can be spent.
90 Safety Planning Determines the Linear Reference System Locations for Crashes on Interstates, State Highways, and Functionally Classified Routes Prepares Crash Data Reports for Problem Identification and Project Development Prepares a list of Potential Projects for the Hazard Elimination Safety Program Develops Quarterly and Annual Speed Summary Reports for the Tennessee Speed Monitoring Program


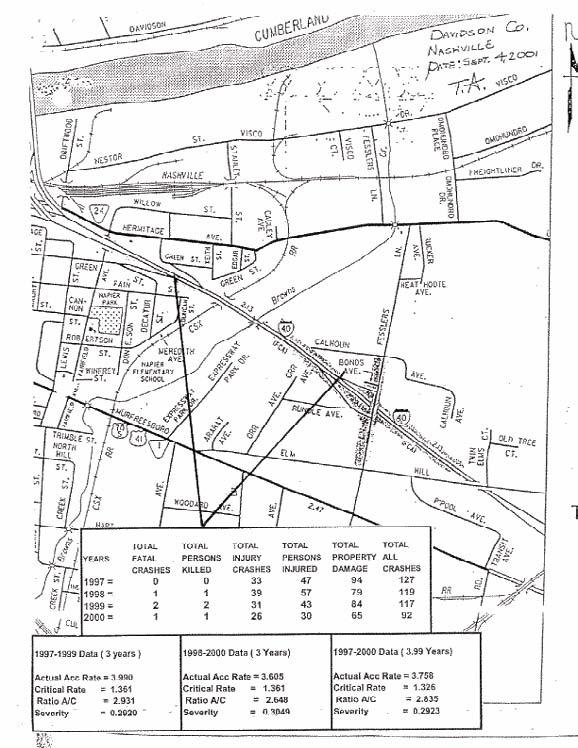
91 Safety Planning Section analyzes approximately 200,000 Crash Reports per year to determine the LRS Location Crash Report
92 Crash Data Reports may include any or all of the following: Crash Records Listing Crash Summary Report Crash Rate Analyses Collision Diagram Copies of Officer s Crash Reports
93 Requested by Nashville MPO Crash Data Request Form
94 Crash Records Listing
95 Crash Summary Report
96
97 Collision Diagram
98
99 Hazard Elimination Safety Program List of potential safety projects Statewide average rates Prepared ever two years. This and all other crash data is protected by Section 409 USC. Any request from outside of TDOT must be made through our legal division. The data cannot be used for any court action
100 Average Crash Rates
101 Intersection Average Crash Rates
102 Speed Monitoring Program Monitoring of Interstate and other routes with Speed Limits of 55MPH or greater. Reports prepared quearterly and annually Submitted to FHWA, with copies provided to TDOS and GHSO
103 Speed Summary Report
104
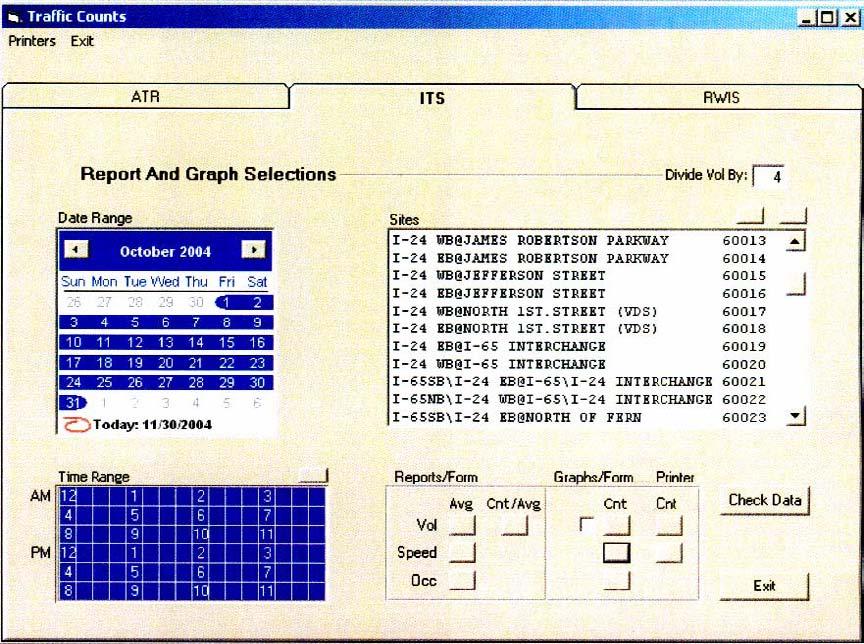
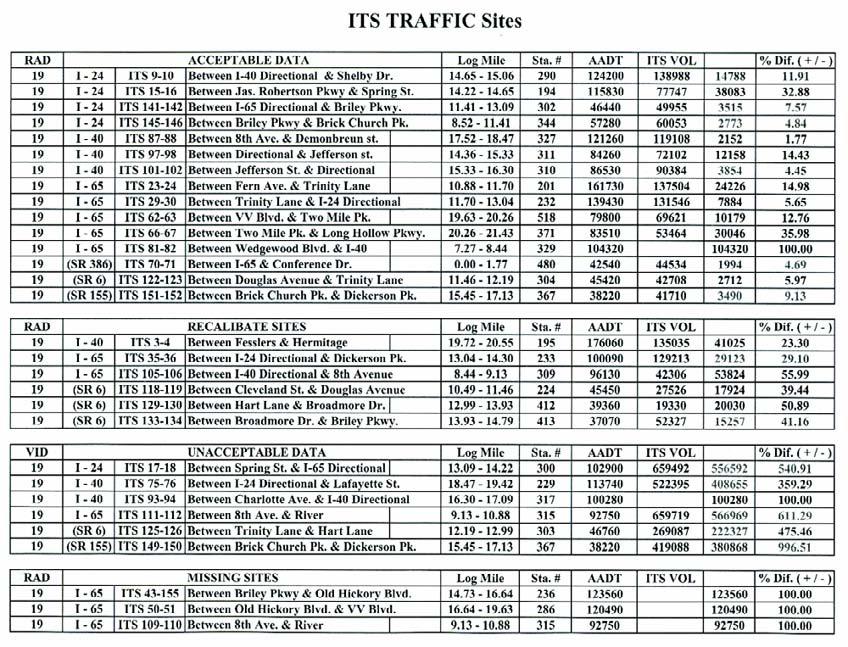
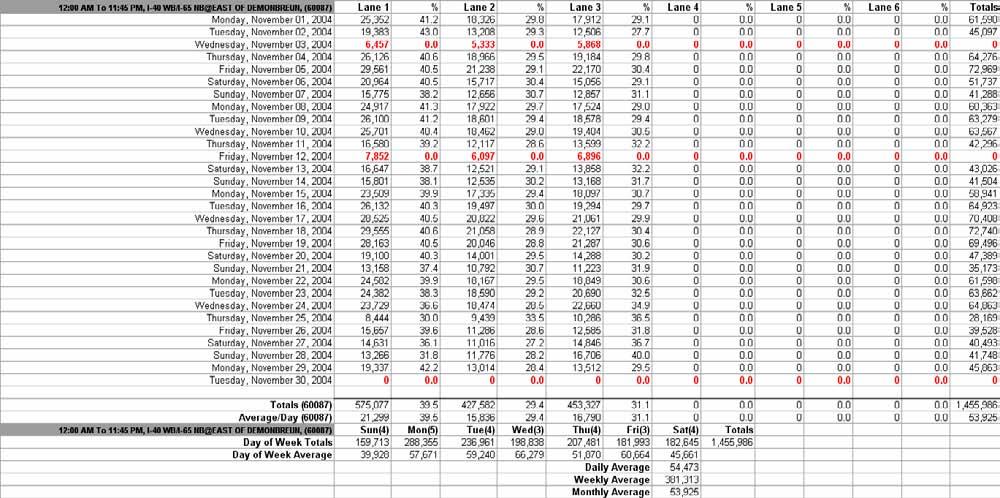
105 Question: Since we will soon have our own freeway ITS system in place here in Knoxville, I would like to know if the data that will be collected from the radar units will be archived/summarized into a useful format for planning purposes. Also, what types of data can be collected accurately from the technologies being deployed and how can they be used to derive other information such as congestion indices?
106
107
108
109
110
111
112
113
114
115
116
117
118
119
120
121
122
123
124
125
126 Question: One specific issue that has come up in Knox County is with the amount of VMT that is being reported on the Urban Local classification in the HPMS estimates, which is apparently the highest in the entire state surpassing both Shelby and Davidson counties. My understanding is that Dr. Han has developed the methodology for coming up with local VMT and it would be good to hear what that entails.
127 Local Road DVMT Estimation Prepared for Steve Allen
128 Challenges No state has extensive count program for local roads due to resource limitations. Every state is require to report local road traffic information annually in its HPMS program.
129 General Estimation Model (GEM) An estimation model was developed based on: Previous studies Special bridge counts on local roads Historical estimation Statistical relationship between traffic on local roads and other roadways Growth trend in each county Rural/urban designation of the roads
130 Model Development Historical Data Special/Bridge Counts ADT/VMT on All Roadways Growth Trends Other Information Statistical Analyses Covariance of variables Time series analysis Step-wise regression Etc. General Estimation Model
131 Key GEM Parameters Rural Minor Collector AADT Urban Collector AADT Bridge & Special Count AADT Growth Rate for Each County Mileages of Various Roadways
132 GEM Procedure For each county 1. Calculate Bridge ADT for Target Year 2. Calculate Rural Local ADT 3. Calculate Urban Local ADT 4. Calculate DVMT for Rural and Urban Local Roads 5. Calculate County-wide DVMT 6. Recalibrate of Equations Frequently
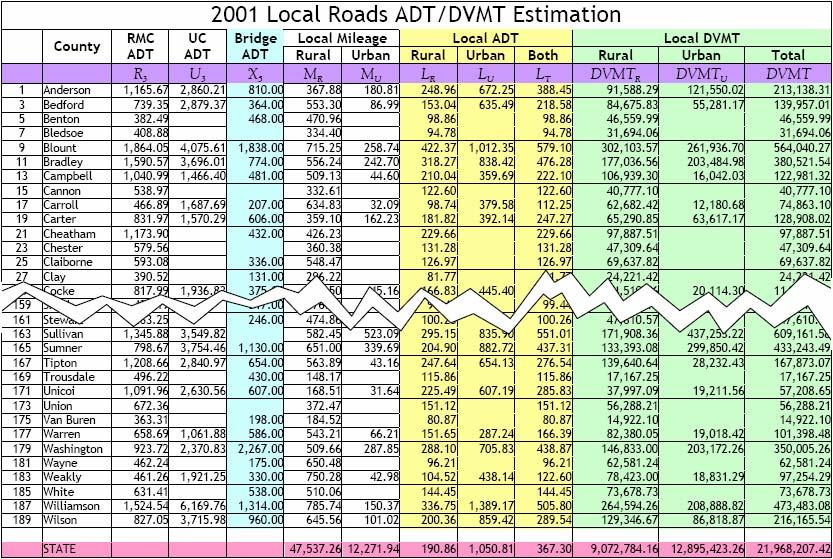
133 Sample Spreadsheet
134 Details of the GEM Procedure Appendix
135 Complete List of Variables Year n (GIVEN) R 3 is rural minor collector AADT for year n (GIVEN) U 3 is urban collector AADT for year n (GIVEN) X 5 is bridge AADT mean for year n X 5OLD is old bridge AADT mean from year m L R is rural local road ADT for a county L U is urban local road ADT for a county L T is total local road ADT for a county G n-m is the local county growth rate for year n-m (GIVEN) M R is the mileage of rural local roads in a county (GIVEN) M U is the mileage of urban local roads in a county (GIVEN) DVMT R is rural DVMT for a county DVMT U is urban DVMT for a county DVMT is total DVMT for a county
136 GEM Step 1 Find the most recent bridge data for the county X 5OLD = Average of all bridge ADT counts in the county If the data is for year n then X 5 = X 5OLD Otherwise if the data is from m years before year n, then X 5 = (1+G n-1 )(1+G n-2 ) (1+G n-m )X 5OLD
137 GEM Step 2 If there is no bridge data for the county: L R = R 3 If there is bridge data for the county: L R = R X 5 Note: Equations should be derived individually for each state and locale.
138 GEM Step 3 If there is no bridge data for the county: L U = U 3 If there is bridge data for the county: L U = U X 5 Note: Equations should be derived individually for each state and locale.
139 GEM Step 4 DVMT R = M R L R DVMT U = M U L U DVMT = DVMT R + DVMT U
140 L T = DVMT/(M R + M U ) GEM Step 5
141 GEM Step 6 Statistical results, while representative of the whole, may be off at individual locales. Adjustment based on local knowledge and engineering judgment should be made over time to assure quality results of the model.
142 Question Why is Knox County s estimated urban local road VMT the highest in TN surpassing Shelby and Davidson counties? Is there something wrong with the estimation?
143 Knox Co. High Urban Local DVMT Prepared for Steve Allen
144 Top 370 Urban Areas Local/Total VMT Ratios Shelby Hamilton Davidson Knox % 5% 10% 15% 20% 25% 30% 35% 40% 45% 50% Local Road VMT/Total Road VMT
145 Observation While Knox County s (Urban Local VMT)/(Total Urban VMT) ratio (about 18%) is higher than other Tennessee urban areas, there are plenty of urban areas with higher, and some much higher, ratios.
146 Top 370 Urban Areas Local/Total Miles Ratios Shelby Hamilton Davidson Knox % 60% 70% 80% 90% 100% Local Road Miles/Total Road Miles
147 Observation Knox County has a much higher percentage of its total roadway mileages being local roads than all other Tennessee urban areas and over 98% of the Top 370 US urban areas! The mileages of roadways are NOT estimated by statistical models but reported by TDOT. Perhaps a good portion of these local roads should have been designated as higher-class roads.
148 Discussions The 4-year Knox Co. Local Road VMT trend is not out of the order DVMT 2,263,730 2,320,559 2,327,449 2,597,464 Mileage 1,355 1,358 1,361 1,361 The General Estimation Model is a statistical model and, hence, may not always be on the mark for all 95 counties all the time. Even though Knox Co. VMT appear to be reasonable by comparison, engineering judgment may be used to calibrate the model if necessary.
149 Are there any questions?
LOUISIANA DOTD TRAFFIC MONITORING/DATA COLLECTION PROGRAM & UPDATES
 LOUISIANA DOTD TRAFFIC MONITORING/DATA COLLECTION PROGRAM & UPDATES George Chike, P.E. Traffic Data Collection & Management System www.dotd.la.gov DOTD FIELD CREWS Routine traffic volume counts Vehicle
Traffic Data Quality Analysis. James Sturrock, PE, PTOE, FHWA Resource Center Operations Team
 Traffic Analysis James Sturrock, PE, PTOE, FHWA Resource Center Operations Team Source Material Traffic Measurement http://ntl.bts.gov/lib/jpodocs/repts_te/14058.htm Seven DEADLY Misconceptions about Information
Office of Transportation Data (OTD)
") Office of Transportation Data (OTD) Paul Tanner State Transp o rtatio n D ata A d m inistrato r Presentation Objectives Why do we collect data? State & Federal Code Requirements Who collects the data?
Office of Transportation Data (OTD) Paul Tanner State Transp o rtatio n D ata A d m inistrato r Presentation Objectives Why do we collect data? State & Federal Code Requirements Who collects the data?
TRANSPORTATION RESEARCH BOARD. Spatial Modeling for Highway Performance Monitoring System Data: Part 1. Tuesday, February 27, :00-4:00 PM ET
 TRANSPORTATION RESEARCH BOARD Spatial Modeling for Highway Performance Monitoring System Data: Part 1 Tuesday, February 27, 2018 2:00-4:00 PM ET The Transportation Research Board has met the standards
Updating Virginia s Statewide Functional. Brad Shelton, VDOT Chris Detmer, VDOT Ben Mannell, VDOT
 Updating Virginia s Statewide Functional Classification System Brad Shelton, VDOT Chris Detmer, VDOT Ben Mannell, VDOT July 18, 2013 What is Functional Classification Use of Functional Classification Today
OHIO TRAFFIC FORECASTING MANUAL. Module 2: Traffic Forecasting Methodologies
 OHIO TRAFFIC FORECASTING MANUAL Module 2: Traffic Forecasting Methodologies TRAINING ORGANIZATION Ohio Traffic Forecasting Training Modules Module 1: Traffic Forecasting Background Policy, Administrative
TDMS A Traffic Data Repository for Government and Business Use
 TDMS A Traffic Data Repository for Government and Business Use Prepared for: Arizona Association of County Engineers Prescott, Arizona February 13, 2014 Presented by: Mark Catchpole ADOT Multimodal Planning
NYSDOT Roadway Inventory. Both On and Off the State System
 NYSDOT Roadway Inventory Both On and Off the State System 1 2 NYSDOT Highway Data Services Bureau Highway Data Traffic Monitoring Pavement Data Inventory of public roads, incl. LHI Systems designations
Traffic and ESAL Summary for the MnROAD Mainline. (July 1994 June 2011)
") Traffic and ESAL Summary for the MnROAD Mainline (July 1994 June 2011) Eric Peterson, EIT Graduate Engineer Minnesota Department of Transportation August 22, 2011 Executive Summary Since its construction
Traffic and ESAL Summary for the MnROAD Mainline (July 1994 June 2011) Eric Peterson, EIT Graduate Engineer Minnesota Department of Transportation August 22, 2011 Executive Summary Since its construction
INVITATION TO BID FOR TRAFFIC COUNT SERVICES
 INVITATION TO BID FOR TRAFFIC COUNT SERVICES Notice is hereby given that the Berkshire Regional Planning Commission will receive bids for services to perform vehicle traffic counts. All bids must be original
The Highway Economic Requirements System (HERS): How HERS Works
: How HERS Works") The Highway Economic Requirements System (HERS): How HERS Works presented to Committee for a Study of the Future Interstate Highway System presented by Rich Margiotta, Ph.D. December 20, 2016 What We ll
The Highway Economic Requirements System (HERS): How HERS Works presented to Committee for a Study of the Future Interstate Highway System presented by Rich Margiotta, Ph.D. December 20, 2016 What We ll
9. TRAVEL FORECAST MODEL DEVELOPMENT
 9. TRAVEL FORECAST MODEL DEVELOPMENT To examine the existing transportation system and accurately predict impacts of future growth, a travel demand model is necessary. A travel demand model is a computer
Updating Virginia s Statewide Functional Classification System. Briefing to MPOs, PDCs, and Local Governments
 Updating Virginia s Statewide Functional Classification System Briefing to MPOs, PDCs, and Local Governments October 15 & 19, 2012 Functional Class 101 Shelton s FC Game Research Phase Today s Review New
Recommended Roadway Plan Section 3 Existing Facilities & System Performance
 Recommended Roadway Plan Section 3 Existing Facilities & System Performance RECOMMENDED ROADWAY PLAN SECTION 3 Existing Facilities and System Performance 3.1 Introduction An important prerequisite to transportation
Addendum #3 to the Regional Transportation Plan
 Nashville Area Metropolitan Planning Organization Addendum #3 to the Regional Transportation Plan Effective November 21, 2018 Nashville Area Metropolitan Planning Organization 138 Second Avenue North Nashville,
Metropolitan Planning Organization Safety Performance Measures Fact Sheet
 waco mpo Metropolitan Planning Organization Safety Performance Measures Fact Sheet Safety Performance Measures The Safety Performance Management Measures regulation supports the Highway Safety Improvement
SBCAG STAFF REPORT. MAP-21/FAST Act Performance Measures and Targets. MEETING DATE: September 20, 2018 AGENDA ITEM: 4H
 SBCAG STAFF REPORT SUBJECT: MAP-21/FAST Act Performance Measures and Targets MEETING DATE: September 20, 2018 AGENDA ITEM: 4H STAFF CONTACT: Andrew Orfila, Jared Carvalho RECOMMENDATION: Approve and accept
TRANSPORTATION RESEARCH BOARD. Spatial Modeling for Highway Performance Monitoring System Data: Part 2. Tuesday, March 6, :00-3:00 PM ET
 TRANSPORTATION RESEARCH BOARD Spatial Modeling for Highway Performance Monitoring System Data: Part 2 Tuesday, March 6, 2018 1:00-3:00 PM ET The Transportation Research Board has met the standards and
S203: The Caltrans Performance Measurement System (PeMS) An Introduction to PeMS and a Demonstration of its Multimodal Tools
 An Introduction to PeMS and a Demonstration of its Multimodal Tools") S203: The Caltrans () An Introduction to and a Demonstration of its Multimodal Tools Presented By: Ellison Alegre, San Diego Association of Governments Jane Berner, Caltrans APA s 2012 National Planning
S203: The Caltrans () An Introduction to and a Demonstration of its Multimodal Tools Presented By: Ellison Alegre, San Diego Association of Governments Jane Berner, Caltrans APA s 2012 National Planning
The TIS is to be signed and sealed by a Florida Registered Professional Engineer.
 CHAPTER 900. SECTION 901. DEVELOPMENT STANDARDS INFRASTRUCTURE STANDARDS 901.5. Transportation Impact Study A. Intent and Purpose The intent and purpose of the Traffic Impact Study (TIS) is to identify
Volume to Capacity Estimation of Signalized Road Networks for Metropolitan Transportation Planning. Hiron Fernando, BSCE. A Thesis CIVIL ENGINEERING
 Volume to Capacity Estimation of Signalized Road Networks for Metropolitan Transportation Planning by Hiron Fernando, BSCE A Thesis In CIVIL ENGINEERING Submitted to the Graduate Faculty of Texas Tech
Adaptation of HERS-ST Models for the South Carolina Interactive Interstate Management System
 Adaptation of HERS-ST Models for the South Carolina Interactive Interstate Management System presented to the Transportation Research Board HERS Modeling and Data Integration Conference presented by William
Freight Transportation Planning and Modeling Spring 2012
 Freight Model Validation Techniques Abstract Several reviews of validation techniques for statewide passenger and freight models have been published over the past several years. In this paper I synthesize
FUNCTIONAL CLASSIFICATION PROCESS
 FUNCTIONAL CLASSIFICATION PROCESS Roadway Functional Classification System Functional classification is the process by which the local, state and nation s street and highway network is ranked according
TDOT's New Staffs, Future Plans, and opportunities for Collaboration with MPOs
 TDOT's New Staffs, Future Plans, and opportunities for Collaboration with MPOs David Lee, Assistant Director February 7, 2017 Organizational Chart Long Range Planning Organizational Chart Data Management
Design, Development, and Implementation of a Statewide Traffic Monitoring System
 TRANSPORTATION RESEARCH RECORD 1271 55 Design, Development, and Implementation of a Statewide Traffic Monitoring System DAVID PRESTON ALBRIGHT AND JOSEPH E. WILKINSON Statewide traffic monitoring standards
TTAC STAFF REPORT. State Targets for the MAP-21/FAST Act National Highway Performance Program. MEETING DATE: August 2, 2018 AGENDA ITEM: 5
 TTAC STAFF REPORT SUBJECT: State Targets for the MAP-21/FAST Act National Highway Performance Program MEETING DATE: August 2, 2018 AGENDA ITEM: 5 STAFF CONTACT: Andrew Orfila, Jared Carvalho RECOMMENDATION:
Standardization of Travel Demand Models
 Standardization of Travel Demand Models TNMUG Meeting November 14, 2013 The North Carolina Experience Leta F. Huntsinger, Ph.D., P.E. and Rhett Fussell, P.E. Background } North Carolina Profile } 18 MPOs,
APPENDIX H: TRAVEL DEMAND MODEL VALIDATION AND ANALYSIS
 APPENDIX H: TRAVEL DEMAND MODEL VALIDATION AND ANALYSIS Travel demand models (TDM) simulate current travel conditions and forecast future travel patterns and conditions based on planned system improvements
VEHICLE PARTICULATE EMISSIONS ANALYSIS
 VEHICLE PARTICULATE EMISSIONS ANALYSIS Prepared for ARIZONA DEPARTMENT OF TRANSPORTATION TRANSPORTATION PLANNING DIVISION MPOs/COGs AIR QUALITY POLICY AND LOCAL PROGRAMS SECTION AND YUMA METROPOLITAN PLANNING
TRAFFIC ANALYSES TO SUPPORT NEPA STUDIES
 VIRGINIA DEPARTMENT OF TRANSPORTATION ENVIRONMENTAL DIVISION NEPA PROGRAM LOCATION STUDIES TRAFFIC ANALYSES TO SUPPORT NEPA STUDIES CONSULTANT RESOURCE GUIDANCE DOCUMENT Issued on: November 18, 2016 Last
100 Introduction Functional Classification Traffic Data Terrain & Locale Design & Legal Speed...
 Table of Contents 100 Introduction... 1 101 Functional Classification... 1 101.1 General...1 101.2 Urban & Rural...1 101.3 Classification Used in ODOT Design Criteria...1 102 Traffic Data... 2 102.1 General...2
Washington State DOT: Pavement and Bridge Performance NPRM Comments for federal docket,
 MAP-21 NPRM for National Performance Management Measures; Assessing Pavement Condition for the National Highway Performance Program and Bridge Condition for the National Highway Performance Program The
Florida s Mobility Performance Measures and Experience
 Florida s Mobility Performance Measures and Experience By Douglas S. McLeod (corresponding author) Florida Department of Transportation 605 Suwannee Street Tallahassee, FL 32399-0450 Tel. 850-414-4932
RESOLUTION NO
 RESOLUTION NO. 2018-12 RESOLUTION OF THE SOUTHEASTERN WISCONSIN REGIONAL PLANNING COMMISSION AMENDING THE TRANSPORTATION IMPROVEMENT PROGRAM FOR SOUTHEASTERN WISCONSIN: 2017-2020 WHEREAS, the Southeastern
Addendum 1: Performance Measures
 Addendum 1: 2 Addendum Livability 2040 Regional Transportation Plan Table of Contents 1.0 Introduction... 3 Federal Requirements... 3 MPO Measure Targets... 4 2.0 Safety Measure Targets... 9 3.0 Transit
I-64 Peninsula Shoulder Usage Evaluation. Eric Stringfield VDOT Hampton Roads Transportation Planning April 3, 2013
 I-64 Peninsula Shoulder Usage Evaluation Eric Stringfield VDOT Hampton Roads Transportation Planning April 3, 2013 Briefing Purpose Evaluation Area / Existing Conditions Code and Policy Engineering Facts
Appendix D Functional Classification Criteria and Characteristics, and MnDOT Access Guidance
 Appendix D Functional Classification Criteria and Characteristics, and MnDOT Access Guidance Functional classification identifies the role a highway or street plays in the transportation system. Some highways
Technical Memorandum MULTIMODAL NEEDS. Prepared for: Oklahoma Department of Transportation. Prepared by:
 Technical Memorandum MULTIMODAL NEEDS Prepared for: Oklahoma Department of Transportation Prepared by: May 2015 Technical Memorandum The Technical Memos were written to document early research for the
Texas Transportation Institute The Texas A&M University System College Station, Texas
 1. Report No. FHWA/TX-01/4190-4 4. Title and Subtitle EMISSIONS DUE TO CONSTRUCTION EQUIPMENT AND TRAFFIC DELAYS TASK 6: CONTRIBUTION OF VEHICULAR EMISSIONS CAUSED BY REDUCTION IN CAPACITY DURING ROADWAY
Metropolitan Planning Organization Safety Performance Measures Fact Sheet
 Metropolitan Planning Organization Safety Fact Sheet Safety The Safety Performance Management Measures regulation supports the Highway Safety Improvement Program (HSIP) and requires State Departments of
APPENDIX D. Glossary D-1
 APPENDIX D Glossary D-1 Glossary of Transportation Planning Terms ANNUAL AVERAGE DAILY TRAFFIC (AADT): The total number of vehicles passing a given location on a roadway over the course of one year, divided
LOCATION AND DESIGN DIVISION
 VIRGINIA DEPARTMENT OF TRANSPORTATION LOCATION AND DESIGN DIVISION INSTRUCTIONAL AND INFORMATIONAL MEMORANDUM GENERAL SUBJECT: Interstate, NHS Non-Interstate and Non-NHS (IJR / IMR Guidance) SPECIFIC SUBJECT:
Appendix D: Functional Classification Criteria and Characteristics, and MnDOT Access Guidance
 APPENDICES Appendix D: Functional Classification Criteria and Characteristics, and MnDOT Access Guidance D.1 Functional classification identifies the role a highway or street plays in the transportation
100 Design Controls and Exceptions
 100 Design Controls and Exceptions Table of Contents 100 Introduction... 1 101 Functional Classification... 1 101.1 General... 1 101.2 Urban & Rural... 1 101.3 Classification Used In ODOT Design Criteria...
KANSAS WORK ZONE SAFETY AND MOBILITY PROCESSES AND PROCEDURES
 KANSAS WORK ZONE SAFETY AND MOBILITY PROCESSES AND PROCEDURES Bureau of Transportation Safety and Technology 700 SW Harrison, Topeka, KS 66603 July 30, 2008 Definitions Significant Project All Federal-aid
PERFORMANCE-BASED PLANNING AND PROGRAMMING
 February 2017 performance-based planning and programming Boston Region MPO PERFORMANCE-BASED PLANNING AND PROGRAMMING WHAT IS PERFORMANCE-BASED PLANNING AND PROGRAMMING? Performance-based planning and
Technical Memorandum. 720 SW Washington Suite 500 Portland, OR dksassociates.com. DATE: July 12, 2017
 Technical Memorandum DATE: July 12, 2017 TO: Kay Bork City of Veneta Bill Johnston, AICP Oregon Department of Transportation Christina McDaniel-Wilson, PE Oregon Department of Transportation Keith Blair,
Congestion Management Process (CMP)
") Congestion Management Process (CMP) Introduction The Congestion Management Process (CMP) is a systematic, data-driven, and regionally accepted approach that aims to improve the performance of the transportation
Congestion Management Process (CMP) Introduction The Congestion Management Process (CMP) is a systematic, data-driven, and regionally accepted approach that aims to improve the performance of the transportation
CHAPTER 5. City of Greensburg Comprehensive Plan. Introduction. Transportation Goals & Objectives
 CHAPTER 5 TRANSPORTATION Introduction The transportation system forms the backbone of the community. I-74 provides the community with connections to larger metropolitan areas such as Indianapolis and Cincinnati.
GENERAL INTEREST ROADWAY DATA
 Approved: Effective: March 23, 2016 Office: Transportation Statistics Topic No.: 525-020-310-j Department of Transportation PURPOSE: GENERAL INTEREST ROADWAY DATA This procedure establishes Districts and
Model Characteristics
 1 General Model Design Highway Network/Traffic Analysis Zones (TAZs) Development of Synthetic Trip Tables Validation Procedures & Results Model Application (2003 & 2030) Review 2 Model Characteristics
TRANSPORTATION PROJECT REPORT DRAFT CONCEPTUAL ACCESS MODIFICATION PROPOSAL OCTOBER 2002
 TRANSPORTATION INTERSTATE 87 INTERCHANGE 11A TOWN OF MALTA SARATOGA COUNTY, NY DRAFT CONCEPTUAL ACCESS MODIFICATION PROPOSAL OCTOBER 2002 PROJECT REPORT NEW YORK STATE DEPARTMENT OF TRANSPORTATION JOSEPH
ACTION TRANSMITTAL
 ACTION TRANSMITTAL 2016-07 DATE: December 4, 2015 TO: FROM: TAC Planning MTS Staff PREPARED BY: Rachel Wiken (651) 602-1572 SUBJECT: REQUESTED ACTION: RECOMMENDED MOTION: Functional Class Change #1330
INTERACTIVE HIGHWAY SAFETY DESIGN MODEL (IHSDM)
") INTERACTIVE HIGHWAY SAFETY DESIGN MODEL (IHSDM) TSITE 2016 Winter Meeting Nashville, TN February 25, 2016 AGENDA Project History IHSDM: Background & Overview IHSDM: Interstate 24 Model IHSDM: Interstate
INTERACTIVE HIGHWAY SAFETY DESIGN MODEL (IHSDM) TSITE 2016 Winter Meeting Nashville, TN February 25, 2016 AGENDA Project History IHSDM: Background & Overview IHSDM: Interstate 24 Model IHSDM: Interstate
Final Air Quality Report
 Florida Department of Transportation - District VII County Line Road (C.R. 578) Project Development and Environment Study From U.S. 19 (S.R. 55) to U.S. 41 (S.R. 45) Work Program Item Segment Number: 257298
7.0 Benefit/Cost Analysis
 7.0 Benefit/Cost Analysis 7.0 Benefit/Cost Analysis This section presents detailed instructions on how to conduct benefit-cost analysis using a spreadsheet tool developed for the Phase I evaluation; this
Proposed Comprehensive Update to the State of Rhode Island s Congestion Management Process
 Proposed Comprehensive Update to the State of Rhode Island s Statewide Planning Program January 2018 Summary Outline of of Action Steps 1. Develop Objectives for Congestion Management What is the desired
SHRP Project C11: Reliability Analysis Tool: User s Guide
 SHRP Project C11: Reliability Analysis Tool: User s Guide This document represents Section 2.2 of the full report: SHRP2 Project C11 Final Report: Development of Tools for Assessing Wider Economic Benefits
SECTION III - REGIONAL ARTERIAL SYSTEM. The Regional Arterial System is a subcomponent of a broader regional thoroughfare system.
 SECTION III - REGIONAL ARTERIAL SYSTEM SYSTEM IDENTIFICATION The Regional Arterial System is a subcomponent of a broader regional thoroughfare system. The NCTCOG Regional Thoroughfare Plan (RTP) recognizes
IAn Imperative for, and Current
 ., IAn Imperative for, and Current Progress toward, National Traffic Monitoring Standards BY DAVID ALBRIGHT During the Middle Ages there was no single -. way of writing letters of the alphabet. Each state,
Rural Intelligent Transportation Systems Toolbox. A National Highway Institute Training Program
 Rural Intelligent Transportation Systems Toolbox A National Highway Institute Training Program Course Goals Introduce the Rural ITS (Intelligent Transportation Systems) Toolbox Increase familiarity with
CHAPTER 3 SCOPE SUMMARY
 CHAPTER 3 SCOPE SUMMARY GENERAL The SDDOT is an active member of AASHTO to share common national design standards for the state highway system. The AASHTO Task Force on Geometric Design has completed the
TRANSPORTATION PERFORMANCE MANAGEMENT Asset Management and Pavement Performance Measures The 30, mile view.
 TRANSPORTATION PERFORMANCE MANAGEMENT Asset Management and Pavement Performance Measures The 30,000 250 mile view. 1 Transportation Performance Management 2 2 Transportation Performance Management (TPM)
Appendix B. Benefit-Cost Technical Memorandum
 Appendix B Benefit-Cost Technical Memorandum This Page Left Blank Intentionally MEMORANDUM TO: FROM: Michael Kalnbach MnDOT District 1 Project Manager Graham Johnson, PE DATE: September 2, 2014 RE: TH
REQUIREMENTS WEBINAR FEBRUARY 20, :00 2:30 P.M.
 ENHANCED NATIONAL HIGHWAY SYSTEM AND REQUIREMENTS WEBINAR FEBRUARY 20, 2013 1:00 2:30 P.M. Webinar Housekeeping Tips There is a designated time at the end of the presentation for questions and answers.
All Roads Do Not End at the State Line: Methodologies for Enabling Geodata Sharing Across Boundaries
 All Roads Do Not End at the State Line: Methodologies for Enabling Geodata Sharing Across Boundaries presented to 22 nd Geospatial Information Systems for Transportation Symposium presented by Julie Chizmas,
May 20, 2015 Russ Dudley VDOT - Local Assistance Division. May 20, 2015 Todd Halacy VDOT - Local Assistance Division
 NHS Performance Metrics: MAP-21 Transportation Performance Management Assessing Pavement and Bridge Condition for the National Highway Performance Program May 20, 2015 Russ Dudley VDOT - Local Assistance
APPLICATION OF SEASONAL ADJUSTMENT FACTORS TO SUBSEQUENT YEAR DATA. Corresponding Author
 1 2 3 4 5 6 7 8 9 10 11 12 13 14 15 16 17 18 19 20 21 22 23 24 25 26 27 28 29 30 31 32 33 34 35 36 37 38 39 40 41 42 43 44 45 46 47 48 49 50 51 52 APPLICATION OF SEASONAL ADJUSTMENT FACTORS TO SUBSEQUENT
Automating Variable Speeds and Traveler Information with Real-Time Traffic and Weather
 Automating Variable Speeds and Traveler Information with Real-Time Traffic and Weather Joshua Crain, Jim Peters, P.E., PTOE, and Carl S. Olson ABSTRACT The Highway 217 freeway in Portland, Oregon was the
Functional Classification
 Functional Classification HB 3202 (2007) Report to Governor and General Assembly Virginia Department of Transportation 1401 East Broad Street Richmond, Virginia 23219 January 2009 A PLAN FOR REASSIGNING
P4.0 Highway Quantitative Scoring Workgroup Recommendations
 P4.0 Highway Quantitative Scoring Workgroup Recommendations May 18, 2015 Highway Project Scoring Overview Insert Table of Eligibility Statewide Mobility Regional Impact Division Needs Eligible Projects:
Process to Identify High Priority Corridors for Access Management Near Large Urban Areas in Iowa Using Spatial Data
 Process to Identify High Priority Corridors for Access Management Near Large Urban Areas in Iowa Using Spatial Data David J. Plazak and Reginald R. Souleyrette Center for Transportation Research and Education
A Time Series Approach to Forecast Highway Peak Period Spreading and Its Application in Travel Demand Modeling
 A Time Series Approach to Forecast Highway Peak Period Spreading and Its Application in Travel Demand Modeling Sabya Mishra (University of Memphis) Timothy F. Welch (Georgia Institute of Technology) Subrat
OKI Congestion Management System Analysis. Data Collection Report Year 1
 OKI Congestion Management System Analysis Data Collection Report Year 1 May 2002 Prepared by the Ohio-Kentucky-Indiana Regional Council of Governments Acknowledgments Title OKI Congestion Management System
Highway and Freight Current Investment Direction and Plan. TAC August 2, 2017
 Highway and Freight Current Investment Direction and Plan TAC August 2, 2017 Today s Topics Highway & Freight Where are we now? The Highway Story What are the issues? How is the system performing? Where
PERFORMANCE-BASED PLANNING AND PROGRAMMING
 February 2017 performance-based planning and programming Boston Region MPO PERFORMANCE-BASED PLANNING AND PROGRAMMING WHAT IS PERFORMANCE-BASED PLANNING AND PROGRAMMING? Performance-based planning and
Traffic Data Programs at Virginia DOT: 10 plus Years of Innovation
 Traffic Data Programs at Virginia DOT: 10 plus Years of Innovation Presented by Digital Traffic Systems Inc. Mr. Peter Keen peter.keen@dtsits.com NATMEC 2012 Dallas, Texas 6/5/2012 Business Partner Perspective
VTrans2040 Multimodal Transportation Plan Corridors of Statewide Significance Needs Assessment Western Mountain Corridor (L)
") VTrans2040 Multimodal Transportation Plan Corridors of Statewide Significance Needs Assessment Western Mountain Corridor (L) 77 Table of Contents I. Corridor Overview Land Use and Demographics Corridor
VTrans2040 Multimodal Transportation Plan Corridors of Statewide Significance Needs Assessment Western Mountain Corridor (L) 77 Table of Contents I. Corridor Overview Land Use and Demographics Corridor
8.0 Chapter 8 Alternatives Analysis
 8.0 Chapter 8 Alternatives Analysis The primary purpose for using CORSIM in the context of this manual is to guide the design process and program delivery. To this point in the manual, you have been given
TAMING BIG DATA FOR SMARTER FUTURE
 2015 APA National Planning Conference Function Code: S585 TAMING BIG DATA FOR SMARTER FUTURE Ed Hutchinson OVERVIEW 1. Enterprise Information Management (EIM) 2. Data Clearing House 3. Florida Transportation
Appendix C: GHG Emissions Model
 Appendix C: GHG Emissions Model 1 METHOD OVERVIEW The Maryland Statewide Transportation Model (MSTM) Emissions Model (EM) is a CUBE-based model that uses emission rates calculated by the MOVES2010 EPA
Bangor I-95 Corridor Study 2010
 Maine State Library Maine State Documents Transportation Documents Transportation 12-2010 Bangor I-95 Corridor Study 2010 Maine Department of Transportation Follow this and additional works at: http://digitalmaine.com/mdot_docs
STATEWIDE TRAFFIC ANALYSIS AND REPORTING SYSTEM (STARS II)
") STATEWIDE TRAFFIC ANALYSIS AND REPORTING SYSTEM (STARS II) Transportation Planning and Programming Division (TPP) June 15th-17th, 2016 Planning Data & Analysis March 31, 2016 Overview: Why is STARS II
STATEWIDE TRAFFIC ANALYSIS AND REPORTING SYSTEM (STARS II) Transportation Planning and Programming Division (TPP) June 15th-17th, 2016 Planning Data & Analysis March 31, 2016 Overview: Why is STARS II
Transportation Management Data:
 Delaware Department of Transportation 2016 ITE Mid-Colonial District Annual Conference Transportation Management Data: Enhancing the Way We Do Business Gene Donaldson Alyssa May, PE Agenda Monitoring capabilities
INTERSTATE CORRIDOR PLANNING
 INTERSTATE CORRIDOR PLANNING Prioritization of Corridor Studies July 29, 2015 Importance of the Interstate System Texas is an integral part of the national interstate system. The interstate system provides
PROCEDURES FOR NEW OR REVISED FREEWAY ACCESS IN ARKANSAS
 PROCEDURES FOR NEW OR REVISED FREEWAY ACCESS IN ARKANSAS June 2011 PROCEDURES FOR NEW OR REVISED FREEWAY ACCESS IN ARKANSAS June 2011 Prepared by: Arkansas State Highway and Transportation Department
The ipems MAP-21 Module
 The ipems MAP-21 Module Producing the information you need from the National Performance Management Research Data Set (NPMRDS) January 2015 Innovation for better mobility Use the ipems MAP-21 Module to
IDENTIFYING INDIANA'S PORTION OF THE NATIONAL HIGHWAY SYSTEM
 12 IDENTIFYING INDIANA'S PORTION OF THE NATIONAL HIGHWAY SYSTEM Gunnar J. Rorbakken Division Chief, Division of Tranportation Planning Indiana Department of Transportation 13 The 1991 Intermodal Surface
MONITORING IMPLEMENTATION AND PERFORMANCE
 12 MONITORING IMPLEMENTATION AND PERFORMANCE The FAST Act continues the legislation authorized under MAP-21, which created a data-driven, performance-based multimodal program to address the many challenges
Keep Roads and Bridges in Good Condition. Dennis Heckman, State Bridge Engineer. Tracker. Measures of Departmental Performance
 Keep Roads and Bridges in Good Condition Dennis Heckman, State Bridge Engineer Tracker Measures of Departmental Performance Missourians have said they want MoDOT to keep roads and bridges in good condition.
APPENDIX A: SHORT-TERM PROJECT DEPLOYMENTS
 APPENDIX A: SHORT-TERM PROJECT DEPLOYMENTS Page 1 of 15 ST-01: I-95 ITS DEPLOYMENT (DE STATE LINE TO AIRPORT) PROJECT DESCRIPTION AND SCOPE: Project will address gaps in ITS device coverage on I-95 from
Management. VA SITE Annual Meeting June 27, 2013 Jay Styles Performance and Strategic t Planning Manager, Business Transformation Office
 VDOT and MAP-21 Performance Management VA SITE Annual Meeting June 27, 2013 Jay Styles Performance and Strategic t Planning Manager, Business Transformation Office Overview Map-21- How is VDOT Preparing?
Transportation Performance Measures Safety Target-Setting
 Safety Target-Setting Richmond Regional Transportation Planning Organization November 2, 2017 Presentation by: Chris Wichman, Senior Transportation Planner Background Moving Ahead for Progress in the 21
September 2009 Technical Memorandum: UCPRC-TM Authors: Eul-Bum Lee, Changmo Kim, and John T. Harvey PREPARED FOR: PREPARED BY:
 September 2009 Technical Memorandum: RealCost Enhancement and Version 2 Life-Cycle Cost Analysis Manual for Caltrans Authors: Eul-Bum Lee, Changmo Kim, and John T. Harvey Partnered Pavement Research Program
Transportation Model Report
 1. Introduction The traffic impacts of the future developments in the IL130/High Cross Road corridor for different scenarios were analyzed using a Travel Demand Model (TDM). A four step modeling process
Software Development Status and The New Hampshire Proposal Tom Roff April 12,2010
 Software Development Status and The New Hampshire Proposal Tom Roff April 12,2010 HPMS Development Status Field Manual is out on the street. Screen Design is complete Developers are staffed up and coding
2 Purpose and Need. 2.1 Study Area. I-81 Corridor Improvement Study Tier 1 Draft Environmental Impact Statement
 2 Purpose and Need 2.1 Study Area Interstate 81 (I-81) is relied upon for local and regional travel and interstate travel in the eastern United States. It extends 855 miles from Tennessee to New York at