Standardization of Travel Demand Models
|
|
|
- Alyson Robbins
- 5 years ago
- Views:
Transcription
1 Standardization of Travel Demand Models TNMUG Meeting November 14, 2013 The North Carolina Experience Leta F. Huntsinger, Ph.D., P.E. and Rhett Fussell, P.E.

2 Background } North Carolina Profile } 18 MPOs, 10 with population < 250,000 } 20 Rural Planning Organizations } 1959 GS } 2001 revisions were made to GS
3 Current Challenges } Changing workforce } Changes in scope and responsibility } Loss of experienced, knowledgeable staff leading to an erosion of modeling skills and loss of institutional knowledge in modeling practice
4 NCDOT s Efforts } Broad scale effort to improve travel forecasting tools in NC } Sponsored research to develop best practice guidelines for planning analysis tools (Tier 1 and 2 communities) } Contracted with Parsons Brinckerhoff to develop standard modeling guidelines and procedures (Tier 3 communities)
5 Outline } North Carolina Combined Survey Database } Model Structure } Traditional Approach vs. Key Features of New Approach } Graphical User Interface } Benefits } NCDOT that was then, this is now
6 Combined Survey Database } Household travel survey data from 4 MPOs across North Carolina } Used to develop default rates and parameters } Household disaggregate curves } Production and attraction rates } Initial gamma coefficients } Mode split factors } Vehicle occupancy factors } Time of day distribution } Starting point for communities with no observed travel survey data } Future enhancement NHTS add-on to adjust rates
7 Survey Data Mash-up Combined Survey Database WLM RDU GNV CLT Mash-up Variables Household, Person, Trip Variables per Survey, Local Attributes 7

")


8 Model Structure Highway Networks Level-of- Service Matrices (skims) Zonal Demographics & Land Use Data Trip Generation Trip Distribution Mode Choice Time of Day Commercial Vehicles and External Station Analysis Trip Assignment
9 Data Collection Traditional 100% field inventory Standardization Census Data Private Vendor Data


10 TAZ Census and Socio-Economic Data } Total Population } Total Households } Total Autos } School Enrollment 10
11 TAZ Employment Groupings 3-digit NAICS Employment NAICS 3-digit codes Category Industry , , 221, , , 424, , 486, 488, , 562 Retail 423, , 446, High-traffic 445, 447, 722 Retail Service 485, 487, 532, 541, 561, 611, , , 721, , 922, 923 Office 425, 454, , , 531, 533, 551, 921,
12 Highway Network Traditional No standard approach No standard procedures for attributes No standard procedures for capacity calculations Standardization Guidelines for selecting modeled roadways Minimum required attributes NCLOS program for capacity calculations
13 Standard Roadway Attributes Attribute Posted Speed Facility Type Area Type Divided AB Lanes BA Lanes Functional Class AB Capacity BA Capacity Initial Time Alpha Description Predefined Predefined Predefined Number of lanes by direction Predefined Capacity Lookup Table Initial link travel time, calculated from Posted Speed. Documented formula Predefined parameter used in the Volume Delay Function 13
14 Values of Facility Type Value Freeway Multi-lane Highway Two-lane Highway Urban Arterial I Urban Arterial II Urban Arterial III Urban Arterial IV Collector Local Road Diamond Ramp Loop Ramp Freeway to Freeway Ramp Definition Roads with uninterrupted flow and fully restricted access including interstate facilities, freeways, and expressways. Partial access control two-way facility. No traffic signals or with traffic signals spaced at least 2 miles apart. Directional traffic is divided or with a continuous turn lane. Rural, undivided, two-way highways. Intercity or commuting route serving longer trips in rural areas. Principal arterials of high speed design Most suburban designs, and intermediate designs for principal arterials. Generally urban design for principal arterials, intermediate design for minors Minor arterials of intermediate or urban design Urban suburban locations with lower speeds than arterials. Can be rural roadways with low free-flow speed or frequent interruptions. Coded to provide connectivity. Low speed collectors Centroid Connector 14
15 Values of Cross-Section Divided DIVIDED_CD Definition Undivided 1 Undivided roadway and centroid connectors Divided 2 Divided roadway CLTL 3 Continuous Left Turn Lane 15
16 Values of Functional Classification Functional FUNCL_CD Not Classified 99 Rural Principal Arterial - Interstate 20 Rural Principal Arterial - Other 21 Rural Minor Arterial 22 Rural Major Collector 23 Rural Minor Collector 24 Rural Local / Rural Centroid Connectors 25 Urban Principal Arterial - Interstate 10 Urban Principal Arterial - Freeway/Expressway 11 Urban Principal Arterial - Other 12 Urban Minor Arterial 13 Urban Collector 14 Urban Local / Urban Centroid Connectors 15 16
17 Initial Travel Time Calculations Description Selection Set Formula CASE1: Higher level highways Where Facility Type = "Freeway" or ((Facility Type = "Multi-lane Highway" or Facility Type = "Two-lane Highway") and Divided = "Divided") Initial Travel Time = Length/(Posted Speed + 5.0)*60 CASE2: Lower level highways and arterials CASE3: Local Roads, collectors, ramps and other links ((Where Facility Type = "Multi-lane Highway" or Facility Type = "Two-lane Highway") and Divided = "Undivided" or Divided = CLTL ) or Facility Type contains "Urban Arterial" Where Facility Type= "Centroid Connector" or Facility Type= "Collector" or Facility Type= "Diamond Ramp" or Facility Type= "Loop Ramp" or Facility Type= "Local Road" or Facility Type= "Freeway to Freeway Ramp" Initial Travel Time = Length/(Posted Speed - 5.0)*60 Initial Travel Time = Length/Posted Speed*60 17
18 Alpha Parameter by Facility Type Facility Type Alpha Freeway 10 Multi-Lane Highway 8 Two-lane Highway 6 Urban Arterial I 6 Urban Arterial II 6 Urban Arterial III 6 Urban Arterial IV 6 Collector 4 Local Road 4 Diamond Ramp 8 Loop Ramp 8 Freeway to Freeway Ramp 8 Centroid Connector NA 18
19 Example Capacity Lookup Table 19 Facility Type Area Type Divided Capacity(Hourly/Lane) Freeway CBD Divided 2,100 Freeway Rural Divided 2,100 Freeway Urban Divided 2,100 Multi-lane Highway CBD Divided 1,700 Multi-lane Highway CBD Undivided 1,400 Multi-lane Highway Rural Divided 1,700 Multi-lane Highway Rural Undivided 1,400 Multi-lane Highway Urban Divided 1,700 Multi-lane Highway Urban Undivided 1,400 Two-lane Highway Rural Divided 1,200 Two-lane Highway Rural Undivided 1,000 Two-lane Highway Urban Divided 1,200 Two-lane Highway Urban Undivided 1,000 Freeway to Freeway Ramp CBD Divided 2,100 Freeway to Freeway Ramp Rural Divided 2,100 Freeway to Freeway Ramp Urban Divided 2,100 Loop Ramp CBD Divided 1,000 Loop Ramp Rural Divided 1,000 Loop Ramp Urban Divided 1,000 Urban Arterial I CBD Divided 1,500 Urban Arterial I CBD Undivided 1,400 Etc
20 Peak Hour Factors Small Areas Period Peak Hour Factor Period Limits Period Length AM AM 10 AM 4 hours MD AM 3 PM 5 hours PM PM 7 PM 4 hours OP PM 6 AM 11 hours 20
21 Peak Hour Factors Large Areas Period Peak Hour Factor Period Limits Period Length AM AM 10 AM 4 hours MD AM 3 PM 5 hours PM PM 7 PM 4 hours OP PM 6 AM 11 hours 21
22 Rates and Parameters Traditional Borrowed from other areas No guidelines for transferability Used classification of households on a scale of excellent to poor Standardization Default rates from combined survey database Separate rates for small and large areas Standard variables designed to best capture travel behavior
23 Trip Generation Submodels Not used Traditional Standardization Default household size curves Default auto ownership curves Default seed matrix All data derived from census data for communities covered in combined survey database
24 Example Trip Generation Submodel 90% 80% Percent of Households 70% 60% 50% 40% 30% 20% 10% 0% Average Household Size Household Size 1-Person Household Size 2-Person Household Size 3-Person Household Size 4-Person Household Size 5+-Person 24
25 Trip Generation Traditional 3 trip purposes (HBW,HBO,NHB) Productions by 5 dwelling unit classes Attractions by 5 employment categories Vehicle trips Standardization 5 trip purposes Productions by household size and auto ownership (20 classes) Attractions by 5 employment categories Person trips
26 Person Trip Production Rates and Standard Deviation (1 person households) Field Name Description HBW HBO HBSCH NHBW NHBO hhp1a0 hhp1a1 hhp1a2 hhp1a3 1 person, 0 auto Standard Deviation 1 person, 1 auto Standard Deviation 1 person, 2 auto Standard Deviation 1 person, 3 auto Standard Deviation
27 Person Trip Attraction Rates Employment Type HBW HBO HBSCH NHBW NHBO Total Employment 1.06 Industry Retail Highway Retail Service Office Households Student Enrollment
28 Person Trip Attraction Rates Standard Deviation Employment Type HBW HBO HBSCH NHBW NHBO Total Employment Industry Retail Highway Retail Service Office Households Student Enrollment
29 Trip Distribution Traditional Friction factor table Impedance = initial travel time Standardization Gamma Function Impedance = Generalized Cost
30 Combined Survey HBW TLD GC Fitted vs Observed GC Fitted GC Observed GC 30
31 Range of Trip Lengths } Highlighted the need to develop separate factors for small and large areas Purpose Range of Mean Travel Time Range of Mean Trip Length Range of Mean Generalized Cost HBW HBO HBSCH NHBW NHBO
32 Standard Gamma Coefficients Trip Purpose a b c HBW (large area) HBW (small area) HBO HBSCH NHBW (large area) NHBW (small area) NHBO (large area) NHBO (small area) CV1 (large area) CV1 (small area) CV2 (large area) CV2 (small area) CV3 (large area) CV3 (small area) IX (large area) IX (small area)
33 Mode Split Traditional None Standardization Mode factors applied to person trip tables
34 Mode Shares by Trip Purpose Small Study Area Large Study Area Purpose Auto Non-Auto Auto Non-Auto HBW HBO HBSCH NHBW NHBO
35 Commercial Vehicles Traditional Trip rate applied to total commercial vehicles per zone CV trips combined with NHB trips for distribution Standardization Separate production and attraction equations for 3 classes of commercial vehicles 3 classes maintained through time of day Commercial Autos/ Vans (CV1) Commercial Pickups (CV2) Large Trucks (CV3)
36 Commercial Vehicle Production Rates Production Rates Industry CV Retail CV HwyRet CV Service CV Office CV Autos/Vans (CV1) Pickups (CV2) Trucks (CV3)
37 Commercial Vehicle Attraction Rates Industry EMP Retail EMP HwyRetail EMP Service EMP Office EMP Households Autos/Vans (CV1) Pickups (CV2) Trucks (CV3)
38 External Station Analysis Traditional SYNTH program to synthesize through trip table based on ADT, facility type, and % trucks Borrowed attraction rates for IE/EI trips Standardization No change
39 SYNTH PROGRAM n Uses regression equations and matrix balancing techniques to synthesize through trips n Requires: planning area population, external station count, percent trucks, functional classification, and information on route continuity 39
40 External Station Attraction Rates Households Industry Retail HwyRetail Service Office IX
41 Time of Day Traditional Daily Model Standardization AM, Midday, PM, and Night Time of day distributions developed from combined survey Vehicle occupancy factors from combined survey
42 Time of Day Distribution by Purpose % FLOW Hour dep_hbw ret_hbw dep_hbsch ret_hbsch dep_hbo ret_hbo dep_nhbw ret_nhbw dep_nhbo ret_nhbo dep_all ret_all ALL

43 Highway Assignment Traditional Primarily allor-nothing Standardization Time period user equilibrium assignment using a conical delay function
44 Auto Occupancy Factors by Purpose Small Study Area Factors Large Study Area Factors Purpose AM MD PM OP AM MD PM OP HBW HBO HBSCH NHBW NHBO
45 Validation and Reasonableness Checking Traditional Primarily performed at highway assignment using screenline and coverage counts Standardization Reasonableness checks at each step in the process using secondary sources of data Best practice highway assignment validation checks including %RMSE
46 Target Percent Root Mean Square Error Facility Type Approximate % RMSE Interstate 25% Freeway/Expressway 40% Arterials 50% Collector 65% Total 30 40% 46
47 FHWA Standards for Acceptable Deviation by Volume Group Daily 2-way Volume Desirable Percent Deviation < 1,000 60% 1,000 to 2,500 47% 2,500 to 5,000 36% 5,000 to 10,000 29% 10,000 to 25,000 25% 25,000 to 50,000 22% > 50,000 21% 47
48 Example Scatter Plot Chart Title R 2 = Flow Count 48
49 Highway Assignment Review EXAMPLE VMT Summaries (Count Links Only) Facility Type TOT VMT Count VMT % Deviation Freeway 117, , Multilane Highway 155, , Urban Arterial I 29,088 37, Urban Arterial II 51,243 46, Urban Arterial III 21,138 24, Urban Arterial IV 68,145 86, Two-lane Highway 43,682 28, Collector 21,939 26, All 508, ,522-21
50 Highway Assignment Assessment Example } Action Items: } Review traffic counts for two-lane highways verify the accuracy of the data } Review the centroid connectors in relation to how they assign to the two-lane highways } Overall low assignment indicates that we are not getting enough trips systemwide. } FIRST STEP: Recall that the intrazonal percentages were much too high. Adjust for the intrazonal percentages (K-factors) and rerun the model to see if the VMT statistics improve. } TIP: When making model adjustments it is wise to make only ONE adjustment at a time and then test the results of that adjustment before making another adjustment. } SECOND STEP: Recall that we had an imbalance in the HBW productions and HBW attractions, where the productions were lower than the attractions. It was also noted that the %HBW trips was lower than what is typically expected. Since we balance to productions we may need to adjust the trip production rates for the HBW trip purpose.
51 Problem Systemwide volumes are higher than ground counts Systemwide volumes are lower than ground counts Total systemwide volumes match ground counts but specific links do not Possible Solutions a. Raise auto occupancy rates b. Lower trip production rates c. Are number of households to high d. Is auto ownership to high e. Lower average trip length f. Increase intrazonal trips g. Check counts a. Lower auto occupancy rates b. Raise trip production rates c. Are number of households to low d. Is auto ownership to low e. Raise average trip length f. Decrease intrazonal trips g. Check counts a. Verify speed and capacity of roadway section b. Modify local network c. Add or delete nearby centroid connectors d. Check nearby special generators e. Check socioeconomic data of nearby zones 51

52 Graphical User Interface
53 Required Directory Structure Model Dir Scenario Dir Input Interim Output Parameters 53
54 File Names and Descriptions Parameters Folder File Name CAPACITY.BIN ALPHA.BIN HHSIZE.BIN AUTOS.BIN JOINTDIST.BIN NCPRODRATES.BIN NCATTRRATES.BIN CVPRODRATES.BIN CVATTRRATES.BIN IXATTRRATES.BIN GAMMACOEFFICIENTS_*.BIN Description BIN file with capacities for study area MUST BE UPDATED BY USER BIN file with standard values for alpha coefficient Default household size curve coefficients Default auto ownership curve coefficients Joint household size/auto ownership seed matrix Default trip production rates Default trip attraction rates Default commercial vehicle trip production rates Default commercial vehicle trip attraction rates Default IX trip attraction rates Default Gamma Coefficients KFACTORS.MTX User defined matrix of K-factors (if needed) MODESHARES_*.BIN Auto mode shares VEHOCCUPANCYFACTORS_*.BIN Vehicle occupancy factors NC_HOURLY_*.BIN PEAKFACTORS_*.BIN PA to OD TOD conversions Peak hour factors used to convert hourly capacity to time period capacity 54
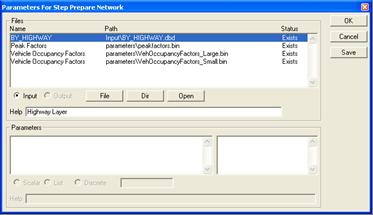
55 Scenario Input Files File Name Model Step(s) Description *_SEDATA.BIN BY_HIGHWAY.DBD *_HIGHWAY.DBD Trip Generation, Commercial Vehicles, External Trips Prepare Network, Create Network, Traffic Assignment Zonal data inputs and external station inputs Base year highway line layer Any future scenario line layer *EE_TRIPS.MTX Time of Day Through trip table for given year or scenario 55
56 Scenario Output Files File Name Model Step Description NETWORK.NET Create Network file for path building and assignment SHORTESTPATH.MTX Network Skim matrix with zone to zone minimum travel time and associated distances. GENCOST.MTX Combined generalized cost matrix used in person trip distribution BALANCE_PA2.BIN Trip Generation Balanced productions and attractions for internal person trips (NHBW and NHBO_NR trips BALANCE_CV.BIN BALANCE_IX.BIN included), CV trips, and IX trips. AMTOT_TRIPS.MTX Time of Day Total vehicle trip tables by time of day MDTOT_TRIPS.MTX PMTOT_TRIPS.MTX OPTOT_TRIPS.MTX AM_LINKFLOW.BIN MD_LINKFLOW.BIN PM_LINKFLOW.BIN OP_LINKFLOW.BIN TOTAL_LINKFLOW.BIN Traffic Assignment Total vehicle link flow by time of day Daily total link flow 56

57 Scenario Management 57
58 Overall benefits } Streamlines and standardizes model development } Moves NCDOT towards current best practice } Provides basis for training } Adaptable to future enhancements } Rates and parameters based on North Carolina data
59 NCDOT that was then, this is now } Great tool for education and standardization } Good for the basic modeler } Agency buy-in at all levels is critical to success } Formal hands-on training is essential and should be repeated periodically } Need to implement a process to maintain and update } Standardization does not equate to all models being the same! 59
60 60

61 61
9. TRAVEL FORECAST MODEL DEVELOPMENT
 9. TRAVEL FORECAST MODEL DEVELOPMENT To examine the existing transportation system and accurately predict impacts of future growth, a travel demand model is necessary. A travel demand model is a computer
Transportation Model Report
 1. Introduction The traffic impacts of the future developments in the IL130/High Cross Road corridor for different scenarios were analyzed using a Travel Demand Model (TDM). A four step modeling process
APPENDIX H: TRAVEL DEMAND MODEL VALIDATION AND ANALYSIS
 APPENDIX H: TRAVEL DEMAND MODEL VALIDATION AND ANALYSIS Travel demand models (TDM) simulate current travel conditions and forecast future travel patterns and conditions based on planned system improvements
Model Characteristics
 1 General Model Design Highway Network/Traffic Analysis Zones (TAZs) Development of Synthetic Trip Tables Validation Procedures & Results Model Application (2003 & 2030) Review 2 Model Characteristics
The Updated Whatcom Model Project Final Report. Prepared for: The Whatcom Council of Governments. February 28, 2014.
 The Updated Whatcom Model 2014 Project Final Report Prepared for: The Whatcom Council of Governments February 28, 2014 Prepared by: Caliper Corporation 1172 Beacon St Newton, MA 02461. 617 527 4700 www.caliper.com
Travel Demand Modeling At NCTCOG
 Travel Demand Modeling At NCTCOG Arash Mirzaei North Central Texas Council Of Governments For University of Texas at Arlington ITE Student Chapter March 9, 2005 Agenda Background DFW Regional Model Structure
A Time Series Approach to Forecast Highway Peak Period Spreading and Its Application in Travel Demand Modeling
 A Time Series Approach to Forecast Highway Peak Period Spreading and Its Application in Travel Demand Modeling Sabya Mishra (University of Memphis) Timothy F. Welch (Georgia Institute of Technology) Subrat
Section 1.0 INTRODUCTION. Section 2.0 MODEL ARCHITECTURE RECOMMENDATIONS, PHASE I, TIER I - PASSENGER CAR AND TRUCK..
 TABLE OF CONTENTS Section 1.0 INTRODUCTION Section 2.0 MODEL ARCHITECTURE RECOMMENDATIONS, PHASE I, TIER I - PASSENGER CAR AND TRUCK.. Section 2.1 General Software and Forecast Year Recommendations. Section
CHAPTER 7. TRAVEL PATTERNS AND TRAVEL FORECASTING
 CHAPTER 7. TRAVEL PATTERNS AND TRAVEL FORECASTING TRAVEL PATTERNS Northwest Arkansas has experienced unprecedented growth in population and employment in the past 25 years. The economic vitality and diversity
technical report KATS Travel Model Update Technical Documentation Kalamazoo Area Transportation Study Cambridge Systematics, Inc.
 Technical Documentation technical report prepared for Kalamazoo Area Transportation Study prepared by Cambridge Systematics, Inc. with Dunbar Transportation Consulting June 29, 2015 www.camsys.com report
Model Construction and Calibration Technical Documentation Draft
 430 IACC Building Fargo, ND 58105 Tel 701-231-8058 Fax 701-231-1945 www.ugpti.org www.atacenter.org Model Construction and Calibration Technical Documentation Draft January, 2004 Prepared for: Bismarck/Mandan
MINIMUM TRAVEL DEMAND MODEL CALIBRATION and VALIDATION GUIDELINES FOR STATE OF TENNESSEE UPDATED 2012
 MINIMUM TRAVEL DEMAND MODEL CALIBRATION and VALIDATION GUIDELINES FOR STATE OF TENNESSEE UPDATED 2012 By: Dr. Fred Wegmann Dr. Jerry Everett Center for Transportation Research University of Tennessee Knoxville,
TM-1 District One Regional Model ( ) Executive Summary. February 2016
 Executive Summary. February 2016") TM-1 District One Regional Model (2010-2040) Executive Summary February 2016 This report: TM-1 Introduction to the D1RPM and Validation Report provides an overall reviews of the model and contains summary
TM-1 District One Regional Model (2010-2040) Executive Summary February 2016 This report: TM-1 Introduction to the D1RPM and Validation Report provides an overall reviews of the model and contains summary
draft report DRAFT Model Documentation Dane County Travel Demand Model Wisconsin Department of Transportation Cambridge Systematics, Inc.
 Dane County Travel Demand Model draft report prepared for Wisconsin Department of Transportation prepared by Cambridge Systematics, Inc. January, 2014 www.camsys.com report DRAFT Model Documentation Dane
CLARKSVILLE/MONTGOMERY COUNTY TRAVEL DEMAND MODEL MODEL DEVELOPMENT REPORT
 CLARKSVILLE/MONTGOMERY COUNTY TRAVEL DEMAND MODEL MODEL DEVELOPMENT REPORT JULY 2009 CLARKSVILLE / MONTGOMERY COUNTY TRAVEL DEMAND MODEL MODEL DEVELOPMENT REPORT July 2009 Alliance Transportation Group,
III. CONSENT AGENDA 1:40 *A. Approve October 1, 2013 Meeting Minutes
 TRANSPORTATION MODEL ADVISORY COMMITTEE January 14, 2014 1:30 p.m. 3:00 p.m. Community Planning Association 700 NE 2nd Street, 2nd Floor Large Conference Room, Meridian NOTICE: This packet contains only
A Comparison of CEMDAP Activity-Based Model With DFWRTM 4-Step Model
 A Comparison of CEMDAP Activity-Based Model With DFWRTM 4-Step Model Arash Mirzaei P.E. NCTCOG - Arlington, Texas and Naveen Eluru UT Austin - Austin, Texas for 11 th TRB National Transportation Planning
Kentucky Statewide Travel Model (KYSTM) Rob Bostrom Wilbur Smith Associates Combined Kentucky-Tennessee Model Users Group Meeting Bowling Green, KY
 Rob Bostrom Wilbur Smith Associates Combined Kentucky-Tennessee Model Users Group Meeting Bowling Green, KY") Kentucky Statewide Travel Model (KYSTM) Rob Bostrom Wilbur Smith Associates Combined Kentucky-Tennessee Model Users Group Meeting Bowling Green, KY October 26, 2006 Presentation Overview Overview of statewide
Kentucky Statewide Travel Model (KYSTM) Rob Bostrom Wilbur Smith Associates Combined Kentucky-Tennessee Model Users Group Meeting Bowling Green, KY October 26, 2006 Presentation Overview Overview of statewide
report final Decennial Model Update Executive Summary Contra Costa Transportation Authority Cambridge Systematics, Inc.
 final report prepared for Contra Costa Transportation Authority prepared by with Dowling Associates Caliper Corporation June 2003 Table of Contents 1.0 Introduction... ES-1 2.0 Data Development... ES-5
Draft Update Presented to the Grand Forks East Grand Forks MPO TAC
 GRAND FORKS EAST GRAND FORKS 2015 TRAVEL DEMAND MODEL UPDATE DRAFT REPORT Draft Update Presented to the Grand Forks East Grand Forks MPO TAC August 9 th 2017 Diomo Motuba, PhD Advanced Traffic Analysis
CHAPTER 9 TRAVEL DEMAND MODEL SUMMARY
 CHAPTER 9 TRAVEL DEMAND MODEL SUMMARY This chapter describes the OKI / MVRPC regional travel demand model, used to support traffic and transit forecasts for the NSTI study. This model is based on version
Traffic Data Quality Analysis. James Sturrock, PE, PTOE, FHWA Resource Center Operations Team
 Traffic Analysis James Sturrock, PE, PTOE, FHWA Resource Center Operations Team Source Material Traffic Measurement http://ntl.bts.gov/lib/jpodocs/repts_te/14058.htm Seven DEADLY Misconceptions about Information
Memphis and Shelby County. Metropolitan Planning Organization (MPO) Travel Demand Model. Tennessee-Kentucky Model User Group Meeting
 Travel Demand Model. Tennessee-Kentucky Model User Group Meeting") Memphis and Shelby County Metropolitan Planning Organization (MPO) Travel Demand Model Tennessee-Kentucky Model User Group Meeting October 26, 2006 Model Development Team Kimley-Horn and Associates, Inc.
Memphis and Shelby County Metropolitan Planning Organization (MPO) Travel Demand Model Tennessee-Kentucky Model User Group Meeting October 26, 2006 Model Development Team Kimley-Horn and Associates, Inc.
Fargo Moorhead MPO 2010 Regional Travel Demand Model Update Technical Report-DRAFT. June 2013
 430 IACC Building Fargo, ND 58105 Tel 701-231-8058 Fax 701-231-1945 www.ugpti.org www.atacenter.org Fargo Moorhead MPO 2010 Regional Travel Demand Model Update Technical Report-DRAFT June 2013 Prepared
APPENDIX TRAVEL DEMAND MODELING OVERVIEW MAJOR FEATURES OF THE MODEL
 APPENDIX A TRAVEL DEMAND MODELING OVERVIEW The model set that the Central Transportation Planning Staff (CTPS), the Boston Region Metropolitan Planning Organization s (MPO) technical staff, uses for forecasting
Maryland Statewide Transportation Model (MSTM)
") Maryland State Highway Administration (MD SHA) Maryland Statewide Transportation Model (MSTM) TRB Meeting Federal Surface Transportation Requirements in Statewide and Metropolitan Transportation Planning:
Maryland State Highway Administration (MD SHA) Maryland Statewide Transportation Model (MSTM) TRB Meeting Federal Surface Transportation Requirements in Statewide and Metropolitan Transportation Planning:
Recommended Roadway Plan Section 3 Existing Facilities & System Performance
 Recommended Roadway Plan Section 3 Existing Facilities & System Performance RECOMMENDED ROADWAY PLAN SECTION 3 Existing Facilities and System Performance 3.1 Introduction An important prerequisite to transportation
MOBILITY AND ALTERNATIVES ANALYSIS
 6 MOBILITY AND ALTERNATIVES ANALYSIS BACK OF SECTION DIVIDER 6.0 Mobility and Alternatives Analysis Travel demand analysis provides a framework for the identification of transportation facilities and services
Appendix G: Travel Demand Model Documentation
 Appendix G: Travel Demand Model Documentation Skagit Council of Governments TRAVEL DEMAND MODEL DOCUMENTATION August 2015 Prepared by: 11730 118 th Avenue NE, Suite 600 Kirkland, WA 98034-7120 Phone: 425-821-3665
Using the Federal Transit Administration (FTA) Simplified Trips-on-Project Software (STOPS) for Transit Demand Estimation
 Simplified Trips-on-Project Software (STOPS) for Transit Demand Estimation") Using the Federal Transit Administration (FTA) Simplified Trips-on-Project Software (STOPS) for Transit Demand Estimation presented to 2014 ITE Mid-Colonial District and Mid-Atlantic Section Annual Meeting
Using the Federal Transit Administration (FTA) Simplified Trips-on-Project Software (STOPS) for Transit Demand Estimation presented to 2014 ITE Mid-Colonial District and Mid-Atlantic Section Annual Meeting
Database and Travel Demand Model
 Database and Travel Demand Model 7 The CMP legislation requires every CMA, in consultation with the regional transportation planning agency (the Metropolitan Transportation Commission (MTC) in the Bay
GENESEE COUNTY URBAN TRAVEL DEMAND MODEL IMPROVMENTS
 GENESEE COUNTY URBAN TRAVEL DEMAND MODEL IMPROVMENTS Model Development and Validation Report Prepared for the Genesee County Metropolitan Planning Commission January 2009 Revised May 2009 Prepared by Bernardin,
SHIFT ODME Model & Utilities. Prepared For: Institute for Trade and Transportation Studies
 SHIFT ODME Model & Utilities Prepared For: Institute for Trade and Transportation Studies Developed January 2016 Updated February 2017 Table of Contents Section 1 Introduction... 1-1 1.1 Purpose of Model...
D1 REGIONAL PLANNING MODEL (D1RPM V1.0.3)
") MODEL ADVANCEMENT COMMITTEE (MAC) MEETING APRIL 6, 2017 D1 REGIONAL PLANNING MODEL (D1RPM V1.0.3) Polk 12 County Area (previously individual models) 5,662 zones Manatee Hardee Okeechobee 2010 base year
MODEL ADVANCEMENT COMMITTEE (MAC) MEETING APRIL 6, 2017 D1 REGIONAL PLANNING MODEL (D1RPM V1.0.3) Polk 12 County Area (previously individual models) 5,662 zones Manatee Hardee Okeechobee 2010 base year
SHOALS AREA Long Range Transportation Plan. Prepared for: Northwest Alabama Council of Local Governments. Prepared by: Skipper Consulting, Inc.
 SHOALS AREA 2030 Long Range Transportation Plan Prepared for: Northwest Alabama Council of Local Governments Prepared by: Skipper Consulting, Inc. December 2005 SHOALS AREA 2030 Long Range Transportation
Refined Statewide California Transportation Model. Progress Report November 2009
 Refined Statewide California Transportation Model Progress Report November 2009 Study area - the State of California. Forecast trips made on a typical fall / spring weekday i.e. when schools are in session.
2010 REGIONAL TRANSPORTATION MODEL UPDATE
 2010 REGIONAL TRANSPORTATION MODEL UPDATE Final Report April, 2016 Prepared by the Pioneer Valley Planning Commission The analysis in this report was completed after the adoption of the Regional Transportation
Chapter #9 TRAVEL DEMAND MODEL
 Chapter #9 TRAVEL DEMAND MODEL TABLE OF CONTENTS 9.0 Travel Demand Model...9-1 9.1 Introduction...9-1 9.2 Overview...9-1 9.2.1 Study Area...9-1 9.2.2 Travel Demand Modeling Process...9-3 9.3 The Memphis
Modeling Truck Movements: A Comparison between the Quick Response Freight Manual (QRFM) and Tour-Based Approaches
 and Tour-Based Approaches") International Journal of Engineering Science Invention ISSN (Online): 2319 6734, ISSN (Print): 2319 6726 Volume 5 Issue 11 November 2016 PP. 45-51 Modeling Truck Movements: A Comparison between the Quick
International Journal of Engineering Science Invention ISSN (Online): 2319 6734, ISSN (Print): 2319 6726 Volume 5 Issue 11 November 2016 PP. 45-51 Modeling Truck Movements: A Comparison between the Quick
TRAVEL DEMAND MODEL METHODOLOGY AND AIR QUALITY CONFORMITY ANALYSIS
 Contents APPENDIX 4 TRAVEL DEMAND MODEL METHODOLOGY AND AIR QUALITY CONFORMITY ANALYSIS Section 1 - Travel Demand Forecast Model Procedures and Assumptions Section 2 - Population and Employment Forecasts
Freight Transportation Planning and Modeling Spring 2012
 Freight Model Validation Techniques Abstract Several reviews of validation techniques for statewide passenger and freight models have been published over the past several years. In this paper I synthesize
The Auckland Transport Models Project - Overview and Use to Date -
 The Auckland Transport Models Project - Overview and Use to Date - John Davies (Auckland Regional Council) Jojo Valero (Auckland Regional Council) David Young (David Young Consulting) Auckland Transport
Chapter 8 Travel Demand Forecasting & Modeling
 Chapter 8 Travel Demand Forecasting & Modeling The Travel Demand Forecasting and Modeling process for the Jackson MPO was developed in cooperation between the Region 2 Planning Commission (R2PC) and the
TRB WEBINAR PROGRAM Planning and Preliminary Engineering Applications Guide to the Highway Capacity Manual: Contents
 TRANSPORTATION RESEARCH BOARD TRB WEBINAR PROGRAM Planning and Preliminary Engineering Applications Guide to the Highway Capacity Manual: Contents Tuesday, May 30, 2017 2:00-3:30 PM ET The Transportation
Appendix D Functional Classification Criteria and Characteristics, and MnDOT Access Guidance
 Appendix D Functional Classification Criteria and Characteristics, and MnDOT Access Guidance Functional classification identifies the role a highway or street plays in the transportation system. Some highways
Appendix D: Functional Classification Criteria and Characteristics, and MnDOT Access Guidance
 APPENDICES Appendix D: Functional Classification Criteria and Characteristics, and MnDOT Access Guidance D.1 Functional classification identifies the role a highway or street plays in the transportation
VEHICLE PARTICULATE EMISSIONS ANALYSIS
 VEHICLE PARTICULATE EMISSIONS ANALYSIS Prepared for ARIZONA DEPARTMENT OF TRANSPORTATION TRANSPORTATION PLANNING DIVISION MPOs/COGs AIR QUALITY POLICY AND LOCAL PROGRAMS SECTION AND YUMA METROPOLITAN PLANNING
HCM 6th Edition Planning and Preliminary Engineering Applications Guide (PPEAG) to the HCM Bringing Back-of-the-Envelope Back.
 to the HCM Bringing Back-of-the-Envelope Back.") HCM 6th Edition Planning and Preliminary Engineering Applications Guide (PPEAG) to the HCM Bringing Back-of-the-Envelope Back April, 2017 Potential Use of the HCM in Planning The HCM is commonly used to
HCM 6th Edition Planning and Preliminary Engineering Applications Guide (PPEAG) to the HCM Bringing Back-of-the-Envelope Back April, 2017 Potential Use of the HCM in Planning The HCM is commonly used to
Transport Model for Scotland. Kevin Lumsden MVA
 1. INTRODUCTION Transport Model for Scotland Kevin Lumsden MVA Transport Model for Scotland (TMfS) is a multi-modal transport demand and assignment model with an interactive Land Use model. The model area
APPENDIX D. Glossary D-1
 APPENDIX D Glossary D-1 Glossary of Transportation Planning Terms ANNUAL AVERAGE DAILY TRAFFIC (AADT): The total number of vehicles passing a given location on a roadway over the course of one year, divided
Improved Software Tools for Regional & Local Integrated Land Use/Transportation Planning in California (funded by Caltrans)
") Improved Software Tools for Regional & Local Integrated Land Use/Transportation Planning in California (funded by Caltrans) Training Session Tuesday June 26, 2012 10:00 to 12 noon AGENDA Opening: Introductions
Improved Software Tools for Regional & Local Integrated Land Use/Transportation Planning in California (funded by Caltrans) Training Session Tuesday June 26, 2012 10:00 to 12 noon AGENDA Opening: Introductions
CHAPTER 2 - TRAVEL DEMAND MODEL DEVELOPMENT
 CHAPTER 2 - TRAVEL DEMAND MODEL DEVELOPMENT 2.1 EXISTING TRAVEL DEMAND MODEL In order to accurately project future year traffic volumes within this regional study area, it was first necessary to construct
The Lure of Big Data: Evaluating the Efficacy of Mobile Phone Data for Travel Model Validation
 Huntsinger 1 1 2 3 4 5 6 7 8 9 10 11 12 13 14 15 16 17 18 19 20 21 22 23 24 25 26 27 28 29 The Lure of Big Data: Evaluating the Efficacy of Mobile Phone Data for Travel Model Validation Leta F. Huntsinger,
Effectively Using the QRFM to Model Truck Trips in Medium-Sized Urban Communities
 Effectively Using the QRFM to Model Truck Trips in Medium-Sized Urban Communities By Dr. Michael Anderson and Mary Catherine Dondapati Department of Civil and Environmental Engineering The University of
Jeff Gulden, PE, TE, JP Goates, MCMP, and Reid Ewing, Ph.D. Page 1 MIXED-USE DEVELOPMENT TRIP GENERATION MODEL
 Jeff Gulden, PE, TE, JP Goates, MCMP, and Reid Ewing, Ph.D. Page 1 MIXED-USE DEVELOPMENT TRIP GENERATION MODEL Original submission date: August 1, 2012 Revised submission date: November 13, 2012 Number
California Statewide Interregional Integrated Modeling (SIIM) Framework. California STDM. HBA Specto Incorporated ULTRANS, UC Davis
 Framework. California STDM. HBA Specto Incorporated ULTRANS, UC Davis") California Statewide Interregional Integrated Modeling (SIIM) Framework California STDM HBA Specto Incorporated ULTRANS, UC Davis SIIM Advisory Group Meeting June 2010 model-wide economic / demographic
California Statewide Interregional Integrated Modeling (SIIM) Framework California STDM HBA Specto Incorporated ULTRANS, UC Davis SIIM Advisory Group Meeting June 2010 model-wide economic / demographic
Innovative Assignment Process for a Statewide Model
 Innovative Assignment Process for a Statewide Model William G. Allen, Jr., PE TRB Innovations in Travel Modeling Conference Atlanta June 2018 1 New Statewide Travel Model for Kansas Conventional four-step
Appendix C: GHG Emissions Model
 Appendix C: GHG Emissions Model 1 METHOD OVERVIEW The Maryland Statewide Transportation Model (MSTM) Emissions Model (EM) is a CUBE-based model that uses emission rates calculated by the MOVES2010 EPA
Skagit Council of Governments Travel Demand Model Update Documentation
 Skagit Council of Governments Travel Demand Model Update Documentation Prepared for: The Skagit Council of Governments July 2010 By: PTV America, Inc. Table of Contents Introduction... 4 The Modeling Process...
Appendix D. Tier 2 Final Environmental Assessment I-66 Transportation Technical Report
 Tier 2 Final Environmental Assessment I-66 Transportation Technical Report Appendix D Travel Demand Model & Post Processing Methodology & Assumptions Technical Memorandum FINAL AUGUST 2016 TECHNICAL MEMORANDUM
INCLUSION OF TIME-DEPENDENT NETWORKS IN MARYLAND STATEWIDE TRANSPORTATION MODEL
 INCLUSION OF TIME-DEPENDENT NETWORKS IN MARYLAND STATEWIDE TRANSPORTATION MODEL Prepared by: The National Center for Smart Growth Research and Education at the University of Maryland* in partnership with
IOWA DEPARTMENT OF TRANSPORTATION. Request for Proposal
 IOWA DEPARTMENT OF TRANSPORTATION Request for Proposal for PHASE II DEVELOPMENT OF A STATEWIDE TRAVEL DEMAND MODEL for THE STATE OF IOWA Table of Contents I. GENERAL... 3 A. Introduction... 3 B. Project
The services of the Consultant are outlined in this exhibit by task and will consist of, but not limited to the following:
 Scope of Work: Travel Demand Model Update Phase 2: Southeast Louisiana Travel Model, New Orleans (SELATRAM) RPC Project TDMNO State Project No. H.972274 Project Description The purpose of this contract
DCHC RPAT IMPLEMENTATION
 FINAL REPORT DCHC RPAT IMPLEMENTATION 3.11.2016 PREPARED FOR: FEDERAL HIGHWAY ADMINISTRATION 101 City Hall Plaza Durham, NC 27701 919.560.4366 www.dchcmpo.org SUBMITTED BY: DCHC MPO DCHC RPAT IMPLEMENTATION
6.0 CONGESTION HOT SPOT PROBLEM AND IMPROVEMENT TRAVEL DEMAND MODEL ANALYSIS
 6.0 CONGESTION HOT SPOT PROBLEM AND IMPROVEMENT TRAVEL DEMAND MODEL ANALYSIS 6.1 MODEL RUN SUMMARY NOTEBOOK The Model Run Summary Notebook (under separate cover) provides documentation of the multiple
Appendix E. Air Quality Conformity Analysis
 Appendix E Air Quality Conformity Analysis AIR QUALITY CONFORMITY ANALYSIS FOR THE 2017-2020 REGIONAL TRANSPORTATION IMPROVEMENT PROGRAM Table of Contents INTRODUCTION... 1 AIR QUALITY STATUS... 1 Figure
report Smart Growth - Refined Transport Modelling
 report Smart Growth - Refined Transport Modelling report Smart Growth - Refined Transport Modelling Prepared for Smart Growth By Beca Carter Hollings & Ferner Ltd November 2002 8111359/210 Rev A L1:90421
Travel Demand Modeling Applications How Modeling is Being Used to Address the Big Issues of Transportation Planning
 How Modeling is Being Used to Address the Big Issues of Transportation Planning Presented by: Dean Munn The Corradino Group Topics This Presentation is organized around two main topics: What is a travel
Access Operations Study: Analysis of Traffic Signal Spacing on Four Lane Arterials
 Mn/DOT Access Management Guidelines Background Technical Report Access Operations Study: Analysis of Traffic Signal Spacing on Four Lane Arterials November 2002 Minnesota Department of Transportation Office
SERPM8.0 TRAVEL DEMAND MODEL UPDATE DATA AVAILABILITY AND NEEDS
 SERPM8.0 TRAVEL DEMAND MODEL UPDATE DATA AVAILABILITY AND NEEDS UPDATED JANUARY 18 2017 UPDATES IN RED DATA ITEM DESCRIPTION/COMMENTS AGENCY/DETAILS/TIMING DATA STATUS A1 A2 Geographies for development
Updating Virginia s Statewide Functional. Brad Shelton, VDOT Chris Detmer, VDOT Ben Mannell, VDOT
 Updating Virginia s Statewide Functional Classification System Brad Shelton, VDOT Chris Detmer, VDOT Ben Mannell, VDOT July 18, 2013 What is Functional Classification Use of Functional Classification Today
RTC Position on Pavement Condition Targets
 RTC Position on Pavement Condition Targets NCTCOG Supports TxDOT Statewide 2022 Good Pavement Condition Targets for National Highway System Facilities NCTCOG Supports TxDOT Statewide 2022 Poor Pavement
P4.0 Highway Quantitative Scoring Workgroup Recommendations
 P4.0 Highway Quantitative Scoring Workgroup Recommendations May 18, 2015 Highway Project Scoring Overview Insert Table of Eligibility Statewide Mobility Regional Impact Division Needs Eligible Projects:
1. Introduction. 1.1 Project Background. ANTONY JOHNSTONE Transport Associate Aurecon
 ANTONY JOHNSTONE Transport Associate Aurecon Antony.johnstone@aurecongroup.com RAFAEL CARVAJAL Operational Modelling and Visualisation Coordinator Main Roads WA Rafael.CARVAJALCIFUENTES@mainroads.wa.gov.au
City of Tacoma TRANSPORTATION MASTER PLAN DRAFT
 City of Tacoma TRANSPORTATION MASTER PLAN 140 APPENDICES Appendix A Model Documentation MEMORANDUM Date: November 26, 2014 To: City of Tacoma, Department of Public Works From: Chris Breiland, Fehr & Peers
Regional Evaluation Decision tool for Smart Growth
 Regional Evaluation Decision tool for Smart Growth Maren Outwater, Robert Cervero, Jerry Walters, Colin Smith, Christopher Gray, Rich Kuzmyak Objectives This project is one of the SHRP 2 Capacity projects
Contents i Contents Page 1 A New Transportation Plan Community Involvement Goals and Objectives... 11
 Contents i Contents 1 A New Transportation Plan... 1 Why develop a new plan?... 1 What area does the LRTP focus on?... 2 Why is this LRTP important?... 3 Meeting Requirements for Transportation Planning...
Technical Memorandum. 720 SW Washington Suite 500 Portland, OR dksassociates.com. DATE: July 12, 2017
 Technical Memorandum DATE: July 12, 2017 TO: Kay Bork City of Veneta Bill Johnston, AICP Oregon Department of Transportation Christina McDaniel-Wilson, PE Oregon Department of Transportation Keith Blair,
Treasure Coast Regional Planning Model ABM Development (TCRPM4)
") Treasure Coast Regional Planning Model ABM Development (TCRPM4) presented to Southeast Florida Model Users Group presented by Ken Kaltenbach, The Corradino Group September 19, 2014 TRCPM Model Structure
Treasure Coast Regional Planning Model ABM Development (TCRPM4) presented to Southeast Florida Model Users Group presented by Ken Kaltenbach, The Corradino Group September 19, 2014 TRCPM Model Structure
What is the Dakota County Principal Arterial Study?
 What is the Dakota County Principal Arterial Study? The Dakota County is underway and will address future designations of certain highways as Principal Arterials. What Are Principal Arterials? Principal
A Network Demand Model for Rural Bypass Planning. Paper Number
 A Network Demand Model for Rural Bypass Planning Paper Number 00-1205 Dr. Michael D. Anderson Assistant Professor of Civil Engineering Department of Civil and Environmental Engineering The University of
Process to Identify High Priority Corridors for Access Management Near Large Urban Areas in Iowa Using Spatial Data
 Process to Identify High Priority Corridors for Access Management Near Large Urban Areas in Iowa Using Spatial Data David J. Plazak and Reginald R. Souleyrette Center for Transportation Research and Education
Performance Based Transportation Project Assessment. Utilizing Travel Demand Model Data and Dynamic Economic Modeling
 Performance Based Transportation Project Assessment Utilizing Travel Demand Model Data and Dynamic Economic Modeling Colin Belle, Metropolitan Planner Region 1 Planning Council (R1PC), Rockford Illinois
A Travel Time Reliability Estimation and Valuation Approach for Transportation Planning Applications
 A Travel Time Reliability Estimation and Valuation Approach for Transportation Planning Applications Sabya Mishra a, Liang Tang b, Sepehr Ghader b, Subrat Mahapatra c, and Lei Zhang b* a University of
2011 Sherman-Denison Work Place and Special Generator Travel Survey Technical Summary
 2011 Sherman-Denison Work Place and Special Generator Travel Survey Technical Summary Prepared by by the Texas Texas A&M A&M Transportation Institute February January 2019 2014 2011 Sherman-Denison Work
DRCOG s Land Use and Travel Demand Models. Presentation to the Institute of Transportation Engineers Colorado/Wyoming Section 12 December 2014
 DRCOG s Land Use and Travel Demand Models Presentation to the Institute of Transportation Engineers Colorado/Wyoming Section 12 December 2014 The Dirty Secret Essentially, all models are wrong, but some
The Highway Economic Requirements System (HERS): How HERS Works
: How HERS Works") The Highway Economic Requirements System (HERS): How HERS Works presented to Committee for a Study of the Future Interstate Highway System presented by Rich Margiotta, Ph.D. December 20, 2016 What We ll
The Highway Economic Requirements System (HERS): How HERS Works presented to Committee for a Study of the Future Interstate Highway System presented by Rich Margiotta, Ph.D. December 20, 2016 What We ll
Wisconsin Statewide Model
 Wisconsin Statewide Model Outline of a Proposed Approach presented by Kimon Proussaloglou Cambridge Systematics, Inc. January 12, 2004 Project Team Wisconsin DOT Doug Dalton, Project Manager Don Uelmen,
Travel Demand Model Update
 Travel Demand Model Update Travel Model Development Report 5.11.2016 1515 SW 5 th Ave, Suite 1030 Portland OR 97201 503.200.6602 www.rsginc.com Prepared For: Anchorage Metropolitan Area Transportation
EXHIBIT 2 SCOPE OF SERVICES FOR THE GAINESVILLE URBANIZED AREA YEAR 2040 LONG RANGE TRANSPORTATION PLAN UPDATE. Prepared by:
 CA.5 EXHIBIT 2 SCOPE OF SERVICES FOR THE GAINESVILLE URBANIZED AREA YEAR 2040 LONG RANGE TRANSPORTATION PLAN UPDATE Prepared by: Metropolitan Transportation Planning Organization for the Gainesville Urbanized
Charlotte Region HOV/HOT/Managed Lanes Analysis. Technical Memorandum Task 1.3 EVALUATION CRITERIA
 Charlotte Region HOV/HOT/Managed Lanes Analysis Technical Memorandum Task 1.3 EVALUATION CRITERIA October 23, 2007 TABLE OF CONTENTS 1.0 EVALUATION PROCESS -------------------------------------------------------------------------------------------
Roadway Traffic Assignment (Last Edit August 26, 2005)
") Roadway Traffic Assignment (Last Edit August 26, 2005) This chapter focuses on the Roadway Traffic Assignment module of the Dallas-Fort Worth Regional Travel Model (DFWRTM). Based on the input vehicle
Roadway Traffic Assignment (Last Edit August 26, 2005) This chapter focuses on the Roadway Traffic Assignment module of the Dallas-Fort Worth Regional Travel Model (DFWRTM). Based on the input vehicle
SHIFT Model Training: Scenario 5A
 SHIFT Model Training: Scenario 5A ITTS Freight in the Southeast Conference 2017 Liza Amar February 15 th 2017 Overview SHIFT Model Scope Model Scenario Examples Coding the Scenario Running the Model Evaluating
The Rhode Island Statewide Travel Demand Forecasting Model Sudhir Murthy and Rajesh Salem Louis Berger & Associates, Inc. INTRODUCTION.
 The Rhode Island Statewide Travel Demand Forecasting Model Sudhir Murthy and Rajesh Salem Louis Berger & Associates, Inc. INTRODUCTION Purpose The Rhode Island Statewide Travel Demand Forecasting Model
VEHICLES MILES TRAVELED (VMT) TRAFFIC IMPACT METRIC
 TRAFFIC IMPACT METRIC") VEHICLES MILES TRAVELED (VMT) TRAFFIC IMPACT METRIC A project-specific quantified analysis of the MGA Campus has been undertaken to compare BAU to the project including the project s VMT reduction program
VEHICLES MILES TRAVELED (VMT) TRAFFIC IMPACT METRIC A project-specific quantified analysis of the MGA Campus has been undertaken to compare BAU to the project including the project s VMT reduction program
Scenario Planning in an Uncertain Future
 Scenario Planning in an Uncertain Future Maren Outwater June 21, 2017 The Next 100 Million People in the U.S. US population growing at higher rate than rest of world s developed nations For transportation
Volume to Capacity Estimation of Signalized Road Networks for Metropolitan Transportation Planning. Hiron Fernando, BSCE. A Thesis CIVIL ENGINEERING
 Volume to Capacity Estimation of Signalized Road Networks for Metropolitan Transportation Planning by Hiron Fernando, BSCE A Thesis In CIVIL ENGINEERING Submitted to the Graduate Faculty of Texas Tech
Smart Growth Impact Fees
 Smart Growth Impact Fees Presentation to National Impact Fee Roundtable October 10, 2008 Deb Galardi, Galardi Consulting Donald Samdahl, Fehr & Peers Smart Growth and Impact Fees Enhanced ability to fund
BOSTON REGION METROPOLITAN PLANNING ORGANIZATION
 PLANNING ORGANIZATIO BOSTON REGION MPO NMETROPOLITAN BOSTON REGION METROPOLITAN PLANNING ORGANIZATION Stephanie Pollack, MassDOT Secretary and CEO and MPO Chair Karl H. Quackenbush, Executive Director,
Tennessee Model Users Group. Organizational Meeting December 2, 2004
 Tennessee Model Users Group Organizational Meeting December 2, 2004 Introduction Steve Allen Transportation Manager 2 Traffic Planning & Statistics Office Planning Division TDOT Education Associate of