A Ten Year Strategic Outlook for the Global Flexible Plastic Packaging Market. Sample pages. Commodity Inside Ltd
|
|
|
- Imogen Wheeler
- 5 years ago
- Views:
Transcription

1 A Ten Year Strategic Outlook for the Global Flexible Plastic Packaging Market Sample pages
2 Chapter 1- Executive summary 1.1 Changes in the global flexible plastic packaging industry 1.2 Cost effectiveness to drive the market in emerging markets 1.3 Trends and developments in flexible plastic packaging industry 1.4 End use sector dynamics 1.5 Methodology Chapter 2- North America 2.1 Market review 2.2 Outlook 2.3 Major companies 2.4 Salient statistics Chapter 3- Europe 3.1 Market review 3.2 Outlook 3.3 Major companies 3.4 Salient statistics Chapter 4- Latin America 4.1 Market review 4.2 Outlook 4.3 Major companies 4.4 Salient statistics 1
3 Chapter 5- Asia 5.1 Market review 5.2 Outlook 5.3 Major companies 5.4 Salient statistics Chapter 6- Middle East and Africa 6.1 Market review 6.2 Outlook 6.3 Major companies 6.4 Salient statistics Chapter 7- Oceania 7.1 Market review 7.2 Outlook 7.3 Major companies 7.4 Salient statistics Chapter 8- Trends and developments 8.1 Increased substitutions 8.2 Pouch a leading driver 8.3 Macroeconomic indicators 8.4 Population growth 8.5 Support from end use sectors 8.6 Emerging markets 8.7 The changing consumer behaviour 8.8 Cost effectiveness and the rising middle class 8.9 Rigid plastic packaging versus flexible plastic packaging 2
4 8.10 Brands and brand owners 8.11 Environmental impact 8.12 Plastic bags 8.13 Excessive packaging Chapter 9- End use sectors 9.1 Food 9.2 Beverage 9.3 Personal care 9.4 Homecare 9.5 Healthcare 9.6 Bulk packaging 9.7 Others Appendix A Flexible plastic packaging market by material type A.1 Biaxially Oriented Polypropylene (BOPP) A.2 Casting Polypropylene film (CPP) A.3 Polyamide (PA) A.4 Polyethylene (PE) A.5 Ethylene vinyl alcohol (EVOH) A.6 Others Appendix B- Country profiles B.1 Algeria B.2 Argentina B.3 Australia B.4 Austria B.5 Belgium B.6 Brazil B.7 Canada 3
5 B.8 Chile B.9 China B.10 Colombia B.11 Czech Republic B.12 Denmark B.13 Egypt B.14 France B.15 Germany B.16 Hungary B.17 India B.18 Indonesia B.19 Iran B.20 Iraq B.21 Ireland B.22 Italy B.23 Japan B.24 Malaysia B.25 Mexico B.26 Morocco B.27 Netherlands B.28 New Zealand B.29 Nigeria B.30 Pakistan B.31 Philippines B.32 Poland B.33 Romania B.34 Russia B.35 Saudi Arabia B.36 Singapore B.37 South Africa 4
6 B.38 South Korea B.39 Spain B.40 Sweden B.41 Switzerland B.42 Taiwan B.43 Thailand B.44 Turkey B.45 UAE B.46 United Kingdom B.47 Ukraine B.48 USA B.49 Venezuela B.50 Vietnam 5
7 List of tables Table 1.1: Global flexible plastic packaging consumption by region (million tonnes, % change) Table 1.2: Global flexible plastic packaging consumption by region ($ billions) Table 1.3: Top ten major consumers of flexible plastic packaging in the world (million Table 1.4: Global flexible plastic packaging demand by seven end use sectors (million Table 1.5: Global flexible plastic packaging demand by seven end use sectors ($ billions) Table 1.6: Global flexible plastic packaging consumption segmentation by materials types (million Table 2.1: North American flexible plastic packaging demand (million tonnes, % change) Table 2.2: North American flexible plastic packaging demand ($ billion, % change) Table 2.3: North American flexible plastic packaging demand by country (million Table 2.4: North American flexible plastic packaging demand by country (% year-on-year growth) Table 2.5: Real GDP growth in North America by country (%) Table 2.6: Real per capita GDP growth in North America by country (%) Table 2.7: Population growth in North America by country (%) Table 3.1: European flexible plastic packaging demand (million tonnes, % change) Table 3.2: European flexible plastic packaging demand ($ billion, % change) Table 3.3: European flexible plastic packaging demand by country (million Table 3.4: European flexible plastic packaging demand by country (% year-on-year growth) Table 3.5: Real GDP growth in selected countries in Europe (%) Table 3.6: Real per capita GDP growth in selected countries in Europe (%) 6
8 Table 3.7: Population growth in selected countries in Europe (%) Table 4.1: Latin American flexible plastic packaging demand (million tonnes, % change) Table 4.2: Latin American flexible plastic packaging demand ($ billion, % change) Table 4.3: Latin American flexible plastic packaging demand by country (million Table 4.4: Latin American flexible plastic packaging demand by country (% year-on-year growth) Table 4.5: Real GDP growth in selected countries in Latin America (%) Table 4.6: Real per capita GDP growth in selected countries in Latin America (%) Table 4.7: Population growth in selected countries in Latin America (%) Table 5.1: Asian flexible plastic packaging demand (million tonnes, % change) Table 5.2: Asian flexible plastic packaging demand ($ billion, % change) Table 5.3: Asian flexible plastic packaging demand by country (million Table 5.4: Asian flexible plastic packaging demand by country (% year-on-year growth) Table 5.5: Real GDP growth in selected countries in Asia (%) Table 5.6: Real per capita GDP growth in selected countries in Asia (%) Table 5.7: Population growth in selected countries in Asia (%) Table 6.1: Middle Eastern and African flexible plastic packaging demand (million tonnes, % change) Table 6.2: Middle Eastern and African flexible plastic packaging demand ($ billion, % change) Table 6.3: Middle Eastern and African flexible plastic packaging demand by country (million Table 6.4: Middle Eastern and African flexible plastic packaging demand by country (% year-on-year growth) Table 6.5: Real GDP growth in selected countries in Middle East and Africa (%) 7
9 Table 6.6: Real per capita GDP growth in selected countries in Middle East and Africa (%) Table 6.7: Population growth in selected countries in Middle East and Africa (%) Table 7.1: Oceania flexible plastic packaging demand (million tonnes, % change) Table 7.2: Oceania flexible plastic packaging demand ($ billion, % change) Table 7.3: Oceania flexible plastic packaging demand by country (million Table 7.4: Oceania flexible plastic packaging demand by country (% year-on-year growth) Table 7.5: Real GDP growth in selected countries in Oceania (%) Table 7.6: Real per capita GDP growth in selected countries in Oceania (%) Table 7.7: Population growth in selected countries in Oceania (%) Table 9.1: Global flexible plastic packaging consumption by seven end use sectors ( Table 9.2: Global flexible plastic packaging consumption by seven end use sectors ($ billions) Table 9.3: Global flexible plastic packaging consumption in the food sector (million Table 9.4: Global flexible plastic packaging consumption in the food sector ($ billions) Table 9.5: Global flexible plastic packaging consumption in the healthcare sector (million Table 9.6: Global flexible plastic packaging consumption in the healthcare sector ($ billions) Table 9.7: Global flexible plastic packaging consumption in the beverage sector (million Table 9.8: Global flexible plastic packaging consumption in the beverage sector ($ billions) Table 9.9: Global flexible plastic packaging consumption in the personal care sector (million Table 9.10: Global flexible plastic packaging consumption in the personal care sector ($ billions) Table 9.11: Global flexible plastic packaging consumption in the bulk packaging sector (million 8
10 Table 9.12: Global flexible plastic packaging consumption in the bulk packaging sector ($ billions) Table 9.13: Global flexible plastic packaging consumption in the Others sector (million Table 9.14: Global flexible plastic packaging consumption in the Others sector ($ billions) Table A.1: Global flexible plastic packaging demand by BOPP (million tonnes, % change) Table A.2: Global flexible plastic packaging demand by CPP (million tonnes, % change) Table A.3: Global flexible plastic packaging demand by PA (million tonnes, % change) Table A.4: Global flexible plastic packaging demand by PE (million tonnes, % change) Table A.5: Global flexible plastic packaging demand by EVOH (million tonnes, % change) Table A.6: Global flexible plastic packaging demand by others (million tonnes, % change) List of figures Figure 1.1: Global flexible plastic packaging consumption by region (million Figure 1.2: Global flexible plastic packaging consumption by region ($ billions) Figure 1.3: Flexible plastic packaging consumption in top 5 countries (million Figure 1.4: Flexible plastic packaging consumption in selected countries in emerging markets (million Figure 1.5: Global flexible plastic packaging demand by seven end use sectors (million Figure 1.6: Global flexible plastic packaging demand by seven end use sectors ($ billions) Figure 1.7: Global flexible plastic packaging consumption by materials types (million Figure 2.1: North American flexible plastic packaging demand (million Figure 2.2: North American flexible plastic packaging demand share in the world (% share) Figure 2.3: North American flexible plastic packaging demand ($ billions) 9
11 Figure 2.4: Flexible plastic packaging by country in North America (million Figure 3.1: European flexible plastic packaging demand (million Figure 3.2: European flexible plastic packaging demand share in the world (% share) Figure 3.3: European flexible plastic packaging demand ($ billions) Figure 3.4: Top five consumers of flexible plastic packaging in Europe (million Figure 4.1: Latin American flexible plastic packaging demand (million Figure 4.2: Latin American flexible plastic packaging demand share in the world (% share) Figure 4.3: Latin American flexible plastic packaging demand ($ billions) Figure 4.4: Top five consumers of flexible plastic packaging in Latin America (million Figure 5.1: Asian flexible plastic packaging demand (million Figure 5.2: Asian flexible plastic packaging demand share in the world (% share) Figure 5.3: Asian flexible plastic packaging demand ($ billions) Figure 5.4: Top five consumers of flexible plastic packaging in Asia (million Figure 6.1: Middle Eastern and African flexible plastic packaging demand (million Figure 6.2: Middle Eastern and African flexible plastic packaging demand share in the world (% share) Figure 6.3: Middle Eastern and African flexible plastic packaging demand ($ billions) Figure 6.4: Top five consumers of flexible plastic packaging in Middle East and Africa (million Figure 7.1: Oceania flexible plastic packaging demand (million Figure 7.2: Oceania flexible plastic packaging demand share in the world (% share) Figure 7.3: Oceania flexible plastic packaging demand ($ billions) Figure 7.4: Flexible plastic packaging by country in Oceania (million 10
12 Figure 9.1: Global flexible plastic packaging consumption by seven end use sectors ( Figure 9.2: Global flexible plastic packaging consumption by seven end use sectors ($ billions) Figure 9.3: Global flexible plastic packaging consumption in the food sector (million Figure 9.4: Global flexible plastic packaging consumption in the food sector ($ billions) Figure 9.5: Global flexible plastic packaging consumption in the healthcare sector (million Figure 9.6: Global flexible plastic packaging consumption in the healthcare sector ($ billions) Figure 9.7: Global flexible plastic packaging consumption in the beverage sector (million Figure 9.8: Global flexible plastic packaging consumption in the beverage sector ($ billions) Figure 9.9: Global flexible plastic packaging consumption in the personal care sector (million Figure 9.10: Global flexible plastic packaging consumption in the personal care sector ($ billions) Figure 9.11: Global flexible plastic packaging consumption in the bulk packaging sector (million Figure 9.12: Global flexible plastic packaging consumption in the bulk packaging sector ($ billions) Figure 9.13: Global flexible plastic packaging consumption in the others sector (million Figure 9.14: Global flexible plastic packaging consumption in the others sector ($ billions) Figure A.1: Global flexible plastic packaging demand by BOPP (million tonnes, % change) Figure A.2: Global flexible plastic packaging demand by CPP (million tonnes, % change) Figure A.3: Global flexible plastic packaging demand by PA (million tonnes, % change) Figure A.4: Global flexible plastic packaging demand by PE (million tonnes, % change) Figure A.5: Global flexible plastic packaging demand by EVOH (million tonnes, % change) Figure A.6: Global flexible plastic packaging demand by others (million tonnes, % change) 11
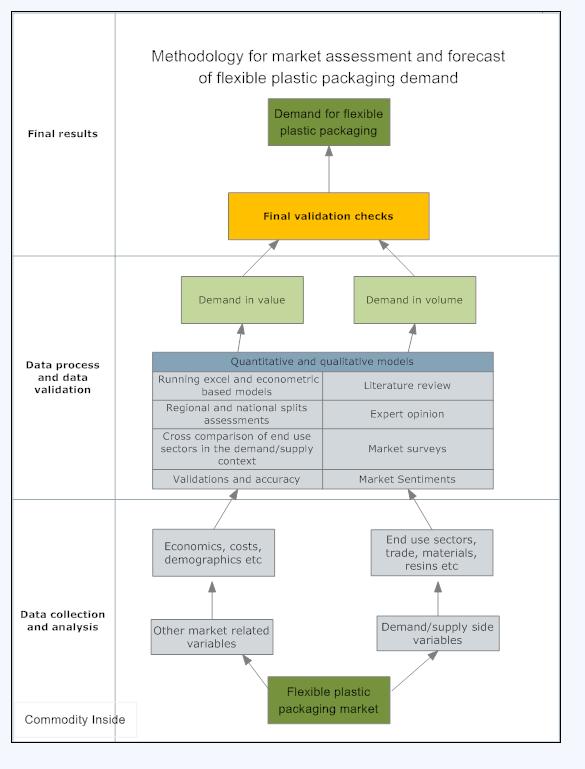
13 1.6 Methodology We have used a broad range of primary and secondary data to assess the market for the flexible plastic packaging in both volume and value terms as well as its end use markets. The starting point of our research was employing a literature review and extensive market research where we used a number of external sources for instance national and international industry associations, company reports and data, experts opinions, trade statistics, end use sectors dynamics, industry news, policy documents, government bodies etc. We have then incorporated all our findings into our proprietary detailed excel based model which encompassed the whole world by regions and important countries. We have developed numerous validation tools which continuously crossed checked the robustness of our historical data ad forecasts. For our market forecasts, we have developed excel based forecast model which was underpinned by an econometric model. We have considered a number of variables in our forecasts including GDP, Population, GDP per capita income, urbanisation etc. In our forecast we have also used SWOT analysis to understand the impact of various factors influencing the growth of the rigid plastic packaging industry. Both our historical and forecast data have also been crossed checked in the context of upstream (plastic production and plastic substitutes; various packaging materials such as rigid plastic packaging, paper packaging, glass packaging, metal packaging etc) and downstream (food, beverages, household, healthcare, personal care etc) industries. 12
14 13
15 6. Middle East and Africa Table 6.1: Middle East and Africa flexible plastic packaging demand (million tonnes, % change) Demand % Change 6.0% 6.5% 6.7% 7.0% 7.3% 7.4% 7.6% 7.5% 7.4% 7.1% 6.8% 6.5% Global Share Figure 6.1: Middle East and Africa flexible plastic packaging demand (million Demand Figure 6.2: Middle East and Africa flexible plastic packaging demand share in the world (% share) Demand 7% 6% 6% 6% 6% 6% 5% 5% 5%
16 Table 6.2: Middle East and Africa flexible plastic packaging demand ($ billion, % change) Demand % Change Figure 6.3: Middle East and Africa flexible plastic packaging demand ($ billions) Demand 9,000 8,000 7,000 6,000 5,000 4,000 3,000 2,000 1,
17 6.1. Market review We assess that the Middle East & African Flexible plastic Packaging Market was around 1.08 tonnes in 2014, which registered growth of 6% year-on-year. Due to growing economic growth and improvement in transport and distribution infrastructure, demand for flexible plastic packaging has been on the rise as well as multinational brand owners are exploring the potential for local packaged products to satisfy the region s expanding needs. Currently the top ten countries in the region are taking into account more than half of the total regional demand. However, per capita consumption of flexible plastic packaging in these top ten countries is still lower than the average consumption in developed countries. This opens a wide range of opportunities for both regional and international packaging companies to explore the market. The region has been dominated by major regional suppliers of flexible plastic packaging producers, while the presence of leading international is almost negligible. In GCC, majority of manufacturers and convertors are based in the UAE which satisfy demand for both domestic and regional consumers. The free trade zones, proximity to the region through ports and friendly government policies, UAE is witnessing high foreign direct investment. 16
18 6.2. Outlook Population growth is expected to remain the highest in Africa compared to other regions during the forecast period. We are also expecting that infrastructure will also see significant developments over the forecast period which will help improve the required distribution infrastructure for the retail sector. Most of the macroeconomic indicators will show moderate improvement over the forecast period. In the backdrop of these favourable indicators, we are expecting increased investment in the flexible plastic packaging market. India has already invested in the production and converting sectors while Chinese are following. Investment in the retail chain is also on the rise which will directly create more demand for low cost and small and medium packaged products. Some large-scale Chinese investment in African land for food production would also result huge demand for the food packaging industry. The per capita consumption of flexible plastic packaging in Africa is very low compared, below of the world average. This is expected to increase over the forecast period, though would still be very low in majority of countries. We are expect that demand will almost double but in quantity terms it would be that much significant on the global scale. 17
19 6.3. Major companies Gulf Pack (Saudi Arabia) 18
20 6.4. Salient statistics Table 6.3: Middle East and Africa flexible plastic packaging demand by country (million Algeria Egypt Iran Iraq Morocco Nigeria Saudi Arabia South Africa UAE Other M&A Table 6.4: Middle East and Africa flexible plastic packaging demand by country (% year-on-year growth) Algeria Egypt Iran Iraq Morocco Nigeria Saudi Arabia South Africa UAE Other M&A 19
21 Table 6.5: Real GDP growth in selected countries in Middle East and Africa by country ( %) Algeria 2.7% 4.1% 4.1% 3.8% 4.1% 4.2% 4.1% 4.0% 3.8% 3.6% 3.9% 4.0% 3.8% Egypt 2.1% 2.6% 2.6% 4.7% 4.6% 4.5% 4.4% 4.4% 4.3% 4.3% 4.3% 4.2% 4.2% Iran -5.8% 1.5% 1.5% 3.1% 3.2% 3.0% 3.0% 3.4% 3.5% 3.5% 3.5% 3.6% 3.6% Iraq 4.0% 1.3% 1.3% 6.8% 6.3% 6.6% 6.5% 6.3% 6.1% 5.9% 5.8% 5.7% 5.6% Morocco 4.4% 2.7% 2.7% 5.2% 5.0% 4.4% 3.8% 3.7% 3.5% 3.5% 3.3% 3.0% 2.9% Nigeria 7.3% 6.8% 6.8% 7.9% 6.6% 6.3% 6.0% 5.7% 5.4% 5.1% 4.9% 4.6% 4.4% Saudi Arabia 3.8% 4.3% 4.3% 4.7% 4.7% 4.5% 4.4% 4.4% 4.4% 4.3% 4.3% 4.4% 4.3% South Africa 1.9% 3.5% 3.8% 3.9% 4.0% 4.3% 4.5% 4.5% 4.5% 4.5% 4.5% 4.5% 4.5% UAE 5.2% 4.3% 4.5% 4.6% 4.7% 4.7% 4.5% 4.3% 3.9% 3.6% 3.5% 3.4% 3.4% Table 6.6: Real per capita GDP growth in selected countries in Middle East and Africa by country ( %) Algeria 0.8% 2.1% 2.1% 1.9% 2.3% 2.4% 2.4% 2.5% 2.3% 2.2% 2.6% 2.8% 2.6% Egypt 0.2% 0.7% 0.7% 2.8% 2.8% 2.7% 2.7% 2.7% 2.7% 2.7% 2.7% 2.7% 2.7% Iran -7.0% 0.3% 0.3% 1.9% 2.0% 1.8% 1.9% 2.3% 2.5% 2.5% 2.6% 2.7% 2.8% Iraq 1.6% -0.9% -0.9% 4.5% 4.1% 4.5% 4.4% 4.2% 4.1% 4.0% 3.9% 3.9% 3.8% Morocco 3.3% 1.6% 1.6% 4.1% 4.0% 3.4% 2.8% 2.8% 2.6% 2.6% 2.4% 2.1% 2.0% Nigeria 4.7% 4.2% 4.2% 5.3% 4.0% 3.7% 3.4% 3.2% 2.9% 2.6% 2.4% 2.2% 2.0% Saudi Arabia 2.2% 2.8% 2.8% 3.2% 3.2% 3.0% 2.9% 3.0% 3.0% 2.9% 2.9% 3.0% 3.0% South Africa 2.3% 4.0% 4.0% 3.8% 3.9% 4.2% 4.4% 4.4% 4.4% 4.4% 4.4% 4.4% 4.4% UAE 2.1% 1.4% 1.8% 2.0% 2.2% 2.3% 2.2% 2.1% 1.9% 1.7% 1.8% 1.9% 2.0% Table 6.7: Population growth in selected countries in Middle East and Africa by country ( %) Algeria 1.9% 1.9% 1.9% 1.8% 1.8% 1.7% 1.6% 1.5% 1.5% 1.4% 1.3% 1.2% 1.2% Egypt 1.9% 1.9% 1.9% 1.8% 1.7% 1.7% 1.7% 1.6% 1.6% 1.5% 1.5% 1.5% 1.4% Iran 1.2% 1.2% 1.2% 1.2% 1.2% 1.1% 1.1% 1.0% 1.0% 0.9% 0.9% 0.8% 0.8% Iraq 2.3% 2.3% 2.3% 2.2% 2.1% 2.1% 2.0% 2.0% 1.9% 1.9% 1.8% 1.8% 1.7% Morocco 1.1% 1.0% 1.0% 1.0% 1.0% 1.0% 0.9% 0.9% 0.9% 0.9% 0.9% 0.8% 0.8% Nigeria 2.5% 2.5% 2.5% 2.5% 2.5% 2.4% 2.4% 2.4% 2.4% 2.4% 2.4% 2.4% 2.4% Saudi Arabia 1.5% 1.5% 1.5% 1.5% 1.5% 1.4% 1.4% 1.4% 1.4% 1.4% 1.3% 1.3% 1.3% South Africa -0.4% -0.5% -0.2% 0.1% 0.1% 0.1% 0.1% 0.1% 0.1% 0.1% 0.1% 0.1% 0.1% UAE 3.0% 2.8% 2.7% 2.6% 2.4% 2.4% 2.3% 2.2% 2.0% 1.8% 1.7% 1.5% 1.4% 20
22 B.38- South Korea South Korea Macroeconomic indicators Real GDP y/y growth (%) 3.0% 3.0% 4.0% 3.8% 3.5% 3.5% 3.2% 3.0% 2.9% 2.8% 2.7% 2.5% 2.6% Real per capita GDP y/y growth (%) 2.8% 2.8% 3.9% 3.6% 3.4% 3.4% 3.1% 3.0% 2.9% 2.8% 2.7% 2.6% 2.7% Population (Million) Population y/y growth (%) 0.2% 0.2% 0.2% 0.1% 0.1% 0.1% 0.1% 0.1% 0.1% 0.0% 0.0% 0.0% 0.0% Flexible plastic packaging indicators Flexible plastic demand (million Y/y growth (%) Regional Share (%) Global Share (%) Demand per person (kg) Demand per person (gram) 21


23 ORDER FORM Why you should buy this report? A full coverage of the global flexible plastic packaging market in both volume and value terms Detailed demand projections of 50 national markets Demand projection are based on both qualitative and quantitative forecast models Analysis of 7 end use sectors Segmentation of demand by 6 material types 119 tables and charts List of national, regional and global companies in the flexible plastic packaging market Analysis are supported by macroeconomic forecasts Detailed country profiles showing various statistics such as macroeconomic indicators, per capita flexible plastic consumption, global and regional position etc Comprehensive statistical appendices and all supportive data in Excel A Ten Year Strategic Outlook for the Global Price Single user licence : 1,695 Departmental licence ( 2-5 users) : 2,995 Global user licence (over 5 users) : 4,995 Total amount Package Company details Name Position Company Address Payment details Credit cards Please debit my credit/ debit card Card number: Valid from: / to: / CSV Number: Card holders name: Signed: Date: Direct Money Transfer Invoice will be sent to the address VAT number (for EU sales only): Pay by link option- We will send you WorldPay s PayByLink . Phone For any questions please contact us at: sales@commodityinside.com or call +44 (0)
Argus Ethylene Annual 2017
 Argus Ethylene Annual 2017 Market Reporting Petrochemicals illuminating the markets Consulting Events Argus Ethylene Annual 2017 Summary Progress to the next peak of the economic cycle, now expected by
Argus Benzene Annual 2017
 Argus Benzene Annual 2017 Petrochemicals illuminating the markets Market Reporting Consulting Events Argus Benzene Annual 2017 Summary The Argus (formerly DeWitt) Benzene Annual has provided an accurate
Nuclear Power Outlook
 Q1 2019 A PUBLICATION OF UXC.COM Nuclear Power Outlook 1501 MACY DRIVE ROSWELL, GA 30076 PH +1 770 642-7745 FX +1 770 643-2954 NOTICE UxC, LLC ( UxC ) shall have title to, ownership of, and all proprietary
OXFORD ECONOMICS. Global Industry Services Overview
 OXFORD ECONOMICS Global Industry Services Overview 2016 ABOUT OXFORD ECONOMICS Oxford Economics is a world leader in global forecasting and quantitative analysis. Our worldwide client base comprises over
HEALTH WEALTH CAREER MERCER LIFE SCIENCES REMUNERATION SURVEY
 HEALTH WEALTH CAREER MERCER LIFE SCIENCES REMUNERATION SURVEY MAKE SMART COMPENSATION DECISIONS BY JOINING THE 2016 MERCER TOTAL REMUNERATION SURVEY FOR THE LIFE SCIENCES SECTOR THE LIFE SCIENCES REMUNERATION
GLOBAL VIDEO-ON- DEMAND (VOD)
") GLOBAL VIDEO-ON- DEMAND (VOD) HOW WORLDWIDE VIEWING HABITS ARE CHANGING IN THE EVOLVING MEDIA LANDSCAPE MARCH 2016 A CHANGING VIDEO-VIEWING LANDSCAPE Nearly two-thirds of global respondents say they watch
GLOBAL VIDEO-ON- DEMAND (VOD) HOW WORLDWIDE VIEWING HABITS ARE CHANGING IN THE EVOLVING MEDIA LANDSCAPE MARCH 2016 A CHANGING VIDEO-VIEWING LANDSCAPE Nearly two-thirds of global respondents say they watch
2015 MERCER LIFE SCIENCES REMUNERATION SURVEY
 2015 MERCER LIFE SCIENCES REMUNERATION SURVEY MAKE SMART COMPENSATION DECISIONS BY JOINING THE 2015 MERCER TOTAL REMUNERATION SURVEY FOR THE LIFE SCIENCES SECTOR THE LIFE SCIENCES REMUNERATION SURVEY PROVIDES
PEFC Global Statistics: SFM & CoC Certification. November 2013
 PEFC Global Statistics: SFM & CoC Certification 1 November 2013 Members; Endorsed Systems; Distribution of Certificates North America 151 million ha 60% TCA 503 CoC Europe 81 million ha 32% TCA 8,389 CoC
Global Gas Deregulation Ed
 Global Gas Deregulation Ed 1 2012 What s in this report and analysis? Overview of the state of the gas sector World Survey of Gas Privatisation and Deregulation Coverage of Gas privatisation and deregulation
Forest Stewardship Council
 Global FSC certified area*: by region Africa CAMEROON CONGO, THE REPUBLIC OF GABON GHANA MOZAMBIQUE NAMIBIA SOUTH AFRICA SWAZILAND TANZANIA, UNITED UGANDA Asia CAMBODIA CHINA INDIA INDONESIA JAPAN KOREA,
BSRIA Air Conditioning Worldwide Market Intelligence
 2014 BSRIA Worldwide Market Intelligence Over 25 years experience researching key markets worldwide market intelligence in 94 Countries integrated technical and market expertise management consultancy
Forest Stewardship Council
 Global FSC Certified Businesses: by country PUERTO RICO 4 FINLAND 83 BAHRAIN GUATEMALA 29 MACEDONIA 3 VIETNAM 004 CONGO, THE REPUBLIC OF 5 NEW ZEALAND 287 KOREA, REPUBLIC OF 243 UGANDA 3 MONACO 4 EGYPT
Cambridge International Examinations Cambridge International Advanced Subsidiary and Advanced Level
 Cambridge International Examinations Cambridge International Advanced Subsidiary and Advanced Level *2029778719-I* GEOGRAPHY 9696/32 Paper 3 Advanced Human Options October/November 2015 INSERT 1 hour 30
enhance your automation thinking
 enhance your automation thinking PLCnext Technology The platform for limitless automation PLCnext Technology Designed by PHOENIX CONTACT In a rapidly changing world, in which more things are now networked
Quarterly Survey of Overseas Subsidiaries (Survey from July to September 2017) ~ Summary of the Results ~
 ~ Summary of the Results ~") Quarterly Survey of Overseas Subsidiaries (Survey from July to September 2017) ~ Summary of the Results ~ December 27, 2017 Research and Statistics Department Ministry of Economy, Trade and Industry 1
Quarterly Survey of Overseas Subsidiaries (Survey from July to September 2017) ~ Summary of the Results ~ December 27, 2017 Research and Statistics Department Ministry of Economy, Trade and Industry 1
Siemens Partner Program
 Siemens Partner Program Factory Automation Partner Strategy for Factory Automation End Customer Focus on core competencies Demand on efficient solutions Certified Partner Added value in solutions and services
THE ECONOMIC IMPACT OF IT, SOFTWARE, AND THE MICROSOFT ECOSYSTEM ON THE GLOBAL ECONOMY
 Addendum THE ECONOMIC IMPACT OF IT, SOFTWARE, AND THE MICROSOFT ECOSYSTEM ON THE GLOBAL ECONOMY METHODOLOGY AND DEFINITIONS Global Headquarters: 5 Speen Street Framingham, MA 01701 USA P.508.872.8200 F.508.935.4015
FSC Facts & Figures. November 15. FSC F FSC A.C. All rights reserved
 FSC Facts & Figures November FSC F00000 FSC A.C. All rights reserved Global FSC certified forest area North America.u of total FSC certified area / 6.8.89 ha D 6 certificates Europe 8u of total FSC certified
WORKFORCE METRICS BENCHMARK REPORT
 WORKFORCE METRICS BENCHMARK REPORT THE MORE YOU KNOW, THE SMARTER YOU WORK As an HR professional, you focus on helping your organization optimize its human capital, but how do you show that achievement?
CSM-PD. pre-heating, degassing and storage system for clean steam generators
 CSM-PD pre-heating, degassing and storage system for clean steam generators Clean steam generator feedwater treatment system To enable clean steam generators to provide the highest quality clean steam
FSC Facts & Figures. September 1, FSC F FSC A.C. All rights reserved
 FSC Facts & Figures September 1, 2017 FSC F0001000 FSC A.C. All rights reserved Global FSC-certified forest area North America 34.9% of total FSC-certified area ( 69,014,953 ha ) 246 certificates Europe
FSC Facts & Figures. October 4, FSC F FSC A.C. All rights reserved
 FSC Facts & Figures October 4, 2017 FSC F0001000 FSC A.C. All rights reserved Global FSC-certified forest area North America 35.2% of total FSC-certified area ( 68,947,375 ha ) 246 certificates Europe
FSC Facts & Figures. December 1, FSC F FSC A.C. All rights reserved
 FSC Facts & Figures December 1, 2017 FSC F0001000 FSC A.C. All rights reserved Global FSC-certified forest area North America 35.7% of total FSC-certified area ( 69,695,913 ha ) 248 certificates Europe
FSC Facts & Figures. November 2, 2018
 FSC Facts & Figures November 2, 2018 Global FSC-certified forest area North America 34.6% of total FSC-certified area ( 69,322,145 ha ) 256 certificates Europe 49.9% of total FSC-certified area ( 100,198,871
FSC Facts & Figures. December 3, 2018
 FSC Facts & Figures December 3, 2018 Global FSC-certified forest area North America 34.5% of total FSC-certified area ( 69,285,190 ha ) 253 certificates Europe 50% of total FSC-certified area ( 100,482,414
FSC Facts & Figures. June 1, 2018
 FSC Facts & Figures June 1, 2018 Global FSC-certified forest area North America 34.6% of total FSC-certified area ( 69,460,004 ha ) 242 certificates Europe 49.4% of total FSC-certified area ( 99,068,686
Global Ethylene Vinyl Acetate(EVA) Market Study ( )
 Market Study ( )") Global Ethylene Vinyl Acetate(EVA) Market Study (2014 2025) Table of Contents 1. INTRODUCTION 1.1. Introduction to Ethylene Vinyl Acetate Market Product Description Materials, Grades & Properties Industry
Global Ethylene Vinyl Acetate(EVA) Market Study (2014 2025) Table of Contents 1. INTRODUCTION 1.1. Introduction to Ethylene Vinyl Acetate Market Product Description Materials, Grades & Properties Industry
FSC Facts & Figures. December 1, FSC F FSC A.C. All rights reserved
 FSC Facts & Figures December, 0 FSC F00000 FSC A.C. All rights reserved Global FSC certified forest area North America.9v of total FSC certified area m 67::08 ha I 47 certificates Europe 47.v of total
FSC Facts & Figures. September 6, 2018
 FSC Facts & Figures September 6, 2018 Global FSC-certified forest area North America 34.5% of total FSC-certified area ( 69,584,479 ha ) 253 certificates Europe 49.4% of total FSC-certified area ( 99,747,108
FSC Facts & Figures. August 1, 2018
 FSC Facts & Figures August 1, 2018 Global FSC-certified forest area North America 34.6% of total FSC-certified area ( 69,481,877 ha ) 253 certificates Europe 49.4% of total FSC-certified area ( 99,104,573
FSC Facts & Figures. January 3, FSC F FSC A.C. All rights reserved
 FSC Facts & Figures January 3, 2018 FSC F0001000 FSC A.C. All rights reserved Global FSC-certified forest area North America 34.7% of total FSC-certified area ( 69,082,443 ha ) 245 certificates Europe
FSC Facts & Figures. February 9, FSC F FSC A.C. All rights reserved
 FSC Facts & Figures February 9, 2018 FSC F0001000 FSC A.C. All rights reserved Global FSC-certified forest area North America 34.5% of total FSC-certified area ( 68,976,317 ha ) 243 certificates Europe
FSC Facts & Figures. April 3, FSC F FSC A.C. All rights reserved
 FSC Facts & Figures April 3, 2018 FSC F0001000 FSC A.C. All rights reserved Global FSC-certified forest area North America 34.7% of total FSC-certified area ( 69,167,742 ha ) 242 certificates Europe 49.3%
FSC Facts & Figures. January 6, FSC F FSC A.C. All rights reserved
 FSC Facts & Figures January 6, 2017 FSC F000100 0 FSC A.C. All rights reserved Global FSC-certified forest area North America 35.3% of total FSC-certified area ( 69,212,841 ha ) 248 certificates Europe
FSC Facts & Figures. February 1, FSC F FSC A.C. All rights reserved
 FSC Facts & Figures February 1, 2017 FSC F000100 0 FSC A.C. All rights reserved Global FSC-certified forest area North America 35.8% of total FSC-certified area ( 69,590,919 ha ) 249 certificates Europe
FSC Facts & Figures. March 13, FSC F FSC A.C. All rights reserved
 FSC Facts & Figures March 13, 2017 FSC F000100 0 FSC A.C. All rights reserved Global FSC-certified forest area North America 35.6% of total FSC-certified area ( 69,049,912 ha ) 248 certificates Europe
Oil and Petrochemical overview. solutions for your steam and condensate system
 o i l a n d p e t r o c h e m i c a l o v e r v i e w Oil and Petrochemical overview solutions for your steam and condensate system Understanding your steam and condensate system At Spirax Sarco we understand
Spirax SafeBloc TM. double block and bleed bellows sealed stop valve
 Spirax SafeBloc TM double block and bleed bellows sealed stop Spirax SafeBloc TM a single solution for safe double isolation The Spirax SafeBloc TM is a safe isolation solution, with a unique space-saving
SAMPLE. Reference Code: GDAE6535IDB. Publication Date: May 2015
 Hydropower in Austria, Market Outlook to 2025, Update 2015 Capacity, Generation, Levelized Cost of Energy (LCOE), Investment Trends, Regulations and Company Profiles Reference Code: GDAE6535IDB Publication
The Future of Nuclear Power after Fukushima
 The Future of Nuclear Power after Fukushima Thomas Jonter Professor of International Relations Stockholm University Trends Energy consumption map 1 Before Fukushima: Nuclear Renaissance Reasons: The increasingly
Steel Market Research & Consultancy
 Steel Market Research & Consultancy Flat Products Long Products Medium Term Forecast Long Term Forecast Consultancy GFMS: The Leading Provider p.2 Advantages From GFMS Steel Research p.3 GFMS Steel Research
Global Gasoline, Global Condensate and Global Petrochemical Markets to 2020 and How much naphtha will end up in gasoline blending?
 Study Prospectus Nexus - The Interaction Between: Global Gasoline, Global Condensate and Global Petrochemical Markets to 2020 and 2025 Can I export more naphtha? Should I build a splitter? Should I build
FSC Facts & Figures. August 4, FSC F FSC A.C. All rights reserved
 FSC Facts & Figures August 4, 2016 FSC F0001000 FSC A.C. All rights reserved Global FSC-certified forest area North America 35.9% of total FSC-certified area ( 68,725,419 ha ) 249 certificates Europe 47.7%
FSC Facts & Figures. September 12, FSC F FSC A.C. All rights reserved
 FSC Facts & Figures September 12, 2016 FSC F0001000 FSC A.C. All rights reserved Global FSC-certified forest area North America 35.8% of total FSC-certified area ( 68,217,276 ha ) 243 certificates Europe
Cotton: World Markets and Trade
 United States Department of Agriculture Foreign Agricultural Service Circular Series FOP - December Cotton: World Markets and Trade Unprecedented Daily Price Volatility Rules the Market Now Daily NY Nearby
FOR INTERNAL PURPOSES ONLY INDIA MARKET REPORT GLOBAL OPPORTUNITIES IN PACKAGING ( ) (NPeS7. lfvoma. ft PrintPromotion PRODUCED BY
 (NPeS7. lfvoma. ft PrintPromotion PRODUCED BY") FOR INTERNAL PURPOSES ONLY INDIA MARKET REPORT GLOBAL OPPORTUNITIES IN PACKAGING (2011-2020) (NPeS7 lfvoma ft PrintPromotion -- PRODUCED BY Table of contents 7 13 23 40 49 56 63 107 115 137 143 Executive
FOR INTERNAL PURPOSES ONLY INDIA MARKET REPORT GLOBAL OPPORTUNITIES IN PACKAGING (2011-2020) (NPeS7 lfvoma ft PrintPromotion -- PRODUCED BY Table of contents 7 13 23 40 49 56 63 107 115 137 143 Executive
Solution Partner Program Global Perspective
 Solution Partner Program Global Perspective SPACe 2012 Siemens Process Automation Conference Business Development Solution Partner Program Copyright Siemens AG 2012. All rights reserved Solution Partner
IMPROVING SALES EFFECTIVENESS. John Kieffer Business Transformation Director
 IMPROVING SALES EFFECTIVENESS John Kieffer Business Transformation Director Working from a Position of Leadership and Growth Global Sales: $26.6 Billion (65% International) Net Income: $4.0 Billion R&D
Reference Code: GDAE6521IDB. Publication Date: March 2015
 Hydro Power in France, Market Outlook to 2025, Update 2015 Capacity, Generation, Levelized Cost of Energy (LCOE), Investment Trends, Regulations and Company Profiles Reference Code: GDAE6521IDB Publication
Certification in Central and Eastern Europe
 Certification in Central and Eastern Europe Timber Regulation Enforcement Exchange Vienna, 16 September 2015 Dirk Teegelbekkers General Secretary PEFC Germany www.pefc.org www.pefc.org Overview Introduction
Cotton: World Markets and Trade
 United States Department of Agriculture Foreign Agricultural Service Cotton: World Markets and Trade May Global Consumption Rises Above Production, Fall USDA s initial forecast for / shows world consumption
August Factors that impact how we grocery shop worldwide
 August 2012 Factors that impact how we grocery shop worldwide Factors impacting grocery shopping worldwide 85% of consumers worldwide say rising food prices are impacting product choice The influence of
Pyramid Research. Publisher Sample
 Pyramid Research http://www.marketresearch.com/pyamidresearch-v4002/ Publisher Sample Phone: 800.298.5699 (US) or +1.240.747.3093 or +1.240.747.3093 (Int'l) Hours: Monday - Thursday: 5:30am - 6:30pm EST
Findings from FAOSTAT user questionnaire surveys
 Joint FAO/UNECE Working party On Forest Economics and Statistics 28 th session, Geneva, 2-4 May 2006 Agenda Item 6 Dissemination of outputs During the last decade FAO has carried out two FAO forest product
OTS. FEEL GOODS. COMPANY PROFILE
 OTS. FEEL GOODS. COMPANY PROFILE CONTENTS 4 ABOUT US 6 TRANSPORT 8 MISSION 10 VISION 12 SERVICES 14 SALES AND CUSTOMER SERVICE 16 IMPORT / EXPORT AND CROSSTRADE 18 LOGISTICS 20 CUSTOMS 22 PROJECT DIVISION
SAMPLE. Reference Code: GDAE6529IDB. Publication Date: April 2015
 Hydropower in Indonesia, Market Outlook to 2025, Update 2015 Capacity, Generation, Levelized Cost of Energy (LCOE), Investment Trends, Regulations and Company Profiles Reference Code: GDAE6529IDB Publication
International management system: ISO on environmental management
 International management system: ISO 14000 on environmental management Introduction In response to the growing interest from businesses in environmental standards, the International Standardization Institute,
Global Sugar Consumption Expands While Production Stagnates
 United States Department of Agriculture Foreign Agricultural Service Sugar: World Markets and Trade Global Sugar Consumption Expands While Production Stagnates 180 Million Metric Tons, Raw Value 170 160
Worksheet for world asbestos consumption calculations
 Worksheet for world asbestos consumption calculations Apparent consumption calculation made using production data available on 6-8-2015 from the USGS and trade data available on 6-5-2015 from the United
Forecast Million Lbs. % Change 1. Carryin August 1, ,677, ,001, %
 Almond Industry Position Report FEBRUARY 2018 2017-2018 Crop Year Salable Forecast Million Lbs. 2017-2018 08/01-02/28 Kernel Wt. 2016-2017 08/01-02/28 Kernel Wt. % Change 1. Carryin August 1, 2017 398.7
Cross-border Executive Search to large and small corporations through personalized and flexible services
 Cross-border Executive Search to large and small corporations through personalized and flexible services In-depth local knowledge of each job market as well as reliable information on compensation, industry
Total Net Exports 105, , , , , , , , , , ,153
 Wheat Trade Net Exporters Argentina 7,495 6,454 7,206 6,988 7,144 7,205 7,343 7,492 7,737 7,766 7,711 Australia 18,900 20,066 20,021 20,047 20,254 20,486 20,827 21,027 21,262 21,494 21,619 Canada 17,600
PEFC Global Statistics: SFM & CoC Certification.
 PEFC Global Statistics: SFM & CoC Certification Data: Sep 2017 www.pefc.org Members, Endorsed Systems; Distribution of Certificates North America 164.4 million ha 54.1% TCA 451 CoC Europe 95.9 million
International Energy Outlook 2011
 International Energy Outlook 211 Center for Strategic and International Studies, Acting Administrator September 19, 211 Washington, DC U.S. Energy Information Administration Independent Statistics & Analysis
Pyramid Research. Publisher Sample
 Pyramid Research http://www.marketresearch.com/pyamidresearch-v4002/ Publisher Sample Phone: 800.298.5699 (US) or +1.240.747.3093 or +1.240.747.3093 (Int'l) Hours: Monday - Thursday: 5:30am - 6:30pm EST
Global Exhibition Barometer 16 th edition (January 2016)
") Global Exhibition Barometer 16 th edition (January 2016) A UFI report based on the results of a survey conducted in December 2015 Global US Mexico Central & South America Brazil Southern Africa Table of
Global Exhibition Barometer 16 th edition (January 2016) A UFI report based on the results of a survey conducted in December 2015 Global US Mexico Central & South America Brazil Southern Africa Table of
Strategy and Outlook Annual General Meeting. Hubert Sagnières May 5, 2011
 Strategy and Outlook 2011 Annual General Meeting Hubert Sagnières May 5, 2011 The Optical Market in 2011 A still significantly under-penetrated market A high ramp-up potential A growing, profitable mid-range
KAEFER International Technical Trainee Programmes
 KAEFER International Technical Trainee Programmes About KAEFER The KAEFER Group is currently the world s largest independent supplier of systems in the field of thermal insulation, as well as noise and
International Business Parcels Rate card
 International Business Parcels Rate card Tracked Effective from 3rd July 2017 Standard Tracked Tracked Signed Standard 1 Contents International Business Parcels services... 3 International Tracked... 4
Global Smart Greenhouse Market Insights, Forecast to 2025
 Report Information More information from: https://www.wiseguyreports.com/reports/3717623-global-smart-greenhouse-market-insights-forecastto-2025 Global Smart Greenhouse Market Insights, Forecast to 2025
Forecast Million Lbs. % Change 1. Carryin August 1, ,677, ,001, % 45.0
 Almond Industry Position Report JANUARY 2018 2017-2018 Crop Year Salable Forecast Million Lbs. 2017-2018 08/01-01/31 Kernel Wt. 2016-2017 08/01-01/31 Kernel Wt. % Change 1. Carryin August 1, 2017 398.7
Market situation Cereals. AGRI C 5 Advisory Group on Cereals, Oilseeds and Proteins 30 March 2012
 Market situation Cereals AGRI C 5 Advisory Group on Cereals, Oilseeds and Proteins 30 March 2012 World cereal balance : IGC 1000 900 World Ending Stocks of which 8 major exporters World Production World
MERCER EXECUTIVE REMUNERATION GUIDE THE KEY TO DESIGNING COMPETITIVE EXECUTIVE REMUNERATION IN THE MIDDLE EAST
 MERCER EXECUTIVE REMUNERATION GUIDE THE KEY TO DESIGNING COMPETITIVE EXECUTIVE REMUNERATION IN THE MIDDLE EAST CONSIDER THESE QUESTIONS Do you have an easy-to-use source for comparing compensation and
Global Citric Acid Market Study ( )
") Global Market Study (2014 2025) Table of Contents 1. INTRODUCTION 1.1. Introduction to Market Product Description Materials, Grades & Properties Industry Structure Value Chain Market Dynamics Drivers Restraints
Global Market Study (2014 2025) Table of Contents 1. INTRODUCTION 1.1. Introduction to Market Product Description Materials, Grades & Properties Industry Structure Value Chain Market Dynamics Drivers Restraints
Spirax Sarco. Clean steam overview
 Spirax Sarco Clean steam overview Spirax Sarco - investing in solutions for clean systems Clean steam has been an important part of Spirax Sarco s business since pioneering the development of the BT6,
Population Distribution by Income Tiers, 2001 and 2011
 1 Updated August 13, 2015: This new edition includes corrected estimates for Iceland, Luxembourg, Netherlands and Taiwan, and some related aggregated data. TABLE A1 Distribution by Income Tiers, 2001 and
Asia s Fashion Jewellery & Accessories Fair March Exhibitors Survey Report
 Asia s Fashion Jewellery & Accessories Fair March Exhibitors Survey Report 1 Survey Summary Total number of exhibitors 383 Total number of collected onsite survey 254 Overall onsite survey response rate
CMMI Update. Mary Beth Chrissis, as represented by: Pat O Toole Software Engineering Institute. Pittsburgh, PA May 15, 2008
 Mary Beth Chrissis, as represented by: Pat O Toole Software Engineering Institute Carnegie Mellon University Pittsburgh, PA 15213 May 15, 2008 CMMI Today The CMMI Product Suite was released 1/2002 and
Process Maturity Profile
 Carnegie Mellon University Process Maturity Profile Software CMM 2004 Year End Update March 2005 We could not produce this report without the support of the organizations and lead appraisers who reported
hp hardware support onsite global next day response
 hp care pack hp hardware support onsite technical data hp hardware support onsite global next day response service overview benefits to you service highlights HP s global next day response service provides
Process Maturity Profile
 Carnegie Mellon University Process Maturity Profile Software CMM CBA IPI and SPA Appraisal Results 2002 Year End Update April 2003 We could not produce this report without the support of the organizations
Personal Copy - Not for Distribution
 Personal Copy - Not for Distribution The World Pump Market 2014-2019 Volume I 10 October 2014 support: vwoodward@eif4cast.com European Industrial Forecasting Ltd 2014 Contents - Volume I - Page 1 I INTRODUCTION
Payroll Across Borders
 Payroll Across Borders 2 Question: Are you planning to expand your Does Global Payroll truly exist? business into new global markets? Question: Based on your experience, do you believe that there is a
Our References Outstanding track record of value creation in hundreds of projects globally. Strategy and Marketing Practice
 Our References Outstanding track record of value creation in hundreds of projects globally Strategy and Marketing Practice Our Claim Our mission is a simple, yet challenging one: Maximizing the Value of
Global Food Security Index
 Global Food Security Index Sponsored by 26 September 2012 Agenda Overview Methodology Overall results Results for India Website 2 Overview The Economist Intelligence Unit was commissioned by DuPont to
Manage Centre. Manage your IT operations from a single graphical interface
 Manage Centre Manage your IT operations from a single graphical interface One place where you can see all your technology Technology services are getting more complex all the time. Hybrid IT and cloud
CULTURAL MARKETING HURDLES
 Topic: Marketing & Social Media CULTURAL MARKETING HURDLES In a globalized world products and marketing campaigns have long been crossing national borders. But the differences in the acceptance of online
Global management and control system of automatic doors for BRT systems (Bus Rapid Transit)
") Global management and control of automatic doors for BRT s (Bus Rapid Transit) What is it? How does it work? What does it consist of? It is an integrated of automatic doors for BRT stations that synchronises
Global management and control of automatic doors for BRT s (Bus Rapid Transit) What is it? How does it work? What does it consist of? It is an integrated of automatic doors for BRT stations that synchronises
Developing a Global Workforce January 26, 2012
 Developing a Global Workforce January 26, 2012 Steve Spires Managing Director, Southeast Regional and CT Solutions Kathy Allen Senior Consultant, Learning (c) U.S. BPI Partners, Inc. [32, Q5 FRAMEWORK,
Water Networks Management Optimization. Energy Efficiency, WaterDay Greece, Smart Water. Restricted / Siemens AG All Rights Reserved.
 Water Networks Management Optimization. Energy Efficiency, WaterDay Greece, 2014 Smart Water siemens.com/answers Solution Partner Strategy I IA/DT Customer Solution oriented Focus on Core competencies
Global Polyacrylamide (PAM) Market Study ( )
 Market Study ( )") Global Polyacrylamide (PAM) Market Study (2014 2025) Table of Contents 1. INTRODUCTION 1.1. Introduction to Polyacrylamide (PAM) Market Product Description Materials, Grades & Properties Industry Structure
Global Polyacrylamide (PAM) Market Study (2014 2025) Table of Contents 1. INTRODUCTION 1.1. Introduction to Polyacrylamide (PAM) Market Product Description Materials, Grades & Properties Industry Structure
Cultural Values SELF-ASSESSMENT PROFILE. PREPARED FOR: Jaime Smith January 2017
 Cultural Values SELF-ASSESSMENT PROFILE PREPARED FOR: Jaime Smith January 2017 Contents This Cultural Values Profile identifies your individual orientation on ten cultural value dimensions. Understanding
Process Maturity Profile
 Carnegie Mellon Process Maturity Profile CMMI v1.1 SCAMPI SM v1.1 Class A Appraisal Results 2005 End-Year Update March 2006 We could not produce this report without the support of the organizations and
Development of globally competitive human resources
 Development of globally competitive human resources Nobutaka Nohara Executive Officer, JGC Corporation The 32rd JCCP International Symposium 30 JAN 2014 N1-TP-CS-01-1 Contents I. Outline of JGC Corporation
Energy Efficiency Indicators: The Electric Power Sector
 Energy Efficiency Indicators: 5 Sectors, 5 Challenges Mexico City, Mexico 14-15 March 2011 Energy Efficiency Indicators: The Electric Power Sector Robert Schnapp Head, Coal, Renewables, Electric and Heat
Running an RTB Network Across 10 Markets Publisher Opportunities ATTILA BARTA
 Running an RTB Network Across 10 Markets Publisher Opportunities ATTILA BARTA Head Cadreon PROGRAMMATIC ADVERTISING THE SELLERS PERSPECTIVE The Strengths, Weaknesses, Opportunities and the Pitfalls for
The dynamics of global food and agribusiness
 Welcome to the world of Rabobank! The dynamics of global food and agribusiness Adrie Zwanenberg NUFFIELD Global Head F&A Research 20 February 2006 2 The world of Rabobank Food & agribusiness: a global
SAMPLE. Bracco Imaging S.p.A.Market Share Analysis. Bracco Imaging S.p.A. Market Share Analysis GDME0639CDB / Published January 2013
 Market Share Analysis Reference Code: GDME0639CDB Publication Date: January 2013 GlobalData. This report is a licensed product and is not to be copied, reproduced, shared or resold in any form Page 1 Table
1 Controlling for non-linearities
 1 Controlling for non-linearities Since previous studies have found significant evidence for deaths from natural catastrophes to be non-linearly related to different measures of development (Brooks et
Dentsu Inc. Investor Day Developing our global footprint
 Dentsu Inc. Investor Day Developing our global footprint September 4, 2015 Tim Andree EVP, Member of the Board, Dentsu Inc. Executive Chairman Dentsu Aegis Network Innovating The Way Brands Are Built Dentsu