Florida Logistics Center Market Analysis Update
|
|
|
- Edwina McDonald
- 5 years ago
- Views:
Transcription

1 Florida Logistics Center Market Analysis Update Prepared for: Florida Department of Transportation January 14, 2012 Martin Associates 941 Wheatland Ave., Suite 203 Lancaster, PA (717)
2 TABLE OF CONTENTS I. INTRODUCTION, OVERVIEW AND SUMMARY OF RESULTS... 1 II. FACTORS INFLUENCING UNITED STATES (US) EAST COAST AND US GULF COAST DISTRIBUTION CENTER DEVELOPMENT SHIFTING LOGISTICS PATTERNS IMPLICATIONS OF RECENT FREE TRADE AGREEMENTS FUTURE IMPLICATIONS ON PORTS AND INFRASTRUCTURE III. FLORIDA DISTRIBUTION CENTER MARKET ASSESSMENT TRENDS IN FLORIDA DISTRIBUTION CENTER AND WAREHOUSING ACTIVITY Key Demographics Underlying Distribution Center Development Economic Factors Impacting Locational Decisions IMPLICATIONS OF NATIONAL TRENDS IN THE DEVELOPMENT OF LOGISTICS CENTERS AND DISTRIBUTION CENTERS IN FLORIDA THE IMPORTANCE OF RAIL IN THE SUCCESS OF THE DEVELOPMENT OF LOGISTICS CENTERS SUMMARY OF FACTORS UNDERLYING THE SUCCESS OF DISTRIBUTION CENTER DEVELOPMENT IN FLORIDA IV. DC LOGISTICS COST ANALYSIS TO SERVE FLORIDA POPULATION LOGISTICS COST ANALYSIS TO SERVE THE EXISTING CARGO FLOWS AND LOGISTICS SUPPLY CHAINS IN FLORIDA LOGISTICS COST ANALYSIS TO SERVE THE FLORIDA CONSUMPTION MARKET WITH FLORIDA PORTS AND A NEW LOGISTICS SUPPLY CHAIN V. POTENTIAL DISTRIBUTION CENTER DEMAND/ABSORPTION IN FLORIDA VI. ECONOMIC IMPACT OF DISTRIBUTION ACTIVITY IMPACT DEFINITIONS METHODOLOGY ECONOMIC IMPACTS OF DISTRIBUTION CENTER ACTIVITY VII. SUMMARY OF CONCLUSIONS APPENDIX A - LOCATION OF DISTRIBUTION CENTER ACTIVITY BY INDUSTRY: APPENDIX B INTERMODAL YARD AND LOGISTICS CENTER CASE STUDIES... 69
3 I. Introduction, Overview and Summary of Results Martin Associates was retained by the Florida Department of Transportation (FDOT) to assess the potential of future distribution center (DC) and warehousing activity in Florida to serve the Florida consumer market. The market analysis updates and builds off of many elements contained in the previous study completed by Martin Associates for FDOT (and the Port of Palm Beach) in The update of the previous analysis is necessary given the dynamic changes in the industrial real estate market due to the economic downturn that has occurred since In addition, numerous Florida port developments have been announced and are underway which will ultimately enhance the Florida ports competitive advantage in serving the Florida market. It is to be emphasized that this analysis does not recommend a specific site(s) for potential development of DC activity. Rather, the analysis is structured to assess the competitiveness of each of Florida s key regions in terms of providing logistics services to serve the Florida market. The focus is on the potential to develop logistics centers, which consist of clusters of distribution centers sharing common infrastructure such as intermodal container transfer facilities (ICTF), major highway interchanges, and security and information technologies. The clustering of distribution centers also provides a magnet effect to secure truck and equipment services and availability, and capitalize on the empty backhaul market that characterizes the Florida truck market. However, the analysis is also key in assessing optimal sites for single distribution centers to serve the Florida retail and wholesale consumption markets. Two distribution center/logistics center development scenarios are evaluated. The first scenario consists of the optimal geographic location of a logistics center/distribution center in Florida, given the current logistics supply chains and distribution networks of the retailers/wholesalers now serving the Florida consumption markets. This includes the current system of non-florida ports and import distribution centers now used to serve the Florida consumption markets, and the determination of location (s) that would provide the optimal cost effective site to consolidate Florida distribution centers to serve the State s consumption markets. The second scenario evaluates the optimal combination of a Florida port and distribution center to compete with the current logistics supply chain of serving the Florida consumption markets using non-florida ports and import distribution centers. This assessment is based on interviews with key stakeholders as well as published data. Interviews were conducted with (but not limited to) key shipping lines calling Florida and Atlantic Coast ports, Florida terminal operators, rail service providers, trucking/drayage companies, industrial/commercial real estate developers, land owners, and distribution center operators. In addition to the interview process, data was also collected from Martin Associates in-house data bases, American Association of Port Authorities (AAPA), US Army Corps of Engineers Waterborne Commerce Statistics Center, individual port statistics/port websites, Chain Store Guide, Florida Trade and MARTIN ASSOCIATES Page 1
4 Logistics Study (Commissioned by the Florida Chamber of Commerce Foundation and the Florida Department of Transportation) and the US Maritime Administration. Key findings of this analysis are: The Florida industrial real estate market has suffered dramatically due to the effects of the economic downturn. The Miami market is beginning to show slight signs of activity leading to some stabilization. Vacancy has now reached 7% and specs are beginning to be built again in Miami-Dade County. However, Broward County is recovering more slowly. In South Florida, the availability of larger parcels is limited and retailers interested in larger parcels greater than 250,000 square feet Class A space will be challenged to find such property. The South Florida market, with respect to the retail distribution market, will still compete for accounts up to 300,000 square feet, and maintain that the larger facilities will continue to develop in Central and Northern Florida. The Central Florida market is still sluggish and not expected to rebound until Aside from the absence of new construction, there is a surplus of vacant space in Central Florida, which has the highest vacancy in the state, and an abundance of shuffling is expected to occur as retailers, consolidators and third party logistics providers (3PLs) tweak their supply chains either by consolidating facilities or expanding into new space. In North Florida, Jacksonville is more positioned to serve the North Florida as well as the non-florida Southeast region, and is not viewed as direct competition to South Florida. Few retailers are debating between Jacksonville or Miami site, but more between a Jacksonville and Savannah site. Dynamic changes in the import logistics patterns that have occurred since 2002 to serve the Southeastern, Eastern, Gulf and Midwestern markets have resulted in potential opportunities to grow the role of Florida in the international logistics industry. This includes the development of distribution centers and logistics parks to serve the Florida consumption markets, as well as increasing the role of Florida s ports in attracting imports that are now consumed in Florida, but imported via other non- Florida ports. Growth in Florida s role in the logistics industry role will provide an economic catalyst to create additional logistics industry related employment within the State. In terms of exports, Florida ports compete for the export market that serves Latin America and the Caribbean. While Jacksonville will remain in control of the Puerto Rican market, the South Florida ports will continue to be successful in the Latin American and Caribbean due to the large Latin American business community in South Florida. The Free Trade Agreements (FTAs) recently signed by the US government between Panama and Colombia (as well as South Korea) are expected to bolster export activity through these ports in the coming years. The close-knit community of suppliers to the Caribbean and Latin America are strongly rooted in Miami-Dade County, and relocation to other regions does not appear feasible. Specific factors that appear to be critical in the successful development of distribution centers, and/or logistics centers, which are essentially clusters of MARTIN ASSOCIATES Page 2
5 distribution centers capitalizing on economies of scale in terms of fixed costs (security, utilities, rail and highway infrastructure) include population density; projected growth in population, representing growth in consumption activity; concentration of families representing potential consumption activity; and proximity to major rail and highway infrastructure. Based on the logistics cost analysis, the optimal site location to serve the Florida consumer market, under the current logistics supply chain to serve the Florida consumption market, is the Jacksonville/Duvall County region, followed by a site located in the Orlando/I-4 Corridor. This assumes that the current logistics chain remains intact, and the focus is on the development of a DC/logistics center to serve the Florida consumption market. This cost analysis includes components of lease rate, labor cost, weighted truck cost to serve the Florida consumption base, and the inland cost of truck cargoes destined to Florida from non-florida origins. Assuming a new logistics chain using Florida ports for import, a South Florida DC with a South Florida port provides the lowest logistics cost for Asian imported cargo consumed in Florida (compared to the current system of using non- Florida ports). It is to be emphasized that this analysis focuses only on serving the Florida consumer market, not the Southeast consumer base beyond Florida. All three Florida port ranges South, North and Gulf - can provide a more cost effective routing than the current use of the Port of Savannah and intermodal land bridge routings from the Ports of Los Angeles and Long Beach. It is to be emphasized that development in North and Central Florida under current logistics chains and the potential to attract DC activity based on new import logistics chains can be accomplished simultaneously. Each DC operator or beneficial cargo owner (BCO) will make locational decisions based on their own unique logistics chains. Certain port and DC pairings may be more advantageous for a specific BCO than another. Given future infrastructure improvements such as dredging and on-dock/neardock ICTFs, all port ranges in Florida will have the ability to compete to attract accounts that can serve the Florida consumption market from different DC locations. For example, a retailer that modifies a portion of its logistics supply chain to use Florida ports for a specific line of product, while using non-florida ports for other product lines would maximize its location of a distribution center somewhere between a South Florida Port/DC combination, a Gulf Coast Florida Port/DC location and a Northeastern Florida location. The exact location within Florida, and port used will be driven by the mix of products using Florida ports versus non-florida ports and more northern distribution centers such as in Savannah or Atlanta. In addition, tax incentives will play a further determining factor as to the ultimate locational decision. The Port of Miami s ability to handle a fully-laden vessel in excess of 7,000 TEUS once the channel is deepened to 50 feet will enhance the competitiveness of using a South Florida port and local DC combination. With the use of a deeper draft vessel that will likely be deployed on a first call inbound routing, the cost advantage of the use of a South Florida port and local import DC is enhanced. Miami is currently the MARTIN ASSOCIATES Page 3
6 only Florida port authorized and funded to deepen its channel to 50 ft. The deepening of other ports in Florida, particularly JAXPORT and Port Everglades, as well as Savannah, are currently under review by the US Army Corps of Engineers to determine authorization for a deeper channel. Should these ports succeed in receiving authorization, then the deeper channel at Miami will allow that port and a South Florida distribution center to still remain competitive with the other port ranges in serving the Florida market. With deeper channels at JAXPORT and Port Everglades, these ports would increase their competitive position with respect to Savannah not only in terms of cost savings to serve the Florida consumption market, but also to compete as regional distribution centers for the Southeastern US consumption markets. Ultimately, port investment in Florida is necessary. Specifically, the dredging of the Miami channel to -50 feet, the construction of on-dock rail, and the Port of Miami access tunnel position the Port of Miami to market to carriers the Port s ability to handle a first inbound port call, requiring the 50 foot channel and the on-dock rail to move the containers intermodally. The development of an ICTF at Port Everglades is critical to compete not only with other non-florida ports, but with the development of transshipment ports and off-shore distribution center development in the Caribbean. The deepening of the St. Johns River to a draft adequate to accommodate a first in-bound port call at the JAXPORT marine cargo terminals is necessary in order to maximize the ability of the Port to serve as a Southeastern US distribution hub, and attract cargo activity and distribution center activity that would otherwise move via Savannah. Without deepening the St, John River, and the development of an ICTF, the significant capital investment made by an Asian carry/terminal operator along with JAXPORT s investment will not result in the economic development impact as planned. The location of an ICTF appears to be critical in the establishment of a logistics center (LC). Based on the review of the past successes of LCs, a critical ingredient is the proximity to a major rail Intermodal Container Transfer Facility (ICTF). This suggests that the development of an LC in Florida should consider the proximity to an existing or planned ICTF. Also, ample available land (large parks consist of 1,000 acres or more) to house millions of square feet in DCs, warehouses and other facilities interstate highway access serving regional consumption markets is necessary. An assessment of the demand for retail consumption in Florida indicates that there is potential for an additional 145 million square feet of distribution center space in Florida by This represents a 27% growth over the current 540 million square feet of space in Florida. The incremental demand for new retail DC square footage that will be absorbed in Florida is estimated from the current base of 540 million square feet, assuming a full utilization of the current supply. At this time, while it is difficult to speculate the amount of square footage that will be absorbed by each market as location decisions will be made on a case-by-case basis by DC operators/retailers, it is expected that the South Florida market could absorb 30%-35% of the total 145 million square feet projected through the study period, if the South Florida market can cost effectively compete against North and Central Florida regions. This suggests that by MARTIN ASSOCIATES Page 4
7 2030, demand for distribution center space in South Florida will range between 44 and 50 million square feet, assuming current space is fully utilized. Future locational decisions will consider current and future distribution and logistics plans, and the types of facilities necessary to serve each individual company s needs. The future location of these DCs will be influenced by the cost of available land and lease rates, labor costs, transportation infrastructure and transportation costs to key consuming markets and from key supplying regions and ports. In addition, incentives by county, state and local governments such as tax subsidizations will also be key factors in the ultimate location of a distribution center/logistics center. It is very important to emphasize that the process of the location of distribution center locations should be driven by the private sector. The State should be cautioned against investing or committing infrastructure investment until private sector decisions and commitments are made. Investment in transportation infrastructure to serve specific land sites in the context of build and they will come may lead to inefficient use of State funds. Rather, state infrastructure investments should be developed as part of an incentive package once private sector development has been committed. MARTIN ASSOCIATES Page 5
8 II. Factors Influencing United States (US) East Coast and US Gulf Coast Distribution Center Development Over the past decade, DC growth has flourished in the US Atlantic and US Gulf coast regions. Historically, national distribution activity was concentrated in the Los Angeles/Long Beach area. However, several factors have influenced decisions to locate facilities in other regions. Furthermore, a key driver in the growth of Asian trade at East Coast ports has increased focus on the development of distribution centers by major importers in this area of the country. This trend toward distribution center development has resulted from the desire of the importers to diversify the logistics systems, particularly in light of the 2002 West Coast Port Shutdown, which caused major supply chain disruptions on the key importers and exporters supply chains. Many of these developments have occurred at or near several US East and US Gulf Coast ports. The most notable port-related DC development on the East Coast has occurred at the Port of Savannah. The Georgia Ports Authority has been pursuing a focused DC development strategy since the port attracted K-Mart in the mid-1980s. According to the Port, there is currently over 15 million square feet of retail import DCs in the Savannah area, including Advanced Auto Parts, Target, IKEA, Dollar Tree, Bass Pro Shops, Best Buy, Pier 1 Imports, Lowes, The Home Depot and Wal*Mart. Similarly, the Virginia Port Authority has also been aggressively pursuing the development of distribution centers. Current distribution centers in the Hampton Roads area and the Front Royal area (which is the location of the Virginia Port Authority s inland port) include: Target, Wal*Mart, Cost Plus, Dollar Tree, QVC, The Home Depot at Front Royal, and Family Dollar at Front Royal. Distribution center development is also occurring in the Gulf coast region, specifically Houston. These developments include the Cedar Crossing area site of 4 million square feet (sf) distribution center for Wal*Mart as well as 8,000 acres of available land for future development. Other ports including Charleston, Wilmington (NC), Baltimore and New York are also aggressively pursuing distribution center development. It is important to note that this growth in distribution center development includes the development of various types of centers and warehouses, the size and characteristics of each designed for specific functions within the logistics supply chain including import DCs which are typically the largest DCs and can range in size from 500,000 square feet for specialty retailers to up to 2 million square feet for big box retailers. These facilities handle import containers, and are typically located near-port or served by direct rail from a port terminal. The goods are shipped to regional DCs or depots in the supply chain. Regional DCs (or depots) typically range in size from 100,000 to 300,000 square feet. These DCs receive product from the import DCs and pick and pack merchandise for vans that go directly to the consumer retail outlets. Others such as fulfillment centers are DCs that serve the consumer directly for example, e-retailers such as Amazon.com. MARTIN ASSOCIATES Page 6
9 The balance of this chapter will address in detail the factors contributing to the diversification of supply chains, and how ports and logistics providers are preparing for future growth. 1. Shifting Logistics Patterns Between the mid-1990s and 2002, there was a consolidation of containerized imports through the Ports of Los Angeles and Long Beach. A portion of imports discharged at ports in the Pacific Northwest and Northern California was diverted to the Southern California ports due to infrastructure investments in facilities and services benefiting the Ports of Los Angeles and Long Beach. Ocean carriers and importers sought to lower transportation costs through utilizing new cost-effective operations serving Los Angeles/Long Beach. Cost efficiencies were realized through the development and expansion of distribution centers (DCs) serving the Ports of Los Angeles and Long Beach, as well as the development and expansion of cross-dock operations which resulted in an efficient and lower cost means of transferring cargo between marine containers and 53 ft. domestic containers and railcars. In addition, there were investments being made by the Burlington Northern and Union Pacific railroads to improve rail service between Southern California and the Midwest. Essentially, the importers became dependent upon the San Pedro Bay Ports of Los Angeles and Long Beach as the key entry point for the imported Asian cargo logistics supply chain. With the growing concentration of power by key importers such as Wal*Mart, Target, Cost Plus, etc., these importers were able to demand that the ocean carriers concentrated imported cargo through the San Pedro Bay Ports. No longer were the ocean carriers making the port choice for the importers, as was the case in the early to mid 1990 s. However, between 2002 and 2007 several shocks occurred in the existing shipping logistics patterns of importers that subsequently changed their future shipping logistics patterns. The new shocks include the aftermath of the events of 9/11 regarding national security and import containers, the West Coast port shutdown by the ocean terminal managers during labor negotiations with the International Longshore and Warehouseman Union (ILWU), port capacity issues including shortages of land and labor, rail and truck shortages, high intermodal rates, increasing pressure by state and local governments for green initiatives at the California ports. These factors raised questions as to the dependability of the Southern California ports as the key entry point for the logistics supply chains of the nation s large importers. As a result, these importers began searching for alternatives to the existing logistics patterns, as well as the shifting overseas production centers. An outcome of the shocks identified above has been the increase in all-water services from Asia to other US Atlantic Coast and US Gulf Coast ports. Following the West Coast port shutdown, ocean carriers and importers realized the downside of putting all their eggs in one basket and began to include the US Atlantic and US Gulf Coast ports in their logistics planning. In this way the importers would have a logistics network in place using other ports, other services (routings) of existing ocean carriers, MARTIN ASSOCIATES Page 7
10 railroads, trucking companies, other 3 rd -party logistics providers, etc. In the event of another system shock, the importers would now have alternatives already in place to accommodate a sudden shift in traffic. There are two all-water routings that serve as alternatives to the use of West Coast ports and intermodal land bridge to transport cargo from Asia to the mid-western and East and Gulf Coast consumption markets: the use of the Suez Canal and the use of the Panama Canal. There are advantages and disadvantages to the all water routings to serve the mid-western, East and Gulf Coast markets. The Panama Canal is used for shipping between Eastern Asia and the US Gulf and East Coasts. The existing canal is relatively small and limits the size of vessels now engaged in international trade, which are increasingly being designed larger. The new Panama Canal Locks, with a planned opening in 2014, will be larger and will be able to accommodate the newer ships. An allwater service from Eastern Asia to the US Gulf and East Coasts will increase transit times vis-à-vis a discharge on the West Coast and intermodal move to the eastern half of the US, which is a disadvantage to importers of time sensitive cargo. However, the ocean carriers can internalize what would be the rail revenue of the intermodal move and may be able to offer importers a lower delivered price. An all-water service to the US East and Gulf Coasts from Southern Asia (origins of cargo south of Singapore) would utilize the Suez Canal. The Suez Canal does not have the same physical limitations of the Panama Canal and can accommodate the new larger vessels. A Suez routing offers importers to the Eastern US a quicker transit from India and Southeast Asia as production is now shifting from China to India and Vietnam. To support this shift in production, India is now investing $100 billion in port infrastructure and Vietnam is also increasing terminal development. There are also new direct India-Mediterranean express services in operation. The Mediterranean is also home to transshipment operations, whereby the large container ships transiting the Asia- Mediterranean routing transship containers to smaller vessels at ports in Tunisia, France, and Italy, and the larger vessels return directly to Asia and are not involved in multiple port calls. The smaller vessels then distribute the containers to multiple ports throughout Europe and on to the United States. This implies that the largest container vessels being built may not have to sail directly to the US but may transship their containers to smaller vessels bound for the US. However, transit time to the US Midwest via a Suez routing may be an issue for higher value cargoes. Piracy and political instability along the Suez routing is another concern that may affect routing decisions. United States maritime interests have responded to the shift to and growth in allwater services. Port infrastructure investments have been made on the US East and US Gulf Coasts. There has also been significant growth in distribution centers in the US Gulf and US Atlantic port ranges. Since 2002, the growth in Asian all-water services has increased at most US Atlantic and US Gulf Coast ports. The Ports of Savannah, New York and Norfolk have experienced the most rapid growth in all-water services. Houston has also experienced growth in all-water direct services, although the Asian import volume is relatively small at Houston. Illustrations of the growth in Asian imports at US Atlantic and US Gulf Coast ports are shown in Exhibits 1-3. MARTIN ASSOCIATES Page 8

11 Exhibit 1 - Imported Asian Container Tonnage - US North Atlantic Port Range Source: US Census Bureau, Foreign Trade Division Exhibit 2 - Imported Asian Container Tonnage - US South Atlantic Port Range* Source: US Census Bureau, Foreign Trade Division *Jacksonville is not included in this exhibit due to the fact the port did not handle Asian cargo until 2009, and therefore has insufficient historical Asian trend; South Florida ports include Port Everglades and Port of Miami MARTIN ASSOCIATES Page 9

12 Exhibit 3 - Imported Asian Container Tonnage - US Gulf Port Range Source: US Census Bureau, Foreign Trade Division Exhibits 4 and 5 illustrate that China has been the growing source of imported containerized tonnage. Imports through Other Asia have shown growth as well, but Other Asia has lost market share to China. Exhibit 5 demonstrates the growth in share of China as the source of US imports, and the slowing of this growth in share in the later years of the period. Exhibit 4 - Historical US Container Imports by World Region Source: US Census Bureau, Foreign Trade Division MARTIN ASSOCIATES Page 10

13 Exhibit 5 - Historical World Region Share of US Container Imports Source: US Census Bureau, Foreign Trade Division Based on cost pressures and sourcing diversification, Asian supply sources are shifting south and west into Vietnam and India, favoring a Suez routing, as shown in Exhibit 6. This Exhibit demonstrates that India and Vietnam have been the growing sources of imports into the United States. However, despite the growth rates in imports from other southeastern Asian countries, China remains the dominant supply source of exports to the US. Exhibit 6 - Historical Compounded Annual Growth Rate (CAGR) of Asian Imports by Country of Origin Source: US Census Bureau, Foreign Trade Division MARTIN ASSOCIATES Page 11
14 2. Implications of Recent Free Trade Agreements In 2011, after several years of negotiations, the US government ratified Free Trade Agreements (FTAs) with Panama, Colombia and South Korea. While the details of each FTA differ, they all give US producers much greater access to these markets. In general, tariffs will be eliminated on about 80% of bilateral trade between the US and these countries once the agreements enacted. In addition to this immediate trade liberalization, most remaining tariffs will be gradually phased out over the next five to 15 years. Colombia s largest trading partner is the US, accounting for about one-third of Colombia s merchandise trade. Furthermore, Colombia is already Florida s second largest foreign trading partner and many of the goods that are currently exported will be among those whose tariffs are immediately eliminated. These include fertilizers, machinery and parts, and wood. As shown in Exhibit 7, fertilizer exports have grown dramatically since 2008, and account for over half the exported tonnage to Colombia from Florida ports. Also, machinery has been a stable export commodity over the past five years. In terms of imports, fuel oils account for nearly 95% of the volume imported through Florida ports. Exhibit 7 Colombian Top Import/Export Commodities through Florida Ports (Metric Tons) FL Metric Tons Exported to Colombia Commodity Code and Description Fertilizers , , , Nuclear Reactors, Boilers, Machinery Etc.; Parts 28,843 43,937 57,703 55,284 73, Mineral Fuel, Oil Etc.; Bitumin Subst; Mineral Wax 2,983 1,135 1,389 1,250 40, Vehicles, Except Railway Or Tramway, And Parts Etc 19,240 20,942 23,541 15,823 16, Wood Pulp Etc; Recovd (waste & Scrap) ppr & pprbd 7,571 5,488 14,635 19,269 16, Paper & Paperboard & Articles (inc Papr Pulp Artl) 8,228 8,765 9,315 9,631 13, Electric Machinery Etc; Sound Equip; Tv Equip; Pts 7,935 8,027 11,570 9,369 11, Ores, Slag And Ash 7,462 7,386 12,423 19,377 10, Glass And Glassware 11,536 11,357 13,879 6,005 9, Salt; Sulfur; Earth & Stone; Lime & Cement Plaster 14,986 8,480 9,071 5,992 8,123 Subtotal of top 10 Commodities 108, , , , ,190 All Other Commodities 84, ,255 99,993 70,967 90,017 Total 193, , , , ,207 FL Metric Tons Imported from Colombia Commodity Code and Description Mineral Fuel, Oil Etc.; Bitumin Subst; Mineral Wax 2,546,046 3,529,236 4,572,845 3,458,677 3,637, Ceramic Products 106,686 71,785 60,299 38,263 51, Salt; Sulfur; Earth & Stone; Lime & Cement Plaster 588, ,518 51,376 65,546 28, Plastics And Articles Thereof 26,567 27,191 16,802 16,767 24, Edible Fruit & Nuts; Citrus Fruit Or Melon Peel 9,362 11,407 6,963 9,179 14, Coffee, Tea, Mate & Spices 20,409 24,115 26,873 19,493 13, Prep Vegetables, Fruit, Nuts Or Other Plant Parts 6,651 7,683 7,638 7,553 7, Glass And Glassware 23,983 10,214 10,150 7,687 6, Aluminum And Articles Thereof 27,322 29,956 13,126 6,510 5, Printed Books, Newspapers Etc; Manuscripts Etc 2,580 6,183 4,897 4,851 4,996 Subtotal of top 10 Commodities 3,357,627 4,005,288 4,770,968 3,634,526 3,793,663 All Other Commodities 88,903 70,667 57,562 44,042 52,832 Total 3,446,530 4,075,954 4,828,530 3,678,568 3,846,496 Source: US Census Bureau, Foreign Trade Division MARTIN ASSOCIATES Page 12
15 The Port of Tampa accounts for over 50% of the Florida export trade with Colombia due to the growth in fertilizer volumes in recent years. Meanwhile, the Port of Jacksonville fuel terminals handle the majority of imports from Colombia as demonstrated in Exhibit 8. Exhibit 8 Colombian Import/Export Volumes through Florida Ports (Metric Tons) Colombia Exports by FL Port (Metric Tons) Port Tampa 32,104 66, , , ,081 Port Everglades 52,256 64,267 84,448 83, ,875 Miami 79,048 76,958 90,064 87,998 92,397 Jacksonville 29,322 27,808 40,918 33,251 51,986 Port Canaveral ,828 Subtotal Top 5 Ports 192, , , , ,167 Other FL Ports Total FL Ports 193, , , , ,207 Colombia Imports by FL Port (Metric Tons) Port Jacksonville 1,910,601 3,168,285 4,365,223 3,139,348 3,336,955 Tampa 875, , , , ,151 Port Everglades 250, , , , ,431 Miami 179, ,689 68,837 61,796 91,579 Port Manatee 119,942 47,434 36,952 78,467 43,341 Subtotal Top 5 Ports 3,335,727 3,989,926 4,812,130 3,656,923 3,816,458 Other FL Ports 110,803 86,028 16,400 21,645 30,037 Source: US Census Bureau, Foreign Trade Division Various analyses have been prepared to assess the impact on trade between the US and Colombia after the FTA is in place. Enterprise Florida (eflorida.com) cites the US International Trade Commission (USITC) that US imports would increase by 5.5% annually and exports to Colombia would increase by 13.7%. Looking forward, it is anticipated that Tampa, Port Everglades and Miami are particularly well-positioned as they handle the majority of Florida-Colombia export traffic today and are established ports of call on existing trade lanes. While West Coast States and the automotive industry have dominated many of the headlines surrounding the Free Trade Agreement with South Korea, there will still be several key opportunities for the Florida s exporters once the agreement is implemented. Exhibit 9 illustrates the growth in edible fruits and citrus in This recent uptick in citrus exports will likely be further bolstered by the FTA. Wood pulp and iron and steel, however, still comprise the majority of tonnage exported through Florida ports. In terms of imports, fuel oils account for about 93% of the imports through Florida ports. MARTIN ASSOCIATES Page 13
16 Exhibit 9 South Korean Top Import/Export Commodities through Florida Ports (Metric Tons) FL Metric Tons Exported to South Korea Commodity Code and Description Wood Pulp Etc; Recovd (waste & Scrap) ppr & pprbd 32,992 27,785 32,760 32,298 48, Iron And Steel ,864 68,955 97,234 42, Plastics And Articles Thereof , Edible Fruit & Nuts; Citrus Fruit Or Melon Peel 150 1, , Paper & Paperboard & Articles (inc Papr Pulp Artl) ,769 3, Aluminum And Articles Thereof 1,946 6,206 17,905 5,248 1, Prep Vegetables, Fruit, Nuts Or Other Plant Parts 282 1, , Organic Chemicals Nuclear Reactors, Boilers, Machinery Etc.; Parts Copper And Articles Thereof 1, , Subtotal of top 10 Commodities 37,739 53, , , ,235 All Other Commodities 1,001 1,752 4,052 3,025 4,117 Total 38,739 55, , , ,352 FL Metric Tons Imported from South Korea Commodity Code and Description Mineral Fuel, Oil Etc.; Bitumin Subst; Mineral Wax 36, , , , , Articles Of Iron Or Steel 26,057 13,550 25,393 7,834 22, Paper & Paperboard & Articles (inc Papr Pulp Artl) 14,773 10,482 4,283 3,596 9, Rubber And Articles Thereof 2,998 4,544 4,371 2,953 5, Nuclear Reactors, Boilers, Machinery Etc.; Parts 11,937 15,554 13,313 14,598 5, Electric Machinery Etc; Sound Equip; Tv Equip; Pts 4,845 4,490 2,811 3,391 4, Iron And Steel 22,688 15,891 15,763 11,853 4, Vehicles, Except Railway Or Tramway, And Parts Etc 26,802 22,469 8,673 2,244 2, Plastics And Articles Thereof 2,252 2,205 2,143 1,638 1, Beverages, Spirits And Vinegar ,691 Subtotal of top 10 Commodities 149, , , , ,479 All Other Commodities 4, ,827 40,763 20,748 4,341 Total 153, , , , ,820 Source: US Census Bureau, Foreign Trade Division MARTIN ASSOCIATES Page 14
17 Exhibit 10 shows the distribution of Florida ports in terms of export activity to South Korea. Miami, Jacksonville and Tampa are key exporting ports to South Korea, while Port Everglades accounts for the majority of fuel oil imports via Florida ports. Exhibit 10 South Korean Import/Export Volumes through Florida Ports (Metric Tons) South Korea Exports by FL Port (Metric Tons) Port Miami 14,369 26,316 67,835 71,182 53,186 Jacksonville ,930 20,092 38,147 Tampa 2,641 22,296 44,922 38,368 23,187 Port Everglades 5,422 4,831 12,507 10,858 1,714 West Palm Beach Subtotal Top 5 Ports 22,712 54, , , ,296 Other FL Ports 16,027 1, , Total FL Ports 38,739 55, , , ,352 South Korea Imports by FL Port (Metric Tons) Port Port Everglades 16, , , , ,252 Tampa 46, ,317 75,185 39,300 28,032 Miami 23,621 20,192 18,134 16,463 22,783 Jacksonville 53,922 22,513 14,022 5,196 3,742 Panama City Subtotal Top 5 Ports 140, , , , ,815 Other FL Ports 12,985 7,579 6,041 7,512 5 Total FL Ports 153, , , , ,820 Source: US Census Bureau, Foreign Trade Division While tariffs on fruit will not be completely eliminated, they will be significantly reduced and permit US growers much greater access to what has been a heavily protected Korean industry. Tariffs on orange juice concentrate, on the other hand, will be completely eliminated within five years of implementation of the FTA. Though demand for concentrate has been historically more volatile than that for citrus fruit, the elimination of these barriers will make US concentrate much more affordable relative to Brazilian concentrate, which, according to the USDA, currently satisfies the majority of Korean demand. This will represent tremendous opportunities for Florida citrus growers, and therefore, Florida ports are poised to benefit due to the proximity to the exporters. Also, of interest is the fact that both Hyundai Motor Manufacturing Alabama (Montgomery, Alabama) and Kia Motors Manufacturing Georgia (West Point, Georgia), both Korean-owned manufacturers have located manufacturing facilities in the Southeast. These two plants will have the capacity to produce nearly 760,000 units at full capacity. Furthermore, Toyota has announced that it is interested in developing a North Americanbased export hub for some products to curb the negative effects of the strong yen when exporting from Japan, which includes the Camry line into South Korea from the US. The majority of the 100,000 units exported from the US were destined for North American Free Trade Agreement partners. Similarly, European automakers such as Audi are MARTIN ASSOCIATES Page 15
18 looking to increase production in the US to take advantage of the weaker dollar. While there are other competing ports in the Gulf and South Atlantic, the proximity of these plants to Florida ports is should not be discounted as the manufacturers trade patterns and supply chains can potentially evolve over time. Total bilateral trade between the US and Panama, has grown by 160% in the past five years, with about a third moving through Florida. Panama has been one of the fastest-growing economies in Latin America and the IMF predicts growth of 6% through In recent years, exports of bulk commodities such as ores, stone and cement from Florida ports to Panama have increased dramatically. However, paper products, vehicles and machinery have been the stable export commodities through Florida ports in recent years. Edible fruits and vegetables are among the top import commodities from Panama through Florida ports as illustrated in Exhibit 11. Exhibit 11 Panamanian Top Import/Export Commodities through Florida Ports (Metric Tons) FL Metric Tons Exported to Panama Commodity Code and Description Ores, Slag And Ash 3 3 2,994 27, , Salt; Sulfur; Earth & Stone; Lime & Cement Plaster 5,988 12,126 4,776 32,357 71, Paper & Paperboard & Articles (inc Papr Pulp Artl) 27,695 24,614 28,629 20,382 33, Vehicles, Except Railway Or Tramway, And Parts Etc 16,860 33,717 43,311 34,088 32, Nuclear Reactors, Boilers, Machinery Etc.; Parts 12,613 18,678 26,757 19,292 24, Wood And Articles Of Wood; Wood Charcoal 2,047 3,192 7,291 9,438 21, Beverages, Spirits And Vinegar 6,967 7,905 8,163 10,471 19, Fertilizers ,780 3,000 19, Electric Machinery Etc; Sound Equip; Tv Equip; Pts 5,975 8,901 11,429 9,532 14, Tanning & Dye Ext Etc; Dye, Paint, Putty Etc; Inks 5,295 5,392 5,506 12,007 11,096 Subtotal of top 10 Commodities 83, , , , ,161 All Other Commodities 56,565 73,340 87,628 86,390 96,287 Total 140, , , , ,448 FL Metric Tons Imported from Panama Commodity Code and Description Special Classification Provisions, Nesoi 8,593 10,102 12,379 12,915 16, Edible Fruit & Nuts; Citrus Fruit Or Melon Peel 15,567 13,003 11,501 8,365 10, Edible Vegetables & Certain Roots & Tubers 9,277 7,780 6,247 5,770 5, Beverages, Spirits And Vinegar 6,103 7,417 2,900 3,564 3, Fish, Crustaceans & Aquatic Invertebrates 2,183 1,893 2,639 2,487 2, Aluminum And Articles Thereof 1,163 1, Coffee, Tea, Mate & Spices Edible Preparations Of Meat, Fish, Crustaceans Etc Electric Machinery Etc; Sound Equip; Tv Equip; Pts Essential Oils Etc; Perfumery, Cosmetic Etc Preps Subtotal of top 10 Commodities 43,781 42,209 37,569 34,265 40,702 All Other Commodities 7,856 6,285 1, Total 51,637 48,494 39,367 35,241 41,223 Source: US Census Bureau, Foreign Trade Division MARTIN ASSOCIATES Page 16
19 Port Everglades and Miami have historically been the dominant Florida ports in trade with Panama. Exhibit 12 Panamanian Import/Export Volumes through Florida Ports (Metric Tons) Panama Exports by FL Port (Metric Tons) Port Port Everglades 52,367 70,725 84,480 98, ,354 Tampa 1,020 3,627 20,507 36, ,189 Miami 66,735 92, , , ,418 Jacksonville ,105 13,615 24,574 Panama City 17,791 18,163 17,909 7,231 19,512 Subtotal Top 5 Ports 138, , , , ,047 Other FL Ports 1,737 2,077 4,768 3,998 3,401 Total FL Ports 140, , , , ,448 Panama Imports by FL Port (Metric Tons) Port Port Everglades 21,483 29,806 22,624 18,155 25,150 Miami 29,803 15,304 16,100 17,047 15,913 Jacksonville Port Canaveral Tampa Subtotal Top 5 Ports 51,631 45,512 39,330 35,235 41,223 Other FL Ports 6 2, Total 51,637 48,494 39,367 35,241 41,223 Source: US Census Bureau, Foreign Trade Division When the US-Panama FTA is enacted, it will eliminate what were already some of the region s lowest tariffs. The affected goods include not only high-tech machinery and equipment used in the medical, engineering and aerospace industries, but also fertilizers and many agricultural commodities such as beef, pork, dairy products, most fruits and grains. In terms of growth in trade due to the enactment of the Trade Promotion Agreement (TPA), scenarios developed by the US Chamber of Commerce suggest that export goods to Panama would grow at a compounded annual growth rate of 25%, compared to long-term growth of 16.5% in the absence of a TPA. Also, the USITC has provided a growth range of 9%-145% over time depending on the specific commodity/industry sector; however the small size of the Panamanian market and the fact that the United States already supplies a substantial share of Panama s imports in several of these product sectors could minimize impact on total trade 1. In addition, the development of transshipment hubs in Panama to accommodate the growth in the size of vessels transiting the expanded Panama Canal will likely result in an increase in trade with Panama. Since this transshipment trade will be dominated by feeder type vessels, those Florida ports not able to handle the post-panamax size vessels 1 US-Panama Trade Promotion Agreement: Potential Economy-wide and Selected Sectoral Effects, Investigation No. TA , USITC Publication 3948, US International Trade Commission, September, 2007 MARTIN ASSOCIATES Page 17
20 will remain key participants in this trade with Panama, as well as other Caribbean transshipment centers. While it is difficult to quantify the impact that the FTAs with Colombia, South Korea and Panama will have on Florida, it is assumed that, as described above, the Florida ports will continue to maintain current market share and most likely expand market share as agreements are put into place. 3. Future Implications on Ports and Infrastructure In the previous sections of this report, the factors that contributed to changes in logistics patterns and the growth in all-water services were identified, and the resulting impact on the growth of distribution center activity on the East and Gulf Coasts. Key issues that drive future DC development include: West Coast ports have recognized that demand is not inelastic, and have focused on improving port productivity, terminal densification and reducing bureaucratic red tape in terminal expansion; Truck and rail service at West Coast ports has improved, particularly in terms of availability and service; Intermodal rates have become more competitive; and Growth of environmental policies and infrastructure fees at West Coast ports have stabilized. There is still remaining questions as to labor productivity improvements at the West Coast ports, and the acceptability by labor of more automated container terminals in the future, which will significantly lower terminal costs and improve terminal capacity. With the expansion of the Panama Canal to accommodate larger vessels in 2014 (thus lowering the vessel operating costs per container and increasing the cost competitiveness of an all water routing through the East Coast over the West Coast), there is anticipation that the volume of containerized cargo moving via US East and US Gulf Coast ports will grow significantly. However, the actual volume increases through the Panama Canal may be less than anticipated due to the factors that have impacted growth in all-water services are now in place and growth in trade with areas that are more efficiently served via Suez Canal. As a result of the shifts in all-water services that have occurred since 2002 due to the West Coast port shutdown; changes in distribution center geographic locations and logistics supply chain patterns of importers; development of new container terminals on the US Atlantic and US Gulf; and intermodal pricing by the railroads that shifted cargo away from West Coast ports, the dynamic changes in allwater versus intermodal services may be over, or at least slowing. The West Coast ports have come to realize that the demand for the use of West Coast ports is not inelastic, and, in fact, substitute port routings via the all-water services are viable. Similarly, the railroads have also found that pricing of intermodal services do impact importers/exporters port choice decisions, and the higher intermodal rates of the early and mid-2000 s actually did impact the West Coast port routings in favor of all-water MARTIN ASSOCIATES Page 18
21 services. Significant investments in terminal capacity and efficiencies are planned for the Ports of Long Beach and Los Angeles, with the focus on protecting market share after the expansion of the Panama Canal. Therefore, unless significant cost savings of an all water routing can be made, including reduced transit time of an all-water routing, the large increase in container volume via US East and US Gulf Coast ports is not likely to materialize after What is more likely to occur is that the ocean carriers will increase the size of vessels moving via the Canal, and where cost competitive to a West Coast intermodal routing, these carriers will increase all water sailings on specific Asian/US East Coast/US Gulf Coast routings. After the completion of the expanded Panama Canal in 2014, the composition of the fleet (especially vessels calling US East Coast and US Gulf Coast ports) will likely change, as 6,500 TEU plus vessels will be deployed. The US East and US Gulf Coasts will have to compete to handle the larger sized vessels that will be deployed on both Suez as well as Panama Canal routings based on infrastructure, including channel depth to accommodate larger vessels (both Suez as well as the use of the expanded Panama Canal), berth capacity to handle 1,000 ft plus vessels, and crane outreach capability. The US East and US Gulf Coast ports will also need to compete based on local market and access to discretionary cargo for both truck and rail. Specifically for Florida, the dredging of the Miami channel to -50 feet, the construction of on-dock rail, and the Port of Miami access tunnel position the Port of Miami to market to carriers the ability to handle a first inbound port call. These investments will be critical in providing the infrastructure necessary for the Florida ports to compete with Savannah and the West Coast ports for Asian cargo moving on all water services. Without this investment in channel depth, ICTF development and tunnel access, it would not be possible to compete for the larger vessels that will transit the Panama Canal after 2014, This is especially the case for Florida ports to compete for a first inbound port call, which will further result in the development of import distribution center activity in the port area, in turn stimulating economic growth in the State of Florida. In addition to the growth in infrastructure at US East Coast and US Gulf Coast ports to accommodate the direct calls of the larger size vessels deployed after the expansion of the Panama Canal, the development of transshipment hubs in the Caribbean will likely continue, such as those in place in the Bahamas, Jamaica, Puerto Rico and Panama. Other transshipment hubs designed to handle the larger vessels transiting the expanded Canal are planned in Cuba, as well. At these transshipment ports, the larger vessels transiting the Panama Canal from Asia will discharge containers at these hubs, and then return to Asia. Smaller vessels will be deployed from the transshipment hubs to serve the Atlantic and Gulf Coast ports. In addition, these transshipment hubs will also represent an opportunity to mix north and south bound cargoes headed to and from Asia and the US, and to develop import distribution centers to compete with those centers in the Southeastern United States. The growth of these Caribbean transshipment hubs will also provide opportunities for the Florida ports that have not been able to secure deeper MARTIN ASSOCIATES Page 19
22 channels, as smaller container vessels will be deployed from the Caribbean transshipment hubs into Atlantic and Gulf Coast ports. To compete for the larger vessels deployed after the opening of the Panama Canal, as well as the potentially increased service via the Suez Canal to handle the growth in production centers in Vietnam and India, the ports will need to compete based on water depth, access to local and discretionary markets via on-dock rail, and port terminal infrastructure development. In addition, the ports will also need to compete to handle the smaller sized vessels deployed from the transshipment hubs, focusing on terminal productivity, terminal densification, inland transportation access to markets, and the ability to attract smaller scale distribution centers at near port locations. With respect to water depth, only three non-pacific ports have a 50-ft draft to accommodate a fully laden 8,000+ TEU ship: New York, Baltimore and Norfolk. In addition, Miami has received authorization and has received a pledge from the Governor Scott to provide funds toward the estimated $200 million project. Exhibit 13 shows the current and planned depth at key US ports. Exhibit 13 - Current and Planned Depths at East and Gulf Coast Ports Current Planned State Port Depth Depth Alabama Mobile Delaware River DE, PA NJ Ports Florida Jacksonville FLorida Manatee Florida Miami (Authorized) Florida Port Everglades Florida Tampa Georgia Savannah Louisiana New Orleans Maryland Baltimore Massachusetts Boston New York New York South Carolina Charleston Texas Corpus Christi Texas Freeport Texas Galveston/Houston Texas Sabine Naches Virginia Norfolk/Hampton Roads Source: Martin Associates With respect to the discretionary markets, the battle ground will be in the Midwest and Southeast, particularly in areas such as Columbus, Indianapolis, Cincinnati, Cleveland, Chicago, Memphis, Atlanta and St. Louis. Houston, Dallas and Denver will also be key battlegrounds for Gulf Coast activity. Central Florida will also be a key battle MARTIN ASSOCIATES Page 20
23 ground for Florida ports. Because of the importance of the ability to serve the discretionary markets in a timely manner, rail service will be critical for Florida ports, including on-dock rail. Currently, the Port of Miami and Port Everglades are about to begin constructing on-dock/near-dock rail infrastructure and JAXPORT has just received TIGER Grant III funding for on-dock rail at Dames Point. The importance of the ondock rail is critical in marketing to ocean carriers that will be deploying the larger vessels as a first inbound port call, rather than the carriers involved in transshipment activities in the Caribbean. Should the US ports, particularly the Florida ports with ft. deep channels, be able to compete with the Caribbean ports for transshipment cargo, then ondock rail becomes even more important in delivering cargo to consumption points in the US in a more time and cost effective manner than using non-florida ports, most notably Savannah and the San Pedro Bay ports of Los Angeles and Long Beach. Key to regain the ability to transship cargo is the need to competitively price the transshipment services. Currently, ILA labor costs and security issues and regulations at US ports, particularly Florida ports, make transshipment services cost prohibitive. More specifically, the cost and potential time delays of US Customs and Border Protection (CBP) inspections of containers and subsequent stripping of containers during inspection, even for containers not ultimately destined for the US is the key hindrance in developing US transshipment services. These institutional practices severely limit the ability of Florida ports to compete with the transshipment hubs developing in the Caribbean, and will likely result in an erosion of jobs that would have otherwise occurred in Florida. The competitive disadvantage of the cost and potential time delays associated at a Florida port for a transshipment operation limits the economic impact that could otherwise have been realized by the current port infrastructure by the State and private marine terminal operators. On-going investment in rail infrastructure in the US will enhance direct, all-water Panama Canal service to the US East and US Gulf Coasts ports, and enhance access to these discretionary markets. Two rail projects will reduce transit times from US Atlantic Coast Ports into the Midwest. The Heartland Corridor Project will provide significant rail improvements for Norfolk Southern between Norfolk and the Midwest. The Crescent Corridor will provide improved service between the US Gulf and US North Atlantic, while the National Gateway Project will provide significant transit time improvements for the CSX service connecting New York and Baltimore to key Midwestern points, with a focus on the North Baltimore/Toledo (OH) Intermodal Container Transfer Facility (ICTF). Rail investments by the Kansas City Southern (KCS) and Centerpoint near Rosenberg, TX will provide significant intermodal access into the key manufacturing centers and distribution activity of the Monterey and Saltillo areas of Mexico. Also, near Rosenberg, the Union Pacific is developing an ICTF which will further improve intermodal access into the Midwest from the West Gulf area. Container terminal development will also influence shipping and logistics patterns. The Port of New York purchased the Military Ocean Terminal at Bayonne (MOTBY) which avoids air draft restriction imposed by the Bayonne Bridge. The Port has also announced the intent to address the air draft restriction of the Bayonne Bridge. Baltimore has recently entered into a 50-year concession with Ports America Chesapeake MARTIN ASSOCIATES Page 21
24 for the Seagirt Marine Terminal, with the development of a 50-ft. berth as part of the concession agreement. Philadelphia is currently involved in an RFP for development of the Southport Terminal and Norfolk has terminal expansion capability at Craney Island. Specifically, recent improvements and planned infrastructure development at US South Atlantic and Florida Ports include: Port of Charleston The Port has approximately 449 acres of dedicated container terminal operations. To accommodate the larger container ships serving world trade, the Charleston Harbor channels leading to all container terminals are now dredged to -45 feet at mean low water (5- to 6-foot tidal lift), while the entrance channel is 47 feet. The Port is investing $1.3 billion to deepen the channel to 50 feet. The completion is expected around The Port has approved projects focusing on infrastructure and equipment upgrades such as four container handler masts for the Wando Welch Terminal and improved rail for Veterans Terminal. Twenty-five acres of new container yard to be used for refrigerated containers were added to the Wando Welch Terminal. The former area was reclassified for loaded dry container stacks, adding over 1,000 container slots to the Port. A $23 million improvement at Columbus Street Terminal added 70 acres of storage yard and added additional rail infrastructure, which now permits oversize rail. The RoRo cargo operations were moved from the Union Pier Terminal to this location to handle the growing BMW business. The lifting capabilities of this terminal were also increased up to 500 tons. The Port of Charleston s plan includes the development of a new three post- Panamax ship berth, 280-acre container terminal on the former Charleston Naval Complex. The $600-million project, supported by South Carolina law, will boost capacity by 1.4 million TEUs. In December, 2007, the approval was granted by both South Carolina and Georgia to create a bi-state port office to proceed with the planning and development of the Jasper Ocean Terminal. The parcel is approximately 1,400 acres that lies on the South Carolina side of the Savannah River in Jasper County. The terminal is expected to be operational by However, in December, 2011, the South Carolina State Ports Authority suspended funding for its joint project citing the current deepening project of the Savannah River would not enable the river to accommodate the size of the vessels that will start coming through the new Panama Canal locks after In order to attract additional Asian container service, the South Carolina Ports Authority has been pursuing a distribution strategy. To date, several distribution MARTIN ASSOCIATES Page 22
25 centers have located near the port or on port property. These distribution center developments include: Wal*Mart DC operated by American Port Services on Port property; Sam s Club distribution center near Wando Welch Terminal; Fruit of the Loom 350,000 sf distribution center under construction; JIMCO Group, based in Savannah, opened a bulk transload operation on Port property. It will receive products by rail or truck and export it internationally in containers. 200 million sf spec, class A industrial space available for development within a 30 mile range Two large logistics center planned with over 5,000 sf in a 60 mile radius Continental Tire planning new $500 million plant in Sumter, SC Bridgestone Corporation building 1.5 million sf manufacturing plant in Aiken, SC. 1 million sf of distribution center capacity in mid-south Carolina; and 10,000 acres of developable within a 1-hour drive of Charleston. Port of Savannah The Garden City Terminal is a 1,200-acre facility that features 9,693 linear feet of continuous berthing and more than 1.3 million square feet of covered storage. The terminal is equipped with fifteen high-speed container cranes (4 super post- Panamax and 11 post-panamax) as well as an extensive inventory of yardhandling equipment. The port plans to spend $1.2 billion over the next ten years on terminal densification efforts, including the addition of 2 high speed super post-panamax cranes every 18 months. The terminal is also adding 86 Rubber Tired Gantry cranes (RTG) as part of the Port s full RTG conversion which will improve efficiencies at the Port. In addition, Garden City Terminal is within 6.3 miles of I-16 (east/west) and 5.6 miles of I-95 (north/south), with access to more than 100 trucking companies. CSX Transportation (CSXT) and Norfolk Southern Railroad (NS) provide Class I rail service. As a key intermodal advantage, the "James D. Mason" on-terminal intermodal container transfer facility (ICTF), or "Mason" ICTF, provides overnight rail service to Atlanta. A 6,000 foot extension on the ICTF center is scheduled to begin in The extension will combine a track between the two onsite rail yards. In addition to the rail, the construction of the overpass of S.R With these two improvements, there will be more efficient flow for trucks and rail. Two- to four-day delivery via the ICTF is also available to inland destinations such as Charlotte, Chicago, Dallas, and Memphis. As the volume of cargo moving through the Port of Savannah escalates and the ships carrying that cargo grow even larger, plans call for Savannah s channel to be deepened from its present depth of -42 feet to -48 feet at mean low water to accommodate the next generation of deep-draft vessels. Completion of this project is projected for MARTIN ASSOCIATES Page 23
26 Jacksonville Port Authority (JAXPORT) JAXPORT has historically participated in the Caribbean trade, more specifically; the port controls nearly 75 percent of the US-Puerto Rican trade. However, in 2009, Mitsui OSK Lines (MOL), along with terminal operator TraPac, signed a long-term lease and developed a 158-acre dedicated container terminal at Dames Point. This development will add capacity of nearly a 1 million TEUs to the port. In addition, Hanjin has announced plans for an additional 90-acre container terminal adjacent to the existing MOL/TraPac facility. JAXPORT s FY2011 capital improvement program includes installation of two new gantry container cranes, refurbishment of the rail infrastructure at Blount Island and investments in wharf rehabilitation at Talleyrand and Blount Island. Since the MOL/TraPac terminal opened in 2009, many retailers and 3PL firms have begun to take advantage of the global container services offered at the facility. In addition, more than 10 million square feet of warehousing and distribution space has been developed in Northeast Florida over the last few years. The Port was recently awarded a $10 million TIGER III grant to construct ondock rail to the Dames Point facility. Jaxport s Talleyrand and Dames Point Terminals are now dredged to a maintained depth of -40 ft. Blount Island Terminal is maintained to -38/-40 ft. The Port is under study by the US Army corps of engineers to authorization further deepening of the channel. JAXPORT s transportation infrastructure consists of the following: Excellent north-south rail access to Southern Florida via Florida East Coast Railroad (FEC); Access via CSX into Central Florida and the Winterhaven industrial distribution center currently under development by CSX; East-west rail service via CSX and NS and good northbound service as well into the Midwestern US; and Excellent highway access to key Southeastern markets. Accompanying the container terminal development at Jacksonville, there has been significant actual development and interest in the development of distribution centers in the area. Currently BJ s and Wal*Mart have distribution centers near the Port, and these are primarily used for export activity to the Caribbean. Port of Palm Beach With respect to containerized cargo, the Port of Palm Beach s container carrier, Tropical Shipping, serves ports throughout the Caribbean including the Bahamas, US Virgin Islands and Dominican Republic. MARTIN ASSOCIATES Page 24
27 While it is expected that the Port of Palm Beach will continue to serve the Caribbean, specifically the Bahamas trade, it is unlikely that the port will compete for Asia, India Sub-Continent (ISC) and European cargoes. This is due to the fact of the limited draft of -32 at High Water that prohibits vessels in excess of 700 LOA to enter the port. Urban development and recreational marine industries nearby severely constrain any major port expansion In 2005, the Port embarked on a 10-year capital improvement program estimated at $122M. Land and current infrastructure constraints are being dealt with by redeveloping and improving the port with three major construction projects which began in Currently the Port is undergoing a Master Plan update to identify potential cargo opportunities and infrastructure redevelopment. One of the Port of Palm Beach s promising assets is its on-dock rail, which served Cuban trade in the 1950s, and the Port operates its own switching operations and interchanges with Florida East Coast Railway (FEC) bordering the Port to the west. However, current operations conflict with local traffic as the switching operation blocks a major six lane arterial in both the morning and evening peak hours. FDOT, the Port and the City are looking at alternatives to mitigate impacts. The Port recently has improved its on-dock rail, redeveloped land for cargo laydown and opened a second truck gate off of US Highway 1 in mid The Port has thus far received commitments of over $35M in grants from the Florida Department of Transportation, which has recognized the importance of augmenting capacity to the Southeast Florida ports. Port Everglades The Port has recently adopted a Master/Vision Plan update. According to the Port Authority, significant strategic changes from the 2006 plan included in the Master/Vision Plan include: Adding a new 16.5-acre on-port Upland Enhancement area related to the release of a portion of the existing 8-acre Conservation Easement that will allow the Port to create four new cargo berths in the Southport Turning Notch. Changing from a two-phase to a single-phase approach to the Southport Turning Notch expansion and decoupling from the US Army Corps of Engineers Deepening and Widening program. Refining the US Army Corps of Engineers Deepening and Widening program to reflect changes since 2007, which will allow the Port to deepen its channels to 50 feet from the current depth of 42 feet. MARTIN ASSOCIATES Page 25
28 Inclusion of a passenger ferry operations with proposed destinations such as Cuba. In fact, daily ferry service to and from Nassau, Bahamas began in December Modifying vessel and crane positioning in Southport due to Federal Aviation Administration object height to restrictions resulting from the close proximity of Fort Lauderdale-Hollywood International Airport. Revised Phasing of bulkhead projects to reduce costs. Advancing the Intermodal Container Transfer Facility into the 5-year Master Plan and deferring the Crushed Rock facility to the 10-year Vision Plan. Port of Miami The Port of Miami recently adopted a 25-year Master Plan which will improve both cargo and cruise efficiencies at the Port. In addition, three key projects are planned or underway: the Port of Miami Access Tunnel (POMT), the Port s Deep Dredge project and construction of an on-dock rail facility. In December, 2007, the Miami city commission voted to proceed with the tunnel project that will link the Port of Miami terminals to I-395 and I-95 and therefore relieving truck congestion through the City. The Port of Miami Tunnel (POMT) project is currently being built by MAT Concessionaire, LLC, in partnership with the Florida Department of Transportation (FDOT), Miami-Dade County and the City of Miami. By connecting SR A1A/MacArthur Causeway to Dodge Island, the project will provide direct access between the seaport and highways I-395 and I-95, create another entry to the Port of Miami besides the Port Bridge, and keep the Port of Miami, the community s second largest economic generator, competitive. Additionally, The POMT will improve traffic flow in downtown Miami by reducing the number of cargo trucks and cruise related vehicles on congested downtown streets, and will aid ongoing and future development in and around downtown Miami. The Port s Deep Dredge project is timed to coincide with the opening of an expanded Panama Canal in 2014, which will allow a new generation of larger cargo vessels to pass through the Canal. Governor Scott directed the Florida Department of Transportation to amend their work plan to include $77 million for the dredging project. Once the port is dredged to a depth of 50 feet, larger, Super Post-Panamax ships can load and unload cargo there, enabling the Port of Miami to become a first port of call for ships coming through the expanded Panama Canal in The US Department of Transportation awarded the Port of Miami with a $22.7 million grant to restore and rail service between the Port and the Florida East Coast (FEC) Rail Yard in Hialeah providing direct cargo access to the national rail system, further enhancing intermodal capacities when completed in MARTIN ASSOCIATES Page 26
29 Port of Tampa Tampa currently has 25 acres dedicated to container development; however there is an additional +/-80 acres adjacent to the terminal that can be developed in the near-term if necessary. The Port is currently quadrupling the capacity of its Port s America operated container terminal. The port has various sites available for container development which include Port Redwing, Hookers Point, and Pendola Point; however, significant capital investments would need to be made to develop these sites. Partnering with CSX and FDOT, the Port has started construction on Tampa Gateway Rail Project with completion expected in mid This will provide on dock rail access. In addition, construction is underway on FDOT s I-4 Connector Project. This more than $500 million project that will provide direct port access to the interstate system without traversing city and county roads, greatly eliminating delays and environmental and maintenance costs. This project is to be completed by mid Construction will begin early this year on the single largest project planned at the port the $40 million modernization and expansion of the port s main oil terminal known as REK Pier, the primary entry point for gasoline for all of west/central Florida s nearly 9.0 million residents and the jet fuel for Orlando Airport. As demonstrated in this chapter, the dynamic changes in the import logistics patterns that have occurred since 2002 to serve the Southeastern, Eastern, Gulf and Midwestern markets have resulted in potential opportunities to grow the role of Florida in the international logistics industry. This includes the development of distribution centers and logistics parks to serve the Florida consumption markets, as well as increasing the role of Florida s ports in attracting imports that are now consumed in Florida but imported via other non-florida ports. Growth in Florida s role in the logistics industry role will provide an economic catalyst to create additional logistics industry related employment within the State. The focus of the next chapter is the development of logistics centers and distribution centers to enhance the State s role in the logistics industry. MARTIN ASSOCIATES Page 27
30 III. Florida Distribution Center Market Assessment This chapter focuses on the potential market for the development and expansion of the logistics industry within the State of Florida. 1. Trends in Florida Distribution Center and Warehousing Activity The distribution center market in Florida has historically been characterized by retail and wholesale industries that serve the key consumption markets throughout the State with import and domestic shipments, as well as by the freight consolidators primarily located in South Florida and Jacksonville that serve the Caribbean and Latin American export trade. This Caribbean and Latin American trade is driven by the construction and tourism activity. In addition, there is also a well established logistics supply chain to chandler the cruise vessels calling the Florida ports with hotel/retail items. The majority of DC growth in Florida has occurred in three regions: Miami-Dade/Broward Counties: Serves the South Florida retail and wholesale markets; food wholesalers near the Port of Palm Beach, Port of Miami and Port Everglades infrastructure serve cruise and island export markets; consolidators focus on near-airport facilities to also serve air cargo market at Miami International Airport (MIA). I-4 Corridor (Tampa-Lakeland-Orlando): Serve growing population and tourism in Central Florida; also ability to serve South Florida retail and wholesale markets; excellent highway and rail access from hinterland. Greater Jacksonville Area: Ability to serve into North/Central Florida as well as westbound; inexpensive land, low congestion; excellent highway and rail access that can also access South Florida. In addition, a Jacksonville and Northeast Florida location provides an alternative to DC locations in Savannah to serve the Southeastern market. From an import standpoint, however, increased water depth is required at the Port of Jacksonville to effectively compete with Savannah as a major import distribution center for the Southeastern US with deeper water, it is likely that the Port of Jacksonville could be a key gateway port providing direct competition with Savannah as a port of entry for Asian import containerized cargo. 1.1 Key Demographics Underlying Distribution Center Development The growth in distribution, warehousing and logistics-related services has centered in key population and consumption centers as demonstrated in Exhibit 14. The largest number of distribution centers has developed in the Jacksonville area, and MARTIN ASSOCIATES Page 28
.")
31 these centers typically serve the Northeastern Florida markets, as well as the Southeastern markets in Georgia. Essentially these DC operations parallel the type of development that has occurred in the Savannah area. (Distribution Center activity by key retail/wholesale industry can be found in Appendix A). Exhibit 14 Location and Concentration of Florida DCs Top 25 Retailers Source: Chain Store Guide, Martin Associates and Florida Demographic Estimating Conference Database As previously illustrated, there is a strong relationship between DC location and population/consumption centers. Furthermore, areas with projected population growth and a higher concentration of younger families tend to be attractive to planned distribution center growth, as these areas represent growing retail markets. According to the Demographic Estimating Conference Database, Florida s population is anticipated to grow to 23.8 million people by 2030, which equates to a 1.2% annual growth rate over the 20-year period, as shown in Exhibit 15, while accompanying table in Exhibit 15A details population and growth by county. MARTIN ASSOCIATES Page 29

32 Exhibit 15 - Florida Population Forecast Exhibit 15A - Florida Population Forecast , County Detail County % Change Increase in Population County % Change Increase in Population Alachua 257, ,373 26% 65,820 Leon 274, ,204 17% 46,304 Baker 25,916 33,035 27% 7,119 Levy 40,680 53,241 31% 12,561 Bay 170, ,870 24% 40,694 Liberty 8,212 10,509 28% 2,297 Bradford 29,308 34,333 17% 5,025 Madison 20,297 23,260 15% 2,963 Brevard 554, ,700 25% 140,803 Manatee 318, ,538 31% 99,949 Broward 1,742,891 1,903,007 9% 160,116 Marion 330, ,280 42% 138,633 Calhoun 14,576 16,735 15% 2,159 Martin 143, ,676 20% 28,828 Charlotte 165, ,576 28% 46,734 Miami-Dade 2,476,289 2,854,094 15% 377,805 Citrus 142, ,685 33% 46,877 Monroe 78,150 75,507-3% (2,643) Clay 185, ,177 46% 85,665 Nassau 73, ,030 42% 30,952 Collier 333, ,576 45% 150,022 Okaloosa 196, ,053 25% 48,272 Columbia 67,097 85,190 27% 18,093 Okeechobee 39,712 46,931 18% 7,219 DeSoto 34,588 40,193 16% 5,605 Orange 1,110,993 1,527,285 37% 416,292 Dixie 16,212 20,757 28% 4,545 Osceola 273, ,530 69% 189,256 Duval 899,535 1,120,624 25% 221,089 Palm Beach 1,286,778 1,549,365 20% 262,587 Escambia 312, ,681 12% 37,189 Pasco 440, ,047 41% 178,779 Flagler 95, ,611 89% 84,940 Pinellas 927, ,471 1% 10,352 Franklin 12,371 13,921 13% 1,550 Polk 583, ,183 32% 188,373 Gadsden 49,807 57,825 16% 8,018 Putnam 74,216 79,454 7% 5,238 Gilchrist 17,571 24,174 38% 6,603 Santa Rosa 145, ,478 36% 52,219 Glades 11,330 12,541 11% 1,211 Sarasota 389, ,386 30% 118,096 Gulf 16,750 17,990 7% 1,240 Seminole 423, ,028 24% 102,313 Hamilton 14,752 16,374 11% 1,622 St. Johns 186, ,858 68% 125,802 Hardee 28,314 30,594 8% 2,280 St. Lucie 274, ,256 57% 156,893 Hendry 41,026 51,057 24% 10,031 Sumter 99, ,882 89% 88,531 Hernando 165, ,683 40% 66,163 Suwannee 43,135 53,273 24% 10,138 Highlands 99, ,791 25% 25,050 Taylor 23,132 26,007 12% 2,875 Hillsborough 1,199,428 1,582,495 32% 383,067 Taylor 23,132 26,007 12% 2,875 Holmes 19,897 22,090 11% 2,193 Union 15,657 18,609 19% 2,952 Indian River 141, ,347 39% 55,417 Volusia 506, ,185 21% 106,657 Jackson 52,782 59,602 13% 6,820 Wakulla 31,772 46,307 46% 14,535 Jefferson 14,783 16,629 12% 1,846 Walton 57,927 88,451 53% 30,524 Lafayette 9,779 11,591 19% 1,812 Washington 25,017 29,622 18% 4,605 Lake 293, ,550 54% 158,072 Lee 616, ,874 54% 332,248 Total 18,796,488 23,821,151 27% 5,024,663 Source: Demographic Estimating Conference Database, updated August, 2010 MARTIN ASSOCIATES Page 30


33 Exhibits 16 and 17 depict the Florida population by county in 2010 and Exhibit 16 Florida Population by County Source: Demographic Estimating Conference Database, updated August, 2010 Exhibit 17 Florida Population by County 2030 Source: Demographic Estimating Conference Database, updated August, 2010 MARTIN ASSOCIATES Page 31

34 Exhibit 18 shows the percent change in population over the period. The greatest population growth is projected in Northeast and Central Florida. Fifteen counties are expected to demonstrate a more than a 40% change in population by 2030 ten of those counties lie north of Lake Okeechobee, through the I-4 Corridor to Jacksonville. It is important to note that this projected growth in population in these more northern and central counties are a key factor that will drive distribution center/logistics center development. Exhibit 18 Florida Population by County Percent Change Source: Demographic Estimating Conference Database, updated August, 2010 As shown in Exhibit 18, the highest concentration of population growth over the next twenty years is anticipated to occur in the central and northeast regions of the state. Furthermore, family households with children under the age of 18 are more concentrated in the center and northern regions of the state, as shown in Exhibit 19 below. From an importers and DC developer s perspective, markets that represent population growth as well as a concentration of younger families are more attractive than markets characterized by a lower level of projected growth and a smaller concentration of families with fewer children. Therefore, from a demographic perspective, the northern and central counties appear to be most attractive. MARTIN ASSOCIATES Page 32

35 Exhibit 19 Percent of Florida Households with Children under 18 Source: Demographic Estimating Conference Database, updated August, Economic Factors Impacting Locational Decisions Prior to the 2008 housing crash and subsequent global economic downturn, the Florida market industrial market was thriving, especially in Central Florida along the I-4 Corridor. Speculative buildings were being constructed by developers with optimism. Since 2008, however construction of industrial space and absorption has come to a standstill. Exhibit 20 compares key metrics of the industrial real estate market throughout the State of Florida. As expected, vacancies have increased and the asking rates are low. Perhaps the most telling figure of the weakened industrial real estate market is the fact that in Q3 2007, the six key markets in Florida were constructing 11 million square feet of industrial space while in Q3 2011, only one market Jacksonville is beginning to show construction activity in the state. It is important to note that Jacksonville has the lowest lease rates in the areas included in the analysis. MARTIN ASSOCIATES Page 33
36 Exhibit 20 Comparison of Key Metrics in Key Florida Industrial Markets Q Q Vacancy Rate Vacancy Rate Market Percent Percent Palm Beach 6.0% 10.8% Miami 4.5% 7.0% Broward 5.0% 8.7% Tampa Bay 3.7% 9.2% Orlando 5.7% 15.9% Jacksonville 5.0% 11.4% Q Q Asking Lease Asking Lease Market Rate SF/YR Rate SF/YR Palm Beach $ NNN $ NNN Miami $ Ind. Gross $ Ind. Gross Broward $ NNN $ NNN Tampa Bay $ NNN $ NNN Orlando $ NNN $ NNN Jacksonville $ NNN $ NNN Q Q Square Feet Square Feet Market Under Construction Under Construction Palm Beach 633,863 0 Miami 3,699,594 0 Broward 2,016,986 0 Tampa Bay 2,614,013 0 Orlando 1,313,380 0 Jacksonville 1,458, ,000 Source: CB Richard Ellis * NNN lease rates do not include operating expenses insurance and taxes which is estimated about $2.50/sf in South Florida and $1.50/sf in Central and Northern Florida markets It should be noted that the lease rates identified for Palm Beach County in Exhibit 20 are predominantly derived from coastal submarket areas such as Boca Raton, Delray Beach, Boynton Beach/Lantana, Lake Worth/Wellington, West Palm Beach, Riviera Beach, and Jupiter. Lack of industrial development of rural Palm Beach County areas (as well as other counties adjacent to Lake Okeechobee) such as Belle Glade/Clewiston/Pahokee/Okeechobee limit available published data for similar parameters. It is anticipated that lease rates in rural Palm Beach County area would be less than those identified for coastal regions. MARTIN ASSOCIATES Page 34
37 2. Implications of National Trends in the Development of Logistics Centers and Distribution Centers in Florida Nationally, distribution and warehousing trends are indicating that there is demand for larger distribution properties by big-box retailers and third-party logistics providers (3PLs). The most popular sites are 500,000 square feet and greater in areas served by seaports. According to Grubb & Ellis, the availability of large, Class A properties is beginning to tighten, which is forcing rent escalation. In the 750,000-squarefoot and larger sector, rents increased 21 percent on an annualized basis in the third quarter. Rents rose 4 percent in the 250,000- to 500,000-square-foot segment 2. Retailers are looking to position themselves near key end markets in order to reduce transportation costs and increase ability to supply product in an efficient and timely manner. These retailers are also looking more to engage the services of 3PLs to save on costs, such as transportation. Currently, fuel surcharges in the Southeast are $.35 per mile. Distribution strategies now in the planning stages will take months for a company to find, secure and modify DC property before starting operations. Also, retailers are interested in high quality, large, efficient facilities. Characteristics of new DCs include 35 ft. clearances, energy-efficient lighting and building materials, low-flow plumbing, and solar collectors. Also, automation is becoming increasingly present. As an example, Skechers Footwear built a new 1.8 million sf warehouse near Long Beach, consolidating seven small warehouses. This consolidation has led to an increase of efficiency from stocking/pulling 7,000 shoes per hour to 20,000 shoes per hour 3. In terms of consolidation of facilities, more mature companies that have older, smaller-sized warehouses may be candidates into looking to consolidate to a newer, stateof-the-art facility. Also, there is a growth of direct-to-consumer sales led to retailers consolidating fulfillment for online retailing and store-base brick and mortar operations into one DC. Looking forward in Florida, interviews conducted with key developers indicate that the Miami market is beginning to show slight signs of activity leading to some stabilization. Vacancy has now reached 7% and specs are beginning to be built again in Miami-Dade, however they are still waiting for Broward to catch up. Three new sites in Miami include: Prologis, DCT Industrial and KTR Capital which are expected to bring over 750,000 square feet to the Miami-Dade industrial market. Initially, KDR was to build two 150,000 SF warehouses, but decided to combine parcels in order to have the ability to market as one larger space due to a greater demand for that size. In South Florida, the availability of larger parcels is limited. 2 Built to Grow, Journal of Commerce, November 21, Racing Toward Efficiency, Journal of Commerce, November 11, 2011 MARTIN ASSOCIATES Page 35
38 As more industrial warehouse space is absorbed in Miami-Dade and Broward counties and available parcels are depleted, the natural shift would likely move to the north. Overall, real estate developers indicate that the South Florida market, with respect to the retail distribution market, will still compete for accounts up to 300,000 square feet, and maintain that the larger facilities will continue to develop in Central and Northern Florida. The Central Florida market remains sluggish and is not expected to rebound until Aside from the absence of new construction, there is a surplus of vacant space in Central Florida highest vacancy in the state (16-19%), and an abundance of shuffling is expected to occur as retailers, consolidators and 3PLs tweak their supply chain either by consolidating facilities or expanding into new space. With respect to North Florida, Jacksonville is more positioned to serve the North Florida as well as the non-florida Southeast region, and is not viewed as direct competition to South Florida. Few retailers are debating between Jacksonville or Miami site, but more between a Jacksonville and Savannah site. With deeper water at JAXPORT, this port could be positioned as a gateway port competing with Savannah for import distribution center development. In terms of exports, Florida ports compete for the export market that serves Latin America and the Caribbean. While Jacksonville will remain in control of the Puerto Rican market, the South Florida ports will continue to be successful in the Latin American and Caribbean due to the large Latin American business community in South Florida. The FTAs recently signed by the US government between both Panama and Colombia is expected to bolster export activity through these ports in the coming years. The close-knit community of suppliers to the Caribbean and Latin America are strongly rooted in Miami-Dade County, and relocation to other regions does not appear feasible. A key concern of the consolidators is the additional trucking cost and additional lead time that would be incurred if operations were relocated to the north. Also, many of these consolidators also handle air freight, so proximity to the Miami International Airport (MIA) in areas such as Hialeah and Medley is critical. After the Panama Canal is expanded in 2014, it is anticipated that transshipment activity in the Caribbean will continue to flourish. Four ports have traditionally served the Caribbean transshipment operations: Colon (Panama), Caucedo (DR), Freeport (Bahamas) and Kingston (Jamaica). Currently, there are numerous expansions at these facilities as well as other regional developments in Colombia (APL) and Costa Rica (APM Terminals). Transshipment port development is also targeted for Cuba. Recently, there has been interest from retailers to investigate the potential to place offshore DCs in the Caribbean, near key transshipment hubs. These DCs could provide importers the ability to strip the containers at the transshipment site, and then provide additional packaging, racking, etc. services at the Caribbean site prior to reloading into standard marine containers or even into specially designed 53 ft. containers for direct delivery to mainland regional DCs and retail depots to maximize the cubing potential of the lighter weight retail products. If the development of offshore DC were to come to fruition, it MARTIN ASSOCIATES Page 36
39 could impact future decisions regarding Florida, as well as import distribution center development along the Atlantic and Gulf regions. 3. The Importance of Rail in the Success of the Development of Logistics Centers Recently, there have been numerous infrastructure development projects at Florida ports that once implemented, will have significant impacts on not only Florida, but the Southeast Region. These include the authorization and funding for the deepening of the Port of Miami channel, the development of an on-dock rail ICTF at the Port of Miami, the development of a near-dock ICTF at Port Everglades and the development of an on-dock rail at JAXPORT (for which the Port was recently awarded $10 million in TIGER III funds). Also, partnering with CSX and FDOT, the Port of Tampa has started construction on Tampa Gateway Rail Project which will also provide on-dock rail access. As seen from these from these examples, rail is certainly of the utmost of importance to Florida ports moving forward. In addition, CSX has been developing their intermodal facility at Winter Park, and the potential development of the US 27 freight rail corridor is currently under study. The role of Logistics Centers (LCs) in the US has increased in over time. The current developments in rail access at the state of Florida ports follow in the footsteps of ports that have developed on-dock facilities to serve LCs. In order to assess the key elements of success of an LC, Martin Associates developed case studies of key ICTF/LCs in the US. Eleven US locations and railroads for case studies were identified. The case studies of each location include descriptions of the intermodal rail yard for the designated railroad. In several case studies additional intermodal rail yards operated by other Class I railroads were also described. The case studies also describe multiple intermodal yards operated by individual railroads in one location. The case studies focus on the following US locations and railroads: Kansas City, MO NS; Alliance, TX BNSF; San Bernardino, CA BNSF; Joliet, IL BNSF; Louisville, KY NS; Front Royal, VA NS; Harrisburg, PA NS; Charlotte, NC NS; Nashville, TN CSX; Austell, GA NS; and Columbus, OH. Interviews were conducted with city, county, regional and state economic development agencies and Chambers of Commerce to collect quantitative and qualitative MARTIN ASSOCIATES Page 37
40 data on the development of warehouse/dc development and intermodal rail facilities in the designated locations. Data was collected regarding current warehouse/dc developments, future developments and descriptions of local intermodal rail yard facilities. Qualitative assessments of the relationship between the intermodal rail yards and the development of DCs in their respective locations were obtained from the interviews. Private developers of industrial complexes incorporating DC facilities and intermodal rail facilities were also surveyed. The surveys included discussions on planned expansion of building capacity, intermodal rail capacity and lift capacity at the rail yards. Class I railroads were contacted for descriptions of their intermodal rail yards in the ten locations. The case studies are presented in Appendix B. Implications Several areas in the US are experiencing major investments in large industrial park and multi-modal complex developments. These developments are capitalizing on local multi-modal transportation systems that allow the development to serve large broad markets. Characteristics of the large intermodal/logistics complexes are: Large parks of 1,000 acres or more; Development of millions of square feet in DCs, warehouses and other facilities; Intermodal rail yards on hundreds of acres; Access to interstate highways serving markets north to south and east to west; and Air cargo airports. The development of these facilities has the potential to generate significant economic impacts in a local economy. Key examples of large intermodal/logistics complexes are: AllianceTexas the 17,000 acre complex with 6,200 acres developed for industrial use and an additional 6,000 acres that can be developed. This expansion has the potential to increase building capacity by 60 million sf. The on-site BNSF intermodal rail yard has a 600,000 lift capacity than can expand to 1.5 million lifts. Union Pacific also provides boxcar service. The complex is served by three interstate highways and an on-site air cargo airport. Half the tenants at AllianceTexas utilize the BNSF intermodal facility. CenterPoint Intermodal Center-Joliet the 3,200 acre complex opening in 2010 will have a 2,200 acre industrial park with a potential to develop 30 million sf of building space. The complex will also have a 990 acre intermodal rail yard operated by Union Pacific. CenterPoint Intermodal Center-Elwood the 2,200 acre complex includes an 800 acre intermodal rail yard operated by BNSF. The rail yard has been developed on 429 acres and has a lift capacity of 800,000 units. The yard has expansion capacity of 300 additional acres that will enable lift capacity to reach 2 million lifts per year. The Union Pacific also has access to the Elwood center. MARTIN ASSOCIATES Page 38
41 The center has 8 million sf of building space developed and has the potential to expand another 4 million sf. AllianceCalifornia - the 2,000 acre complex has developed and sold 7.7 million sf of building space with plans to expand development by an additional 5.3 million sf. The complex is two miles from the 376 acre BNSF intermodal yard. About 65% of the yard has been developed leaving room for potential expansion. The complex has access to multiple interstate highways and the Roadway and Yellow Freight hubs are nearby. In addition, the developer (Hillman) is also developing the 2.1 million sf InterChange Business Center four miles away. The center is also two miles from the BNSF intermodal yard. International Freight Gateway the 1,340 acre complex in Kansas City that opened in The gateway includes the 370 acre CenterPoint-KCS Intermodal Center and a 970 acre industrial park. The park has the potential for a 7 million sf build-out. Gardner Intermodal Yard the 400 acre BNSF intermodal yard in Kansas City is adjacent to the 600 acre intermodal rail-served Logistics Park Kansas City. Other rail developments in the US include the Heartland Corridor Project will provide significant rail improvements for Norfolk Southern between Norfolk and the Midwest. The Crescent Corridor will provide improved service between the Gulf and North Atlantic, while the National Gateway Project will provide significant transit time improvements for the CSX service connecting New York and Baltimore to key Midwestern points, with a focus on the North Baltimore/Toledo (OH) Intermodal Container Transfer Facility (ICTF). Rail investments by the Kansas City Southern (KCS) and Centerpoint near Rosenberg, TX will provide significant intermodal access into the key manufacturing centers and distribution activity of the Monterey and Saltillo areas of Mexico. Also, near Rosenberg, the Union Pacific is developing an ICTF which will further improve intermodal access into the Midwest from the West Gulf area. As indicated in this section the location of an ICTF appears to be critical in the establishment of a successful logistics center. Based on the review of the past successes of LCs, a critical ingredient is the proximity to a major ICTF. Potential LCs in Florida should consider the proximity to existing or planned ICTFs. Also, ample available land (large parks consist of 1,000 acres or more) to house millions of square feet in DCs, warehouses and other facilities interstate highway access serving regional consumption markets is necessary. 4. Summary of Factors Underlying the Success of Distribution Center Development in Florida The findings of this chapter have identified specific factors that appear to be critical in the successful development of distribution centers, and/or logistics centers, which are essentially clusters of distribution centers capitalizing on economies of scale in MARTIN ASSOCIATES Page 39
42 terms of fixed costs (security, utilities, rail and highway infrastructure). These factors include: Population density; Projected growth in population, representing growth in consumption activity; Concentration of families representing potential consumption activity; and Proximity to major rail and highway infrastructure. Not included in the analysis to date are the logistics costs associated with the location of a DC and/or logistics center. The logistics costs include not only proximity to the markets (i.e. growing population centers and young families representing future consumption potential), but proximity to existing or potential logistics supply chains (i.e. import distribution centers and ports). In addition, land and labor costs also enter into the locational decision, as does minimization of inventory carrying costs. These additional cost factors are evaluated in the following chapter. MARTIN ASSOCIATES Page 40
43 IV. DC Logistics Cost Analysis to Serve Florida Population The focus of this chapter is the development of a logistics cost analysis to determine the optimal location(s) in Florida to serve as potential sites for distribution center/logistics center development. To determine the optimal location of a DC site in Florida, to serve the Florida consumption markets, two scenarios were developed. These scenarios are described as: Scenario 1) the identification of an optimal location to serve the Florida consumption market by a regional DC/logistics center that would serve the retail outlets, regardless of port of entry. This logistics cost analysis factors in lease rates, labor and weighted trucking costs for delivery to Florida consumption markets, and further assumes that retailers will serve the Florida market from the existing supply chain network consisting of ports and import DCs not located in Florida. Scenario 2) this scenario identifies the most optimal port-dc pairing that would serve a smaller-sized specialty/boutique import DC serving the Florida market. The total logistics cost including ocean voyage cost and drayage or rail to DC location as well as lease rate, labor and trucking cost for delivery to Florida consumption markets. This does not consider established logistics chains of large retailers that have already established their central import DC locations. To evaluate these scenarios, the following logistics cost analysis for a 250,000 square foot facility is presented. 1. Logistics Cost Analysis to Serve the Existing Cargo Flows and Logistics Supply Chains in Florida Asia is the major trading partner for Florida for containerized imports. While portions of the Asian cargo consumed in Florida consumption centers has historically moved via the South Florida container ports of Miami and to a lesser extent Port Everglades, much of this imported Asian cargo consumed in these regions has moved by rail from the Port of Savannah and the San Pedro Bay Ports of Los Angeles and Long Beach, specifically: Savannah - containers received at the Port of Savannah and moving directly from the Port to consumption points and regional DCs and depots centers within Florida; West Coast ports - containers imported via the Southern California Ports of Los Angeles and Long Beach; the Pacific Northwest Ports of Seattle and Tacoma and via Oakland. These containers are railed directly from the ports to the consumption points and regional DCs in Florida; and MARTIN ASSOCIATES Page 41
44 Distribution center cargo - this category represents cargo imported via East coast ports, primarily Savannah or West Coast ports into import distribution centers located in the Southeastern United States and then moved via domestic truck (or rail to a limited extent) into Florida to consumption points and/or regional distribution centers and depots. In 2009, the Florida ports handled 38% of the 2.2 million tons of Asian imported containerized cargo into Florida. This represents a potential of 1.4 million tons imported from Asia into Florida that are not moving via Florida ports. The non-florida ports handling this imported containerized cargo from Asia into Florida and the share of imported Asian cargo into Florida they moved in 2009 were: 39% moves via West Coast Ports (36% via Los Angles and Long Beach); 13% moves directly via Savannah; 4% from New York; and 2% from Charleston. Furthermore, in 2009, the Florida Ports handled 70% of the 3.1 million tons of non-asian imported cargo moving into Florida. This represents an additional 945,300 tons of potential containerized cargo not now handled by Florida ports. The ports handling these containers into Florida were: 7% moves via New York; 6% via Los Angeles and Long Beach; 3% from Savannah; 3% from Charleston; and 2% each from New Orleans, Houston, New Orleans, Philadelphia and Norfolk. This excludes international cargo (primarily Asian cargo) moving via truck into Florida from DC origins such as Savannah and Atlanta, which was estimated at 8.8 million tons or 1 million TEUs. 4 To detail these truck movements, Exhibit 21 presents the top 20 origins of containerized truck traffic into Florida. Distribution centers in Atlanta, Savannah, and New York are evident in this listing of key truck origins. Under the existing scenario, it is assumed that these origins of truck moves will remain constant, and the Florida ports will continue to under serve the Florida consumption markets. 4 Florida Trade and Logistics Study, Florida Chamber of Commerce Foundation and Florida Department of Transportation, by Cambridge Systematics and Martin Associates MARTIN ASSOCIATES Page 42
45 Exhibit 21 Top 20 County Origins of Retail/Wholesale Truck Cargo into Florida Sum of TRUCKS Origin County (non-florida) Total Atlanta, GA 58,771 New York, NY 50,490 New Orleans, LA 27,112 Savannah, GA 25,526 Albany, GA 25,158 Los Angeles, CA 23,254 Chicago, IL 22,023 Dallas-Fort Worth, TX 16,263 Jackson, MS 15,538 Cedar Rapids, IA 14,310 Pittsburgh, PA 13,227 Houston, TX 12,119 Baltimore, MD 11,634 Buffalo, NY 11,340 Cleveland, OH 10,545 Raleigh, NC 10,354 Cincinnati, OH 10,277 Nashville, TN 10,249 Huntsville, AL 9,734 Charlotte, NC Source: Florida Trade and Logistics Study, ,553 Exhibit 22 demonstrates that Miami-Dade County is the largest destination market for non-florida retail truck movements into the state, followed by Duval, Hillsborough, Orange and Broward counties. As expected, these locations reflect the concentration of population, as well as distribution centers. Exhibit 23 quantifies the number of out-of state retail goods truck moves received by Florida County. MARTIN ASSOCIATES Page 43

46 Exhibit 22 Retail/Wholesale Truck Cargo Flows into Florida by County Exhibit 23 Destinations of Retail/Wholesale Truck Flows by Flroida County Number of Trucks Destination County MARTIN ASSOCIATES Page 44 Total Miami-Dade County, FL 246,633 Duval County, FL 64,213 Hillsborough County, FL 60,482 Orange County, FL 59,845 Broward County, FL 41,013 Palm Beach County, FL 23,521 Pinellas County, FL 23,202 Polk County, FL 22,242 Bay County, FL 12,509 Escambia County, FL 11,450 Lee County, FL 10,437 Seminole County, FL 10,173 Brevard County, FL 9,200 Hernando County, FL 8,615 Volusia County, FL 8,160 Marion County, FL 6,423 Manatee County, FL 6,252 Leon County, FL 5,918 Okaloosa County, FL 5,657 Lake County, FL 5,290 Source: Florida Trade and Logistics Study, 2010 The following analysis presents the identification of optimal locations to serve the Florida consumption market by a regional DC/depot that would serve the retail outlets, regardless
47 of port of entry (Scenario 1). This logistics cost analysis factors in lease rate, labor and weighted trucking cost for delivery to Florida consumption markets, and assumes that retailers will serve the Florida market from the existing supply chain network consisting of ports and import DCs. First, potential DC locations in Florida were identified. The DC locations included in this analysis are Hialeah, Medley, Lake Okeechobee, Orlando and Jacksonville. The corresponding lease rate information was obtained from CBRE Market View reports Q (for detail see Exhibit 20). Again, since published data does not exist for rural Palm Beach County, lease rates were blended with existing Palm Beach, Orlando and South Florida rates as published by CBRE statistics. Separate annual lease rates per square foot were then developed for 250,000 square foot facilities. Adjustments were made to account for inconsistencies between NNN 5 and industrial gross lease rates. These annual lease rates for each size DC were divided by the average number of inbound and outbound loads for each respective DC size. The average number of inbound and outbound loads was based on interviews conducted with DC operators as well as Martin Associates in-house data bases. Wages for warehouse labor were obtained for each potential DC location from the Bureau of Labor (BLS) Occupational Statistics of - Mean Hourly Wage. The wage was calculated on a weighted average of: Laborers and Freight, Stock, and Material Movers, Hand; First Line Supervisor of Helpers, Laborers, and Material Movers, Hand; and Transportation, Storage, Distribution Managers. Next, a weighted average truck distance was developed (based on PC Miler) to serve retail/wholesale markets from each DC location Hialeah, Medley, Lake Okeechobee, Orlando and Jacksonville. Exhibit 24 identifies and illustrates the top 11 markets that were used in developing this weighted average. The top 11 markets account for 73% of the consuming Florida population. 5 A triple net lease (Net-Net-Net or NNN) is a lease agreement on a property where the tenant or lessee agrees to pay all real estate taxes, building insurance, and maintenance on the property in addition to any normal fees that are expected under the agreement (rent, premises utilities, etc.). In such a lease, the tenant or lessee is responsible for all costs associated with the repair and maintenance of any common area. MARTIN ASSOCIATES Page 45
48 Exhibit 24 - Florida Consumption Markets used to Develop Weighted Truck Averages Consumption Market Population Percent 1 Hillsborough/Pinellas/Polk Counties 2,710, % 2 Miami-Dade County 2,476, % 3 Ft. Lauderdale (Broward County) 1,742, % 4 Orlando (Lake/Orange Counties) 1,404, % 5 Palm Beach County 1,286, % 6 Brevard/Volusia Counties 1,061, % 7 Jacksonville (Duval County) 899, % 8 Ft. Myers (Lee County) 616, % 9 Ocala/Gainesville (Alachua/Marion Counties) 588, % 10 Treasure Coast (Indian River/Martin/St. Lucie Counties) 560, % 11 Tallahassee (Leon County) 274, % Total 13,621, % Total Florida Population (2010) 18,773,356 Top 11 Markets Percent of Population 73% Source: Florida Demographic Estimating Conference, January 2010 and the Florida Demographic Database, August, 2010 The final step in the analysis was to develop the cost of moving the retail/wholesale goods into the potential DC/logistics center locations in Florida. Under existing logistics chains, cargo is trucked into Florida from origins throughout the US. Top origins of this cargo include Atlanta, New York, New Orleans, Savannah and Albany (GA) as depicted earlier in Exhibit 21. This truck move into Florida represents another leg of logistics chain to serve the retail market in Florida. In order to consider the total inland logistics cost including from the US point of origin, the top 75 percent of the total truck trips into Florida from non-florida origins were weighted based on number of trips and weighted cost to move the cargo to each Florida DC site and added to the lease, labor and weighted truck costs to serve Florida population. When the total inland cost is applied, a DC site in the Jacksonville/Duval County area is the most cost effective location to serve the Florida population, with an Orlando/I-4 Corridor site also competitive. A Jacksonville/Duval County site offers the lowest total logistics cost to serve the Florida consumption market, when the non- Florida sources of the retail and warehouse cargo are considered in the analysis. However, a site in the Orlando/I-4 Corridor would provide a very competitive logistics cost within $50 per truck load of the total logistics cost using a Duval County location. MARTIN ASSOCIATES Page 46
49 Exhibit 25 Logistics Cost per Full Truckload Inland Origin to DC Location to Florida Consumption Market (250,000 SF Facility) Least Cost Routing Highlighted in Yellow DC SITE - ORLANDO/I-4 CORRIDOR DC Square Footage 250,000 Total Cost via Truck $3,030 DC SITE - JACKSONVILLE/DUVAL COUNTY DC Square Footage 250,000 Total Cost via Truck $2,953 DC SITE - HIALEAH DC Square Footage 250,000 Total Cost via Truck $3,669 DC SITE - MEDLEY DC Square Footage 250,000 Total Cost via Truck $3,695 DC SITE - LAKE OKEECHOBEE DC Square Footage 250,000 Total Cost via Truck Source: Martin Associates $3, Logistics Cost Analysis to Serve the Florida Consumption Market with Florida Ports and a New Logistics Supply Chain With respect to the development of new logistics chains and the use of Florida ports to serve the Florida markets (Scenario 2), the following methodology was used to estimate the ability of the Florida ports to compete on a cost basis to serve the Florida market. The methodology incorporates the same factors previously described in Scenario 1 (lease rates, labor costs and drayage to the weighted Florida consumption markets) in conjunction with ocean voyage costs from overseas port to US port of entry and the inland transportation (truck or rail) from port of entry to the DC location as detailed below. Ocean voyage costs were developed for an Asian trade lane to the Ports of Miami, Port Everglades, Tampa, Jacksonville and Savannah. Martin Associates voyage cost model was used to estimate the voyage costs of calling each port. The Martin Associates voyage costing model for a 4,800 TEU vessel was calibrated for each port and each trade lane. It was assumed that the vessel was deployed on a direct routing, and further that 800 containers were discharged at each port. Productivity and vessel turn time was assumed equal at each port. The cost analysis included voyage costs by trade lane, terminal costs, and port costs via each port. The Martin Associates voyage costing MARTIN ASSOCIATES Page 47
50 model, has been used by Martin Associates to estimate the national economic benefits of channel deepening and maintenance dredging projects for approval by the US Army Corps of Engineers; to evaluate fleet deployment and equipment utilization strategies for ocean carriers; to develop and define competitive market strategies for public port authorities; and to assess the impact on transportation costs of the use of larger vessels, by specific trade lanes. The key inputs into the voyage costing model are: Vessel Type; Vessel Flag of Registry; Vessel Speed (knots): Design Speed; Operating Speed; Design Draft; Constrained Draft; TPI (tons per inch of dispersion) due to draft constraints; Load Port; Mileage for entire route; Port days (based on vessel load/discharge rate and ports of call on a voyage); Use of Panama, Suez Canal; Canal Fees; Vessel Capital Costs: Capital repayment; Vessel Operating Costs: Crew wages; Maintenance and repair; Insurance; and Miscellaneous. The values of the inputs are derived from several sources. The deadweight tonnage and flag of registry are first developed. On average, a 4,800 TEU container ship represents the type of vessels currently deployed on the East Coast and Gulf Coast routings. These vessels are typically foreign flag vessels, since the operating costs, particularly crew costs, are significantly less than the crew costs on US flag vessels. A 4,800 TEU vessel typically has a design draft which is consistent with most container port capabilities on the East and Gulf Coast, and is compatible with the current depth dimension of the Panama Canal. It is to be emphasized that with an expanded Panama Canal (as well as increased Suez routings), and the ability of vessels in excess of 7,000 TEUs to transit the Canal, a 50-foot channel depth will be necessary to accommodate these vessels at first-inbound ports. Furthermore, the ability to use a larger vessel 7,000+ TEU vessels versus a 4,800 TEU vessel will provide significant cost savings per container. The values for operating costs and capital costs as well as design speed, TPI, design draft, etc. are obtained from the US Army Corps of Engineers Deep Draft Self MARTIN ASSOCIATES Page 48
51 Propelled Vessel Cost Data Base, while current bunker fuel prices are from Bunker World. Also, port and terminal charges were assumed equalized for the Florida ports. Next, drayage and trucking rates were developed for each port-dc location pairing. Weighted cost per mile truck rates with current fuel surcharge rates (34%) were developed from interviews with trucking companies and Martin Associates in-house data base. Mileages from port to DC locations were developed from PC Miler. Intermodal rates used in this analysis (where applicable) were developed from averages of data collected from various sources including the Surface Transportation Board (STB) 1% Waybill Sample, Intermodal Department of Ocean Carriers, and Martin Associates inhouse data bases. Intermodal lift charges and drayage rates were applied to ports that do not have on-dock rail access. With respect to Scenario 2, when using a Florida port/import DC combination, the DCs in the Miami area, Hialeah and Medley, provide the least cost routing to serve the Florida market, paired with a South Florida port routing, for imported Asian cargo. Exhibit 26 - Total Logistics Cost per Container to Serve Florida Retail Markets By DC Location on Asian Routing 250,000 SF Least Cost Routing Highlighted in Yellow DC SITE - ORLANDO/I-4 CORRIDOR Port of Entry, Vessel Size Miami 4800 Miami 7000 PEV 4800 JAXPORT 4800 Tampa 4800 Savannah 4800 LA/LB 6000 DC Square Footage 250, , , , , , ,000 Total Cost via Truck $3,564 $3,178 $3,468 $3,361 $3,162 $3,723 Total Cost via Rail $3,818 $3,432 $3,781 $3,819 $3,327 DC SITE - JACKSONVILLE/ Port of Entry, Vessel Size Miami 4800 Miami 7000 PEV 4800 JAXPORT 4800 Tampa 4800 Savannah 4800 Savannah 4800 DC Square Footage 250, , , , , , ,000 Total Cost via Truck $4,115 $3,730 $4,014 $3,312 $3,755 $3,592 $3,592 Total Cost via Rail $4,063 $3,678 $3,999 $3,236 DC SITE - HIALEAH Port of Entry, Vessel Size Miami 4800 Miami 7000 PEV 4800 JAXPORT 4800 Tampa 4800 Savannah 4800 Savannah 4800 DC Square Footage 250, , , , , , ,000 Total Cost via Truck $3,147 $2,761 $3,155 $3,993 $3,753 $4,345 $4,345 Total Cost via Rail $3,147 $2,761 $3,885 $3,972 $3,856 DC SITE - MEDLEY Port of Entry, Vessel Size Miami 4800 Miami 7000 PEV 4800 JAXPORT 4800 Tampa 4800 Savannah 4800 Savannah 4800 DC Square Footage 250, , , , , , ,000 Total Cost via Truck $3,139 $2,759 $3,181 $4,015 $3,779 $4,371 $0 Total Cost via Rail $3,139 $2,759 $3,907 $3,999 $0 DC SITE - LAKE OKEECHOBEE Port of Entry, Vessel Size Miami 4800 Miami 7000 PEV 4800 JAXPORT 4800 Tampa 4800 Savannah 4800 Savannah 4800 DC Square Footage 250, , , , , , ,000 Total Cost via Truck $3,304 $2,588 $3,259 $3,846 $3,398 $4,203 $4,203 Total Cost via Rail $3,289 $2,573 $3,772 $3,963 $3,877 Source: Martin Associates Under Scenario 2 which assumes a new import logistics chain to serve the Florida market with a Florida port and DC location, a South Florida DC with a South Florida port provides the lowest logistics cost for Asian imported cargo consumed in Florida, followed by the combination of an Orlando/I-4 DC and a Gulf Coast port. It is to be emphasized that this analysis focuses only on serving the Florida consumer market, not the Southeast consumer base beyond Florida. However, as this table suggests, all MARTIN ASSOCIATES Page 49
52 three Florida port ranges can provide a more cost effective routing to serve the Florida consumption market than Savannah and intermodal land bridge from Los Angeles/Long Beach In addition, the logistics cost analysis under Scenario 2 with the development of a new import logistics supply chain examines the cost savings to serve the Florida market with the deepening of the Miami channel to -50 feet. The column highlighted in orange shows the cost savings due to the Port of Miami s ability to handle a fully-laden 7,000 TEU vessel. With the use of a deeper draft vessel that will likely be deployed on a first in-bound routing, the cost advantage of the use of a South Florida port and local import DC enhances the cost effectiveness of a South Florida port/dc combination. It should be noted that at the time of this report, Miami is the only Florida port authorized and funded to deepen. However, other ports in Florida, JAXPORT and Port Everglades, as well as Savannah, are currently under review by the US Army Corps of Engineers to determine authorization. It is to be emphasized that this analysis focuses only on serving the Florida market, not the entire Southeastern US with a Florida Port and DC location. The scope of this study does not include analysis beyond Florida, such as the location of a Florida port/dc combination to serve as a Southeastern US logistics hub. If the scope were expanded to include the development of an import distribution center to serve Florida and the Southeastern US markets, the optimal port pairing and DC location would most likely differ, and a Northern Florida port routing with a 45-50ft. channel would become competitive with the South Florida ports as well as Savannah. MARTIN ASSOCIATES Page 50
53 V. Potential Distribution Center Demand/Absorption in Florida In this chapter, an estimate of the potential demand for distribution center space is developed. It is to be emphasized that no estimate is made for potential demand by specific type of activity, as this is outside the scope of the study. The focus of the analysis is to convert projected retail/wholesale consumption activity into the demand for retail distribution. The potential absorption forecast for DC square footage in Florida is generated by developing relationships between population and current warehouse distribution space in Florida. Currently, the CB Richard Ellis MarketView Reports (Q3 2011) identify 540 million square feet of warehousing and distribution square footage in the seven Florida key markets as presented in Exhibit 27. In comparison, the Atlanta market currently contains 387 million square feet of bulk warehouse space. Exhibit 27 Current Florida Industrial Square Footage by Type (in millions of SF) Industrial Market Manufacturing R&D/Flex Whse/Distribution Other Total Palm Beach Miami Broward Tampa Bay Orlando Jacksonville Polk County Total Florida Major Markets (Q3) CB Richard Ellis, MarketView Report Source: CB Richard Ellis To estimate the future potential demand for warehouse and distribution center space, the relationship of current Florida DC space to Florida population was estimated and was then grown at the Florida population growth forecast of 1.2% annually through The incremental demand for new retail/wholesale DC square footage that will be absorbed in Florida is estimated from the current base of 540 million square feet, assuming a full utilization of the current supply. The demand forecast for additional distribution center square footage is shown in Exhibit 28. MARTIN ASSOCIATES Page 51


54 Exhibit 28 Florida Distribution Center Potential Additional Demand/Absorption Additional Square Feet (Millions) Source: Martin Associates This analysis suggests that there is a demand of approximately 145 million square feet of distribution center space in Florida by This represents a 27% growth over the current 540 million square feet in Florida. It is to be emphasized that the incremental growth in this analysis assumes the full utilization of the existing 540 million square feet in Florida. It is apparent that over time, as Miami-Dade and Broward Counties become more densified and constrained, that a northbound progression of development will occur. At this time, it is difficult to speculate the amount of square footage that will be absorbed by each market as location decisions will be made on a case-by-case basis by DC operators/retailers based on current and future distribution and logistics plans, and the types of facilities necessary to serve each individual companies needs. However, based on distribution of population, it appears that 30%-35% of the total 145 million square feet could be absorbed in South Florida, if the South Florida market can be cost competitive with the North and Central Florida regions. This translates into a potential demand for about 44 to 50 million square feet of distribution center space in Southern Florida by The future location of DCs will be influenced by the cost of available land and lease rates, labor costs, transportation infrastructure and transportation costs to key domestic logistics supply chains of the suppliers or with the use of Florida ports under a new import supply chain. The private sector developers, combined with the availability of land parcels will determine optimal site location. The combination of Florida ports and used for the import of a specific product line and the share of product line to serve the Florida market supplied by non-florida ports and DC locations, combined with land, labor and distribution costs will be critical in driving the location of a DC or Logistics MARTIN ASSOCIATES Page 52
55 Center. Once these logistics factors have been considered, interviews with developers have indicated that tax incentives and other potential county and state subsidies will often drive the ultimate locational choice. MARTIN ASSOCIATES Page 53
56 VI. Economic Impact of Distribution Activity The findings of the market analysis estimate the demand/absorption for additional DC activity. This analysis focuses on the economic impacts of the development of the potential DC square footage forecasted for Florida. The study employs a methodology and definitions that have been used by Martin Associates to measure the economic impacts of seaport and airport activity at more than 250 ports and airports in the United States and Canada. The Martin Associates economic impact model has been used extensively in Florida, including cargo and cruise impact analyses for the Port of Palm Beach, Port Everglades, Port of Tampa, Jaxport and the Port of Miami. It is to be emphasized that only measurable impacts are included in this study. In order to ensure defensibility, the Martin Associates approach to economic impact analysis is based on data developed through an interview program and extensive in-house data bases of the Port communities tenants. Specific re-spending models have been developed for the South Florida area to reflect the unique economic and consumer profiles of the regional economy. To further underscore the defensibility of the study, standardized input-output models are not used. Instead, the resulting impacts reflect the uniqueness of the individual LC operations, as well as the surrounding regional economy. 1. Impact Definitions Distribution center activity contributes to the local and regional economy by generating business revenue to local and national firms providing distribution and cargo handling services at the facility. These firms, in turn, provide employment and income to individuals, and pay taxes to state and local governments. Exhibit 29 shows how activity at a distribution center complex generates impacts throughout the local, state and national economies. As this exhibit indicates, the impact of a distribution center facility on a local, state or national economy cannot be reduced to a single number, but instead, the distribution activity creates several impacts. These are the revenue impact, employment impact, personal income impact, and tax impact. These impacts are non-additive. For example, the income impact is a part of the revenue impact, and adding these impacts together would result in double counting. MARTIN ASSOCIATES Page 54
57 Exhibit 29 - Flow of Economic Impacts Generated by Distribution Activity DC Activity Business Revenue Payroll Retained Earnings, Dividends & Investments Local Purchases Direct Jobs Re-spending Induced Jobs Indirect Jobs State & Local Taxes At the outset, distribution activity generates business revenue for firms which provide services. This business revenue impact is dispersed throughout the economy in several ways. It is used to hire people to provide the services, to purchase goods and services, and to make Federal, state and local tax payments. The remainder is used to pay stock-holders, retire debt, make investments, or is held as retained earnings. It is to be emphasized that the only portions of the revenue impact that can be definitely identified as remaining in the local economy are those portions paid out in salaries to local employees, for local purchases by individuals and businesses directly dependent on the facility, in contributions to state and local taxes and in lease payments by tenants. The employment impact of distribution activity consists of three levels of job impacts: Direct employment -- jobs directly generated by distribution activity. Direct jobs generated by this activity include warehousemen, dispatchers, yard jockeys located at the DC and line haul trucking companies moving cargo between inland origins and destinations and the DC terminals. It is to be emphasized that these are classified as directly generated in the sense that these jobs would experience near term dislocation if the activity at the LC were to be discontinued. Induced employment -- jobs created throughout the local economy because individuals directly employed due to distribution activity spend their wages locally on goods and services such as food, housing and clothing. These jobs are held by residents located throughout the region, since they are estimated based on local and regional purchases. MARTIN ASSOCIATES Page 55
58 Indirect Employment -- are jobs created locally due to purchases of goods and services by firms, not individuals. These jobs are estimated directly from local purchases and include jobs with local office supply firms, maintenance and repair firms, parts and equipment suppliers, etc. Personal income impact consists of employee wages and salaries (excluding benefits) received by individuals directly employed due to distribution center activity. Re-spending of these earnings throughout the regional economy for purchases of goods and services is also estimated. This, in turn, generates additional jobs -- the induced employment impact. This re-spending throughout the region is estimated using a regional personal earnings multiplier, which reflects the percentage of purchases by individuals that are made within the South Florida area. The re-spending effect varies by region -- a larger re-spending effect occurs in regions that produce a relatively large proportion of the goods and services consumed by residents, while lower re-spending effects are associated with regions that import a relatively large share of consumer goods and services (since personal earnings "leak out" of the region for these out-of-region purchases). The direct earnings are a measure of the local impact since they are received by those directly employed by LC distribution activity. Business revenue consists of total business receipts by firms providing services in support of the distribution activity. Local purchases for goods and services made by the directly impacted firms are also measured. These local purchases by the dependent firms create the indirect impacts. State and local taxes include taxes paid to the state and local governments by firms and by individuals whose jobs are directly dependent upon and supported (induced jobs) by activity at the LC facility. The impacts presented in this report are measured in terms of: Jobs (direct, induced and indirect); Personal income; Business revenue; and State and local taxes. 2. Methodology The direct impacts of the potential distribution center activity presented in this report are estimated based on interviews with industrial developers, Florida warehouse operators/consolidators, current Florida DC operators and trucking/drayage companies. Since tenants are not currently occupying the facility and actual employment figures are not available, direct job impact ratios and relationships are developed from the interview process. Key relationships used in this analysis include: MARTIN ASSOCIATES Page 56
59 A weighted average of 450 FTE (full-time equivalent) jobs per million square feet of distribution space; An average of 150 inbound loads per day per million square feet of DC space; and An average truck driver makes 1-2 trips per day. In addition, salary and expenditure data was also obtained from an extensive inhouse data base that has been developed over previous economic impact studies conducted for Florida seaport warehousing and consolidation activities. These ratios are then applied to the DC demand forecast presented in the previous chapter to develop the direct impacts. The induced impacts are based on the current expenditure profile of residents in the South Florida area, as estimated by the US Bureau of Labor Statistics, "Consumer Expenditure Survey". This survey indicates the distribution of consumer expenditures over key consumption categories for South Florida area residents. The consumption categories are: Housing; Food at Restaurants; Food at Home; Entertainment; Health Care; Home Furnishings; and Transportation Equipment and Services. The estimated consumption expenditure generated as a result of the respending impact is distributed across these consumption categories. Associated with each consumption category is the relevant retail and wholesale industry. Jobs to sales ratios in each industry are then computed for the South Florida area, and induced jobs are estimated for the relevant consumption categories. It is to be emphasized that induced jobs are only estimated at the retail and wholesale level, since these jobs are most likely generated in the South Florida area. Further levels of induced jobs are not estimated since it is not possible to defensibly identify geographically where the subsequent rounds of purchasing occur. The Consumer Expenditure Survey does not include information to estimate the job impact with supporting business services, legal, social services, state and local governments, and educational services. To estimate this induced impact, a ratio of State of Florida employment in these key service industries to total State of Florida employment is developed. This ratio is then used with the direct and induced consumption jobs to estimate induced jobs with business/financial services, legal, educational, governmental and other social services. The indirect impacts are estimated based on the local purchases by the directly dependent firms, combined with indirect job, income and revenue coefficients for the MARTIN ASSOCIATES Page 57
60 supplying industries in the State of Florida as developed for Martin Associates by the US Bureau of Economic Analysis, Regional Input/Output Modeling System. 3. Economic Impacts of Distribution Center Activity The economic impacts of the distribution center/logistics center activity are presented in Exhibit 30. Exhibit 30 - Economic Impact Summary of Potential DC Demand/Absorption ESTIMATED ECONOMIC ACTIVITY OF DISTRIBUTION CENTER ACTIVITY JOBS DIRECT JOBS 18,158 40,712 62,410 82,909 INDUCED JOBS 8,266 18,532 28,409 37,740 INDIRECT JOBS 12,852 28,816 44,174 58,683 TOTAL JOBS 39,276 88, , ,332 PERSONAL INCOME (1,000) DIRECT $590,135 $1,323,140 $2,028,325 $2,694,543 INDUCED/RESPENDING $1,168,467 $2,619,817 $4,016,084 $5,335,194 INDIRECT $436,877 $979,521 $1,501,570 $1,994,772 TOTAL INCOME $2,195,479 $4,922,478 $7,545,979 $10,024,509 STATE AND LOCAL TAXES (1,000) STATE TAXES $92,605 $207,630 $318,289 $422,834 LOCAL TAXES $69,860 $156,633 $240,113 $318,980 TOTAL TAXES $162,465 $364,263 $558,402 Source: Martin Associates $741,814 As illustrated in the previous exhibit, given the demand forecast scenarios, the distribution center activity by 2030 would generate between 179,332 total jobs. Of these jobs, 82,909 jobs would be directly created on site and with truckers moving goods directly to/from the DC. This compares to a 2009 estimate that Florida employment in trade, logistics, and warehousing totaled 531,000 people in In total, the direct, induced and indirect jobholders would generate $10.0 billion of personal income as the result of distribution center operations. By 2030, as a result of the distribution activity a total of $741.8 million of state and local tax revenue would be generated annually. 6 Florida Trade and Logistics Study, February, 2011 MARTIN ASSOCIATES Page 58
61 VII. Summary of Conclusions/Implications Key findings of this analysis are: The Florida industrial real estate market has suffered dramatically due to the effects of the economic downturn. The Miami market is beginning to show slight signs of activity leading to some stabilization. Vacancy has now reached 7% and specs are beginning to be built again in Miami-Dade County. However, Broward County is recovering more slowly. In South Florida, the availability of larger parcels is limited and retailers interested in larger parcels greater than 250,000 square feet Class A space will be challenged to find such property. The South Florida market, with respect to the retail distribution market, will still compete for accounts up to 300,000 square feet, and maintain that the larger facilities will continue to develop in Central and Northern Florida. The Central Florida market is still sluggish and not expected to rebound until Aside from the absence of new construction, there is a surplus of vacant space in Central Florida, which has the highest vacancy in the state, and an abundance of shuffling is expected to occur as retailers, consolidators and third party logistics providers (3PLs) tweak their supply chains either by consolidating facilities or expanding into new space. In North Florida, Jacksonville is more positioned to serve the North Florida as well as the non-florida Southeast region, and is not viewed as direct competition to South Florida. Few retailers are debating between Jacksonville or Miami site, but more between a Jacksonville and Savannah site. Dynamic changes in the import logistics patterns that have occurred since 2002 to serve the Southeastern, Eastern, Gulf and Midwestern markets have resulted in potential opportunities to grow the role of Florida in the international logistics industry. This includes the development of distribution centers and logistics parks to serve the Florida consumption markets, as well as increasing the role of Florida s ports in attracting imports that are now consumed in Florida, but imported via other non- Florida ports. Growth in Florida s role in the logistics industry role will provide an economic catalyst to create additional logistics industry related employment within the State. In terms of exports, Florida ports compete for the export market that serves Latin America and the Caribbean. While Jacksonville will remain in control of the Puerto Rican market, the South Florida ports will continue to be successful in the Latin American and Caribbean due to the large Latin American business community in South Florida. The Free Trade Agreements (FTAs) recently signed by the US government between Panama and Colombia (as well as South Korea) are expected to bolster export activity through these ports in the coming years. The close-knit community of suppliers to the Caribbean and Latin America are strongly rooted in Miami-Dade County, and relocation to other regions does not appear feasible. Specific factors that appear to be critical in the successful development of distribution centers, and/or logistics centers, which are essentially clusters of MARTIN ASSOCIATES Page 59
62 distribution centers capitalizing on economies of scale in terms of fixed costs (security, utilities, rail and highway infrastructure) include population density; projected growth in population, representing growth in consumption activity; concentration of families representing potential consumption activity; and proximity to major rail and highway infrastructure. Based on the logistics cost analysis, the optimal site location to serve the Florida consumer market, under the current logistics supply chain to serve the Florida consumption market, is the Jacksonville/Duvall County region, followed by a site located in the Orlando/I-4 Corridor. This assumes that the current logistics chain remains intact, and the focus is on the development of a DC/logistics center to serve the Florida consumption market. This cost analysis includes components of lease rate, labor cost, weighted truck cost to serve the Florida consumption base, and the inland cost of truck cargoes destined to Florida from non-florida origins. Assuming a new logistics chain using Florida ports for import, a South Florida DC with a South Florida port provides the lowest logistics cost for Asian imported cargo consumed in Florida (compared to the current system of using non- Florida ports). It is to be emphasized that this analysis focuses only on serving the Florida consumer market, not the Southeast consumer base beyond Florida. All three Florida port ranges South, North and Gulf - can provide a more cost effective routing than the current use of the Port of Savannah and intermodal land bridge routings from the Ports of Los Angeles and Long Beach. It is to be emphasized that development in North and Central Florida under current logistics chains and the potential to attract DC activity based on new import logistics chains can be accomplished simultaneously. Each DC operator or beneficial cargo owner (BCO) will make locational decisions based on their own unique logistics chains. Certain port and DC pairings may be more advantageous for a specific BCO than another. Given future infrastructure improvements such as dredging and on-dock/neardock ICTFs, all port ranges in Florida will have the ability to compete to attract accounts that can serve the Florida consumption market from different DC locations. For example, a retailer that modifies a portion of its logistics supply chain to use Florida ports for a specific line of product, while using non-florida ports for other product lines would maximize its location of a distribution center somewhere between a South Florida Port/DC combination, a Gulf Coast Florida Port/DC location and a Northeastern Florida location. The exact location within Florida, and port used will be driven by the mix of products using Florida ports versus non-florida ports and more northern distribution centers such as in Savannah or Atlanta. In addition, tax incentives will play a further determining factor as to the ultimate locational decision. The Port of Miami s ability to handle a fully-laden vessel in excess of 7,000 TEUS once the channel is deepened to 50 feet will enhance the competitiveness of using a South Florida port and local DC combination. With the use of a deeper draft vessel that will likely be deployed on a first call inbound routing, the cost advantage of the use of a South Florida port and local import DC is enhanced. Miami is currently the MARTIN ASSOCIATES Page 60
63 only Florida port authorized and funded to deepen its channel to 50 ft. The deepening of other ports in Florida, particularly JAXPORT and Port Everglades, as well as Savannah, are currently under review by the US Army Corps of Engineers to determine authorization for a deeper channel. Should these ports succeed in receiving authorization, then the deeper channel at Miami will allow that port and a South Florida distribution center to still remain competitive with the other port ranges in serving the Florida market. With deeper channels at JAXPORT and Port Everglades, these ports would increase their competitive position with respect to Savannah not only in terms of cost savings to serve the Florida consumption market, but also to compete as regional distribution centers for the Southeastern US consumption markets. Ultimately, port investment in Florida is necessary. Specifically, the dredging of the Miami channel to -50 feet, the construction of on-dock rail, and the Port of Miami access tunnel position the Port of Miami to market to carriers the Port s ability to handle a first inbound port call, requiring the 50 foot channel and the on-dock rail to move the containers intermodally. The development of an ICTF at Port Everglades is critical to compete not only with other non-florida ports, but with the development of transshipment ports and off-shore distribution center development in the Caribbean. The deepening of the St. Johns River to a draft adequate to accommodate a first in-bound port call at the JAXPORT marine cargo terminals is necessary in order to maximize the ability of the Port to serve as a Southeastern US distribution hub, and attract cargo activity and distribution center activity that would otherwise move via Savannah. Without deepening the St, John River, and the development of an ICTF, the significant capital investment made by an Asian carry/terminal operator along with JAXPORT s investment will not result in the economic development impact as planned. The location of an ICTF appears to be critical in the establishment of a logistics center (LC). Based on the review of the past successes of LCs, a critical ingredient is the proximity to a major rail Intermodal Container Transfer Facility (ICTF). This suggests that the development of an LC in Florida should consider the proximity to an existing or planned ICTF. Also, ample available land (large parks consist of 1,000 acres or more) to house millions of square feet in DCs, warehouses and other facilities interstate highway access serving regional consumption markets is necessary. An assessment of the demand for retail consumption in Florida indicates that there is potential for an additional 145 million square feet of distribution center space in Florida by This represents a 27% growth over the current 540 million square feet of space in Florida. The incremental demand for new retail DC square footage that will be absorbed in Florida is estimated from the current base of 540 million square feet, assuming a full utilization of the current supply. At this time, while it is difficult to speculate the amount of square footage that will be absorbed by each market as location decisions will be made on a case-by-case basis by DC operators/retailers, it is expected that the South Florida market could absorb 30%-35% of the total 145 million square feet projected through the study period, if the South Florida market can cost effectively compete against North and Central Florida regions. This suggests that by MARTIN ASSOCIATES Page 61
64 2030, demand for distribution center space in South Florida will range between 44 and 50 million square feet, assuming current space is fully utilized. Future locational decisions will consider current and future distribution and logistics plans, and the types of facilities necessary to serve each individual company s needs. The future location of these DCs will be influenced by the cost of available land and lease rates, labor costs, transportation infrastructure and transportation costs to key consuming markets and from key supplying regions and ports. In addition, incentives by county, state and local governments such as tax subsidizations will also be key factors in the ultimate location of a distribution center/logistics center. It is very important to emphasize that the process of the location of distribution center locations should be driven by the private sector. The State should be cautioned against investing or committing infrastructure investment until private sector decisions and commitments are made. Investment in transportation infrastructure to serve specific land sites in the context of build and they will come may lead to inefficient use of State funds. Rather, state infrastructure investments should be developed as part of an incentive package once private sector development has been committed. MARTIN ASSOCIATES Page 62


65 Appendix A - Location of Distribution Center Activity by Industry: (Source: Chain Store Guide, September 2010; Red markers indicate that at least 1 DC at that location; multiple DCs may locate in one location, but be represented by one marker) Apparel and Specialty Stores Chain Restaurant Operations Drug Stores and HBC MARTIN ASSOCIATES Page 63

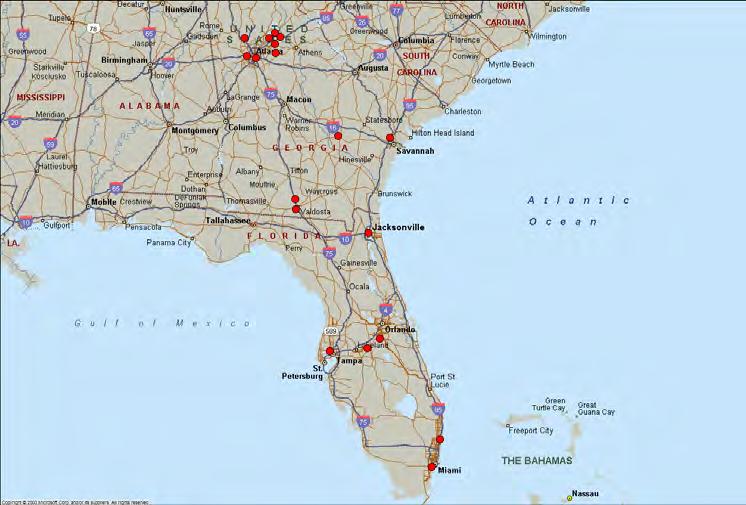
66 Home Center MARTIN ASSOCIATES Page 64
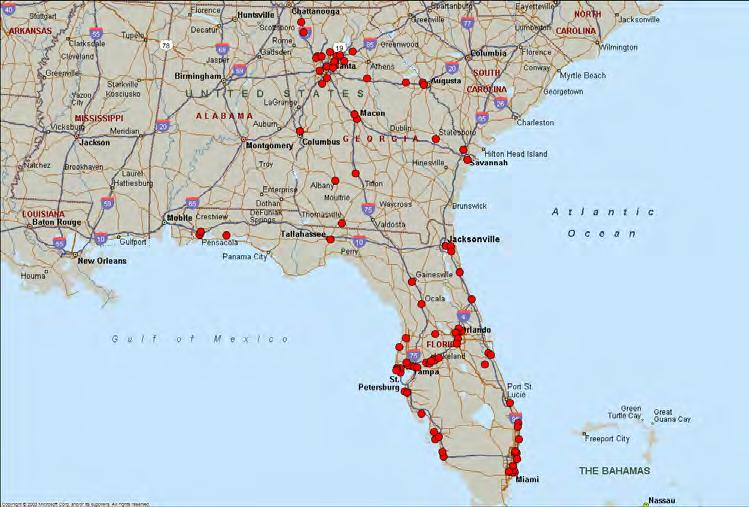
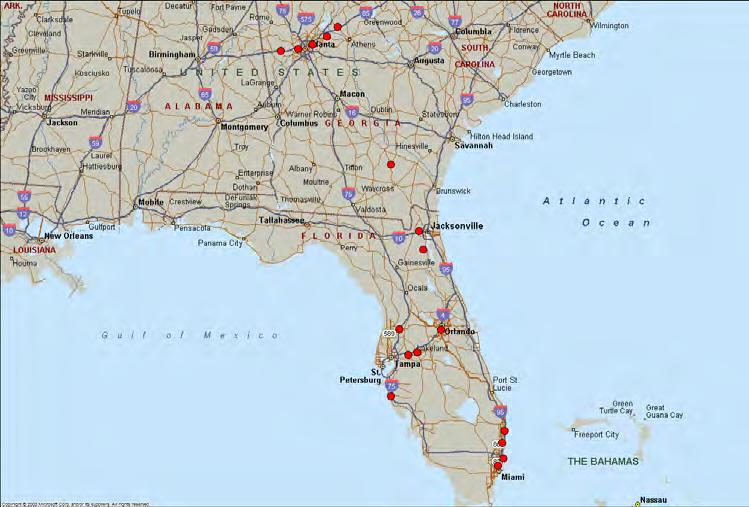
67 Home Furnishings Supermarket/Grocery/Convenience Store MARTIN ASSOCIATES Page 65

68 Discount & General Merchandise/Department Stores MARTIN ASSOCIATES Page 66
AMERICAN ASSOCIATION OF PORT AUTHORITES JUNE 5, 2012 MARTIN ASSOCIATES PREPARED FOR:
 THE DYNAMICS OF THE US CONTAINER MARKET AND SHIFTING TRADE PATTERNS IMPLICATIONS FOR FUTURE INVESTMENT TO PROMOTE US EXPORT ACTIVITY AND ECONOMIC GROWTH PREPARED FOR: AMERICAN ASSOCIATION OF PORT AUTHORITES
THE DYNAMICS OF THE US CONTAINER MARKET AND IMPLICATIONS FOR THE US PORT INDUSTRY
 THE DYNAMICS OF THE US CONTAINER MARKET AND IMPLICATIONS FOR THE US PORT INDUSTRY A PRESENTATION TO: CHANGING TRADE PATTERNS JANUARY 24, 2013 MARTIN ASSOCIATES 941 Wheatland Avenue, Suite 203 Lancaster,
The Economic Impacts of Virginia s Maritime Industry
 The Economic Impacts of Virginia s Maritime Industry PORT COMMERCE Million Tons of Cargo Moved 0,00 Jobs $. Billion In Wages $. Billion In Spending $. Billion In State/Local Taxes.% of Virginia Gross State
CONTAINERS AND BEYOND Derrick Smith AAPA Spring Conference - March 18, 2013
 CONTAINERS AND BEYOND Derrick Smith AAPA Spring Conference - March 18, 2013 1 What are some of the major trends that are occurring? Increased cargo Significant investments Greater rail usage 2 Many economic
HOW IMPORTANT IS THE EXPANSION OF THE PANAMA CANAL TO THE PORT OF NEW ORLEANS
 HOW IMPORTANT IS THE EXPANSION OF THE PANAMA CANAL TO THE PORT OF NEW ORLEANS Bruce Lambert Executive Director, ITTS WARNING PANAMA CANAL EXPANSION Is it needed? Does Louisiana Benefit from the Canal now?
The Potential Impact of Trucker Demand and Supply Issues at U.S. East Coast and Gulf Coast Ports
 The Potential Impact of Trucker Demand and Supply Issues at U.S. East Coast and Gulf Coast Ports AAPA Maritime Economic Development/Public Relations Seminar June 8-10, 2005 Martin Associates 2938 Columbia
The Emergence of. Florida s Seaports and Inland Ports. Florida League of Cities - International Relations Committee November 17, 2011
 The Emergence of Florida s Seaports and Inland Ports Florida League of Cities - International Relations Committee November 17, 2011 History of the Global Supply Chain 2 Supply Chain, Circa 1950 Regional
Distribution & Global Logistics
 Say Yes To Aerospace in Virginia Distribution & Global Logistics 1 Virginia s Distribution & Global Logistics Industry Employs over 78,000 people, primarily in Trucking, Warehousing, and Transportation
Now this is how you serve Florida s largest and fastest growing market.
 Now this is how you serve Florida s largest and fastest growing market. May 2016 Overview Port Tampa Bay Florida s largest port in cargo tonnage and area 37 million tons cargo/year and encompassing 5000
FREIGHT AND INTERMODAL SYSTEMS
 FREIGHT AND INTERMODAL SYSTEMS FREIGHT AND INTERMODAL SYSTEMS ARE MAJOR DRIVERS OF OUR ECONOMIC GROWTH AND INVESTMENTS ARE NEEDED FOR US TO BE COMPETITIVE IN THE FUTURE. OVERVIEW This section summarizes
Attracting Distribution Center and Related Logistics Investment to Florida to Anchor Traffic through Florida Ports
 Attracting Distribution Center and Related Logistics Investment to Florida to Anchor Traffic through Florida Ports Florida Seaport Transportation and Economic Development Council Meeting February, 208
Please Do Not Copy or Distribute. Visit: for all the latest updates!
 Please Do Not Copy or Distribute Visit: www.nears.org for all the latest updates! The Port of Baltimore The Maryland Port Administration NEARS North East Association of Rail Shippers April 2013 Over 300
THE 2016 NATIONAL ECONOMIC IMPACT OF IMPORTED IRON AND STEEL PRODUCTS ON THE U.S. MARINE TRANSPORTATION SYSTEM AND THE U.S.
 THE 2016 NATIONAL ECONOMIC IMPACT OF IMPORTED IRON AND STEEL PRODUCTS ON THE U.S. MARINE TRANSPORTATION SYSTEM AND THE U.S. ECONOMY Prepared for: American Institute for International Steel 1101 King Street
Port of Philadelphia Port Advisory Board
 Port of Philadelphia Port Advisory Board JULY 7, 2016 Meeting Overview: Natural flow of port development arising from the channel being deepened to 45 feet. Channel Deepening Project The Channel Deepening
Global Supply Chain Management: Seattle-Tacoma
 Boston Strategies International, Inc. February 2008 Global Infrastructure Series Global Supply Chain Management: Seattle-Tacoma www.bostonstrategies.com b t t t i (1) (781) 250 8150 Page 1 This report
Appendix B. Commodity Flow Profile
 Appendix B 1.0 Introduction The overall goal of the Kansas Department of Transportation (KDOT) Statewide Freight Plan is to develop a set of infrastructure, operational, and institutional recommendations
Preparing for the future today. Formerly known as Treasure Coast Intermodal Campus St. Lucie County, Florida USA
 Preparing for the future today Formerly known as Treasure Coast Intermodal Campus St. Lucie County, Florida USA Table of Contents Florida Inland Port at a glance Project vision The business case The St.
The Impact of the Panama Canal Expansion
 The Impact of the Panama Canal Expansion Reinventing Supply Chains Atlanta, Georgia Don Anderson, VP Bill Loftis, Senior Principal - Tompkins International August 26-28, 2013 2013 Supply Chain Leadership
Effects of the Panama Canal Expansion on Texas Ports and Highway Corridors. executive summary
 executive summary prepared for Texas Department of Transportation Government and Business Enterprises Division prepared by October 2006 www.camsys.com Executive Summary Key Findings The proposed expansion
PORT OF SAVANNAH. Garden City Terminal: The Southeast Gateway for the U.S.
 PORT OF SAVANNAH Garden City Terminal: The Southeast Gateway for the U.S. GEORGIA PORTS AUTHORITY MORE DEEPWATER & INLAND TERMINAL OPTIONS Chatsworth Garden City Terminal Ocean Terminal Appalachian Regional
Terminal Opportunities & Challenges. Peter I. Keller NYK Line April 24, 2006
 Terminal Opportunities & Challenges Peter I. Keller NYK Line April 24, 2006 . First, a word about NYK 2 Sea Earth Air Logistics Integrator Hardware / Assets 660 Vessels Sea Software / Services NYK Line
Texas Ports and Texas Exports
 Texas Ports and Texas Exports Testimony of Ginger Goodin, P.E. Senior Research Engineer and Director, Transportation Policy Research Center Texas A&M Transportation Institute to Senate Select Committee
Select U.S. Ports Prepare For Panama Canal Expansion
 Select U.S. Ports Prepare For Panama Canal Expansion Port of Jacksonville Grace Wang Associate Professor, Maritime Administration Texas A&M University at Galveston Galveston, Texas Anthony M. Pagano Director,
Assessment of Houston Commodity Flows for Supply Chain Analyses
 This document provides an assessment of 29 commodity flows to assist with the identification of 10 supply chains for more detailed investigation as part of the Ports Area Mobility Study. The intent is
Intermodalism -- Metropolitan Chicago's Built-In Economic Advantage
 May 1, 2015 Intermodalism -- Metropolitan Chicago's Built-In Economic Advantage CMAP's regional economic indicators microsite features key measures of metropolitan Chicago's economy and, where applicable,
Business Development Update
 Business Development Update Performance By Commodity FY16 FY17 Total Port Berth Dry Bulk Liquid Bulk General Cargo +10% -1% +33% 2017 14,940,326 2017 21,717,106 2017 1,444,192 2016 13,618,586 2016 21,870,838
NC State Ports Authority. 21 st Century Transportation Intermodal Committee February 21, 2008 NC State Ports Authority Tom Eagar, CEO
 NC State Ports Authority 21 st Century Transportation Intermodal Committee February 21, 2008 NC State Ports Authority Tom Eagar, CEO NC State Ports Authority Facts at a Glance 2 Enterprise agency unique
Distribution & Global Logistics
 Say Yes To Aerospace in Virginia Distribution & Global Logistics 1 Virginia s Distribution & Global Logistics Industry Employs over 69,000 people, primarily in Trucking, Warehousing, and Transportation
PORT OF HOUSTON AUTHORITY
 PORT OF HOUSTON AUTHORITY I-TED 2014 PORT OF HOUSTON AUTHORITY Governmental subdivision chartered by the State Governed by a seven member Commission Appointed by Harris County, City of Houston and other
House Select Committee on Strategic Transportation and Long Term Funding Solutions. November 6, 2017
 House Select Committee on Strategic Transportation and Long Term Funding Solutions November 6, 2017 1 Welcome to N.C. Ports Fast Facts Two locations serving the Carolinas Over 350,000 teus Over 4 million
LONE STAR HARBOR SAFETY COMMITTEE Roger Guenther Executive Director Port of Houston Authority
 LONE STAR HARBOR SAFETY COMMITTEE Roger Guenther Executive Director Port of Houston Authority Terminal/Refinery Symposium Thursday, February16, 2017 HOUSTON THE BUSIEST U.S. CHANNEL ECONOMIC IMPACTS FOR
How Tomorrow Moves: Ohio Conference on Freight 2011 Atlantic Connections to the Midwest
 How Tomorrow Moves: Ohio Conference on Freight 2011 Atlantic Connections to the Midwest 1 Agenda CSX Review Market Overview National Gateway & NW Ohio Intermodal Hub Bridging Global Commerce 2 2011 first
84 th International Propeller Club Convention Fundamental Changes to a Traditional Transportation Paradigm. October 7, 2009
 84 th International Propeller Club Convention Fundamental Changes to a Traditional Transportation Paradigm October 7, 2009 Today s Objectives Endeavor to provide a broad context for today s session by
THE LOCAL AND REGIONAL ECONOMIC IMPACTS OF THE US DEEPWATER PORT SYSTEM, 2007 PREPARED FOR: AMERICAN ASSOCIATION OF PORT AUTHORITIES JUNE 6, 2008
 THE LOCAL AND REGIONAL ECONOMIC IMPACTS OF THE US DEEPWATER PORT SYSTEM, 2007 PREPARED FOR: AMERICAN ASSOCIATION OF PORT AUTHORITIES JUNE 6, 2008 MARTIN ASSOCIATES 941 WHEATLAND AVE, SUITE 203 LANCASTER,
Infrastructure Investments Enhance Economic Activity
 Infrastructure Investments Enhance Economic Activity National Association of Legislative Fiscal Offices 2013 Fiscal Analysts Seminar Jason Powell October 8, 2013 Virginia s Multimodal Transportation System:
Seaport Perspective. I-75 Relief Task Force Meeting #3. Charles Klug, Principal Counsel, Tampa Port Authority. Presented by:
 Seaport Perspective I-75 Relief Task Force Meeting #3 Presented by: Charles Klug, Principal Counsel, Tampa Port Authority F e b r u a r y 2 6, 2016 NOTE: Information is preliminary and subject to change
Port Everglades Master/Vision Plan Update
 Port Everglades Master/Vision Plan Update Container and Non-Containerized Cargo Charrette Meeting June 18, 2009 1 The purpose of this presentation was to review the progress of the update to the 2006 Master/Vision
Port of Baltimore and Economic Development
 Port of Baltimore and Economic Development Presentation to the National Conference of State Legislatures Fiscal Analysts Seminar Department of Legislative Services Office of Policy Analysis Annapolis,
Port Partnerships Strategic Opportunities for Gateway & Closer Market Ports to Work Together Presented by Rainer Lilienthal General Manager-Trade
 Port Partnerships Strategic Opportunities for Gateway & Closer Market Ports to Work Together Presented by Rainer Lilienthal General Manager-Trade Development Port of Houston Overview The Port of Houston
THE 2016 NATIONAL ECONOMIC IMPACT OF IMPORTED IRON AND STEEL PRODUCTS ON THE U.S. MARINE TRANSPORTATION SYSTEM AND THE U.S. ECONOMY: EXECUTIVE SUMMARY
 THE 2016 NATIONAL ECONOMIC IMPACT OF IMPORTED IRON AND STEEL PRODUCTS ON THE U.S. MARINE TRANSPORTATION SYSTEM AND THE U.S. ECONOMY: EXECUTIVE SUMMARY Conducted by Martin Associates www.martinassoc.net
THE LOCAL AND REGIONAL ECONOMIC IMPACTS OF THE US DEEPWATER PORT SYSTEM, 2006 PREPARED FOR: AMERICAN ASSOCIATION OF PORT AUTHORITIES SEPTEMBER 5, 2007
 THE LOCAL AND REGIONAL ECONOMIC IMPACTS OF THE US DEEPWATER PORT SYSTEM, 2006 PREPARED FOR: AMERICAN ASSOCIATION OF PORT AUTHORITIES SEPTEMBER 5, 2007 MARTIN ASSOCIATES 941 WHEATLAND AVE, SUITE 203 LANCASTER,
Accommodating Mega-Ships at Existing Wharves
 Accommodating Mega-Ships at Existing Wharves Presented by: Kevin P. Abt, P.E. The Virginia Port Authority and Bruce Lambert U.S. Army Corps of Engineers February 22, 2006 National Cargo Trends U.S. Cargo
BNSF Railway. The West Coast is the Best Coast. Fred Malesa. Vice President International Marketing Oct. 11, 2011
 BNSF Railway The West Coast is the Best Coast Fred Malesa Vice President International Marketing Oct. 11, 2011 All slides are copyright 2011. Burlington Northern Santa Fe Corporation and BNSF Railway Company.
CUTS Dossier on Preferential Trade Agreements July-September 2015 (Vol. IX, No. 3)
") CUTS Dossier on Preferential Trade Agreements July-September 2015 (Vol. IX, No. 3) (For all previous issues of PTA Dossiers, please visit: (http://www.cuts-citee.org/ptadossier.htm) Contents 1. ASEAN and
CUTS Dossier on Preferential Trade Agreements July-September 2015 (Vol. IX, No. 3) (For all previous issues of PTA Dossiers, please visit: (http://www.cuts-citee.org/ptadossier.htm) Contents 1. ASEAN and
PORT OF SAVANNAH. Garden City Terminal: The Southeast Gateway for the U.S.
 PORT OF SAVANNAH Garden City Terminal: The Southeast Gateway for the U.S. July 24, 2018 GEORGIA PORTS AUTHORITY DEEPWATER & INLAND TERMINAL OPTIONS 9 Container berths 9,693 ft (2,955 m) of contiguous
Once known as warehousing and distribution, the process
 Map III-2.3 Proposed Agile Port Industrial Area AGILE PORT INDUSTRIAL AREA PLAN Once known as warehousing and distribution, the process of moving goods to market has evolved dramatically. No longer is
Shifting Trade Patterns A VIEW FROM THE WEATHER DECK
 Shifting Trade Patterns A VIEW FROM THE WEATHER DECK National Freight Infrastructure Policies The Impact of Shifting Trade Patterns Infrastructure Needs & Investment Plans January 24, 2013 Tampa, Florida
Developing New Exporters. AAPA Maritime Economic Development Workshop June 3 rd, 2014
 Developing New Exporters AAPA Maritime Economic Development Workshop June 3 rd, 2014 What is the Value of Exports through the Ports of LA, LB & LAX Airport? $ 127 Billion in 2013 ( + 4.63 % ) This is an
Presentation Topics The Alameda Corridor Project Corridor Performance Goods Movement Challenges
 1 Presentation Topics The Alameda Corridor Project Corridor Performance Goods Movement Challenges 2 Ports of Los Angeles and Long Beach Largest port complex in the U.S. Fifth largest in the world Highest
The Immediate Aftermath of the Panama Canal Expansion on the Southeastern United States
 Expansion on the Southeastern United States Bruce Lambert, Executive Director Institute for Trade and Transportation Studies - 10 Veterans Blvd., New Orleans, LA 70124 T: 540-455-9882 E: bruce@ittsresearch.org
Supply Chain Management Summit August 23, 2012
 Supply Chain Management Summit August 23, 2012 Steven J. King, P.E. Managing Director Quonset Business Park 3,207 Total Acres 168 Companies 8,800 Jobs Transportation Facilities Freight Seaport: 2 piers
TRB - Annual Meeting
 TRB - Annual Meeting NATIONAL DREDGING NEEDS STUDY PHILLIP J. THORPE Institute for Water Resources 16 January 2002 AGENDA Background Information Historical Perspective Global and US Trade World and US
Shifting International Trade Routes
 Shifting International Trade Routes 01 February 2011 Tampa, FL By: Shawn Ewen VP, SATL District Integrated Shipping Services Who is ZIM? ZIM is an International Shipping Company started in 1945. Based
Southeast Florida Freight and Goods Movement Update Treasure Coast Regional Planning Council September 16, 2011
 Southeast Florida Freight and Goods Movement Update Treasure Coast Regional Planning Council September 16, 2011 For Questions on this Presentation, Please Contact: Jeff Weidner, Mobility Manager Florida
Country Profile Oman
 Country Profile Oman Introduction Location Middle East, bordering the Arabian Sea, Gulf of Oman, and Persian Gulf, between Yemen and the UAE Capital Muscat Area 309,500 sq. km Population 3,424,386 (July
Eric Thomas Benchmark River and Rail Terminals
 Eric Thomas Benchmark River and Rail Terminals CORBA s Mission The Central Ohio River Business Association (CORBA) is an alliance of businesses and industry engaged in river commerce on and along the Ohio
Florida Statewide Seaport System Plan
 Florida Statewide Seaport System Plan October, 00 Table of Contents.0 Background... -. Florida s Ports Provide Critical Economic and Transportation Benefits... -. Seaport System Planning and Funding...
Intermodal Is Leading The Way June 2013
 Intermodal Is Leading The Way June 2013 Presented by: Keith S. Stauber, SIOR Regional Managing Director +1 773 458 1386 keith.stauber@am.jll.com 1 Sensitivity Analysis The correlation between TEUs and
Southern Alberta: Growth of Import and Export Opportunities for West Coast Ports
 Southern Alberta: Growth of Import and Export Opportunities for West Coast Ports Stakeholders for the Study Port of Prince Rupert Province of Alberta Calgary Regional Partnership Calgary Economic Development
The Economic Realities of Water Transportation
 The Economic Realities of Water Transportation Wayne K. Talley Executive Director, Maritime Institute Frederick W. Beazley Professor of Economics Old Dominion University Short Sea Shipping Short sea shipping
2014 International Report
 Executive Summary 2013 total agricultural exports $4,116,162,451 up 1.9% from 2012 Compound annual growth 2009 to 2013 9.6% per year Florida ranked 8 th in agricultural exports among the states Top 10
Russell McMurry Georgia Dept. Of Transportation. Chris Tomlinson SRTA and GRTA. Griff Lynch Georgia Ports Authority
 Griff Lynch Georgia Ports Authority Russell McMurry Georgia Dept. Of Transportation Chris Tomlinson SRTA and GRTA Michael Sullivan Georgia Transportation Alliance Roosevelt Council, Jr. Hartsfield-Jackson
Packer Avenue Marine Terminal operator:
 Packer Avenue Marine Terminal operator: Delaware River Main Channel Deepening PhilaPort Channel Deepening: 85% Complete Delaware River Main Channel Deepening Project Details Current Depth vs. Future Depth
North Carolina Offshore Energy Exploration Subcommittee. Mr. Jeff Keever Senior Deputy Executive Director Virginia Port Authority February 23, 2010
 North Carolina Offshore Energy Exploration Subcommittee Mr. Jeff Keever Senior Deputy Executive Director Virginia Port Authority February 23, 2010 East Coast Logistics Hub for Offshore Energy Exploration
D E C AT U R I N T E R M O D A L R A M P O P P O R T U N I T Y F I N A L R E P O R T A U G U S T 3 1,
 D E C AT U R I N T E R M O D A L R A M P O P P O R T U N I T Y F I N A L R E P O R T A U G U S T 3 1, 2 0 1 5 Agenda Executive Summary Terminal Overview Shipper Opportunities and Requirements Conclusions
Port of Los Angeles. America s Port Harbor Transportation Club June 20, 2013 Kathryn McDermott
 Port of Los Angeles America s Port 2013 Harbor Transportation Club June 20, 2013 Kathryn McDermott Sea/Tac Battle for Discretionary Cargo Prince Rupert Eastern Canada NY/NJ OAK Norfolk LA/LB Savannah
THE PORT POR OF OF VIRGINIA VIR
 THE PORT OF VIRGINIA 1 ADVANTAGES Deep channels Post Panamax ready at 50 ft. Authorized to 55 ft. Only 18 miles from open sea and no overhead aerial obstructions Central mid Atlantic location on the USEC
Country Profile Iran
 Country Profile Iran Introduction Location Capital Middle East, bordering the Gulf of Oman, the Persian Gulf, and the Caspian Sea, between Iraq and Pakistan Tehran Area 1,648,195 sq. km Population Independence
The Port of Savannah Logistics Cluster Author: Dr. Jean Paul Rodriguez
 The Port of Savannah Logistics Cluster Author: Dr. Jean Paul Rodriguez 1. The Emergence of the Savannah Gateway: The port of Savannah is under the jurisdiction of the Georgia Ports Authority (GPA) and
The Infrastructure Challenge: Perspectives on the Road Ahead
 The Infrastructure Challenge: Perspectives on the Road Ahead Halifax, August 8, 2011 Mary R. Brooks, 2011 Gamechangers Infrastructure Investment Captures Attention Heartland Corridor (streamlining a complex
STATEWIDE ECONOMIC IMPACT OF FLORIDA SEAPORTS FLORIDA SEAPORTS. Florida Seaport Transportation and Economic Development Council
 FLORIDA SEAPORTS CHARTING OUR FUTURE 2012 STATEWIDE ECONOMIC IMPACT OF FLORIDA SEAPORTS Florida Seaport Transportation and Economic Development Council www.flaports.org TABLE OF CONTENTS SUMMARY OF ECONOMIC
Anticipation, Expectation and Performance of Emerging Markets
 Anticipation, Expectation and Performance of Emerging Markets Moderator: Steve Schellenberg, IMS Worldwide, Inc. Panelists: Don Cunningham, Lehigh Valley Economic Development Corp. Russell Held, Virginia
Port of Los Angeles Presentation to the Los Angeles Investors Conference March 19, 2018
 Port of Los Angeles Presentation to the Los Angeles Investors Conference March 19, 2018 1 Today s Focus Introduction to the Port of Los Angeles Market Position & Cargo Volumes Capital Improvement Program
The ever changing supply chain strategy. Tom Scorsune January 20, 2012
 The ever changing supply chain strategy Tom Scorsune January 20, 2012 Domestic production Circa 1950 Domestic Production Regional Distribution Production Distribution 2 Domestic production Circa 1970 New
Shifting Trade Routes Kyle Hancock January 25, 2013
 Shifting Trade Routes Kyle Hancock January 25, 2013 1 CSX is a Fortune 250 company with 32,000 employees operating East of the Mississippi CSX Rail Network Our Business Midwest Chicago St Louis Northeast
Analyst: Meilin C. Pierce Spring Recommendation: Hold Target Stock Price (12/31/2016): $120
: $120") Recommendation: Hold Target Stock Price (12/31/2016): $120 1. Reasons for the Recommendation My recommendation is to hold Union Pacific Corporation (UNP) because my forecast shows that the stock is currently
Recommendation: Hold Target Stock Price (12/31/2016): $120 1. Reasons for the Recommendation My recommendation is to hold Union Pacific Corporation (UNP) because my forecast shows that the stock is currently
PORT OF SAVANNAH Garden City Terminal: The Southeast Gateway for the U.S. Presented to
 PORT OF SAVANNAH Garden City Terminal: The Southeast Gateway for the U.S. Presented to June 6, 2017 Chatham ICTF served by CSX Transportation Mason ICTF served by Norfolk Southern Railroad GARDEN CITY
LOGISTICS Emerging & Alternative Ports. Title Sponsor : February 8-11, 2009 Gaylord Texan Dallas, Texas
 LOGISTICS 2009 February 8-11, 2009 Gaylord Texan Dallas, Texas Emerging & Alternative Ports Title Sponsor : Ports Panel: Emerging and Alternative Ports David W. Eaton VP of Corporate Affairs & Right of
Ports and Intermodal Development: Critical Links in the Supply Chain
 Ports and Intermodal Development: Critical Links in the Supply Chain Walter Kemmsies, Managing Director, JLL Mike Mullen, Industry Veteran Gene Seroka, Executive Director, The Port of Los Angeles Cliff
Partnerships in Capital Projects. AAPA Facilities Engineering Seminar and Expo
 Partnerships in Capital Projects AAPA Facilities Engineering Seminar and Expo November 6-8, 2013 1 There are Old Ways and New Ways of Doing Things Fore Front: New Oakland San Francisco Bay Bridge Background:
The Point Intermodal River Port Facility at the Port of Huntington Project Benefit Cost Summary
 The Point Intermodal River Port Facility at the Port of Huntington Project Benefit Cost Summary The Lawrence County Port Authority 216 Collins Avenue South Point, Ohio 45638 P a g e Contents I. Base Case...
CLASS I RAIL CSX & Norfolk Southern
 INDUSTRIAL PARK ±2,700 Acres CLASS I RAIL CSX & Norfolk Southern PORT OF SAVANNAH Rail & Highway Access Updated 3/28/18 Industrial Park & Logistics Hub Highlights & Services SAVANNAH GATEWAY INDUSTRIAL
Robert MORRIS Georgia Ports Authority
 The Harbor Boom: Meeting future Challenges Through Investment & Development Robert MORRIS Georgia Ports Authority Georgia Ports Authority Staying Ahead of the Curve Meeting Demands of Annual Double-Digit
Port Activity and Competitiveness Tracker
 Comprehensive Regional Goods Movement Plan and Implementation Strategy Port Activity and Competitiveness Tracker Presented to I-710 Corridor Advisory Committee Gill Hicks Cambridge Systematics, Inc. May
Freight Transportation Megatrends
 Freight Transportation Megatrends Copyright 2006 Global Insight, Inc. Freight Demand Modeling: Tools for Public-Sector Decision Making Conference Paul Bingham Global Insight, Inc. Washington, DC September
As an alumnus of the program, I can tell you that I ve been well-served by the training.
 Thank you. I m honored to be here, for the AAPA s Executive Management Conference, to have the opportunity to address such a distinguished group of port professionals. As an alumnus of the program, I can
Alabama State Port Authority
 Alabama State Port Authority Port Update IFFCBANO June 6, 2014 www.asdd.com Port of Mobile Excellent Transportation Infrastructure I-10 & I-65 5 Class 1 Railroads (BNSF, CN, CSX, KCS, NS) Rail Ferry Service
Pakistan & Iran. Country Information:
 Country Information: Iran's economy is marked by statist policies, inefficiencies, and reliance on oil and gas exports, but Iran also possesses significant agricultural, industrial, and service sectors.
FDOT FREIGHT PERFORMANCE MEASURES
 FDOT FREIGHT PERFORMANCE MEASURES 1 PEOPLE FREIGHT Transit MODE QUANTITY QUALITY ACCESSIBILITY UTILIZATION Auto/Truck Pedestrian Bicycle Aviation Rail Seaports Truck Aviation Rail Seaports Vehicle Miles
STRENGTHENING YOUR PORT S FINANCIAL STABILITY THROUGH DIVERSIFICATION
 STRENGTHENING YOUR PORT S FINANCIAL STABILITY THROUGH DIVERSIFICATION A Case Study of the Vancouver Fraser Port Authority s Natural Advantages and Diversification Strategies Larry Sawrenko, Director Finance
WEST COAST LONGSHORE STRIFE
 Winter 2015/2016 OUTCOME OF WEST COAST LONGSHORE STRIFE A Cushman & Wakefield Logistics and Industrial Services Special Report Outcome of West Coast Longshore Strife It s now been over six months since
CHAPTER SUMMARY. Chapter 4 Socioeconomics
 Chapter Socioeconomics 0 0 CHAPTER SUMMARY This chapter characterizes the existing socioeconomic conditions of the proposed Project area and vicinity, as well as the factors contributing to positive or
Preparing for Post-Panamax Commodity Flows: Restructuring on Kentucky Waterways
 Preparing for Post-Panamax Commodity Flows: Restructuring on Kentucky Waterways Tim Brock Research Associate Kentucky Transportation Center Smart Rivers 2011 New Orleans, LA September 14, 2011 (Map Source:
BRIDGING GLOBAL TRADE
 BRIDGING GLOBAL TRADE PREPARING FOR FUTURE GROWTH AND CHANGE Presented to AAPA S 2013 Shifting International Trade Routes January 24, 2013 Curtis J. Foltz Executive Director, Georgia Ports Authority Georgia
Panama Canal Expansion: Impacts on the US Marketplace
 NMHC General Session April 22, 2015 NMHC Spring Board Meeting Waldorf Astoria Hotel New York Panama Canal Expansion: Impacts on the US Marketplace M. John Vickerman Williamsburg, Virginia Today s Global
Container Shipping. Outlook and Issues for US East Coast Shippers and Ports. Tina Liu Country Manager, China. October 15, 2015 TPM Shenzhen
 Container Shipping Outlook and Issues for US East Coast Shippers and Ports October 15, 2015 TPM Shenzhen Tina Liu Country Manager, China Agenda Container volume growth Mega-alliances Mega-ships Port diversification
Northwestern University Transportation Center
 Northwestern University Transportation Center 1 Overview» Fully integrated: large scale development, redevelopment, investment and property management operations» Founded in 1984, NYSE listed from 1993
Chapter 1 Introduction
 Chapter 1 Introduction KEY POINTS The amount and value of freight are critical components of the overall economic health of Missouri. Missouri s multimodal freight system supports the movement of trucks,
House Appropriations Committee Overview of Virginia International Terminals (VIT) October 15, 2012
 October 15, 2012") House Appropriations Committee Overview of Virginia International Terminals (VIT) October 15, 2012 Ms. Charlotte P. Herndon, CPA Chairman of the Board Virginia International Terminals, Inc. 1 VIT RESULTS
House Appropriations Committee Overview of Virginia International Terminals (VIT) October 15, 2012 Ms. Charlotte P. Herndon, CPA Chairman of the Board Virginia International Terminals, Inc. 1 VIT RESULTS