ALTERNATIVES ANALYSIS SUMMARY REPORT
|
|
|
- Linette Horton
- 5 years ago
- Views:
Transcription


1 ALTERNATIVES ANALYSIS SUMMARY REPORT CENTRAL BROWARD EAST-WEST TRANSIT ANALYSIS BROWARD COUNTY, FLORIDA FINANCIAL PROJECT ID NUMBER FLORIDA DEPARTMENT OF TRANSPORTATION DISTRICT 4 PREPARED BY: IN ASSOCIATION WITH: December 2005
2 TABLE OF CONTENTS Alternatives Analysis Summary Report 1.0 PURPOSE OF THE ALTERNATIVES ANALYSIS STUDY BACKGROUND Study Area Description Regional Context Corridor Context SUMMARY OF LOCAL DECISION MAKING AND ANALYSIS ENDORSEMENT OF THE LOCALLY PREFERRED ALTERNATIVE PROJECT BACKGROUND PREVIOUS WORK RELATIONSHIP TO OTHER ON-GOING STUDIES TRAVEL DEMAND ANALYSIS Refinement of the Model and Alternatives TECHNOLOGY EVALUATION DEFINITION OF TRANSIT MODES Express Bus Bus / HOV Lanes Bus Rapid Transit (BRT) Light Rail Transit Commuter Rail Heavy Rail Automated Guideway Transit Monorail OTHER TECHNOLOGY CONSIDERATIONS Roadway Improvements for Transit Travel Demand Management (TDM) Intelligent Transportation Systems (ITS) TECHNOLOGY EVALUATION Evaluation Guidelines Evaluation Results RECOMMENDED TECHNOLOGIES SUMMARY DEVELOPMENT AND EVALUATION OF ALTERNATIVES SCOPING Scoping Alternatives Development Scoping Alternatives Evaluation Results of the Evaluation TIER Tier 1 Alternatives Development Tier 1 Alternatives Evaluation TIER Tier 2 Alternatives Tier 2 Alternatives Evaluation LPA EVALUATION...49 i
3 4.4.1 LPA Development LPA Evaluation COMPARISON OF BASELINE AND LOCALLY PREFERRED ALTERNATIVE BASELINE/TSM ALTERNATIVE Express Bus Routes Transportation System Management LOCALLY PREFERRED ALTERNATIVE COST EFFECTIVENESS AND FINANCIAL ANALYSIS Cost Effectiveness Financial Feasibility PUBLIC INVOLVEMENT ACTIVITY SINCE ADOPTION OF THE LOCALLY PREFERRED ALTERNATIVE...77 LIST OF TABLES TABLE 1: POPULATION DENSITY COMPARISONS...4 TABLE 2: MODE CHOICE MODEL RESULTS...15 TABLE 3: TRANSIT SYSTEM BOARDINGS...16 TABLE 4: USER BENEFIT SUMMARY...17 TABLE 5: TRANSIT TECHNOLOGY EVALUATION MATRIX...28 TABLE 6: EVALUATION MATRIX FOR DESTINATIONS AND CONNECTIVITY...36 TABLE 7: EVALUATION MATRIX OF PRELIMINARY ALIGNMENTS...36 TABLE 8: TIER 1 EVALUATION MATRIX...42 TABLE 9: COMPARISON OF I-595/SR 7/BROWARD ALIGNMENT TO VARIATIONS...49 TABLE 10: TIER 2 EVALUATION MATRIX...50 TABLE 11: REVISED RIDERSHIP AND CAPITAL COSTS PROJECTIONS BASED ON GUIDEWAY CONFIGURATION...64 TABLE 12: COMPARISON OF KEY DATA...72 ii
4 LIST OF FIGURES Alternatives Analysis Summary Report Figure 1: Central Broward East-West Transit Analysis Study Area...2 Figure 2: Locally Preferred Alternative...7 Figure 3: Other Transit Studies in the Central Broward Area...9 Figure 4: Sample User Benefit Map...18 Figure 5: Alignment Alternatives from Scoping...30 Figure 6: Alignment Alternatives...37 Figure 7: Alternative Variations Identified by MPO Board...43 Figure 8: Potential Guideway Configurations for the Approved Alignment...52 Figure 9: Bus Rapid Transit in a Semi-Exclusive Guideway along 136 th Avenue...53 Figure 10: Light Rail Transit in a Semi-Exclusive Guideway along 136 th Avenue...54 Figure 11: Bus Rapid Transit in Mixed Traffic along State Road Figure 12: Light Rail Transit in Exclusive Guideway along State Road Figure 13: Bus Rapid Transit in Mixed Traffic along Broward Boulevard...57 Figure 14: Light Rail Transit in an Exclusive Guideway along Broward Boulevard...58 Figure 15: Light Rail Transit in Mixed Traffic along Broward Boulevard...59 Figure 16: I-595 Transit Option Figure 17: I-595 Transit Option Figure 18: I-595 Transit Option Figure 19: Cost Effectiveness of the Build Alternative Options (as of February 2005)...65 Figure 20: Baseline/TSM Alternative Express Bus Routes...68 Figure 21: Locally Preferred Alternative...70 iii
5 LIST OF ACRONYMS Alternatives Analysis Summary Report BCt BRT CBD CIR CRA FDOT FHWA FTA HOV HPT LOS LPA LRT LRTP MPO MSA PD&E RAC SFEC SFRTA SOV SR TAZ TCC TIP TOD TSM TSUB V/C Broward County Transit Bus Rapid Transit Central Business District Community Involvement Roundtable Community Redevelopment Agency Florida Department of Transportation Federal Highway Administration Federal Transit Administration High Occupancy Vehicle High Performance Transit Level of Service Locally Preferred Alternative Light Rail Transit Long Range Transportation Plan Metropolitan Planning Organization Metropolitan Statistical Area Project Development and Environment Study Regional Activity Center South Florida Education Center South Florida Regional Transportation Authority Single Occupancy Vehicle State Road Traffic Analysis Zone Technical Coordinating Committee Transportation Improvement Program Transit Oriented Development Transportation System Management Transportation System User Benefits Volume to Capacity iv
6 1.0 PURPOSE OF THE ALTERNATIVES ANALYSIS The primary purpose of the Central Broward East-West Transit Analysis (CBEWTA) was to provide a decision-making process for determining transportation investments appropriate to meet the current and future needs of the study area. The CBEWTA contains information sufficient to measure and evaluate a range of investment options. The CBEWTA was used to facilitate careful consideration of alternatives against a baseline and was guided by an open and inclusive process founded upon community input for determining the preferred investment strategy. The overall purpose and need for the Central Broward East-West Transit Analysis is to address recent rapid growth in the western section of Broward County and resultant traffic congestion on east-west facilities in Central Broward County. The transit project resulting from the Central Broward East-West Transit Analysis would serve as a regional facility connecting the communities and activity centers in western Broward County to those in eastern Broward County. The proposed termini for the project are the Sawgrass Mills Mall/Office Depot Center in western Broward County and the Fort Lauderdale/Hollywood International Airport in eastern Broward, with the alignment passing through the Fort Lauderdale Central Business District (CBD). Based on the existing and future travel needs, the goals and objectives developed and evaluated in the Central Broward East-West Transit Analysis were to provide a premium transit improvement that: Enhances east-west mobility in central Broward County. Efficiently uses available financial resources, and supports economic growth and development. Is consistent with the needs and desires of the residents of Broward County, in order to maximize community acceptance and support. Ensures compatibility between land use policies and transit service so that the need for trip-making and the amount of travel is reduced and the opportunities for transit-oriented development are maximized. Enhances and preserves the social and physical environment, and that keeps potential impacts to sensitive resources to a minimum. The Conceptual Definition of Alternatives Report, dated January 2004, provides a more extensive discussion of the purpose and need for the Central Broward East West Transit Analysis. 1.1 STUDY BACKGROUND Study Area Description The Central Broward East-West Transit Analysis study area, illustrated in Figure 1, is in central Broward County, Florida. Oakland Park Boulevard, the Weston/Sawgrass area, Griffin Road, and the Intracoastal Waterway are the general boundaries of the study area. High levels of travel and congestion on major east-west roadways characterize conditions of this area. Historically, the traditional travel patterns have been directional-- eastbound in the morning and westbound in the afternoon--fueled by the residential communities in the west and employment centers in the east. As growth in business, 1
7 Pine Island Rd University Dr SR 7 Nob Hill Rd NW 136 Ave Flamingo Rd Hiatus Rd I-95 NW 31 Ave Alternatives Analysis Summary Report N W E S Office Depot Center SUNRISE NOT TO SCALE Sawgrass Mills Sunrise Blvd PLANTATION Sawgrass International Business Park I-75 I-75 Sawgrass Expressway I-595 BCT West Regional Terminal LAUDERDALE LAKES LAUDERHILL Oakland Park Blvd Florida s Turnpike Fashion Mall Broward Blvd Tri-Rail Broward Mall Station BCT Central Terminal OAKLAND PARK WILTON MANORS Andrews Ave FORT LAUDERDALE US 1 US 1 Las Olas Blvd Davie Blvd SE 17 St SR A1A DAVIE College Ave South Florida Education Center SR 84 I-595 Fort Lauderdale/ Hollywood International Airport Port Everglades Griffin Rd Tri-Rail Station DANIA BEACH HOLLYWOOD Figure 1: Central Broward East-West Transit Analysis Study Area 2
8 retail and other commercial activity centers occurs in the central and western portions of the study area and intense residential redevelopment occurs in the east, this travel pattern is changing. This is producing growing westbound travel in the morning and eastbound travel in the afternoon. In short, the mobility needs in the study area reflect the amount of travel between west and east Broward County; the congestion on main east-west arteries; lack of connectivity among important transportation facilities including Fort Lauderdale/Hollywood International Airport, Port Everglades, and Tri-Rail commuter rail service; and the amount of travel to significant destinations throughout the central Broward area Regional Context Recently, the three major counties that comprise southeast Florida (Broward, Miami- Dade and Palm Beach) were merged to create the Southeast Florida Metropolitan Statistical Area (MSA), the fifth largest in the United States. The MSA has more than 5.1 million people and its population grew by over 950,000 between 1990 and Furthermore, the Southeast Florida MSA is projected to grow to 7.4 million by 2030, an increase of 48% between 2000 and This reflects an annual average growth rate of 1.6%. Mobility within the region is already a concern, and it will continue to be as the region s population continues to grow. Annually, the Texas Transportation Institute ranks the major metropolitan areas with respect to traffic congestion occurring on their highways. In 2001, 57 percent of the highway and street miles in the Fort Lauderdale metropolitan area were identified as congested, and roadways are congested almost one third of the day (7.8 hours). Similarly, 64 percent of daily travel occurs in congested periods and the annual percapita delay as a result of congestion has increased from three (3) hours in 1982 to 28 hours in The Broward County Metropolitan Planning Organization (MPO), with input from the Florida Department of Transportation (FDOT), and others, periodically updates its long range transportation plan (LRTP). The LRTP identifies transportation projects in major corridors throughout the region. Even with the planned $4.9 billion investment in county transportation systems over the next 20 years, the trend of increasing congestion is expected to continue. The central Broward County sub area and I-595 corridor are not exceptions to the trend Corridor Context Key activity centers within the central Broward corridor include Sawgrass Mills, the Office Depot Center, and Sawgrass International Corporate Park in the western portion of the corridor. The Midtown Plantation and South Florida Education Center (SFEC) are located in the center section of the corridor. The SFEC includes Nova Southeastern University, Florida Atlantic University, University of Florida, Broward Community College, and other educational facilities. The Fort Lauderdale Central Business District (CBD), with the County Governmental Center, City Hall, and State and Federal Court Houses are located at the eastern edge of the corridor. Fort Lauderdale/Hollywood International Airport and Port Everglades Seaport are at the far eastern end of the corridor. The central Broward corridor has many transportation challenges and opportunities. The following is a sampling of the corridor issues that are considered by this study: 3
9 Recurring congestion on segments of I-595, reaching Level of Service F conditions much sooner than originally anticipated; Recurring congestion on segments of I-95 and Florida s Turnpike; For many trips within the corridor, there are few viable alternatives to the private automobile; High capacity transit service is predominately north-south and does not adequately address east-west travel nor adequately serve suburban employment centers; Lack of access and mobility within the corridor constrains economic development and redevelopment; Anticipated population and employment growth is expected to exacerbate the problems described above. 1.2 SUMMARY OF LOCAL DECISION MAKING AND ANALYSIS Broward County, one of three counties in the Southeast Florida MSA, covers 1,197 square miles. The western two-thirds of the county (787 square miles) consists of the Everglades, Water Conservation Areas managed by the South Florida Water Management District, the Miccosukee Indian Reservation, and a small portion of the Big Cypress Seminole Indian Reservation. The remaining 410 square miles (east of the East Coast Protective Levee) is the developable area with a population density of 3,958 people per square mile, based on the 2000 Census. This compares to the population density of other metropolitan areas such as San Diego, Denver, Portland, Las Vegas, and Dallas. In 2004, Broward County s Planning Services Division compared the Southeast Florida Metropolitan Statistical Area (MSA), which consists of Miami-Dade, Broward, and Palm Beach Counties, to other MSAs in the country. The Southeast Florida MSA is third in the nation in population density, when the undevelopable areas (Everglades National Park, water conservation areas, and Everglades Agricultural Area) are removed from the calculation. Table 1 provides the population density for the municipalities within the Central Broward East-West Transit Analysis study area and several other major US cities for comparison. Table 1: Population Density Comparisons Central Broward East-West Transit Analysis Study Area Other US Cities Source: Census 2000 Summary File City Population Density (persons/sq mi) Fort Lauderdale, FL 4,803 Plantation, FL 3,815 Davie, FL 2,265 Sunrise, FL 4,712 San Diego, CA 3,772 Denver, CO 3,617 Portland, OR 3,939 Las Vegas, NV 4,222 Dallas, TX 3,469 Atlanta, GA 3,161 Chicago, IL 12,750 Boston, MA 12,165 New York, NY 26,402 4
10 There are 30 municipalities in this developable area, which constitutes the urbanized area covered by the Broward County Metropolitan Planning Organization (MPO). Three County Commissioners and elected officials from 13 municipalities are primary voting members on the MPO Board. The 17 remaining municipalities have representatives that serve as alternates on the Board. Broward County provides staff support to the MPO and its committees. Representatives from two of the public transportation providers in Broward County participate in transportation planning through their representation on the Technical Coordinating Committee of the MPO. Broward County Transit (BCt), which provides fixed route and on-demand bus service throughout the County, is operated by the Mass Transit Division of Broward County. The South Florida Regional Transportation Authority (SFRTA) operates Tri-Rail, a commuter rail service in Palm Beach, Broward and Miami-Dade counties. SFRTA also operates shuttles that provide collection and distribution service to and from Tri-Rail stations and major activity centers. The 2025 Long Range Transportation Plan and 2030 Long Range Transportation Plan are the products of the comprehensive, cooperative, and continuous transportation planning efforts among the MPO and the Florida Department of Transportation (FDOT). Both LRTPs were guided by the principles set forth in the Transportation Equity Act for the 21 st Century (TEA-21) and the Clean Air Act Amendments of TEA-21 was passed by federal legislators in June 1998 and continues the philosophy set out in the Intermodal Surface Transportation Efficiency Act of 1991 (ISTEA), which strengthened the role of the planning process by making it a central decision-making mechanism for development and funding of the Metropolitan Transportation System. The 2025 Long Range Transportation Plan was adopted in December 2001 and included a proposed system of bus rapid transit routes along the major arterials in Broward County and a number of High Performance Transit routes, including one along I-595. The 2030 Long Range Transportation Plan was adopted in December 2004 and replaced the bus rapid transit system with a rapid bus system. This Plan also includes the Locally Preferred Alternative from this Alternatives Analysis. This CBEWTA was consistent with FTA guidance and regulations. It was based on a twotiered evaluation process that used both qualitative and quantitative evaluation measures. The analysis began with an assessment of potential east-west corridors in the central Broward County area, followed by an analysis of trip origin and destination pairs using the Southeast Regional Planning Model (SERPM) travel demand model developed by FDOT to integrate the travel demand models used by the three MPO s within the region. Identification of appropriate transit modes for the study area was conducted through a technology assessment. More detailed evaluation of alternatives was supported by the MPO and FDOT through the use of SERPM. The final evaluation, to refine the LPA, was based on a quantitative analysis of key factors: projected daily ridership, capital and operating costs, and cost effectiveness. Results of the various analyses and reports conducted for the CBEWTA were presented to the MPO and its committees throughout the course of the project. Ten presentations were made to the MPO throughout the project. Four public meetings (three information workshops and a public hearing) were conducted at various locations throughout the central Broward area, and over 40 stakeholders meetings were conducted with local elected officials and 5
11 MPO Board Members. Four project newsletters were distributed to a mailing list containing approximately 600 names. A project website ( was created in January 2003 and has been continuously updated throughout the project. The website includes information about the project s status, public meetings, and includes a Documents page where all final reports and presentations to the MPO and its committees, and from public meetings are posted. 1.3 ENDORSEMENT OF THE LOCALLY PREFERRED ALTERNATIVE The purpose of the Alternatives Analysis process is to define and evaluate alternatives in order to select a transit project that meets a region s transportation needs in a cost effective way and that has gained regional support. As noted above, a two-tiered evaluation process was used. The process began with the development of a broad range of alignment and technology alternatives. This range of alternatives was reduced through a primarily qualitative evaluation and the remaining alternatives were evaluated in more detail and using a more quantitative analysis. Evaluation criteria for the CBEWTA were established based on the FTA s New Starts evaluation criteria. These criteria are presented in the sections of this report that discuss the evaluation process. The evaluation process and matrices are presented in more detail in Section 4. The MPO identified and endorsed a light rail transit system serving the Central Broward area. The system improves east-west mobility and improves accessibility to two of the largest employment centers in Broward County (the Fort Lauderdale Central Business District and the Plantation Midtown District), as well as two other major activity centers, the South Florida Education Center and the Sunrise International Business Park/Sawgrass Mills/Office Depot Arena. The Town of Davie, the City of Plantation, the City of Sunrise, and the Fort Lauderdale Chamber of Commerce have endorsed the LPA. The MPO determined that the proposed project is consistent with the 2030 Long Range Transportation Plan. The LPA is shown in Figure 2. 6
12 Figure 2: Locally Preferred Alternative 7
13 2.0 PROJECT BACKGROUND The purpose of this chapter is to summarize the status of on-going studies and the results of previous studies. This chapter is a summary of the previous studies and analyses completed in the CBEWTA study area. The primary purpose of the CBEWTA was to provide a decisionmaking process for determining transportation investments appropriate to meet the current and future needs of the study area. The findings of the CBEWTA resulted in the recommendation of a locally preferred alternative (LPA) for the construction and operation of a light rail transit line from the western portion of central Broward County to Downtown Fort Lauderdale and the Fort Lauderdale/Hollywood International Airport. This recommendation for a preferred transportation investment solution could require major construction, which will be further documented in an Environmental Impact Statement (EIS). Figure 1 illustrates the study area. There are eleven municipalities in the study area. Several related transportation plans and projects were recently completed, are underway, or are planned to begin in the near future in the study area. These projects are summarized in the following section. Figure 3 illustrates the location of related projects in the study area. The sponsors of these projects include Broward County, FDOT and the Fort Lauderdale Downtown Development Authority. The CBEWTA will address the mobility issues not met by related projects and will coordinate the development of transportation investment strategies with other transportation planning efforts. 2.1 PREVIOUS WORK This study has its origins in the I-95/I-595 Master Plan, the Broward County MPO 2025 Long Range Transportation Plan (LRTP), and Tri-Rail s 2020 Plan. Other plans also have influenced, or will influence, mobility in the central Broward area. Brief descriptions of the affiliated plans are below. I-95/I-595 Master Plan (July 2001) The I-95/I-595 Master Plan analyzed possible alternatives for meeting the transportation needs of the I-595 and I-95 corridors. This study took a first look at the feasibility of premium or high performance transit (fixed guideway) in the I-595 corridor. In developing the I-95/I- 595 Master Plan Locally Preferred Alternative, it was found that high performance transit would be needed to address future travel needs in the corridor. The I-95/I-595 Master Plan recommended an alternatives analysis to follow, if the elected leaders of Broward County wished to pursue its implementation. The MPO subsequently approved funding for an alternatives analysis, which is the Central Broward East-West Transit Analysis. I-595 Project Development and Environmental (PD&E) Study (Underway) FDOT is conducting a Project Development and Environment (PD&E) Study to evaluate traffic operations and safety along the I-595 corridor in Broward County. The I-595 PD&E Study is an outgrowth of the I-95/I-595 Master Plan that led to the development of the Locally Preferred Alternative (LPA) that was approved by the Broward County MPO in 2001 and has received favorable comments from FDOT s Central Office and the Federal Highway Administration (FHWA). The study limits for the on-going PD&E extend from just west of I-75 to just east of I-95, a distance of approximately 12 miles. The study is considering interchange modifications, braided and other ramp modifications, and the addition of revers- 8
14 Figure 3: Other Transit Studies in the Central Broward Area 9
15 ible lanes. Development of roadway improvements has been closely coordinated with options for transit alignments within the I-595 right-of-way to minimize costs, potential rightof-way impacts and to ensure compatibility of roadway and transit designs. Broward County MPO 2025 LRTP (December 2001) The 2025 LRTP is described here because it was the adopted LRTP in place when the Central Broward East-West Transit Analysis was initiated. The projects and programs informed and influenced the development of alternatives. The Broward County MPO defined a countywide network of premium transit, and express and local bus services in its 2025 LRTP. The 2025 Transit Plan, contained within the LRTP, recommends transit improvements within the central Broward study area. Proposed transit services within this study area include premium transit within the I-595 corridor and bus rapid transit along several major arterials. The 2025 Cost Feasible Plan depicted the proposed transit elements of the 2025 LRTP. Key elements included improving the headways on over 40 routes. The headway improvements generally doubled the frequency of service (e.g. from 30 minutes to 15 minutes), with no listed route having a headway of over 30 minutes. There were several bus rapid transit (BRT) routes identified in the Cost Feasible Plan. The proposed BRT routes created a network of service on major east-west and north-south arterials and highways. East-west BRT routes were planned on Pines Boulevard, Sheridan Street, Sunrise Boulevard, Broward Boulevard, Oakland Park Boulevard, Commercial Boulevard, Atlantic Boulevard and Sample Road. Most of these routes extended from I-75 or the Sawgrass Expressway in the western part of the county to US 1 or SR A1A in the eastern part of Broward County. North-south BRT routes were planned on Powerline Road, University Drive and SR 7. These routes generally extended the length of the county. High Performance Transit (HPT) was planned on I-595 from 136 th Street to US 1. A central circulator loop from the Tri-Rail station at Broward Boulevard through downtown Fort Lauderdale to the beaches was also included in the LRTP. The airport was also shown as part of the HPT network. The HPT service shown in the 2025 Cost Feasible Plan also included the Transit Bridge service from I-595 south along SR 7 into Miami-Dade County. Broward County MPO 2030 LRTP (December 2004) The Broward County MPO LRTP Year 2030 Update (adopted December 2004) is a plan to guide development of multi-modal transportation systems throughout Broward County for the next twenty-five years. The plan will be used by local governments to prioritize the majority of transportation spending through this period, so it must reflect the choices and desires of Broward County s residents, business people and visitors. In accordance with federal law, the plan is updated every three years to account for the changing needs of the county s population. The year 2030 update builds upon the previous plan in terms of the mobility choices to be provided through non-automobile modes of transportation. Traditionally, long range plans have focused on road building to improve travel conditions for the automobile-driving public, with less attention paid to transit, bicycle and pedestrian modes of travel, and waterborne and freight transportation. As Broward County becomes more densely developed, elected officials, planners and engineers realize that to meet mobility needs in the county it has become vital to plan for a transportation system that provides a range of mobility options. 10
16 Tri-Rail Master Plan (December 2001) Tri-Rail s 2020 Plan describes the strategies for developing expansion opportunities and infrastructure investments for the commuter rail system managed by the South Florida Regional Transportation Authority/Tri-Rail covering Miami-Dade, Broward, and Palm Beach counties. In relation to the Central Broward East-West Transit Analysis study area, the Tri- Rail plan identifies an expansion opportunity from Sawgrass Mills to downtown Fort Lauderdale, with recommendations for development of light rail transit technology along an east-west arterial route, currently shown as Sunrise Boulevard-University Drive-Broward Boulevard Vision for Fort Lauderdale-Hollywood International Airport (November 2002) The 2020 Vision was developed in anticipation of the next update for the airport Master Plan. The strategies included in this document are intended to account for growth and guide development at the Fort Lauderdale-Hollywood International Airport over the next two decades. The primary airport transit projects currently being promoted as part of the 2020 Vision are the airport to seaport People Mover and the Intermodal Center. A feasibility study for the automated People Mover system, which includes an evaluation of the Intermodal Center, began in Port Everglades Master Plan (August 2001) The Port Everglades Master Plan Update of 2000 assesses the future facility needs for the port, and subsequently outlines comprehensive 5-year and 10-year master plans, with corresponding 5-year and 10-year capital improvement plans. A plan for a fixed guide-way People Mover system connecting Port Everglades to the Intermodal Center is discussed here as a two phase project. Phase I looks to connect the proposed Intermodal Center to the Northport Cruise Complex, while Phase II would spur off of the original line to the Midport Cruise Complex. Both phases of the People Mover project are designated to follow the completion of extensive port expansion projects for both complexes. Broward County Transit Bridge Corridor Alternatives Analysis (Underway) The Transit Bridge study evaluates the alternatives for developing premium transit service improvements between Miami-Dade and Broward Counties. Results from this study determined that a north-south bus rapid transit corridor should be developed between the two counties along US 441 (SR 7). The secondary study area for the Transit Bridge alignment identifies an anticipated connection with anticipated high performance transit service in the central Broward corridor. South Florida Education Center Transit Access Study (November 2001) The SFEC is a consortium of six educational institutions located in the Town of Davie. The member institutions of the SFEC have formed a Transportation Management Association (TMA). The SFEC TMA transportation plan summarizes the characteristics of current transit services, mainly fixed route bus service provided by Broward County Transit (BCt) connected to Tri-Rail. Some of the needs identified from this plan are improved transit service hours, frequency, coverage, and infrastructure. The plan also identifies specific land use characteristics that have the potential for enhancing overall transit usage, such as pedestrian design and amenities, restricted parking, and transit priority infrastructure. Downtown Fort Lauderdale Circulation Study (RAC Subarea Mobility Study) (November 2002) The City of Fort Lauderdale and its Downtown Development Authority began a study to improve community awareness of pedestrian-oriented design and transit access strategies. 11
17 The study area and pedestrian-oriented transit linkages are the Beach Community Redevelopment Agency (CRA) area, the downtown, and the Northwest/Progresso/Flagler Heights CRA area. The first phase consisted of presenting the Mobility Opportunities Plan Map, cross sections, plan views, and sketch illustrations in the special attention examples areas, a community awareness plan, and notice to Congress of the Regional Activity Center (RAC) subarea mobility study activities. Broward County Transit Master Plan (Underway) The Broward County Board of County Commissioners recently approved the development of a Transit Master Plan. The purpose of the study will be to develop a ten-year plan that serves as a basis for development of enhanced transit services in Broward County. This study will also have a financial element to consider possible funding options for the service. This plan will coordinate and be consistent with the various other on-going transit studies. It will also serve as the basis for BCt s Transit Development Plan, as required by Florida Statute. Broward County Transit Development Plan (December 2003) The BCt Transit Development Plan (TDP) is a short-range plan that addresses operational and capital improvements for Broward County s Mass Transit Division. This plan is a Major Update covering years A goal of the TDP is to enhance local and regional connectivity. Objectives include implementing an evolution process within corridors programmed for BRT and implementing smaller scale transit projects during the TDP timeframe that will be needed to support large, capital intensive improvement projects in later years. Downtown Fort Lauderdale Connection Study (Underway) The Downtown Connection Study addresses the need for a potential link between the I-95 High Occupancy Vehicle (HOV) System and the Fort Lauderdale CBD. Initial identification of station locations; community involvement to understand alignment, guideway, and technology preferences; and gaining full city involvement in station area planning has been accomplished. The results of this study will be integrated into the Central Broward East- West Transit Analysis as input to the alignment and technology considerations. I-75 Master Plan / PalTran Extension (Underway) The goal of the I-75 Master Plan is to identify various transportation alternatives for alleviating congestion on the study corridor linking Miami-Dade and Broward counties. The transit system would potentially consist of a dedicated bus or rail system along I-75 between I-595 and SR 826. In relation to the Central Broward East-West Transit Analysis study area, this I-75 alternative proposes stations at Sawgrass Mills, the Arvida Parkway, and Griffin Road. Additionally, an extension of the current Metrorail system is being considered to the proposed PalTran station at State Road (SR) 826/Palmetto Expressway and NW 79 th Avenue, which would potentially link up to the south end of the I-75 corridor. South Florida Transit Analysis Study (May 2003) The South Florida Regional Transportation Organization addresses transportation needs for the tri-county area (Palm Beach, Broward, and Miami-Dade counties) of South Florida. Building on current long range plans in each of the three counties, the Transit Analysis Study examines transit alternatives for the region, and formulates a phased plan. In the Short-Range Plan Phase, several corridors are identified for development of bus rapid transit systems, including the alignment displayed in the Tri-Rail Master Plan along Broward Boulevard and Sunrise Boulevard. 12
18 2.2 RELATIONSHIP TO OTHER ON-GOING STUDIES Alternatives Analysis Summary Report This study is being performed in cooperation with various transportation planners and providers to address the growing concern for mobility in the region. The Broward County MPO recently updated its long range transportation plan for 2030, and this project is included in that plan. There is a Project Development and Environment study underway to evaluate providing reversible lanes within the median of I-595. These two projects are working together to develop a multimodal corridor that maximizes the efficient use of funds for right-of-way and construction. 2.3 TRAVEL DEMAND ANALYSIS Travel demand forecasts were made using the Southeast Florida Regional Planning Model (SERPM) as the most appropriate tool given the important regional nature of a major eastwest transit system. The model was developed based on an extensive data collection effort in The latest applications, for the year 2025, include the current assumptions for highway and transit services in all three counties, Miami-Dade, Broward, and Palm Beach. The current study focused on the details of transit service assumptions in Broward County and how they might need to be modified to support the evaluation of transit alternatives. The project team worked closely with the staff of the Federal Transit Administration (FTA), which led to a number of refinements to the model structure as described below Refinement of the Model and Alternatives One of the concerns expressed by the modeling team and FTA was the assumption that a high capacity transit system in Broward County would be expected to capture ridership in the same way as the full grade-separated transit system represented by Metrorail in Miami-Dade County. An attempt was made to develop a Broward premium transit constant as a blend of other bias constants in the model. A range of bias constants based upon this approach was presented to FTA. FTA staff expressed concern regarding the bias constants in SERPM that were used in blending and, moreover, that these bias constants put the entire modeling system in question for use in New Starts modeling. As a result, the project team embarked on a set of revisions to the model and its calibration. The changes to the model were to refine the transit targets used to calculate the bias constants, especially for small market segments where a poorly estimated target could lead to very high (or low) bias constants. Positive constants for zero-car households ranged from 4.5 to 15.0 while negative coefficients on 2+ car households ranged up to The revised coefficients for zero car households ranged from -4.0 to +3.4, while values for 2+ car households were mostly -1.3 to Extensive testing of the model was undertaken and showed that the results were almost always equal in value to those produced previously, except for a few small market segments, while producing bias constants that were much more logical and received a more favorable review by FTA. Once the revisions to the SERPM model structure described above were completed, work continued on specifying a range of bias constants for these build alternatives that would fall between bus and Metrorail in magnitude, as described earlier. For purposes of the analysis, two or three sets of bias constants were computed, based upon the percentage of the bus versus Metrorail share that was used. The following runs were prepared: 13
19 Alternative Bus Share Metrorail Share I-595 LRT Low 100% 0% I-595 LRT Higher 50% 50% I-595 LRT Very High 20% 80% I-595 BRT Low 100% 0% I-595 BRT High 70% 30% Sunrise/Broward Low 100% 0% Sunrise/Broward High 70% 30% Sunrise/Broward Higher 50% 50% The argument for the very high option for I-595 was based on assumptions in one operating scenario where the alignment would be largely grade separated and thus would perform (and look) much like Metrorail. Conversely, the Sunrise/Broward alignment was never assumed to attain that degree of grade separation. Several additional discussions were held with FTA staff concerning model performance and assumptions. In the meantime, FTA had been updating their own standards for reviewing models and identifying elements of good practice. Although significant improvements were made to SERPM, a number of additional refinements were thought to be necessary. The major revision to the model was a restructuring of the bias constants. FTA expressed strong preferences for models which do not have separate bias constants for each transit sub-mode and access mode combination as in SERPM. They prefer to see a simpler model structure whereby far fewer numbers of bias constants would be used in various combinations. In addition, several other structural changes were added to the model. Some changes were made in the model structure to improve the estimation of bus running times in different operating environments. FTA also indicated that new modes should probably be treated separately in the model structure but with a range of bias constants specified as a sensitivity test reflecting the uncertainty in a new mode. For SERPM, another path was added for the new mode, both walk and auto access, and used for both proposed BRT and LRT systems in Miami-Dade and Broward Counties. Several other special updates were made to the model, including: Ensuring consistency between mode choice and transit path building parameters throughout the model structure Changing path dis-favoring to a value (1.20) more acceptable to FTA than the previous approach (favoring by 0.10). This change results in paths being considered which are only marginally worse than the minimum time paths, as opposed to paths that can be unrealistic. Extend cut-offs for path timing out from 180 weighted minutes to 300 weighted minutes to make the existence of paths more consistent between alternatives Replace minimum transit run time cliffs with minimum auto distance values which are not sensitive to transit alternatives Research at FTA indicated that a rail alternative largely on an exclusive right of way, as was proposed for this project, might justify up to 12 minutes of travel time savings as a premium transit effect when applied to the calculation of cost effectiveness, which has become the primary measure for FTA assessment of the worthiness of projects. This 14
20 value was applied as a test compared to values of zero used as the default. Such a premium transit effect is often termed a silver bullet in modeling parlance. Initial analysis indicated that the LPA would not meet the dollar per user benefit hour criterion that FTA established for projects to receive a recommended rating. FTA also encourages consideration of a Minimum Operating Segment (MOS) as a way to consider intermediate cost alternatives. An MOS was defined from Flamingo Road at I- 595 to the BCT Broward Central Terminal in downtown Fort Lauderdale. The MOS will be developed further during the next phase of the project. A revised and simplified Transportation System Management (TSM) alternative was prepared in consultation with FTA, with a slightly different version used for consistency with the MOS alternative. The MOS was assumed to be entirely grade separated and thus to operate virtually identically to Metrorail in Miami-Dade County. Therefore, an additional sensitivity test was prepared using Metrorail bias constants for the East-West project. Mode choice results are summarized in Table 1 for the MOS with the standard constant (treated like bus), with a 12 minute premium transit (or silver bullet ) effect added, and with the alternative treated as Metrorail. The Metrorail constant is slightly higher for home based work trips, resulting in a modest increase in ridership, but larger for non-work and non-home base trips, making the increase for total ridership quite substantial. Also shown are results for the full LPA with the standard constant and with the premium transit effect. The more detailed impact of the various alternatives on boardings is shown in Table 2. The premium transit effect increases ridership about 20 percent across the board. Table 2: Mode Choice Model Results TSM TSM MOS IOS IOS MOS MOS IOS TSM LPA LPA Market Segment (IOS (MOS version) Standard Premium Silver Bullet Transit as Metrorail (LPA version) Standard Premium Silver Transit Bullet Home Based Work Walk Access Standard Bus 73,019 70,544 70,241 70,065 73,023 69,696 69,364 BRT/LRT 2,366 5,880 7,119 2,347 2,380 7,330 8,921 Metrorail 25,805 25,813 25,755 31,091 25,816 25,818 25,743 Tri-Rail 8,816 8,395 8,026 7,984 8,789 8,294 7,855 Subtotal 110, , , , , , ,883 Auto Access Standard Bus 7,757 5,974 5,815 5,793 7,893 5,753 5,615 BRT/LRT 1,589 5,773 7,484 1,555 1,609 6,649 8,635 Metrorail 24,669 24,609 24,556 31,294 24,667 24,593 24,509 Tri-Rail 9,396 9,093 8,791 8,729 9,378 8,996 8,638 Subtotal 43,411 45,449 46,646 47,371 43,547 45,991 47,397 Total 153, , , , , , ,280 All Trips Walk Access Standard Bus 247, , , , , , ,593 BRT/LRT 3,493 9,160 10,667 3,399 3,638 12,123 14,055 Metrorail 65,078 65,071 65,011 74,520 65,106 65,084 65,005 Tri-Rail 11,792 11,362 10,987 10,922 11,770 11,225 10,780 Subtotal 327, , , , , , ,433 Auto Access Standard Bus 12,100 9,297 9,095 9,041 12,273 8,969 8,799 BRT/LRT 2,466 9,095 11,479 2,424 2,470 10,759 13,614 Metrorail 38,644 38,567 38,514 50,566 38,641 38,550 38,464 Tri-Rail 13,639 13,293 12,989 12,917 13,629 13,141 12,780 Subtotal 66,849 70,252 72,077 74,948 67,013 71,419 73,657 Total 394, , , , , , ,090 15
21 Table 3: Transit System Boardings Alternatives Analysis Summary Report TSM MOS IOS MOS IOS MOS IOS TSM LPA LPA Service (MOS (IOS version) Standard Silver Bullet as Metrorail (LPA version) Standard Silver Bullet Home Based Work Palm Beach Local 14,592 14,795 14,899 14,775 14,680 14,746 14,734 Broward Local 68,580 70,359 71,959 73,269 67,534 69,684 71,419 Miami-Dade Local 102, , , , , , ,052 Metrorail 65,384 65,501 65,568 65,432 65,326 65,467 65,402 Tri-Rail 22,967 23,425 23,741 23,881 23,056 23,515 23,945 Palm Beach Express Broward Express 4,967 1,466 1,487 1,579 5, ,009 Miami-Dade Express 2,447 2,425 2,446 2,463 2,463 2,465 2,455 Broward Limited 18,881 19,337 19,860 20,045 19,075 19,421 20,019 Miami-Dade Limited 25,633 25,677 25,470 25,644 25,660 25,556 25,537 Broward LRT 0 9,483 11,745 13, ,252 14,902 Miami-Dade LRT 6,947 6,966 6,984 6,969 6,927 7,002 6,916 Total 333, , , , , , ,575 Total Daily Palm Beach Local 32,918 33,168 33,225 33,113 32,927 33,060 33,099 Broward Local 180, , , , , , ,956 Miami-Dade Local 286, , , , , , ,620 Metrorail 133, , , , , , ,384 Tri-Rail 31,432 31,854 32,169 32,389 31,531 31,965 32,449 Palm Beach Express Broward Express 8,230 2,700 2,756 3,028 9,564 1,365 1,398 Miami-Dade Express 3,153 3,125 3,172 3,181 3,166 3,187 3,161 Broward Limited 27,470 27,973 28,581 28,846 27,692 28,086 28,649 Miami-Dade Limited 47,130 47,175 47,015 47,201 47,128 47,159 47,122 Broward LRT 0 14,348 17,553 22, ,830 23,688 Miami-Dade LRT 10,844 10,822 10,782 10,794 10,777 10,844 10,737 Total 762, , , , , , ,820 The FTA uses the concept of user benefits to evaluate the investment-worthiness of transit projects. User benefits are computed based on all the differences attributed to the various coefficients and bias constants in the mode choice model. These differences are then converted to an equivalent change in minutes of travel time saved, which can be tabulated and compared between alternatives. Bias constants, such as the premium transit constant, make up part of the conversion to minutes (or hours) of travel time savings, otherwise known as user benefits. The user benefit values are then used as part of overall project evaluation and compared to various cost measures attributed to the comparison of the build project to the TSM baseline to establish a cost-effectiveness ratio for the project. A summary of user benefits for the options described above is contained in Table 3. In addition to various tabular summaries, user benefits are also typically depicted by geographic area when comparing alternatives. Generally, the maps are shown in shades of green for traffic analysis zones which show a user benefit for the build project and shades of red for zones which show dis-benefits. An example of a user benefit map prepared for the Central Broward East-West Transit Analysis LPA is shown in Figure 4. As shown, benefits are well-distributed throughout the corridor. 16
22 Table 4: User Benefit Summary Alternatives Analysis Summary Report MOS IOS MOS IOS MOS IOS LPA LPA Standard Silver Bullet as Metrorail Standard Silver Bullet Home Based Work Person Trips 4,437,715 4,437,715 4,437,715 4,437,713 4,437,713 Base Transit 152, , , , ,517 Delta Transit 2,634 4,327 5,398 3,559 5,695 User Benefits (minutes) from service increase 4,636 5,456 6,016 8,449 10,088 from service decrease (53) (53) (56) (51) (51) from capping (8,392) (20,357) (37,915) (13,507) (33,075) net 151, , , , ,604 Home Based Other Person Trips 10,552,943 10,552,943 10,552,943 10,552,968 10,552,968 Base Transit 161, , , , ,203 Delta Transit 1,130 1,712 4,104 1,668 2,445 User Benefits from service increase 4,595 5,439 8,805 10,113 11,952 from service decrease (55) (55) (53) (45) (45) from capping (6,232) (16,268) (126,542) (10,145) (26,189) net 74, , , , ,883 Non-Home Based Person Trips 5,822,282 5,822,282 5,822,282 5,822,282 5,822,282 Base Transit 77,948 77,948 77,948 78,043 78,043 Delta Transit , ,119 User Benefits from service increase 977 1,063 1,536 3,149 3,436 from service decrease (79) (79) (77) (183) (185) from capping (1,435) (2,417) (23,854) (3,395) (5,183) net 29,252 33,872 63,568 51,920 58,104 Total Person Trips 20,812,940 20,812,940 20,812,940 20,812,963 20,812,963 Base Transit 391, , , , ,763 Delta Transit 4,307 6,681 11,038 6,205 9,259 User Benefits from service increase 10,208 11,958 16,357 21,711 25,476 from service decrease (187) (187) (186) (279) (281) from capping (16,059) (39,042) (188,311) (27,047) (64,447) net 254, , , , ,591 Total UB (Hours) 4,249 6,407 8,814 6,089 8,777 17


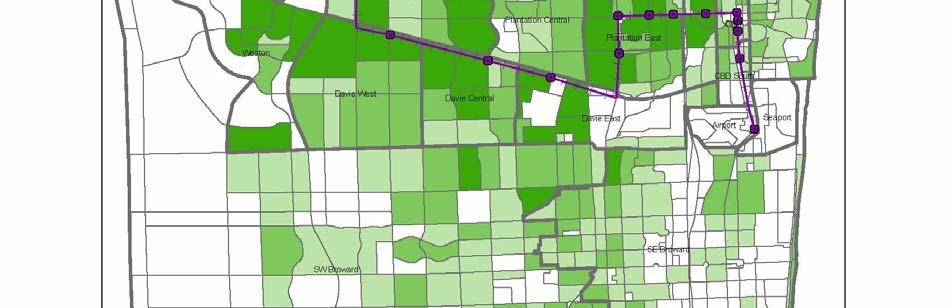
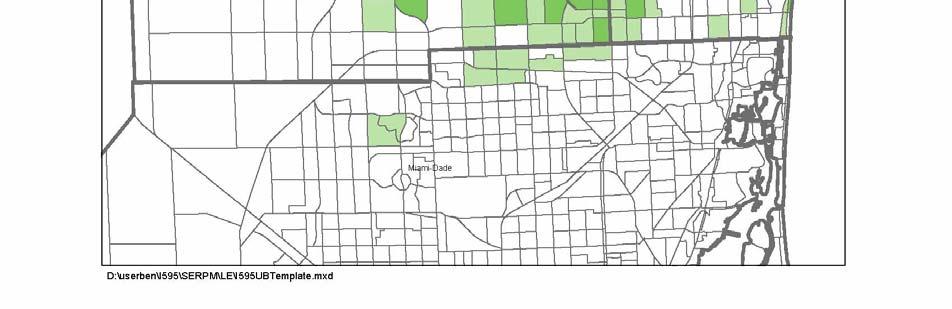
23 Figure 4: Sample User Benefit Map 18


24 3.0 TECHNOLOGY EVALUATION This chapter describes the potentially feasible technologies considered for the CBEWTA. A range of transit technologies can fulfill general mobility needs. An analysis of transit technologies was conducted to identify the modes that would be appropriate for Broward County. 3.1 DEFINITION OF TRANSIT MODES For this assessment, the term technology reflects mode, such as bus or rail, as well as application of the technology, such as ability to operate in mixed traffic or requirement of a dedicated guideway. The focus of this assessment was to determine the most appropriate technologies that could meet travel needs within central Broward County. Evaluation criteria reflect system compatibility, cost-effectiveness, station/access locations and impacts, operating impacts, service frequency, potential ridership, likely environmental impacts and development status. This section identifies the possible available technologies and assesses which technologies could meet the needs for the CBEWTA. Finally, the assessment recommends a limited set of transit technologies for consideration in the CBEWTA. Roadway improvements, intelligent transportation system and travel demand management elements that are part of the Baseline Alternative and may be incorporated as part of the LPA are also described in the following pages. These improvements to the transportation system are not evaluated because they will be included in both the Baseline alternative and in the locally preferred alternative (LPA) Express Bus Bus systems offer flexibility in the location and level of service provided. Buses can operate on virtually all city streets and highways. A wide variety of vehicle types and sizes are available. Capital cost to expand service is relatively low. A wide variety of service types can be provided with buses such as express, limited stop, fixed route, route deviation and demand responsive services. In express service, buses have very few or no stops between where passengers board and the end of route. Park-and-ride lots are often provided for the users of express bus service. Service frequency can be changed to meet peak period, off-peak period and special event demand. Capacity is limited somewhat by vehicle size. Since buses operate in mixed traffic, it is difficult to provide a travel-time savings versus travel by car. Typical Express Bus Characteristics Capital Cost / Vehicle: $200,000+ (40 ft. urban bus) Operating Cost / Passenger Mile: $ $0.50 Service distance: Several blocks for circulators, 10+ miles for express service Typical maximum speed: Route specific speed limits Typical service frequency: 5-20 minutes during peak periods Seated capacity: per bus (depending on vehicle size & type) 19


25 3.1.2 Bus / HOV Lanes Bus/High-Occupancy Vehicle (Bus/HOV) lanes provide a dedicated travel lane for the exclusive use of buses, vanpools, private shuttles, carpools, and other authorized vehicles. Bus/HOV lanes are designed to provide travel time savings and improve travel time reliability by offering a means to bypass traffic congestion in the adjacent general-purpose lanes. Increases in ridesharing and transit use in a travel corridor can be achieved when improvements and/or travel time reliability creates significant incentives for individuals to choose higher-occupancy modes over driving alone. Bus/HOV Lanes allow an increase in the person capacity of the roadway. A significant benefit is that more people travel in fewer vehicles reducing congestion and emissions. Typical Bus/HOV Characteristics Capital Cost / Mile: $4-8 million Operating Cost / Passenger Mile: $0.45 -$0.65 Service distance: 5 miles or more Typical maximum speed: 65 mph (site specific speed limits) Typical service frequency: 5-15 minutes during the peak Seated capacity: per bus Bus Rapid Transit (BRT) BRT provides the speed and guideway advantages typically attributed to a rail line, with the potential added advantage of bus circulation within neighborhoods or other areas. The BRT concept offers high capacity bus operation along an exclusive bus-only roadway (busway or transitway) with on-line stations. In some cases, the vehicles may be specialized and operate only on the transitway as in Curitiba, Brazil or the proposed project in Lane County, Oregon. In other cities, as in Ottawa shown here, standard urban buses operate on both the transitway and city streets. This allows the vehicles to circulate through neighborhoods or downtown and provide high speed, express/limited stop service when operating in the transitway. Other approaches are being taken to the implementation of BRT. The Los Angeles Rapid service operates in a shared lane of major arterial streets with limited stops, distinctive shelters and preferential signal treatment. The Honolulu BRT calls for buses to operate in exclusive median lanes or curbside contra flow lanes (38 percent of its length), semi-exclusive curb lanes that also allow tour buses and turning cars (29 percent) and in mixed traffic (33 percent). The second phase would use mostly dedicated lanes, including the existing HOV lane on the H-1 Freeway. 20

 is a rail technology that can navigate typical roadway intersections, and travel along streets, highways, or exclusive rights-of-way.")


26 Typical BRT Characteristics Capital Cost / Mile: $ million - shared lane $8-25 million dedicated lane or guideway Operating Cost / Passenger Mile: $0.55 $0.90 Service distance: 5 miles or more Typical maximum speed: mph Typical service frequency: 3-15 minutes during the peak Seated capacity: per bus Light Rail Transit Light Rail Transit (LRT) is a rail technology that can navigate typical roadway intersections, and travel along streets, highways, or exclusive rights-of-way. Since tracks are flush with the street surface, LRT can be operated in areas with pedestrian, cyclist, or automobile activity. Vehicles typically receive power from an overhead wire. Light rail vehicles can take a variety of forms, including restored or replica historic streetcars. Some U.S. cities are using European-style modern trams (see photograph at left) or streetcars for circulation and distribution service. These vehicles are smaller and have lower maximum speeds than those used in line-haul service in Dallas and Denver, for example. Typical Light Rail Characteristics Capital Cost / Mile: $20-55 million Operating Cost / Passenger Mile: $ $0.55 Service distance: 25 miles or less Station spacing: Stations every ¼ to 2 miles Typical maximum speed: mph Typical service frequency: 5-10 minutes during the peak Seated capacity: per train Commuter Rail Commuter rail systems operate typically along existing freight railroad rights-of-way, serving longerdistance trips between central cities, suburban activity centers, and outlying areas. Vehicles are configured to provide maximum seated capacity and comfort. Commuter rail vehicles can operate in the same right-of-way with freight trains. In the United States, commuter rail vehicles are pulled or pushed by a diesel powered locomotive (as shown in the photograph of Tri-Rail to the upper right). In other countries, selfpropelled trains (shown at right), called Diesel Multiple Units or Electric Multiple Units, operate individually or linked together in trains of up to 8 cars. These vehicles typically operate on exclusive rights-of-way or on existing freight tracks, but may operate along streets or roadways. 21


27 Typical Commuter Rail Characteristics Capital Cost / Mile: $5-9 million Operating Cost / Passenger Mile: $ $0.55 Service distance: 25 miles or longer Station spacing: Stations every 2-6 miles Typical maximum speed: mph Typical service frequency: minutes during the peak Seated capacity: Up to 1,500 per train Heavy Rail Heavy rail operates along an exclusive guideway and is grade separated, usually elevated or underground, from other vehicular or rail modes. Heavy rail vehicles receive electric current from a third rail. Heavy rail is appropriate for corridors with very high passenger demand. This technology can transport a very high volume of passengers per hour at a high average speed. Complete grade separation of the alignment allows reliable operations. Miami-Dade Metrorail is an example of a heavy rail system. Typical Heavy Rail Characteristics Capital Cost / Mile: $ million Operating Cost / Passenger Mile: $ $0.35 Service distance: 5 to 30 miles Station spacing: Stations every ½ to 2 miles Typical maximum speed: mph Typical service frequency: 5-10 minutes during the peak Seated capacity: passengers per car, plus standees Automated Guideway Transit Automated Guideway Transit (AGT), also referred to as peoplemovers, includes steel-wheel or rubber-tired vehicles that operate under automated control on an exclusive guideway, grade-separated from other vehicular traffic. AGT may utilize conventional electric propulsion, or alternative types such as linear induction and magnetic levitation. AGT has been implemented as line haul transit in medium to large metropolitan areas. Shuttle or circulator services for downtowns or airports represent the more common use of AGT. Automated operation allows for high service frequency and high passenger capacity, as frequent service offsets smaller vehicle size. The Metromover in downtown Miami is an example of an AGT system. Typical Automated Guideway Transit Characteristics Capital Cost / Mile: $50-70 million Operating Cost / Passenger Mile: $ $2.40 Service distance: 1-5 miles Station spacing: Stations every ¼ to 1 mile Typical maximum speed: 25 to 50 mph Typical service frequency: 1-10 minutes during the peak Seated capacity: passengers per car 22


28 3.1.8 Monorail A monorail system is comprised of rubber-tired vehicles that operate along a single rail, or beam. The beam supports the vehicle and provides guidance, and houses the electrical power source. Monorail can be designed for a variety of environments, including activity area circulation, shuttle service, and line haul transit. However, its most common application has been as circulators or shuttles at activity centers such as airports or theme parks. Monorail has met very limited use as a line-haul transit mode; it is not used in North America for this purpose at this time. Recently, voters in Seattle approved a measure to expand the existing 2.2-mile system by 14 miles at a cost of $1.75 billion, approximately $125 million per mile. Typical Monorail Characteristics Capital Cost / Mile: $ million Operating Cost / Passenger Mile: $ $4.25 Service distance: Under 25 miles Station spacing: Stations every ½ to 2 miles Typical maximum speed: 50 mph Typical service frequency: 5-10 minutes during the peak Seated capacity: 30 passengers 3.2 OTHER TECHNOLOGY CONSIDERATIONS Roadway Improvements for Transit Certain types of roadway and intersection improvements can confer special treatment for transit vehicles that reduce transit travel time and improve schedule adherence, making transit a more attractive mode choice. In some cases, these roadway and intersection improvements also improve the flow of generalpurpose traffic as well. Designated Lanes for Transit Vehicles: The addition or designation of a curb lane in each direction for priority use by transit vehicles. Non-transit vehicles may be permitted to use the lane for right turns only. Queue Jumping Lanes: The addition of a lane at selected intersections, essentially a right turn bay, that allows the transit vehicle to move to the head of the traffic queue. Transit vehicles can get an additional advantage with a separate signal that allows them to move through the intersection ahead of general traffic and merge back into the general traffic lanes past the intersection. Transit Signal Priority: This technology gives preference to buses or other transit vehicles (and/or emergency vehicles) at intersections. Buses are equipped with a device that emits a signal to a receiver mounted on the traffic signal. When the transit vehicle approaches the intersection, the signal emitted by the bus directs the traffic signal to hold the green 23
29 time longer or shorten the red time for the transit vehicle so that it will not have to stop at the intersection, if it is not a designated stop on the route. Bus Stop Pullouts/Locations: Pullouts, a curbside space that allows the bus to load and unload passengers out of the flow of traffic, can improve both transit and traffic operations. The location of bus stops, nearside or far side of the intersection can also affect traffic and transit operations. A far-side bus bay allows the bus to use the intersection to move into the bus bay or move from a right turn only lane directly into the bus bay. At signalized intersections, nearside stops allow passenger boarding and alighting during the red signal time. Mid-block bus stops, especially when combined with a pullout, move the bus out of traffic lanes for passenger pick up and drop off. Mid-block stops can make transfer from on route to another more difficult for transit patrons. Skip-stop Service: One of the reasons that travel time for transit trips is longer than for auto trips is the additional time required for transit vehicles to accelerate and decelerate at stops. In skip-stop service, selected runs load and unload passengers at every other stop. Skip-stop operations can also include express stops. Express stops are located further apart than skip-stops (half mile to one mile). Express runs are limited in frequency and generally to the peak periods. Streamlining Routes: Deviation of a route from a major thoroughfare or arterial adds route miles, turns and travel time. Such deviations should be limited and used only if they generate substantial ridership. Add/Increase the Capacity of Left and Right Turn Bays: At some intersections lengthening or creating two left lanes to increase storage capacity insures that there is adequate space for transit vehicles as well as other traffic. It can also insure that transit vehicles waiting to make a left turn do not partially block through traffic lanes, improving general traffic operations Travel Demand Management (TDM) Travel Demand Management (TDM) attempts to reduce the overall pressure placed on the existing transportation network by increasing transit ridership, vehicle occupancy, walking and bicycling, and to reduce the lengths of trips, move them to off-peak hours, or eliminate them altogether. Strategies to Promote Carpooling: o Establish on-line ridematching services. o Work with employers and property managers to distribute ridematching forms and facilitate ridematching programs. o Offer guaranteed-ride-home programs from employment locations. (Guaranteed-ride-home programs provide employees who carpool a ride home if an emergency requires them to leave work during midday or if they have to stay late.) o Offer preferential parking at worksites for carpoolers. o Create incentive program offering prizes or cash payments to carpool participants. o Charge for parking at work sites. o Create regional for-profit carpooling programs. o Create real-time carpool matching programs. 24

30 Strategies to Promote Vanpooling: o Provide matching service for vanpooling. o Host zip code meetings at worksites. o Offer guaranteed ride home. o Use third-party vendor and subsidize operating costs. Purchase vans for employers and provide for maintenance. o Offer preferential parking for vanpool vehicles at worksite. o Offer monthly subsidy to vanpool users. Strategies to Promote Transit Use: o Encourage employers to subsidize and/or provide bus pass programs. o Offer guaranteed ride home. o Provide priority access for feeder bus pick-up and drop-off activities. Improve bus stops and bus shelters. o Develop feeder bus services from work sites to park-n-ride or bus transfer centers. Strategies to Promote Bicycling and Walking: o Provide bicycle information to employees. o Support Bike-to-Work Week. o Offer guaranteed ride home. o Provide bike storage and employee showers at work sites. o Distribute local real estate information to new employees. o Create safe and convenient bicycle routes and pedestrian amenities through the area. o Require pedestrian and bicycle design amenities for new developments Intelligent Transportation Systems (ITS) Intelligent Transportation Systems (ITS) focus on the optimization of the existing transportation network through the integration of advanced electronics, computers, and communications. Ramp Metering: This refers to the installation of signals to control traffic entering high-volume roadways, which spreads flow peaks across longer periods of time, utilizing available capacity more efficiently and reducing overall travel times. It also decreases accident potential by reducing turbulence in merge zones by dispersing entering vehicles into a consistent release pattern. HOV bypass lanes are common at ramp metering locations to allow HOV vehicles to bypass the meter delay via a separate lane. Traffic Signal Control Systems: Optimizes traffic flow by adjusting signal operations through use of real-time traffic data. Coordinated, computerized traffic signals reduce traffic delay and accident potential by facilitating uninterrupted traffic flow. Transit Management Systems: Uses technology to improve fleet management, schedule performance and safety. Uses Automatic Vehicle Location (AVL) equipment to provide real-time data to optimize bus routes and running times. 25

31 AVL equipment can utilize vehicles as mobile probes with ability to obtain realtime traffic conditions. Assures reduced response time to bus incidents by pinpointing bus locations and dispatching aid. Incident Management Systems: Programs that detect and verify incidents, clear incidents quickly and efficiently, and inform motorists of potential delay from incidents. ITS applications include automatic detectors, closed circuit television, aerial surveillance, courtesy patrol units and inter-jurisdictional coordination, allowing reduced response time to incidents. Traveler Information: Provide real-time traveler information concerning traffic congestion, weather conditions, alternate route availability and transit schedules and running times. The system could be accessed by automated signs, telephone, Internet, information kiosks, cable television and radio. Electronic Fare Payment Systems: Allows travelers to consolidate all transit and parking transactions into one card for added convenience to users. Provides centralized information to service providers concerning ridership information for various routes and travel time data. 3.3 TECHNOLOGY EVALUATION Technology options were compared to a set of guidelines. The evaluation was conducted by consideration of advantages and disadvantages of each technology as related to the defined guidelines. Only technologies that meet defined guidelines with a + or Good rating on at least five (5) criteria are considered feasible to carry forward in the Central Broward East- West Transit Analysis Evaluation Guidelines Guidelines were defined to reflect corridor and regional transportation needs and likely fiscal constraints. Qualitative and quantitative issues were considered. Guidelines related to system compatibility, cost-effectiveness, station/access locations and impacts, operating environments, service frequency, potential ridership, likely environmental impacts, and development status are described below. The technology should be compatible with the existing and planned transportation system and with community desires and the travel needs of central Broward County. The chosen technology should coordinate with planned and existing commuter rail and bus routes. The chosen technology should facilitate more direct and convenient transit travel and a decrease in travel time. The technology should not create capacity impacts at intermodal facilities. The technology should be relatively cost-effective. Projected capital and operating and maintenance costs should be comparable to that for at-grade alignments within comparable physical environments and the overall BCT system. 26
32 Stations should be easily accessible for passengers and allow easy coordination with the transit network. This relates to the number or stations; station type (at-grade or grade separated) and the type of platform (high, low, center, or side). Station spacing should allow convenient walk access. If bus access is required to reach a station, the total number of transfers for most trips should be low. The technology should be adaptable to a variety of operating environments. This relates to grade separation requirements, ease or feasibility of system extension, transfer convenience, and feasibility of implementation in various rights-of-way. Increasing service frequency generally increases ridership and should be coordinated with Tri-Rail service frequencies. The technology should provide sufficient operating capacity for expected ridership. The system should not result in extensive environmental impacts. A qualitative assessment of potential traffic, visual, historic, and other environmental impacts should be noted. The system should be compatible with existing and planned land uses. The chosen technology shall be considered appropriate based on a qualitative assessment of existing and planned development densities, mixed uses, socio-economic factors, neighborhood compatibility, and other factors that could affect level of transit demand. The system should be reliable and based on proven technology. The chosen technology shall be considered appropriate based on the number of active operations and corresponding performance records as related to maintenance and reliability. Further consideration should be given to the number of manufacturers and the compatibility of technologies. Vehicle parts, system components, and future expansions of the system should not be limited to a single supplier. Each technology will be evaluated and ranked according to these criteria as follows: Good (+) - Good performance on the quantitative or qualitative measure as compared to the other technologies. Fair/Neutral ( ) - Technology has no affect, one way or the other upon the quantitative or qualitative measure as compared to the other technologies. Poor ( ) - Poor performance upon a quantitative or qualitative measure as compared to the other technologies Evaluation Results The ranking of technologies is a qualitative assessment based on typical characteristics of each technology for application as part of the overall transit system in Broward County. A summary of this evaluation of transit technologies is provided in the Table 4 on the following page. The complete technology assessment is included in the Initial Corridor Screening Report. 3.4 RECOMMENDED TECHNOLOGIES Based on this evaluation, the alternatives for this project were BRT and light rail transit (LRT). Express bus also earned five (5) + ratings. Express bus service is incorporated into 27
33 the Baseline alternative and was not considered as one of the build alternatives. Both BRT and LRT have the capacity to meet anticipated demand and have proven to be costeffective in many systems across the country. These vehicles can operate in separate guideways or within existing roadway rights-of-way. This trait will allow direct access to activity centers and downtown Fort Lauderdale. Access to some activity centers and through existing highway interchanges will require a vehicle that can make short radius turns and ascend relatively steep grades. Bus and light rail vehicles should be able to meet the necessary geometric constraints. 3.5 SUMMARY The transit technology selected for the adopted LPA is light rail transit with enhancements to the existing bus system. Throughout the LPA evaluation both BRT and LRT were presented as technology options. Despite BRT s cost-effectiveness advantage, the MPO Board selected LRT for its ability to attract a larger number of choice riders, the potential for increasing service capacity without significant additional operational costs, and its proven record in fostering economic development. For the selected alignment, the vehicle will need to be able to travel at both high and low speeds, since it will be operating within the right-ofway of an interstate highway on a dedicated guideway, as well as on arterial streets through central Fort Lauderdale. A vehicle with a tight turning radius is necessary for navigating intersections. The specific vehicle design will be determined during the Preliminary Engineering phase of the project. Table 5: Transit Technology Evaluation Matrix CRITERIA System Connectivity Cost Effectiveness System Accessibility System Flexibility Service Frequency Ridership/ Capacity Environmental Impacts TECHNOLOGY Land Use Compatibility Proven Technology Express Bus HOV Lanes Bus Rapid Transit Light Rail Transit Heavy Rail Commuter Rail + AGT + + Monorail + Legend: + = positive; O = neutral; = negative 28
34 4.0 DEVELOPMENT AND EVALUATION OF ALTERNATIVES The evaluation of alternatives was completed using a two-tiered process that moved from a qualitative review to a more quantitative review. This two-tiered process consisted of four evaluation phases. The first evaluation was completed during the scoping phase, when initial alignment alternatives were identified and evaluated using criteria that were primarily qualitative. The alternatives resulting from the scoping phase were further evaluated during Tier 1, where a qualitative assessment of quantitative data was completed. The same set of alternatives evaluated during Tier 1 was carried into Tier 2 and were re-evaluated using refined criteria and a more quantitative process. At the end of the Tier 2 evaluation, the MPO selected an approved alignment, which was further evaluated during the fourth phase. This fourth round of evaluation was necessary in order to assist the MPO in deciding between the two recommended transit technologies, BRT and LRT, and to assess variations to portions of the recommended alignment, so that a Locally Preferred Alternative was identified. This section provides an overview of each of these evaluation phases. 4.1 SCOPING Scoping meetings for the study were held on Tuesday, November 19, 2002, at the Town of Davie Police Department Complex. Two (2) separate meetings were held: one that began at 1:30 p.m. that allowed the project team to coordinate with various governmental agencies, including cities located within the study area, Broward County and other interested local, regional, state and federal agencies; and a second meeting, which began at 5:00 p.m., that was open to the public. The scoping phase of the project lasted 10 months and is documented in three reports: Scoping Meeting Summary Report, Scoping Information Document, and Initial Corridor Screening Report Scoping Alternatives Development The alternatives identified during the scoping phase focused on arterial roads and interstate highways, including a baseline alternative. These alternatives are described below and shown on Figure 5. BASELINE For the baseline case, all north-south and east-west express bus alignments defined in the Cost Feasible 2025 Transit Plan within Broward County were retained, with the exception of the Sunrise/Broward BRT as it overlaps with some proposed build projects. Premium future bus services retained are Atlantic Boulevard/Sample Road, Cypress Creek Road/McNab Road, Oakland Park Boulevard, Pines Boulevard/Sheridan Street, Flamingo Road, University Dr, US 441 North, and Powerline Road. The proposed Transit Bridge was included as a connection between the US 441 North express bus and Pro Player Stadium/Golden Glades. Furthermore, the Fort Lauderdale Downtown/Beach/Airport Loop People Mover was also included in the baseline. The I- 595 High Performance Transit corridor shown in the Cost Feasible Transit Plan was eliminated, as it is very similar to one of the east-west build alignments. NW 27th Avenue Metrorail is assumed to operate as an extension of Metrorail from central Miami- Dade to the terminus of the Transit Bridge at Pro Player Stadium. Local or express bus routes in Miami-Dade interfacing with the extension were modified in the model to stop at the proposed stations, if necessary. All other changes proposed to Tri-Rail and local bus services shown in the MPO Long Range Transportation Plan and by Miami-Dade County were retained. 29

35 Figure 5: Alignment Alternatives from Scoping 30
36 INTERSTATE 595 I-595 Right-of-Way High Performance Vehicle This I-595 alignment starts from Sawgrass Mills with station stops at 136th Ave/I-595, Flamingo/I-595, and Nob Hill/I-595. This alignment interfaces with the Transit Bridge in the I-595 median, makes a stop at SR 84 and SW 4th Avenue, then turns north on Andrews to make the common CBD stops noted above. Since there is no connection to Tri-Rail in this alignment, a new station was added in the model at SR 84. In order to provide a convenient airport connection, an HPV shuttle was assumed to operate between the station at SR 84 and SW 4th Avenue to the airport terminal. I-595 With Branch To Davie Road/Griffin Road This I-595 alignment has two branches. The northern branch follows the alignment described above, without the HPV airport shuttle. The southern branch begins as the alignment above, making stops at 136th Ave/I-595, Flamingo/I-595, and Nob Hill/I-595, but it diverges at Davie Road, stopping at the South Florida Education Center, then turning east on Griffin Road to serve the Transit Bridge, the Airport Tri-Rail stop, and the airport terminal. As this alignment operates two lines, both running at six (6) minute peak headways, this alignment would, in effect, have three (3) minute headways in the section from Sawgrass Mills to Davie Road in the I-595 right-of-way. It would therefore be expected to attract more riders to transit than the other build alignments. I-595 Express Bus This alignment consists of several bus routes operating on existing roadways and future HOV lanes where appropriate. All routes operate in both directions at 15-minute headways. The first route begins at Sawgrass Mills Mall station and operates without stops to the airport, then travels north on Andrews Avenue making stops at SE 24th Street, Broward General Medical Center, Davie Boulevard, SE 6th Street, Las Olas Boulevard, and Broward Boulevard. The second route operates in a similar way, but begins service at Broward Mall instead of Sawgrass Mills. A third route begins at Sawgrass Mills, travels south on 136th Ave to I-595, exits at University to serve Broward Mall and returns to I-595, interfaces with the Transit Bridge at SR 7, travels south on I-95 and exits at Griffin to serve the Airport Tri-Rail station, accesses the airport via Griffin, then continues to the CBD making the same stops as above. ARTERIAL STREETS Sunrise Boulevard/Broward Boulevard (Tri-Rail Long Range Plan) This alignment begins at Sawgrass Mills Mall and travels along Sunrise Boulevard making stops at Flamingo Road, Nob Hill Road, and University Drive. The alignment turns south on University and makes a stop at Broward/University. It then heads toward the CBD with stops at SR 7 (Transit Bridge) and the Tri-Rail station, finally following the common CBD stops and terminating at the airport. Sunrise Boulevard The Sunrise alignment is the same as the Sunrise/Broward HPV as far east as the stop at Sunrise/University. This alignment then travels along Sunrise and makes stops at Sunrise Boulevard and NW 11th Place (Florida Medical Center South), Lauderhill Mall (Transit Bridge), and just east of I-95 near Dillard High School. Continuing on Sunrise, there is a stop at NW 9th Avenue before turning south on NW 7th Avenue and stopping 31
37 at Sistrunk Avenue. At the downtown bus facility the alignment turns east onto Broward Boulevard and follows the rest of the common CBD alignment to the airport. Griffin Road This route begins just east of I-75 at the current location of the Regency Square shopping center. Traveling down Griffin Road, it makes stops at Flamingo, Nob Hill, University Drive, SR 7 (Transit Bridge), and the airport Tri-Rail station. After serving the airport terminal, the alignment heads north on US 1 and Andrews serving the common CBD stops Scoping Alternatives Evaluation The scoring was qualitative and each alignment was given an +, or relative to the other alignments for each criterion. The evaluation criteria, scoring method and evaluation results are summarized in this section. A more detailed explanation of this process is located in the Initial Corridor Screening Report. Redevelopment/Economic Development Potential: A qualitative assessment of potential for increased economic development and/or redevelopment based on improved access to industrial and commercial zoned land along the alignment. An alignment received an + if it directly connected to an established Community Redevelopment Agency or if a significant amount of the land along the alignment was designated for non-residential use. An alignment received an if it had some potential for redevelopment based on the adjacent land uses, but not as significant potential as those alignments that received an +. An alignment received an if the possibilities for redevelopment were limited due to the proposed technology (e.g. express bus) or the future land use designation of the adjacent land. Key Destinations Served: A qualitative assessment of the ability of the alignment to provide access to employment destinations and major activity centers. The key destinations identified were: Sawgrass Mills/Office Depot Arena Sawgrass International Business Park Plantation Central Development District (including the Westside Regional Medical Center, Broward Mall, Fashion Mall, and Fountains Shoppes) South Florida Educational Center Fort Lauderdale/Hollywood International Airport Port Everglades Fort Lauderdale Central Business District This evaluation was two-fold. First, each alignment was ranked based on whether or not it served the key destinations identified above. Then a composite score based on the number of destinations served by the alignment was determined. For the initial evaluation: 32
38 An alignment received an + if it directly connected to the destination without the need for a transfer to another system. An alignment received an if it passed by the destination and the destination could be reached by transferring to a circulator or shuttle system. An alignment received an if the destination could not be reached with a transfer to a circulator or shuttle system. The composite score for each alignment was based on the number of + s received versus the number of s and s. The alignments that did not receive any s, received an overall rank of +; the alignments that received the same number of + s and s received an overall rank of ; and the alignments that had more s than any other score received an overall rank of. System Connectivity: A qualitative assessment of the ability of the alignment to provide connectivity to existing and planned transit services. The transit services identified as important for connectivity were: Tri-Rail Fort Lauderdale-Hollywood International Airport/ Port Everglades Peoplemover Transit Bridge Broward County Transit Downtown Fort Lauderdale Circulator Plantation Central Development District Circulator As with Destinations Served, this assessment had a double approach. First, each alignment was scored based on its connectivity to the transit services identified above. Then a composite score was developed. The initial evaluation by service was: An alignment received an + if it directly connected or could directly connect to the system. An alignment received an if it did not connect or could not directly connect to the system. For the overall composite score, the alignments that had five (5) + scores, received an overall score of +; the alignments with four (4) + scores received an overall score of ; and the alignments with three (3) or fewer + scores received an overall score of. Commuter Service: A qualitative assessment of the potential of an alignment to provide services for home-based work trips during peak hours. An alignment received an + if the transit service would have the potential to operate at higher average speeds, would be better able to serve longer 33
39 distance trips, and provide a less circuitous/more direct route to key destinations than the other alternatives. An alignment received an if the transit service would operate in mixed traffic, and therefore have a lower average speed than other alternatives but still provide a less circuitous route to key destinations than the remaining alternatives. An alignment received an if the transit service would operate in mixed traffic and follow a less direct/more circuitous route to key destinations compared to the other alternatives. Community Disruption: A qualitative assessment of the potential for impact to neighborhoods within ¼ mile of the alignment and its station areas. The potential for noise and vibration impacts and displacements will be assessed by the proximity of homes, schools, hospitals, parks and/or cultural institutions (museums and theaters) to the alignment and its station areas. An alignment received an + if the adjacent land uses were predominantly non-residential. An alignment received an if the adjacent land uses were a mixture of non-residential and higher density residential. An alignment received an if the adjacent land uses were predominantly low density residential. Local Service: A qualitative assessment of the potential of an alignment to provide services for limited distance non-work trips. An alignment received an + if it would provide transit service for local trips as opposed to commuters. An alignment received an if it wouldn t provide adequate local service based on speed, adjacent land uses or distance between stations. Mode Split: A qualitative assessment of the potential for trips to be made by transit rather than by automobile for a given alignment. This evaluation was based on preliminary new boarding numbers generated by the SERPM model. An alignment received an + if the projected new boardings were in the upper third of the range of projected boardings for all alternatives. An alignment received an if the projected new boardings were in the middle third of the range of projected boardings for all alternatives. An alignment received an if the projected new boardings were in the lower third of the range of projected boardings for all alternatives. 34
40 Local Government/Agency Support: A qualitative assessment of support or opposition for an alignment based on comments and input received from coordinated agency meetings and review with local governments, FDOT, and resource agencies, etc. An alignment received an + if the route was depicted on another agency s long range plan and no opposition to it was raised during the Scoping meetings. An alignment received an if the route was either depicted on another governmental agency s long range plan and opposition to it was raised during the Scoping meetings or it was not depicted on another government agency s long range plan and no opposition to it was raised during the Scoping meetings. An alignment received an if it was not depicted on another governmental agency s long range plan and opposition to it was raised during the Scoping meetings. Environmental Justice: A qualitative assessment of the potential of an alignment to meet the travel and transportation needs of low-income households, minority households, and persons with disabilities within ½ mile of stations. This measure is an indicator of the how well the alignment serves transit dependent populations. An alignment received an + if it would provide transit service to an area of the County with a higher density of minorities and/or lower income households. An alignment received an if it would not provide transit service to one of these areas. The individual scoring for each alignment on the basis of Key Destinations Served and System Connectivity is shown in Table Results of the Evaluation Table 6 shows the overall results of the evaluation of the preliminary alignments. A more detailed account of the results can be found in the Initial Corridor Screening Report. At the end of the scoping phase, four alignment alternatives and two transit technologies (BRT and LRT) remained: I-595/SR 84, I-595/SR 7/Broward, Sunrise/Broward A, and Sunrise/Broward B. Although the Sunrise/Broward alignment was introduced as a single entity, the variety of options for connecting Sunrise Boulevard to Broward Boulevard made it necessary to split this alignment into two sub-alignments. Each of these build alternatives is described below and is shown in Figure 6. Following this is a summary of the criteria used and the evaluation results from the Tier 1 analysis. 35
41 Table 6: Evaluation Matrix for Destinations and Connectivity Key Destinations Served System Connectivity Alignments Sawgrass Mills/Office Depot Arena Sawgrass Business Park Plantation Central Development District South Florida Educational Center Fort Lauderdale/Hollywood International Airport Port Everglades Fort Lauderdale CBD Tri-Rail Fort Lauderdale-Hollywood International Airport/Port Everglades People Mover Transit Bridge Downtown Fort Lauderdale Circulator Plantation Central Development District Circulator Broward County Transit Baseline I-595 Right-of-Way Express Bus + + o o + o o I-595 Right-of-Way High Performance Vehicle-A + + o o + o o I-595 Right-of-Way High Performance Vehicle-B + + o + + o o (branch to So. FL Educ. Ctr.) Sunrise/Broward High Performance Vehicle o Sunrise Boulevard High Performance Vehicle o Griffin Road High Performance Vehicle o o Oakland Park Boulevard High Performance Vehicle o Table 7: Evaluation Matrix of Preliminary Alignments Redevelopment/Economic Development Potential Key Destinations Served System Connectivity Commuter Service Community Disruption Local Service Mode Split Local/ Agency Support Environmental Justice COMPOSITE Alignments Baseline I-595 Right-of-Way Express Bus o I-595 Right-of-Way High Performance Vehicle-A I-595 Right-of-Way High Performance Vehicle-B (branch to So. FL Educ. Ctr.) Sunrise/Broward High Performance Vehicle Sunrise Boulevard High Performance Vehicle Griffin Road High Performance Vehicle Oakland Park Boulevard High Performance Vehicle o + o o o + o o + + o o - o o + + o o o o o o + o 36
42 Figure 6: Alignment Alternatives 37
43 4.2 TIER 1 The four alignment alternatives from the scoping phase were evaluated during Tier 1 using more quantitative measures. This section describes the alignments evaluated, the criteria used in the evaluation and the scoring results Tier 1 Alternatives Development The following alignment alternatives resulted from the scoping phase. I-595/SR 84 BRT/LRT Originating near Sawgrass Mills and the Office Depot Center, this alignment runs south on 136 Avenue to I-595. The alignment follows the southern side of the right-of-way of I- 595 until SR 7, where it crosses to the north side of I-595 and continues in a northeasterly direction along SR 84. At South Andrews Avenue, the alignment runs south to the Fort Lauderdale/Hollywood International Airport and then north (along Andrews Avenue) to Broward Boulevard. The terminus of the alignment is the Fort Lauderdale (Broward Boulevard) Tri-Rail station. I-595/SR 7/Broward BRT/LRT Originating near Sawgrass Mills and the Office Depot Center, this alignment runs south on 136 Avenue to I-595. The alignment follows the southern side of the right-of-way of I- 595 to SR 7. Turning north on SR 7, the alignment goes to Broward Boulevard and then turns east and continues into downtown Fort Lauderdale. At Andrews Avenue, the alignment turns south and runs to the Fort Lauderdale/Hollywood International Airport, where it terminates. Sunrise/Broward A BRT/LRT Originating near Sawgrass Mills and the Office Depot Center, the alignment runs south on 136 Avenue to Sunrise Boulevard, where it turns east. The alignment continues east on Sunrise Boulevard and connects to Broward Boulevard via a north-south connector. The possible north-south connectors for this alignment include Pine Island Road and University Drive. For purposes of the analysis, a connection along University Drive was considered as the north-south connector. Thus, the alignment turns south on University Drive to Broward Boulevard and then runs east on Broward Boulevard to Andrews Avenue, where it turns south again and terminates at the Fort Lauderdale/Hollywood International Airport. Sunrise/Broward B BRT/LRT Originating near Sawgrass Mills and the Office Depot Center, the alignment runs south on 136 Avenue to Sunrise Boulevard, where it turns east. The alignment continues east on Sunrise Boulevard and connects to Broward Boulevard via a north-south connector. The possible north-south connectors for this alignment include SR 7 and 31 Avenue. For purposes of the analysis, a connection along SR 7 was considered as the north-south connector. Thus, the alignment follows Sunrise Boulevard as it turns south and then back east, and then heads south on SR 7 to Broward Boulevard. From Broward Boulevard, the alignment runs east to Andrews Avenue, where it turns south again and terminates at the Fort Lauderdale/Hollywood International Airport. 38
44 4.2.2 Tier 1 Alternatives Evaluation The evaluation process for Tier 1 was conducted to be consistent with FTA New Starts guidance. While the analysis in the scoping phase of the study was mainly qualitative (refer to the Initial Corridor Screening Report for more information), a significant effort was made to increase the quantitative value of the Tier 1 evaluation. Twelve (12) evaluation criteria, which are defined below, were developed to address the study purpose and need. There is one criterion for each of the following issues, connectivity to major destinations/activity centers, system connectivity, economic/transit-oriented development potential, and impacts to the physical and natural environment; two criteria aimed at potential riders around proposed station areas; and three criteria addressing environmental justice issues. Once the criteria were established, each alternative was analyzed and evaluated against the ranking values determined for each criterion. A series of symbols were used to reflect the rating for each criterion. These symbols were for good, for neutral, and for poor. To develop an overall score that would allow the alternatives to be compared relative to each other, a quantitative score was assigned to the ratings, where good equaled two (2) points, neutral equaled one (1) point and poor equaled zero (0) points. Table 7 on the following page shows the results of the Tier 1 evaluation. More information on these criteria and the results of the evaluation is available in the Conceptual Definition of Alternatives. Meets Mobility Needs: This criterion provides an overview of the home-based, work trips within the study area. It was a quantitative assessment of the proposed alternative s ability to serve the mobility needs of the study area. Connectivity to Major Destinations/Activity Centers: The alternative s ability to provide access to major destinations within the study area was the focus of this criterion. There are eight major destinations in the study area, and each alternative was individually evaluated on its ability to serve these locations. Ratings were assigned based on the nature of the connection provided (direct, transfer required, or no connection). System Connectivity: This was an assessment of the alternative s ability to provide or potentially provide direct transfers to existing or future transit services within the study area. The transit services considered included Tri-Rail, BCt bus routes, the Transit Bridge, the Downtown Fort Lauderdale Circulator, the Fort Lauderdale/Hollywood International Airport/Port Everglades People Mover, and the Midtown Plantation Circulator. As with the major destinations/activity center criterion, each alternative was evaluated individually for its ability to serve each of the listed transit systems. A higher rating was given to alternatives that allowed station-to-station transfers versus a transfer to another transit system that is within ¼ mile, etc. Commuter Service: This was a quantitative assessment of the proposed alternative s potential to provide service for home-based, work trips on the proposed alignment. 39
45 Local Service: This was a quantitative assessment of the proposed alternative s potential to serve non-work trips. The length of these trips is shorter than the home-based, work trips used to evaluate commuter service. Number of Households within ½ Mile Radius of Proposed Stations: To determine the potential of the alternative to meet the travel and transportation needs of residents, the number of occupied households (utilizing 2000 US Census data) located within ½ mile radius of a designated center point for each proposed station was determined. Alternatives were ranked relative to each other. Number of Employees within ½ Mile Radius of Proposed Stations: The travel and transportation needs of employees within ½ mile radius of a designated center point for each proposed station were determined using 1999 Traffic Analysis Zone (TAZ) information files from the Broward County MPO. As with the number of households, alternatives were ranked relative to each other. Operating Costs: The operating cost estimates were based on a projection of the number of transit vehicles needed to maintain 15-minute headways during the peak period along the length of the alignment. As ridership projections are developed the fleet size numbers will be modified to reflect the number of transit vehicles required to meet demand. Capital Costs: The capital cost estimates were based primarily on construction costs for similar projects. Capital costs were converted to a dollar per linear foot basis. The length of each alignment alternative was based on scaled maps in the project s Geographic Information System (GIS). Items for which capital costs were developed included, site work, track work (LRT alternatives only for this item), signal system, communications, right-of-way/property acquisition, vehicles, and crossings/roadway improvements. In addition to the unit costs estimated for these items, costs for contingencies were also included. Opportunities for Economic Development and/or Transit Oriented Development: This was a qualitative assessment of the possibility for transit-supportive and economic development along each alignment. For the purpose of this criterion, transit-supportive development was defined as a complementary mixture of uses within proposed station areas that make transit more attractive by allowing an individual to perform daily activities without the need for an automobile. To determine the feasibility of transit-supportive development near proposed station areas, the amount of developable vacant land and existing land use patterns within ½ mile of a designated center point for each proposed station area were reviewed. If a proposed station area was located within a designated CRA or an area otherwise targeted for economic development (in the local government s comprehensive plan), it was considered to be a transit-supportive development environment, regardless of the amount of vacant land and existing development pattern. Potential for Physical/Natural Environmental Impacts: The number of physical and natural features, such as schools, parks, hospitals, and environmentally sensitive lands, within ¼ mile buffer of each alignment were identified and the total number of features along each alignment was calculated. 40
46 Percentage of Households within ½ Mile Radius of Proposed Stations that are Minority: This was a quantitative assessment of the potential to provide transit service to, and conversely impact, minority populations (defined as non-white as reported to the 2000 US Census). Percentage of Persons with a Disability within ½ Mile Radius of Proposed Stations: This was a quantitative assessment of the accessibility of the alternative to persons with a disability (as reported to the 2000 US Census). Percentage of Households within ½ Mile Radius of Proposed Stations that are Low-Income: This criterion was a quantitative assessment of the ability of the proposed alternative to meet the travel and transportation needs of low-income households (defined as below the poverty line as reported to the 2000 US Census). The I-595/SR 7/Broward alternative scored the highest during the evaluation and was one of the recommended alternatives to carry into Tier 2. Ultimately, the Technical Coordinating Committee (TCC) of the MPO recommended to the MPO Board that all four of the Tier 1 build alternatives be carried forward into Tier 2, and the MPO Board ratified this decision. 4.3 TIER 2 The build alternatives from Tier 1 (described in Section and shown in Figure 6) and three variations on these alternatives were re-evaluated during the Tier 2 analysis, at the request of the MPO. The evaluation criteria used for Tier 2 were more quantitative than the criteria employed for Tier 1 and involved more extensive data collection efforts. This section provides a description of each of the alternative variations, the evaluation criteria, the evaluation results, and the recommended alignment. A more detailed account of the Tier 2 evaluation is found in the Tier 2 Summary Report Tier 2 Alternatives These variations on the build alternatives were identified at public meetings with the MPO and separate evaluations of these alternatives were completed. These variations are shown in Figure 7, described below, and referred to as the Airport Spur, Lauderhill Extension A, and Lauderhill Extension B. Airport Spur This alignment offers two service lines that combine the service provided by the I- 595/SR 7/Broward Boulevard and I-595/SR 84/Andrews Avenue alignments, in order to provide a more direct connection to the Airport. Both lines originate near Sawgrass Mills and the Office Depot Center, proceed south on 136 Avenue to I-595, and along the southern side of the right-of-way of I-595 until SR 7, where the lines would separate. One line would turn north on SR 7, go to Broward Boulevard, turn east and continue into downtown Fort Lauderdale to Andrews Avenue, where it turns south and continues to its terminus at the Fort Lauderdale/Hollywood International Airport. The second line crosses to the north side of I-595 west of SR 7, continues in a northeasterly direction along SR 84 to South Andrews Avenue, where it runs south to the Fort Lauderdale/Hollywood International Airport and terminates. 41
47 Table 8: Tier 1 Evaluation Matrix Symbol Key: = Good = Neutral = Poor ALTERNATIVES Travel and Mobility Measures Costs Community & Environmental Measures Environmental Justice Meets Mobility Needs Connectivity to major destinations/activity centers System Connectivity Commuter Service Local Service Households within 1/2 mile of stations No. of employees within 1/2 mile of stations Operating Costs (in Million $) Total capital cost (in Million $) Opportunities for economic development and/or TOD Potential for Physical/Natural Environmental Impacts % of households w/in 1/2 mile of stations that are minority households % persons w/in 1/2 mile of stations with a disability % of households w/in 1/2 mile of stations that are low income households Total number of good (2 Points) Total number of neutral (1 Point) Total number of poor (0 Points) SCORE I-595 Right-of-Way Express Bus (Baseline) I-595/SR 84 BRT $14.5 $ I-595/SR 84 LRT $17.2 $ I-595/SR 7/Broward BRT $16.5 $ I-595/SR 7/Broward LRT $19.3 $ Sunrise/Broward A BRT $14.2 $ Sunrise/Broward A LRT $17.8 $ Sunrise/Broward B BRT $14.3 $ Sunrise/Broward B LRT $18.0 $
48 Airport Spur Lauderhill Extension A Lauderhill Extension B Figure 7: Alternative Variations Identified by MPO Board 43
49 Lauderhill Extension A This alignment originates near Sawgrass Mills and the Office Depot Center, proceeds south on 136 Avenue to I-595. At I-595 it turns east and follows the southern side of the right-of-way of I-595 to SR 7. Turning north on SR 7, the alignment continues to Sunrise Boulevard and then turns east to NW 31 Avenue/Martin Luther King Boulevard, where it turns south and returns to Broward Boulevard. The alignment turns east at Broward Boulevard and continues into downtown Fort Lauderdale. At Andrews Avenue, the alignment turns south and continues to the Fort Lauderdale/Hollywood International Airport, where it terminates. The purpose of this alignment is to provide service to the City of Lauderhill by providing connections to the Lauderhill Transfer Station and the Swap Shop. Lauderhill Extension B Developed as another alternative to provide service to the Lauderhill Transfer Station, this alignment originates near Sawgrass Mills and the Office Depot Center, proceeds south on 136 Avenue to I-595. At I-595 it turns east and continues along the southern right-of-way of I-595 to SR 7. Turning north on SR 7, the alignment runs to NW 19 th Avenue (the Lauderhill Transfer Station), where it turns back south, returning to Broward Boulevard. The alignment turns east at Broward Boulevard and continues into downtown Fort Lauderdale. At Andrews Avenue, the alignment turns south and proceeds to the Fort Lauderdale/Hollywood International Airport, where it terminates Tier 2 Alternatives Evaluation The evaluation criteria in Tier 2 were created to specifically address the stated project goals, which were developed to address the New Starts criteria. Significantly more data collection was conducted in order to maximize the quantitative nature of the Tier 2 evaluation. The alternatives were scored and ranked relative to each other, and several key criteria (travel time, annual operating cost, and capital cost per rider) were used to select between alternatives that scored closely. Seventeen (17) evaluation criteria were developed to respond to the seven (7) stated project goals. The ranking of alternatives is based on a score developed by totaling the points under each measure. Points range from 1 to 5, with 5 being the best or highest rating and 1, the worst or lowest rating. In most cases, the scoring for a measure is based on quantitative data. For those measures that have qualitative components, or those that combined qualitative and quantitative factors, a relative score or ranking was developed. To visually convey the results, a series of symbols were also used to reflect the 1 through 5 ranking system. Numeric Ranking Symbolic Ranking 44
50 GOAL: MAXIMIZE POTENTIAL RIDERSHIP Criterion: Highest Number of Daily Riders This criterion is based on the travel demand modeling using SERPM V modified through coordination with FTA staff. Modification of the model was necessary so it would more accurately reflect the operating characteristics of the proposed alternatives. It is a quantitative assessment of the proposed alternatives ability to serve the mobility needs of the study area. Scores for ridership are based on projections of daily riders in Criterion: Number of Households within ½ Mile Radius of Proposed Stations This criterion provides a quantitative assessment of the potential of the alternative to meet the travel and transportation needs of residents. Alternatives were scored based on the number of occupied households (utilizing 2000 US Census data) located within ½ mile radius of the proposed station locations for each alignment alternative. Criterion: Number of Employees within ½ Mile Radius of Proposed Stations This criterion provides a quantitative assessment of the potential of the alternative to meet the travel and transportation needs of employees. Alternatives were scored based on the number of employees (using 1999 TAZ data) located within ½ mile radius of the proposed station locations for each alignment alternative. GOAL: MINIMIZE COSTS Criterion: Capital Cost The cost for construction and implementation (vehicles, maintenance facility, structures, right-of-way, etc.) of each alternative were developed based on unit costs that reflect the configuration of the guideway (at-grade, elevated sections) and other conditions for each alternative. Alternatives were scored based on the range of cost with the highest cost alternative receiving the lowest value (1) and the lowest cost alternative receiving the highest value (5), since the goal is to develop the most cost effective alternative (that is, the alternative that generates the most riders for the least cost). Criterion: Operating Cost The cost for operating each of the proposed alternatives on an annual basis was developed. The lowest cost alternative received the highest score. GOAL: POTENTIAL ELIGIBILITY FOR NEW STARTS APPROVAL Criterion: Capital Cost per Passenger This measure is a simple ratio of the estimated capital cost of the alternative to the projected daily boardings. GOAL: SYSTEM CONNECTIVITY Criterion: Connections to Other Transit Services This measure was an assessment of the alternative s ability to provide or potentially provide direct transfers to existing or future transit services within the study area. The transit services considered include Tri-Rail, BCt bus routes, the Transit Bridge, the Downtown Fort Lauderdale Circulator, the Fort Lauderdale/Hollywood International Airport/Port Everglades People Mover, and the Midtown Plantation Circulator. Each alternative was evaluated individually for its ability to serve the respective transit 45
51 services. If the alternative would allow or would have the potential to allow for a transfer to another transit system at a station, a cross platform transfer, it received five (5) points. If the alternative would allow or would have the potential to allow for a transfer to another transit system that is within ¼ mile, it received three (3) points. If the alternative would not allow for a cross platform transfer or a transfer to another system within ¼ mile, it received one (1) point. Criterion: Major Destinations/Activity Centers Served This measure was an assessment of the alternative s ability to provide access to major destinations within the study area. There are eight major destinations in the study area: the Fort Lauderdale CBD, the Fort Lauderdale/Hollywood International Airport, the SFEC, courthouse/city jail complex south of downtown Fort Lauderdale, Broward General Hospital and associated medical facilities, Sawgrass Mills/Office Depot Center, Sawgrass International Corporate Park, and the Plantation Gateway District. Each alternative was individually evaluated on its ability to serve these locations. If the alternative could provide a direct connection to the destination, without the need for transfer to another system, it received five (5) points. If the alternative could serve the destination, but transfer to another system or circulator would be required, it received three (3) points. If the alternative could not serve the destination even with a transfer to another system, it received one (1) point. GOAL: MAXIMIZE SERVICE TO MINORITY AND TRANSIT DEPENDENT POPULATIONS Criterion: Percentage of Households within ½ Mile Radius of Proposed Stations that are Minority A quantitative assessment of the potential to provide transit service to, and conversely impact, minority populations (defined as non-white as reported to the 2000 US Census). The proportion of minority households within the study area is 28% Criterion: Percentage of Persons with a Disability within ½ Mile Radius of Proposed Stations A quantitative assessment of the accessibility of the alternative to persons with a disability (as reported to the 2000 US Census). Disabled persons represent 33% of the study area population. Criterion: Percentage of Households within ½ Mile Radius of Proposed Stations that are Low-Income A quantitative assessment of the ability of the proposed alternative to meet the travel and transportation needs of low-income households (defined as below the poverty line as reported to the 2000 US Census). The proportion of low-income households in the study area is 12%. GOAL: PROMOTE ECONOMIC DEVELOPMENT Criterion: Economic Development Potential Economic development potential for the proposed alternatives in the Central Broward East-West Transit Analysis was based on a qualitative rating. The process for developing the rating was divided into four basic steps: establish minimum residential density and nonresidential intensities based on accepted TOD principles; 46
52 establish the maximum residential density and nonresidential intensity permitted in each station area based on future land use policies and existing zoning regulations; calculate the difference between what is locally permitted and the accepted TOD principles; and assign a weight based on local government support for higher densities and intensities and existing land development patterns. Using a 5-point system, the land use/zoning component of this analysis was worth 3 points and each of the weighting factors worth up to 1 point each. The analysis was based on the area within ½ mile radius of each proposed station area, depending upon the proposed alignment. If the proposed alignment was median running, the entire ½ mile radius was used. For the I-595 alignments, the proposed location of the system is on the south side of the I-595 right-of-way. Any significant station area development is going to occur on this south side of I-595, due to the presence of a South Florida Water Management District primary canal (North New River Canal) on the north side of I-595. Therefore, only the south side of the station area was analyzed for the I-595 stations. Development of a robust, quantitative measure would require market research and analysis beyond the scope of this project. GOAL: MINIMIZE POTENTIAL FOR ENVIRONMENTAL IMPACT Criterion: Wetlands within ¼ Mile of An Alignment Wetlands found within the study area categories fall into two categories: wetlands and developed wetlands. Developed wetlands include created wetlands or areas that have been developed as mitigation wetlands or mitigation banks. Wetlands include all other designated wetland areas. At this phase of the study, additional information regarding the quality or relative value of these wetlands is not available; therefore it was assumed for the purposes of this evaluation that all wetlands are of comparable value. The potential for impacts to wetlands was evaluated utilizing three (3) parameters: Location within the ½ mile corridor (¼ mile of both sides of the centerline of an alignment); Wetland size Total number of wetlands within the ½ mile corridor The location of a wetland within the ½ mile corridor was scored based on whether the wetland is located along the outer perimeter of the corridor; located at some point in the middle of the corridor; or located adjacent to the existing roadway alignment centerline. This parameter was evaluated based on the assumption that a wetland system immediately adjacent to the existing roadway has a greater potential for impact and may be less avoidable than a wetland found elsewhere within the study corridor. Each wetland was scored based on location as follows: perimeter = 2, middle = 1 and adjacent = 0. Points were totaled for all wetlands located within each corridor and each corridor was then ranked (1 5). The highest ranking (5) was given to the alignment with the highest total points (i.e. fewest number of wetlands in proximity to the existing roadway). The size of each wetland occurring with the study corridors was assessed based on the assumption that impacts to larger wetlands would be less desirable than impacts to 47
53 smaller wetlands. Larger wetland systems may also be more difficult to avoid. Points were assigned to each wetland based on the following: acres - 5 points acres - 4 points acres - 3 points acres - 2 points Greater than 10.0 acres - 1 point Points were totaled for all wetlands located within each corridor and each corridor was then ranked (1 5). The highest ranking (5) was given to the alignment with the highest total points (i.e. lowest wetland acreage). The total number of wetlands found on each corridor was evaluated based on the assumption that the greater the quantity of wetlands, the greater the possibility that one or more may be impacted. Each study corridor was ranked based on the total number of wetlands associated with it. The corridor with the most wetlands was given a 1 ranking (i.e. the greatest potential for wetland impact). A composite score was calculated for each alignment based on the 1-5 ranking assigned for each of the above parameters. Each alignment was then given a final ranking based on the composite score, with the alignment with the highest composite score assigned a 5 ranking, representing the least impact potential. Criterion: Parks within ¼ Mile of An Alignment The number of parks within a ¼ mile buffer of each alignment was identified and the total number along each alignment was calculated. The alternative with the least potential to negatively affect parks received the highest score. Criterion: Community Services The number of community features, including schools, medical facilities, religious institutions and libraries within a ¼ mile buffer of each alignment were identified and the total number of Community Service facilities along each alignment was calculated. The alternative with the least potential to negatively affect community resources, that is, the lowest number of Community Service facilities, received the highest score. Criterion: Noise Sensitive Receptors The number of noise sensitive receptors within a ¼ mile buffer of each alignment was identified and the total number of noise sensitive receptors along each alignment was calculated. Noise sensitive receptors included residential units, schools, parks, medical facilities and religious facilities. The alternative with the least potential to negatively affect noise sensitive receptors, that is, the lowest number of noise sensitive receptors, received the highest score. Criterion: Listed Hazardous Materials Sites The potential for contamination to be an issue along the alignments was evaluated based on the total number of listed hazardous materials sites associated within ¼ mile of either side of the centerline of the alignment alternatives. At this stage, there is not enough information available to determine which, if any, of these potential sites could actually affect project development or be affected by it. The ranking could be based only on the total number of sites within proximity to the alternatives. The alternative with 48
54 the greatest number of listed sites was assigned a 1 ranking. Similarly, the study corridor with the fewest number of listed sites within ¼ mile was assigned a 5 ranking. The results of the Tier 2 evaluation are shown in Table 8 on the following page. Following this initial evaluation, the Steering Committee and Policy Boards agreed to remove the I-595/SR 84 and Sunrise/Broward alignments from further consideration. However, in addition to the I-595/SR 7/Broward alignment, the MPO suggested variations on this alignment, which resulted in the need for additional analysis. Since these variations were based on an existing alternative it was deemed unnecessary to complete a full evaluation of these alternatives using the Tier 2 criteria described above. Instead, these variations were evaluated based on several key characteristics, including travel time, ridership, capital cost, annual operating cost, and capital cost per passenger. Table 9 shows how these variations compare to the I-595/SR 7/Broward alignment. It should be noted that only light rail technology was considered when evaluating these alternatives. Light rail was used for two reasons: the MPO Board expressed an interest in a rail system and it represents the highest capital costs. Additionally, the capital cost calculation was revised following the initial Tier 2 evaluation to better account for right-ofway costs and to reflect the increase in the amount of elevated structure. Based on the analysis performed during the Tier 2 evaluation, the I-595/SR 7/Broward Boulevard alignment was selected by the MPO to carry into the LPA evaluation. Table 9: Comparison of I-595/SR 7/Broward Alignment to Variations Criteria Travel Time (minutes) I-595/SR 7/Broward Airport Spur Lauderhill Extension A Lauderhill Extension B Sawgrass to CBD Sawgrass to Airport Daily Ridership (boardings) 26,000 28,700 27,600 26,700 Capital Cost (millions) $922 $1,077 $1,012 $979 Annual Operating Cost of the Alternative (millions) $19 $29 $25 $25 Capital Cost per Rider $35,400 $37,500 $36,700 $36, LPA EVALUATION At the end of the Tier 2 evaluation, an approved alignment (I-595/SR 7/Broward Boulevard) was selected but a decision on the transit technology (BRT or LRT) was still required. To assist the MPO in deciding between transit technologies, renderings depicting both BRT and LRT at various locations on the alignment were developed, projected ridership numbers re- 49
55 Table 10: Tier 2 Evaluation Matrix Maximize Potential Ridership Minimize Costs Potential Eligibility for New Starts Approval System Connectivity Maximize Service to Minority and Transit Dependent Populations Promote Economic Development Minimize Potential for Environmental Impact Alternatives Total Score Highest Number of Daily Riders Households within ½ mile of Stations Employees within ½ mile of Stations Capital Cost ($ millions) Capital Cost Operating Cost ($ millions) Operating Cost Capital Cost per Passenger Other Transit Services Major Destinations Households within ½ mile of Stations that are Minority Households Persons within ½ mile of Stations with a Disability Households within ½ mile of Stations that are Low Income Economic Development Potential Wetlands within ¼ mile of An Alignment Parks within ¼ mile of An Alignment Community Services within ¼ mile of An Alignment Noise Sensitive Receptors within ¼ mile of An Alignment Listed Hazardous Materials Sites within ¼ mile of An Alignment I-595 Express Bus (Baseline) I-595/SR 7 BRT $ 448 $ 8 55 I-595/SR 7 LRT $ 874 $ I-595/SR 84 BRT $ 441 $ 8 52 I-595/SR 84 LRT $ 845 $ Sunrise/Broward A BRT $ 67 $ Sunrise/Broward A LRT $ 492 $ Sunrise/Broward B BRT $ 106 $ Sunrise/Broward B LRT $ 504 $
56 evaluated, and operating and capital costs refined. With an approved alignment identified, significant coordination with the I-595 Project Development and Environmental (PD&E) was undertaken. An analysis of the financial feasibility and potential funding sources for the Central Broward East-West Transit Analysis, and other transit improvements in Broward County, was completed. This section of the report describes the development of the Locally Preferred Alternative and its evaluation LPA Development After an alignment was approved by the Broward County MPO, the potential guideway configurations were revisited and revised. Based on this reassessment, the guideway options shown in Figure 8 were developed. These configurations were used to refine the capital and operating costs for both transit technologies. Additionally, renderings (see Figures 9 to 15) were developed to show the MPO Board and other interested persons how the system might appear, once constructed. The potential guideway configurations are described below. Exclusive (elevated guideway): Exclusive guideways include subways and aerial structures, as well as at-grade sections without motor vehicle or pedestrian crossings. This type of guideway offers the highest maximum speed, the greatest passenger capacity, the fastest travel times, and the lowest potential for conflicts between motor vehicles and pedestrians. An aerial structure also costs the most to construct. The potential locations for an exclusive guideway within the approved alignment include the I-595 right-of-way, along the east side of SR 7, in the median of Broward Boulevard, and for a small portion of Andrews Avenue (see Figure 8). Semi-exclusive (at-grade guideway): Semi-exclusive guideways reduce potential conflicts, but some potential still exists where streets cross the guideway or where left turns are allowed. Speeds are lower than for exclusive guideways due to the need for the transit vehicle to stop at intersections. Preferential signal treatment for transit vehicles can reduce this delay. The two locations for a semi-exclusive guideway within the approved alignment are along 136 th Avenue and US-1 (see Figure 8). Mixed traffic (shared or exclusive lane): Non-exclusive guideways allow for shared use of the transit facility by general-purpose traffic (cars and trucks) and crossing by pedestrians. In this configuration, transit operations have lower speeds and there is greater potential for conflicts. While this type of operation is a component of many light rail systems in the United States, it is usually limited to downtown areas, where there is willingness to forgo operating speeds in order to access areas with high population [and employment] density and many potential riders (TCRP Report 17, p. 13). Typically, fixed route bus service uses this type of configuration for operations. This configuration would be the lowest cost configuration to build, since it would be constructed primarily within existing roadway rights-of-way. The potential locations for mixed traffic operations within the approved alignment include SR 7, Broward Boulevard, Andrews Avenue, and 30 th Street (see Figure 8). The guideway configuration for the portion of the alignment within the I-595 right-ofway is exclusive, but the location of the guideway is still being determined through coordination with the I-595 PD&E Study. The roadway PD&E extends from I-75 to east of I-95 and evaluates alternatives of the LPA from the I-95/I-595 Master Plan. The road- 51
57 LEGEND Semi-Exclusive (at-grade) Guideway Exclusive (elevated) Guideway Mixed Traffic Guideway Figure 8: Potential Guideway Configurations for the Approved Alignment 52
58 Figure 9: Bus Rapid Transit in a Semi-Exclusive Guideway along 136 th Avenue 53
59 Figure 10: Light Rail Transit in a Semi-Exclusive Guideway along 136 th Avenue 54
60 Figure 11: Bus Rapid Transit in Mixed Traffic along State Road 7 55
61 Figure 12: Light Rail Transit in Exclusive Guideway along State Road 7 56
62 Figure 13: Bus Rapid Transit in Mixed Traffic along Broward Boulevard 57
63 Figure 14: Light Rail Transit in an Exclusive Guideway along Broward Boulevard 58

64 Figure 15: Light Rail Transit in Mixed Traffic along Broward Boulevard 59
AIR QUALITY TECHNICAL MEMORANDUM
 AIR QUALITY TECHNICAL MEMORANDUM AIR QUALITY TECHNICAL MEMORANDUM GOLDEN GLADES INTERCHANGE PD&E STUDY Miami-Dade County, Florida Financial Management Number: 428358-1-22-01 Efficient Transportation Decision
3.0 REVIEW OF PREVIOUS STUDIES
 3.0 REVIEW OF PREVIOUS STUDIES This section of the highlights the significant features from previous plans and studies that could impact the development of the I-20 East Transit Initiative. Much of the
POLK COUNTY TPO Polk County 2060 Transportation Vision Plan Final Report. ADOPTED June 18, 2009
 POLK COUNTY TPO Polk County 2060 Transportation Vision Plan Final Report ADOPTED June 18, 2009 TABLE OF CONTENTS CHAPTER 1 Introduction and Prior Planning Effort...Page 1-1 CHAPTER 2 Population and Employment
Executive Summary and Staff Recommendation
 Executive Summary and Staff Recommendation January 2017 Project Background In 2010, NFTA completed an update to our 2001 Strategic Assessment. This assessment identified four corridors for potential rail
 EXHIBIT 3 CORRESPONDENCE 1 8/15/16 BCT Broward Next Policy Concept EXHIBIT A Legend Qualified Transit Areas Areas highlighted in orange are within 0.5 miles of a rail station or 0.25 miles of a bus
DOCUMENT CONTROL PANEL
 August 2013 DOCUMENT CONTROL PANEL File Name: I-95 Integrated Corridor Management System, Broward County File Location: 11555 Heron Bay Boulevard, Suite 200, Coral Springs, FL 33076 Document Tracking Number:
1.1 Purpose of the Project
 Chapter 1 Purpose and Need for East Link Project 1.1 Purpose of the Project The purpose of the East Link Project is to expand the Sound Transit Link light rail system from Seattle to Mercer Island, Bellevue
Broward County Urban Freight/Intermodal Mobility Study Executive Summary
 Broward County Urban Freight/Intermodal Mobility Study Executive Summary 2007/08 executive summary Urban Freight/Intermodal Mobility Study prepared for Broward MPO prepared by 110 East Broward Boulevard,
1 INTRODUCTION 1-1 CTPS
 1 INTRODUCTION This report of the Congestion Management System (CMS) for the Boston Region Metropolitan Planning Organization (MPO) documents the region s mobility concerns. (The region is shown in Figure
VISION. 4. Vision. 31 Page
 VISION 4. Vision The 2035 LRTP, branded as Transformation, is the Broward MPO s plan for change. Economic vitality for the region, a better environment, and enhanced quality of life are envisioned. This
APPENDIX N East King County Subarea High Capacity Transit (HCT) Analysis: Approach to Assessing System-Level Alternatives
 Analysis: Approach to Assessing System-Level Alternatives") Sound Transit Regional Transit Long-Range Plan Draft Supplemental Environmental Impact Statement APPENDIX N East King County Subarea High Capacity Transit (HCT) Analysis: Approach to Assessing System-Level
Sound Transit Regional Transit Long-Range Plan Draft Supplemental Environmental Impact Statement APPENDIX N East King County Subarea High Capacity Transit (HCT) Analysis: Approach to Assessing System-Level
APPENDIX Methodology Letter of Understanding (MLOU) and Agency Correspondence
 and Agency Correspondence") APPENDIX 21 1 Methodology Letter of Understanding (MLOU) and Agency Correspondence Question 21 Transportation This document reflects the transportation study methodology to be utilized in preparing responses
APPENDIX 21 1 Methodology Letter of Understanding (MLOU) and Agency Correspondence Question 21 Transportation This document reflects the transportation study methodology to be utilized in preparing responses
Subarea Mobility Enhancements. 5.1 Transit and Pedestrian Improvements
 Section Five Section 5: Subarea Mobility Enhancements 5.1 Transit and Pedestrian Improvements From the outset of the master planning process, one of the primary goals was to integrate transit and pedestrian-oriented
III. Regional TSM&O Overview from the 2040 Regional Transportation Plan (Jessica Josselyn, Kittelson & Associates, Inc.)
") Regional Transportation Technical Advisory Committee (RTTAC) Transportation System Management & Operations (TSM&O) Subcommittee Meeting Agenda June 23, 2015 1:30 PM FDOT District Four Headquarters Auditorium
Regional Transportation Technical Advisory Committee (RTTAC) Transportation System Management & Operations (TSM&O) Subcommittee Meeting Agenda June 23, 2015 1:30 PM FDOT District Four Headquarters Auditorium
ACTIVE TRANSPORTATION ADVISORY COMMITTEE. Memphis MPO March 30, 2015
 ACTIVE TRANSPORTATION ADVISORY COMMITTEE Memphis MPO March 30, 2015 Agenda Welcome & Introductions Announcements and Briefings Livability 2040: Regional Transportation Plan Congestion Management Process
Demand Reduction Assumptions Used For Travel Demand Analysis of EIS Alternatives
 M E M O R A N D U M Demand Reduction Assumptions Used For Travel Demand Analysis of EIS Alternatives TO: FROM: Project Management Team Steve Perone/PTV America DATE: Revised: February 6, 2009 Background
The development of potential alignment segments was based on the review of:
 5.0 FEASIBILITY ANALYSIS This section summarizes the results of analysis used to determine the feasibility of a Monorail/AGT system in the WILMAPCO region. The section begins with a discussion of the identification
SOUTHWEST LRT (METRO GREEN LINE EXTENSION)
") 8 Evaluation of Alternatives This chapter evaluates the effectiveness of the No Build Alternative and the Southwest Light Rail Transit (LRT) Project (the Project) based on the information contained in
8 Evaluation of Alternatives This chapter evaluates the effectiveness of the No Build Alternative and the Southwest Light Rail Transit (LRT) Project (the Project) based on the information contained in
APPENDIX TRAVEL DEMAND MODELING OVERVIEW MAJOR FEATURES OF THE MODEL
 APPENDIX A TRAVEL DEMAND MODELING OVERVIEW The model set that the Central Transportation Planning Staff (CTPS), the Boston Region Metropolitan Planning Organization s (MPO) technical staff, uses for forecasting
Table of Contents. Introduction 1. E1 Purpose and Need 1. E2 Alternatives Development Approach 7. E3 Tier I Alternatives 9. E4 Tier II Alternatives 13
 Table of Contents Introduction 1 E1 Purpose and Need 1 E1.1 Study Area 1 E1.2 Land Use and Zoning 3 E1.3 Demographics 3 E1.4 Transportation Facilities and Transit Services 5 E1.5 Mobility Constraints 5
METROPOLITAN PLANNING ORGANIZATION FOR THE MIAMI URBANIZED AREA BLOCKS RIBBONS EXERCISE
 BLOCKS RIBBONS EXERCISE Welcome and thank you for making the decision to take part in the Miami-Dade Long Range Transportation Plan (LRTP) planning process. Based on forecasts from the Miami-Dade County
TBARTA 2015 Regional Transportation Master Plan 2040 Regional Long Range Transportation Plan AUGUST 2015
 TBARTA 2015 Regional Transportation Master Plan AUGUST 2015 Table of Contents 1.0 Introduction... 2 1.1 Updating the Master Plan... 2 1.2 About this Document... 2 2.0 Regional Long Range Transportation
South Fulton Parkway Transit Feasibility Study Stakeholder Committee Meeting #2
 South Fulton Parkway Transit Feasibility Study Stakeholder Committee Meeting #2 June 8, 2009 Meeting Agenda I. Study Purpose and Schedule II. III. Review of Previous Plans and Studies Transit Propensity
12 Evaluation of Alternatives
 12 Evaluation of Alternatives This chapter evaluates the effectiveness of the No-Build Alternative and the proposed METRO Blue Line Light Rail Transit (BLRT) Extension project based on the information
FLORIDA DEPARTMENT OF TRANSPORTATION PROCEDURE DEVELOPMENT OF THE
 FLORIDA DEPARTMENT OF TRANSPORTATION PROCEDURE DEVELOPMENT OF THE FLORIDA INTRASTATE HIGHWAY SYSTEM Topic No.: 525-030-250-f Office: Systems Planning Effective Date: May 16, 2002 DEVELOPMENT OF THE FLORIDA
Contents i Contents Page 1 A New Transportation Plan Community Involvement Goals and Objectives... 11
 Contents i Contents 1 A New Transportation Plan... 1 Why develop a new plan?... 1 What area does the LRTP focus on?... 2 Why is this LRTP important?... 3 Meeting Requirements for Transportation Planning...
Chapter 3 - Goals, Objectives, & Strategies
 Chapter 3 - This chapter presents goals, objectives, and strategies that have been developed as part of the Richmond Area MPO 2026 Long-Range Transportation Plan (LRTP) update. Strategies have been developed
WELCOME. Schedule. Contact Information. Please Provide Written Comments
 WELCOME Schedule April 18, 2012 Open House: 6:30 p.m. to 8:30 p.m. Project Presentation: 7:00 p.m. Mary Ellen Henderson Middle School 7130 Leesburg Pike Falls Church, VA 2203 Contact Information Kala Leggett
MOBILITY 2045: A FOCUS ON TRANSPORTATION CHOICE:
 Mobility 2045: The Metropolitan Transportation Plan for North Central Texas is the defining vision for the multimodal transportation system in the Dallas- Fort Worth Metropolitan Planning Area. The plan,
MARC Congestion Management Process Policy
 MARC Congestion Management Process Policy Adopted by the MARC Board of Directors on May 24, 2011 Background Traffic congestion can be generally defined as a condition where the volume of users on a transportation
BUS RAPID TRANSIT CORRIDOR
 DOWNTOWN UPTOWN OAKLAND EAST END BUS RAPID TRANSIT CORRIDOR Scoping Booklet for National Environmental Policy Act Review City of Pittsburgh Port Authority of Allegheny County Uptown/Downtown Scoping Meeting
Nashville Southeast Corridor High-Performance Transit Alternatives Study. Final Report
 Nashville Southeast Corridor High-Performance Transit Alternatives Study Final Report August 2007 - Nashville Southeast Corridor Executive Summary I. Introduction The southeast corridor is a 30 mile long
Travel Demand Forecasting User Guide
 Travel Demand Forecasting User Guide A Supplement to the Regional Transitway Guidelines Metropolitan Council February 2012 This document supplements the Project Development, Leadership, and Oversight discussion
MOBILITY AND ALTERNATIVES ANALYSIS
 6 MOBILITY AND ALTERNATIVES ANALYSIS BACK OF SECTION DIVIDER 6.0 Mobility and Alternatives Analysis Travel demand analysis provides a framework for the identification of transportation facilities and services
Summary of transportation-related goals and objectives from existing regional plans
 SMTC 2050 Long Range Transportation Plan Appendix A: Summary of transportation-related goals and objectives from existing regional plans SMTC 2050 Long Range Transportation Plan Summary of transportation-related
Corpus Christi Metropolitan Transportation Plan Fiscal Year Introduction:
 Introduction: Traffic congestion in the Corpus Christi Metropolitan area is not as much a function of population growth as the function of the increase in single occupant trips. Using census data, the
Congestion Management Process 2013 Update
 OVERVIEW OF THE DALLAS-FORT WORTH CONGESTION MANAGEMENT PROCESS Traffic Congestion In The Dallas-Fort Worth Region With the Dallas-Fort Worth (DFW) urban area as its center, the North Central Texas region
Final. Project Summary Report
 Final Project Summary Report February 2017 TABLE OF CONTENTS PROJECT SUMMARY REPORT FINAL Prepared for: FDOT District 5 Prepared by: Parsons Brinckerhoff, Inc. March 2017 i February 2017 TABLE OF CONTENTS
EVALUATION OF ALTERNATIVES CARRIED FORWARD
 1 EVALUATION OF ALTERNATIVES CARRIED FORWARD This chapter presents a comparative evaluation of the alternatives carried forward in this Final Environmental Impact Statement (EIS). The intent of this evaluation
9. TRAVEL FORECAST MODEL DEVELOPMENT
 9. TRAVEL FORECAST MODEL DEVELOPMENT To examine the existing transportation system and accurately predict impacts of future growth, a travel demand model is necessary. A travel demand model is a computer
Appendix A: Project Planning and Development A-1 White Paper on Transit and the Tappan Zee Hudson River Crossing Project
 Appendix A: Project Planning and Development A-1 White Paper on Transit and the Tappan Zee Hudson River Crossing Project Purpose of White Paper White Paper on Transit and the Tappan Zee Hudson River Crossing
Congestion Management Process (CMP)
") Congestion Management Process (CMP) Introduction The Congestion Management Process (CMP) is a systematic, data-driven, and regionally accepted approach that aims to improve the performance of the transportation
Congestion Management Process (CMP) Introduction The Congestion Management Process (CMP) is a systematic, data-driven, and regionally accepted approach that aims to improve the performance of the transportation
2040 Addendum Performance-Based Planning November 2018
 2040 Long Range Transportation Plan 2040 Addendum Performance-Based Planning November 2018 Adopted June 13, 2018 250 S. Orange Ave, Suite 200, Orlando, FL 32801 407-481-5672 www.metroplanorlando.org MetroPlan
2004 FEASIBILITY STUDY UPDATE
 Austin-San Antonio Intermunicipal Commuter Rail District 2004 FEASIBILITY STUDY UPDATE December 2004 EXECUTIVE SUMMARY INTRODUCTION Almost 3 million people in Central Texas, living and working between
Chapter 1: Overview. page 1. Figure 2-1: Road congestion is expected to continue to grow
 Chapter 1: Overview Figure 2-1: Road congestion is expected to continue to grow The region s mobility so fundamental to its economic vitality and quality of life is challenged by mounting congestion, rising
Published by the Palm Beach Metropolitan Planning Organization (MPO) in coordination with Leftwich Consulting Engineers, Inc.
 in coordination with Leftwich Consulting Engineers, Inc.") AMENDMENT #3 + Published by the Palm Beach Metropolitan Planning Organization (MPO) in coordination with Leftwich Consulting Engineers, Inc. Adopted October 16, 2014 by the Board of Directors Palm Beach
AMENDMENT #3 + Published by the Palm Beach Metropolitan Planning Organization (MPO) in coordination with Leftwich Consulting Engineers, Inc. Adopted October 16, 2014 by the Board of Directors Palm Beach
Alternatives Analysis, New Starts
 Alternatives Analysis, New Starts E. Beimborn, University of Wisconsin-Milwaukee 1 Outline Overview The process at the local level FTA new starts process Project justification Financial rating Forecasting
CTA Blue Line Forest Park Branch Feasibility/Vision Study: Transit Ridership Forecasting Analysis Technical Memorandum Submitted By
 Feasibility/Vision Study: Technical Memorandum Submitted By WSP Parsons Brinckerhoff 30 N. LaSalle Street, Suite 4200 Chicago, IL 60602 December 2016 TABLE OF CONTENTS 1.0 INTRODUCTION... 1 1.1 Organization
2040 Transportation Policy Plan Conversion to Performance Based Planning Basis. 25 th Annual CTS Transportation Research Conference May 21, 2014
 2040 Transportation Policy Plan Conversion to Performance Based Planning Basis 25 th Annual CTS Transportation Research Conference May 21, 2014 1 About the plan Long-range transportation plan for the Twin
6.0 CONGESTION HOT SPOT PROBLEM AND IMPROVEMENT TRAVEL DEMAND MODEL ANALYSIS
 6.0 CONGESTION HOT SPOT PROBLEM AND IMPROVEMENT TRAVEL DEMAND MODEL ANALYSIS 6.1 MODEL RUN SUMMARY NOTEBOOK The Model Run Summary Notebook (under separate cover) provides documentation of the multiple
Locally Preferred Alternative. Work In Progress; Subject To Change Without Notice 1
 Locally Preferred Alternative 1 Riverview Corridor Study Area 12 mile study area between Saint Paul and Bloomington. Connects major destinations, neighborhoods and job concentrations. Serves growing and
Executive Summary. Study Background
 Executive Summary ES 1.1 Introduction The Capitol Region Council of Governments (CRCOG) and the Connecticut Department of Transportation (CTDOT) initiated the (BTS) in 2006 to identify near and long-term
Working with Transportation Concurrency Exception Areas
 Working with Transportation Concurrency Exception Areas September 2006 Presented by the Florida Department of Transportation Working with Transportation Concurrency Exception Areas Volume 1, September
10. PROJECT DEVELOPMENT, LEADERSHIP, AND OVERSIGHT GUIDELINES
 10. PROJECT DEVELOPMENT, LEADERSHIP, AND OVERSIGHT GUIDELINES It is important to note that the Transitway Guidelines are not intended to be prescriptive, but rather to provide a consistent basis for planning,
Chapter 4: Transportation and Land Use
 Chapter 4: Transportation and Land Use Transportation and land use together make possible the wide range of destination opportunities in the region. Transportation provides the connections, and, in turn,
Database and Travel Demand Model
 Database and Travel Demand Model 7 The CMP legislation requires every CMA, in consultation with the regional transportation planning agency (the Metropolitan Transportation Commission (MTC) in the Bay
Evaluation of Alternatives
 Chapter 9.0 Evaluation of Alternatives Chapter 9.0 provides a summary evaluation of the No Build Alternative and the Preferred Alternative. The evaluation contained within this chapter is an assessment
Final Land Use and Development Opportunities Report 5.0 Environmental Impact/Environmental Consequences
 Figure 5-6. Century City 1/4-Mile Station Area August 16, 2010 Page 5-14 Figure 5-7. Wilshire/Westwood 1/4-Mile Station Area August 16, 2010 Page 5-15 Alternative 1 would be constructed underneath existing
SERPM8.0 TRAVEL DEMAND MODEL UPDATE DATA AVAILABILITY AND NEEDS
 SERPM8.0 TRAVEL DEMAND MODEL UPDATE DATA AVAILABILITY AND NEEDS UPDATED JANUARY 18 2017 UPDATES IN RED DATA ITEM DESCRIPTION/COMMENTS AGENCY/DETAILS/TIMING DATA STATUS A1 A2 Geographies for development
South Florida East Coast Corridor (SFECC) Study
 Study") South Florida East Coast Corridor (SFECC) Study P r o j e c t U p d a t e J u l y 2 7, 2 0 11 FM Number: 417031-3-22-01 Re-introduce Passenger Rail Service on FEC Corridor (85 miles) Improve Freight Capacity
South Florida East Coast Corridor (SFECC) Study P r o j e c t U p d a t e J u l y 2 7, 2 0 11 FM Number: 417031-3-22-01 Re-introduce Passenger Rail Service on FEC Corridor (85 miles) Improve Freight Capacity
Los Angeles County Congestion Reduction Demonstration Project
 Los Angeles County Congestion Reduction Demonstration Project frequently asked questions update #1 /august 2008 Los Angeles County Metropolitan Transportation Authority (Metro), California Department of
Gateway Corridor Transitway
 Locally Preferred Alternative Summary Gateway Corridor Transitway 1 Metropolitan Council, Nov. 12, 2014 Gateway Corridor Transitway Proposed highcapacity transit improvement connecting east metro suburbs
2035 LRTP Transportation Options Introduction
 2035 LRTP Transportation Options Introduction What is the 2035 LRTP? The 2035 Long-Range Transportation Plan (LRTP) is the guide for major transportation investments in the Durham-Chapel Hill-Carrboro
Chapter #9 TRAVEL DEMAND MODEL
 Chapter #9 TRAVEL DEMAND MODEL TABLE OF CONTENTS 9.0 Travel Demand Model...9-1 9.1 Introduction...9-1 9.2 Overview...9-1 9.2.1 Study Area...9-1 9.2.2 Travel Demand Modeling Process...9-3 9.3 The Memphis
Fairfax County Countywide Transit Network Study
 Fairfax County Countywide Transit Network Study Proposed High Quality Transit Network Concept Metropolitan Washington Council of Governments Travel Forecasting Subcommittee September 20, 2013 1 Presentation
CENTRAL AND EAST CORRIDORS
 HIGH-CAPACITY TRANSIT STUDY CENTRAL AND EAST CORRIDORS SEPTEMBER 2014 CORRIDOR REPORT: KIRKLAND-BELLEVUE-ISSAQUAH HIGH-CAPACITY TRANSIT CORRIDOR STUDY Kirkland-Bellevue-Issaquah Corridor Sound Transit
FROM THE CHAIR By: Michael Dorweiler, AICP 2007 Chairman for the Tampa Bay Applications Group DATES TO REMEMBER
 An Open Forum for Transportation-Related Issues TAMPA BAY APPLICATIONS GROUP February 2007 DATES TO REMEMBER Meeting dates for Tampa Bay Applications Group Year 2007 February 22 May 17 August 23 November
3. STATION SPACING AND SITING GUIDELINES
 3. STATION SPACING AND SITING GUIDELINES The station spacing and siting guidelines are summarized in Table 3-1. Table 3-1 also includes benchmark information for local transit service and express bus as
Proposed Comprehensive Update to the State of Rhode Island s Congestion Management Process
 Proposed Comprehensive Update to the State of Rhode Island s Statewide Planning Program January 2018 Summary Outline of of Action Steps 1. Develop Objectives for Congestion Management What is the desired
PINELLAS COUNTY MOBILITY PLAN SUMMARY REPORT
 PINELLAS COUNTY MOBILITY PLAN SUMMARY REPORT In September, 2013, the Pinellas County Mobility Plan Report was approved by the Metropolitan Planning Organization (MPO). This action endorsed a countywide
The Level of Service Metric and. Alternatives for Multi-Modal Transportation. in Oakland
 The Level of Service Metric and Alternatives for Multi-Modal Transportation in Oakland By Jill Nevins For the City of Oakland, Public Works Agency Mills College Public Policy Program May 2012 Executive
Going Forward The Plan to Maintain & Improve Mobility Frequently Asked Questions (FAQs)
") Going Forward The Plan to Maintain & Improve Mobility Frequently Asked Questions (FAQs) What is Going Forward The Plan to Maintain & Improve Mobility (Plan) and why does the region need a Long Range Transportation
Going Forward The Plan to Maintain & Improve Mobility Frequently Asked Questions (FAQs) What is Going Forward The Plan to Maintain & Improve Mobility (Plan) and why does the region need a Long Range Transportation
1RUWKZHVW#:LFKLWD 0DMRU#,QYHVWPHQW#6WXG\
 1RUWKZHVW#:LFKLWD 0DMRU#,QYHVWPHQW#6WXG\ Executive Summary 3UHSDUHGýIRUã 3UHSDUHGýE\ã.DQVDVý'HSDUWPHQWýRI 7UDQVSRUWDWLRQ,QýDVVRFLDWLRQýZLWKã (DUWKý7HFKý,QFï EXECUTIVE SUMMARY Introduction This Northwest
ATTACHMENT A. Detailed Study Scope. I-66 (Inside) Multi-modal Study Scope
 Multi-modal Study Scope") ATTACHMENT A Detailed Study Scope I-66 (Inside) Multi-modal Study Scope EXECUTIVE SUMMARY The Virginia Department of Transportation (VDOT) seeks consultant assistance in identifying and evaluating a range
ATTACHMENT A Detailed Study Scope I-66 (Inside) Multi-modal Study Scope EXECUTIVE SUMMARY The Virginia Department of Transportation (VDOT) seeks consultant assistance in identifying and evaluating a range
APPENDIX H: TRAVEL DEMAND MODEL VALIDATION AND ANALYSIS
 APPENDIX H: TRAVEL DEMAND MODEL VALIDATION AND ANALYSIS Travel demand models (TDM) simulate current travel conditions and forecast future travel patterns and conditions based on planned system improvements
EXECUTIVE SUMMARY REGIONAL TRANSPORTATION PLAN 2050
 EXECUTIVE SUMMARY REGIONAL TRANSPORTATION PLAN 2050 Introduction Goals Policies, and Performance Measures Growth Forecast and Planned Land Use Development Key Recommendations i Executive Summary April
2030 Transportation Policy Plan SUMMARY PRESENTATION. Land Use Advisory Committee November 15, 2012
 2030 Transportation Policy Plan SUMMARY PRESENTATION Land Use Advisory Committee November 15, 2012 Today s Topics Transportation Policy Plan (TPP) Requirements and Background Current TPP Policies, Issues
METRA UP-W LINE. Locally Preferred Alternative Report
 METRA UP-W LINE Cook, Kane, and DuPage Counties Illinois Alternatives Analysis Study Document #9 Locally Preferred Alternative Report August 13, 2007 Prepared by Parsons Alternatives Analysis Documents
What is the Transportation Policy Plan (TPP)?
?") Summary What is the Transportation Policy Plan (TPP)? The region s long range transportation plan Includes all modes of transportation: highways, transit, airports, freight, biking, pedestrians Meets the
Summary What is the Transportation Policy Plan (TPP)? The region s long range transportation plan Includes all modes of transportation: highways, transit, airports, freight, biking, pedestrians Meets the
November 16, Metropolitan Washington Council of Governments National Capital Region Transportation Planning Board. Review of FTA Summit Software
 Metropolitan Washington Council of Governments National Capital Region Transportation Planning Board Review of FTA Summit Software November 16, 2007 8300 Boone Blvd, Suite 700 Vienna, VA 22182 (703) 847-3071
APPENDIX B - GLOSSARY FEBRUARY 2017
 APPENDIX B - GLOSSARY FEBRUARY 2017 DENVERMOVES Transit Denver Moves: Transit - ii - APPENDIX B TRANSIT AND MOBILITY GLOSSARY Amenities, stop or station: Objects or facilities (such as a shelter, bench,
CITY OF JACKSONVILLE 2030 MOBILITY PLAN STUDY UPDATE GOALS, OBJECTIVES, AND PERFORMANCE MEASURES PREPARED FOR: CITY OF JACKSONVILLE
 CITY OF JACKSONVILLE 2030 MOBILITY PLAN STUDY UPDATE GOALS, OBJECTIVES, AND PERFORMANCE MEASURES 3.20.2017 PREPARED FOR: CITY OF JACKSONVILLE 55 Railroad Row White River Junction, VT 05001 802.295.4999
Final Congestion Management Process
 Final Congestion Management Process 2015 Prepared by Tulare County Association of Governments 210 N. Church St., Suite B Visalia, California 93291 1. Introduction: What Is Congestion? Congestion can generally
Transportation A Conversation on Regional Transportation. Tacoma City Manager April 15, Update to the Regional Transportation Plan
 Transportation 2040 Update to the Regional Transportation Plan A Conversation on Regional Transportation Tacoma City Manager April 15, 2009 1 Puget Sound Regional Council The Region: 4 counties 82 cities
Final Air Quality Report
 Florida Department of Transportation - District VII County Line Road (C.R. 578) Project Development and Environment Study From U.S. 19 (S.R. 55) to U.S. 41 (S.R. 45) Work Program Item Segment Number: 257298
Transit Service Guidelines
 G R E AT E R VA N CO U V E R T R A N S P O RTAT I O N A U T H O R I T Y Transit Service Guidelines PUBLIC SUMMARY REPORT JUNE 2004 Greater Vancouver Transportation Authority TRANSIT SERVICE GUIDELINES
4: Transportation and Land Use
 Chapter Figure 4-1: Recent development has brought more housing and mixed use Downtown Minneapolis - looking north from E 15th Street at the Grant Street / 11th Street exit 4: Transportation and Land Use
The Indian Nations Council of Governments (INCOG) 2035 Plan: Roadways Element
 2035 Plan: Roadways Element") Roadways The Indian Nations Council of Governments (INCOG) The Indian Nations Council of Governments is the designated regional planning organization for the Tulsa Transportation Management Area (TMA).
Roadways The Indian Nations Council of Governments (INCOG) The Indian Nations Council of Governments is the designated regional planning organization for the Tulsa Transportation Management Area (TMA).
2040 Long Range Transportation Plan
 2040 Long Range Transportation Plan Presented by Iowa Northland Regional Council of Governments October 22, 23, and 24, 2013 Liaison for federal transportation funding that goes to local cities and counties
SIS 2045 Multimodal Unfunded Needs Plan: FDOT District Four Projects. Project Review with Metropolitan/ Transportation Planning Organizations
 SIS 2045 Multimodal Unfunded Needs Plan: FDOT District Four Projects Project Review with Metropolitan/ Transportation Planning Organizations March/April 2017 Outline Purpose of and Planning for Florida
Chapter 5 Transportation Draft
 Chapter 5 Transportation Draft Discussion Similar to the other elements in the Comprehensive Plan, the transportation element impacts the quality of life, economic development and public safety of the
Overview of Prior Studies
 FLORIDA DEPARTMENT OF TRANSPORTATION PORT OF MIAMI TUNNEL STUDY Overview of Prior Studies This summary was provided on July 29, 2003 by Jeff V. Easley, PE, Vice President of Reynolds, Smith and Hills as
Appendix O Congestion Management Program REGIONAL TRANSPORTATION PLAN/SUSTAINABLE COMMUNITIES STRATEGY
 Appendix O Congestion Management Program REGIONAL TRANSPORTATION PLAN/SUSTAINABLE COMMUNITIES STRATEGY 2014 REGIONAL CONGESTION MANAGEMENT PROGRAM 2014 RTP/SCS APPENDIX O SAN JOAQUIN COUNCIL OF GOVERNMENTS
Mobility 2025 Update: The Metropolitan Transportation Plan
 Mobility 2025 Update: The Metropolitan Transportation Plan May, 2001 North Central Texas Council of Governments Transportation Department MOBILITY 2025 UPDATE FINANCIAL SUMMARY Metropolitan Transportation
Alternatives Evaluation Methodology
 Alternatives Evaluation Methodology www.vision54 56.com B 1 Phase 2 Alternatives Evaluation Methodology PASCO COUNTY METROPOLITAN PLANNING ORGANIZATION 8731 Citizens Drive New Port Richey, FL 34654 Ph
ALBION FLATS DEVELOPMENT EXISTING TRAFFIC CONDITIONS AND POTENTIAL IMPACTS
 EXISTING TRAFFIC CONDITIONS AND POTENTIAL IMPACTS FINAL REPORT SEPTEMBER 2010 TABLE OF CONTENTS 1.0 INTRODUCTION 1 2.0 EXISTING TRAFFIC CONDITIONS 2 3.0 FUTURE TRAFFIC CONDITIONS 3 4.0 POTENTIAL IMPACTS
Overview of Alternatives Analysis
 Red Line/HealthLine Extension Major Transportation Improvement Analysis Greater Cleveland Regional Transit Authority Public Meeting: February 11, 2016 Final Report Overview of Alternatives Analysis Public
REGIONAL PLANNING AND POLICY FRAMEWORK A Preferred Approach for our Regional Growth
 REGIONAL PLANNING AND POLICY FRAMEWORK A Preferred Approach for our Regional Growth The Regional Comprehensive Plan (RCP) establishes a new approach to planning in the San Diego region. This approach is
Miami-Dade Transit. Alice N. Bravo, P.E. Director. Miami-Dade Transit 1
 Miami-Dade Transit Alice N. Bravo, P.E. Director Miami-Dade Transit 1 Miami-Dade Transit MDT is the largest transit agency in the State of Florida, and one of the largest departments within Miami-Dade