Economic Contribution of the US Tugboat,
|
|
|
- Stephany Casey
- 5 years ago
- Views:
Transcription

1 Economic Contribution of the US Tugboat, Towboat, and Barge Industry Economic Contribution of the US Tugboat, Towboat, and Barge Industry May 10, 2017 Prepared for the American Waterways Operators
2 Economic Contribution of the US Tugboat, Towboat, and Barge Industry Table of Contents Executive Summary ES-1 I. Introduction 1 II. Overview of the US Tugboat, Towboat, and Barge Industry 4 III. Economic Impact of the US Tugboat, Towboat, and Barge Industry 21 IV. Other Benefits of the US Tugboat, Towboat, and Barge Industry 30 Appendix A: Methodology and Data Sources Appendix B: Detail on State-Level Economic Contributions B-1 Appendix C: Detail on Waterborne Commerce in the United States C-1 Appendix D: Detail on Waterborne Commerce by State Appendix E: Detail on Waterborne Commerce for Select US Waterways D-1 E-1 A-1 This document has been prepared pursuant to an engagement between PricewaterhouseCoopers LLP and its Client. As to all other parties, it is for general information purposes only, and should not be used as a substitution for consultation with professional advisors. This study was developed through a cooperative agreement between the U.S. Department of Transportation (DOT), Maritime Administration and The American Waterways Operators. [DTMA-91-H ]. Opinions or points of view expressed in this document are those of the authors and do not necessarily reflect the official position of, or a position that is endorsed by, the U.S. Government, DOT, or any sub-agency thereof.
3 Economic Contribution of the US Tugboat, Towboat, and Barge Industry Executive Summary The US tugboat, towboat, and barge industry plays an important role in domestic commerce. Nearly 5,500 US-flag tugboats and towboats and more than 31,000 barges move an average of 763 million tons of cargo on the nation s waterways each year, including raw materials and commodities as well as finished consumer products. The industry provides tug and tow services in US ports and facilitates trade between ports in the US mainland, Hawaii, Alaska, Puerto Rico, and the US Virgin Islands. In addition to its role in domestic waterborne commerce, the industry also facilitates international trade by providing tugboat services to large containerships and other oceangoing vessels entering US ports. The American Waterways Operators engaged PwC to quantify the economic contribution of the US tugboat, towboat, and barge industry in terms of employment, labor income, value added, 1 and taxes for 2014, the most recent year for which a consistent set of data is available. In describing these impacts, this report considers three separate channels -- the direct impact, the indirect impact, and the induced impact -- that in aggregate provide a measure of the total economic impact of the US tugboat, towboat, and barge industry: Direct impacts include the jobs, labor income, value added, and taxes directly attributable to the US tugboat, towboat, and barge industry. Indirect impacts include the jobs, labor income, value added, and taxes occurring throughout the industry s supply chain. Induced impacts include the jobs, labor income, value added, and taxes resulting from household spending of labor and proprietor s income earned either directly or indirectly from the US tugboat, towboat, and barge industry s spending. This report quantifies the industry s operational impact (due to purchases of intermediate inputs and payments of labor compensation and dividends) and capital investment impact (due to its investment in new structures and equipment, including vessels) at the national level. Separate detail is also provided on the industry s operational impact for the 50 states and the District of Columbia. 2 1 Value added refers to the additional value created at a particular stage of production. It is a measure of the overall importance of an industry and represents the industry s portion of US gross domestic product ( GDP ). Value added consists of: employee compensation, proprietors' income, income to capital owners from property, and indirect business taxes (including excise taxes, property taxes, fees, licenses, and sales taxes paid by businesses). 2 The industry s capital investment impact is not quantified at the state level due to the non-availability of capital expenditure data at the state level. ES-1
4 In estimating the industry s combined tax impact, all federal, state, and local taxes (other than personal taxes 3 ) borne or collected by the industry are included. Taxes borne are taxes that are charged to a company, such as corporate income and property taxes. Taxes collected are taxes and fees that a company collects and administers on behalf of the government, such as employer s withholding of the employee share of payroll taxes individual income taxes, where the company is not the intended object of taxation. These economic impacts represent all of the backward linkages of the US tugboat, towboat, and barge industry to its suppliers. They do not capture any forward linkages (i.e., the economic impact on production in sectors that use the industry s services as an input). National Economic Contributions In 2014, the US tugboat, towboat, and barge industry generated revenues of $15.9 billion, directly employed 50,480 workers, and paid out $4.7 billion in compensation (including wages and salaries and benefits), an average of $93,835 per worker. The industry also contributed $9.0 billion to US gross domestic product (GDP) and invested nearly $2.2 billion in property, plant, and equipment, including its purchases of vessels. Table ES-1 (Direct, Indirect, and Induced) Economic Contributions of the US Tugboat, Towboat, and Barge Industry, 2014 Indirect and Induced Impacts Direct Capital Operational Impacts Investment Impact Impacts Impacts Employment a 50, ,500 30, ,550 Labor Income ($ millions) b 4,737 12,768 1,891 19,397 Value Added ($ millions) 8,954 21,969 2,847 33,771 Tax Impact ($ millions) c $1,173 $3,591 $464 $5,227 Source: PwC calculations using the IMPLAN modeling system (2013 database) and data from the US Bureau of Labor Statistics, the Census Bureau, and the Army Corps of Engineers. Note: Details may not add to totals due to rounding. a Employment is defined as the number of payroll and self-employed jobs, including part time jobs. b Labor income is defined as wages and salaries and benefits as well as proprietors' income. c Includes all types of taxes (other than personal taxes) borne and collected at the federal, state and local level. In addition to 50,480 direct jobs, the US tugboat, towboat, and barge industry supported another 251,070 indirect and induced jobs in other sectors of the economy, approximately 5.0 additional jobs for each direct job in the industry. In total, combining both operational and capital investment impacts, the US tugboat, towboat, 3 Personal taxes such as federal and state personal income taxes (including employer withholdings and personal income tax on business income), estate and gift taxes, state and local property taxes, motor vehicle licenses and other taxes, and licenses paid by individuals are excluded. See Appendix A for more detail. ES-2
5 and barge industry directly or indirectly supported 301,550 jobs in 2014 (see Table ES- 1). Counting direct, indirect, and induced impacts, the US tugboat, towboat, and barge industry s total impact on labor income (including proprietors income) was $19.4 billion. The industry s total impact on US GDP was $33.8 billion in Nationwide, the US tugboat, towboat, and barge industry directly paid or collected nearly $1.2 billion in federal, state, and local taxes in 2014, including corporate income taxes, excise and sales taxes, and other taxes borne or collected by businesses. The industry indirectly supported an additional $4.1 billion in taxes borne and collected by suppliers. Including direct, indirect, and induced tax impacts, the US tugboat, towboat, and barge industry had a combined tax impact of more than $5.2 billion in 2014 (see Table ES-1). State-Level Economic Contributions The industry was active in 38 states in 2014, but had an impact on the economies of all 50 states plus the District of Columbia through its indirect and induced economic impacts. Ranked by direct jobs in 2014, the industry is largest in Louisiana, Texas, Kentucky, Florida, and New York (see Figure ES-1). These five states accounted for 59 percent of all direct employment in the US tugboat, towboat, and barge industry. Figure ES-1 Direct Employment in the US Tugboat, Towboat, and Barge Industry, Top 10 States in ,000 15,620 16,000 14,000 12,000 10,000 8,000 5,560 6,000 4,000 3,320 2,680 2,470 2,240 2,020 1,950 1,880 2,000 1,300 0 ES-3
6 The industry s total operational impact by state varies based on the level of direct activity and the share of the industry s supply chain in each state. In 2014, the total number of jobs directly or indirectly attributable to the US tugboat, towboat, and barge industry were highest in Louisiana, Texas, Kentucky, California, and New York (see Table ES-2). Combined these five states accounted for nearly 48 percent of all jobs and more than 50 percent of all GDP attributable to the US tugboat, towboat, and barge industry. Table ES-2 Economic Contributions of the US Tugboat, Towboat, and Barge Industry by State, 2014 State Employment* Labor Income** Value Added Amount ($ Million) ($ Million) Louisiana 52,810 $3,355 $5,900 Texas 30,550 $2,170 $4,003 Kentucky 15,340 $864 $1,532 California 15,310 $1,116 $1,926 New York 15,150 $1,303 $2,176 Florida 14,210 $784 $1,392 Tennessee 13,300 $771 $1,395 Illinois 11,320 $738 $1,247 Washington 7,920 $562 $1,005 Pennsylvania 6,880 $438 $713 Indiana 5,880 $324 $899 Maryland 5,810 $390 $682 Mississippi 5,530 $292 $517 Ohio 5,200 $299 $537 New Jersey 5,150 $388 $639 All other states 60,610 $3,711 $6,361 U.S. 270,980 $17,505 $30,924 Source: PwC calculations using IMPLAN modeling system (2013 database). Results do not include capital investment impact (not quantified at the state level due to non-availability of data). Numbers may not add to total due to rounding. * Employment is defined as the number of payroll and self-employed jobs, including part-time jobs. ** Labor income is defined as wages and salaries and benefits as well as proprietors' income. Other Impacts In addition to its economic contributions, the US tugboat, towboat, and barge industry provides a number of other important benefits. A number of studies suggest that the industry provides an efficient, low-cost method for transporting a broad range of commodities. Furthermore, studies show that barge transport tends to be more fuel efficient and have a lower environmental footprint. 4 4 See Section IV for a summary of the recent literature. ES-4
7 Barge traffic is able to move large volumes of cargo over long distances. A typical 15- barge tow can haul approximately 26,250 tons of cargo. To move the same amount of cargo would require 216 rail cars or 1,050 tractor trailers. 5 In part due to its ability to move large volumes of cargo, studies indicate that the US tugboat, towboat, and barge industry provides a low-cost means of freight transportation. While there can be substantial differences in transportation costs by mode across commodity types or regions, estimates range between 1 and 2 cents per ton mile for barges and between 2.5 and 3 cents per ton-mile for rail. Highway freight cost estimates ranged from 5.4 to 42.3 cents per ton mile. 6 In fact, recent studies have found that barge traffic saves between $12.0 and $12.5 billion in transportations costs. 7 These cost savings likely translate into lower costs for consumers. Studies also indicate that the US tugboat, towboat, and barge industry provides a fuel efficient means for transporting freight. In 2009, inland towing was able to move one ton of freight 647 miles on a single gallon of fuel, compared to 477 miles for freight railroads and just 145 miles for freight trucks. 8 As a result of better fuel efficiency and lower energy intensities, studies show that barge transport has lower greenhouse gas emissions than other forms of freight transportation (see Figure ES-2). Figure ES-2 Greenhouse Gas Emissions by Mode of Freight Transportation, 2014 [Metric Tons per Million Ton Mile] Inland Towing Freight Railroads Freight Trucks Source: Texas Transportation Institute, "A Modal Comparison of Domestic Freight Transportation Effects of the General Public: ," January 2017, Table 8. 5 See 6 See Section IV of this report for further details. 7 See Texas Transportation Institute, A Modal Comparison of Domestic Freight Transportation Effects on the General Public: , January 2017 and University of Kentucky and University of Tennessee, Inland Navigation in the United States: An Evaluation of the Economic Impacts and the Potential Effects of Infrastructure Investment, November Texas Transportation Institute, A Modal Comparison of Domestic Freight Transportation Effects on the General Public: , January ES-5
8 Introduction 1
9 Economic Contribution of the US Tugboat, Towboat, and Barge Industry I. Introduction The US tugboat, towboat, and barge industry plays an important role in domestic commerce. Nearly 5,500 US-flag tugboats and towboats and more than 31,000 barges move an average of 763 million tons of cargo on the nation s waterways each year, including raw materials and commodities as well as finished consumer products. The industry provides tug and tow services in US ports and facilitates trade between ports in the US mainland, Hawaii, Alaska, Puerto Rico, and the US Virgin Islands. In addition to its role in domestic waterborne commerce, the industry also facilitates international trade by providing tugboat services to large containerships and other oceangoing vessels entering US ports. The American Waterways Operators engaged PwC to quantify the economic contribution of the US tugboat, towboat, and barge industry in terms of employment, labor income, value added, and taxes for 2014 using data from the federal government and customized input-output models built using the IMPLAN modeling system. 9 In describing these impacts, this report considers three separate channels -- the direct impact, the indirect impact, and the induced impact -- that in aggregate provide a measure of the total economic impact of the US tugboat, towboat, and barge industry: Direct impacts include the jobs, labor income, value added, and taxes directly attributable to the US tugboat, towboat, and barge industry. Indirect impacts include the jobs, labor income, value added, and taxes occurring throughout the industry s supply chain. Induced impacts include the jobs, labor income, value added, and taxes resulting from household spending of labor and proprietor s income earned either directly or indirectly from the US tugboat, towboat, and barge industry s spending. This report quantifies the industry s operational impact (due to purchases of intermediate inputs and payments of labor compensation and dividends) and capital investment impact (due to its investment in new structures and equipment, including vessels) at the national level. Separate detail is also provided on the industry s operational impact for the 50 states and the District of Columbia The IMPLAN input-output economic modeling system is supported by the IMPLAN Group LLC. Its users include academia, federal, state and local governments, and the private sector. 10 The industry s capital investment impact is not quantified at the state level due to the non-availability of capital expenditure data at the state level. 1
10 The rest of this report is organized as follows. Section II provides an overview of the US tugboat, towboat, and barge industry. Section III provides PwC s estimates of the industry s total economic contributions at the national and state levels. Additional benefits of barge transportation, in terms of lower costs and lower emissions, are discussed in Section IV. The report also includes several appendices that provide detailed state level economic impacts, a description of the methodology, and additional detail on the industry s operations. 2
11 Overview of the US Tugboat, Towboat, and Barge Industry
12 II. Overview of the US Tugboat, Towboat, and Barge Industry Tugboats, towboats, and barges operating on the nation's inland waterways, coasts, and harbors are a vital part of the US economy, providing an important means of transit for a variety of commodities and finished goods. This section of the report defines the US tugboat, towboat, and barge industry and provides an overview of its operations at the national, state, and waterway levels. A. Industry Definition Most economic activity directly associated with the US tugboat, towboat, and barge industry is included in North American Industry Classification System (NAICS) sectors ( Coastal and Great Lakes Freight Transportation ) and ( Inland Water Freight Transportation ). These sectors comprise establishments primarily engaged in providing water transportation of cargo via rivers, coastal waters, intracoastal waterways, the Great Lakes System, and the deep seas between ports of the United States and US possessions and territories. Included within these sectors are the provision of tugboat and towboat services and the movement of cargo by barge for purposes of domestic commerce. 11 The industry also includes a portion of NAICS sectors ( Navigational Services to Shipping ) and ( Other Support Activities for Water Transportation ). Included within these sectors are the provision of tugboat and towboat services within harbors and ports. According to the 2012 Economic Census, approximately 69 percent of the revenues of sector and 1.5 percent of the revenues of sector were derived from tugboat and towboat services. 12 Additional shore jobs related to the vessel operations of the US tugboat, towboat, and barge industry are found in NAICS sectors ( Port and Harbor Operations ) and ( Marine Cargo Handling ) B. Description of the Industry In 2014, there were 5,476 tugboats, towboats, and push boats and 31,043 barges operating on the nation s waterways. According to the Army Corps of Engineers, the US barge fleet had a cargo capacity of more than 61 million tons and moved nearly 785 million tons of cargo on US waterways in 2014, including agricultural products, coal, petroleum products, and manufactured goods. Measured by tonnage, barges accounted for 83.8 percent of all domestic waterborne commerce (i.e., waterborne commerce that originates and terminates at US harbors and ports) and 98.8 percent of commerce on internal waterways. The industry also 11 These industries also include movement of freight via containership and other self-propelled vessels, as well as certain other freight transportation related activities. Throughout this paper, where possible, we have limited the data and analysis to the portion of these sectors that are part of the US tugboat, towboat, and barge industry. 12 US Census Bureau, 2012 Economic Census, Report EC1248SLLS1, Transportation and Warehousing: Subject Series - Product Lines Statistics by Industry for the U.S.:
13 facilitates international trade by providing tugboat services to large containerships and other oceangoing vessels entering US ports. 1. Employment and Income In 2014, the US tugboat, towboat, and barge industry employed 50,480 workers (including related shore jobs), approximately 38,600 of which were mariners on vessels operating on US waterways, and paid $4.7 billion in compensation (including wages and salaries and benefits). The industry employed workers in 38 states in 2014; however, five states (Louisiana, Texas, Kentucky, Florida, and New York) accounted for nearly 60 percent of all private sector employment in the industry (see Table II-1 and Figure II-1). Table II-1 Private Sector Employment in the US Tugboat, Towboat, and Barge Industry, Top 10 States in 2014 State Private Employment Percent of U.S. Louisiana 15, % Texas 5, % Kentucky 3, % Florida 2, % New York 2, % Tennessee 2, % California 2, % Illinois 1, % Washington 1, % Mississippi 1, % All other states combined 11, % US 50, % Source: PwC estimates based on data from the Bureau of Labor Statistics, Census Bureau, and the Army Corps of Engineers. Note: Details may not add to total due to rounding. 5
14 Figure II-1 Private Sector Employment in the US Tugboat, Towboat, and Barge Industry by State, No Employment 1 1 to 100 jobs to 250 jobs to 500 jobs to 1,000 jobs 5 1,000 to 2,500 jobs 6 2,500 to 5,000 jobs 7 more than 5,000 jobs Source: PwC estimates based on data from the Bureau of Labor Statistics, Census Bureau, and the Army Corps of Engineers. In 2014, private employee compensation in the industry was over $4.7 billion, more than 60 percent of which was paid in five states (Louisiana, Texas, Kentucky, New York, and Florida) (see Table II-2). 6
15 Table II-2 Private Employee Compensation in the US Tugboat, Towboat, and Barge Industry, Top 10 States in 2014 [Dollar Amounts in $ Millions] Employee 2. Revenue and Output Percent of U.S. State Compensation* Louisiana $1, % Texas % Kentucky % New York % Florida % California % Washington % Tennessee % Illinois % Maryland % All other states combined % US $4, % Source: PwC estimates based on data from the Bureau of Labor Statistics, Census Bureau, and the Army Corps of Engineers. *Employee compensation includes wages and salaries and benefits. In 2014, industry revenues were $15.9 billion from the movement of cargo on barges and the provision of tugboat and towboat services to self-propelled vessels (see Table II-3). Industry revenues exceed $1 billion in Louisiana ($4.6 billion), Texas ($1.7 billion), Kentucky ($1.4 billion), and Tennessee ($1.1 billion). The industry s contribution to US GDP (i.e., value added) amounted to $9.0 billion in 2014 (see Table II-4). Industry value added exceeds $0.5 billion in Louisiana ($2.6 billion), Texas ($1.0 billion), Kentucky ($0.6 billion) and New York ($0.6 billion). 7
16 Table II-3 US Tugboat, Towboat, and Barge Industry Revenues, Top 10 States in 2014 [Dollar Amounts in $ Millions] Percent of U.S. State Revenues Louisiana $4, % Texas 1, % Kentucky 1, % Tennessee 1, % New York % Florida % Illinois % Indiana % Washington % Mississippi % All other states combined 3, % US $15, % Source: PwC estimates based on data from the Bureau of Labor Statistics, Census Bureau, and the Army Corps of Engineers. Table II-4 US Tugboat, Towboat, and Barge Industry Contribution to GDP, Top 10 States in 2014 [Dollar Amounts in $ Millions] Contribution Percent of U.S. State to GDP Louisiana $2, % Texas % Kentucky % New York % Tennessee % Florida % Indiana % Washington % California % Illinois % All other states combined 1, % US $8, % Source: PwC estimates based on data from the Bureau of Labor Statistics, Census Bureau, and the Army Corps of Engineers. 8
17 3. Capital Expenditures We estimate the industry spent a total of $2.2 billion on new capital assets in 2014, including new vessels, structures, and equipment. 13 In 2014, 66 new or rebuilt tugboats and towboats were added to the US fleet, along with 656 new or rebuilt barges (see Table II-5). In addition, the industry placed orders with US shipyards for 24 new tugboats and towboats and 10 new oceangoing barges in 2014, to be delivered in 2015, 2016, and Table II-5 Summary of Fleet Construction US Tugboat, Towboat, and Barge Industry, 2005 to 2014 Tugboats and Towboats Barges Year New Vessels New Vessels Vessels Rebuilt Vessels Rebuilt , , , , , , , , , , Source: The Army Corps of Engineers, Waterborne Transportation Lines of The United States, Calendar Year Volume 1: National Summaries, Table 3. C. Domestic Waterborne Commerce Over 2.3 billion tons of cargo moved through US ports and on US waterways in 2014 (see Figure II-2). International trade accounted for 60 percent (1.4 billion tons) of this cargo. The remaining 40 percent (937 million tons) was cargo moving on US waterways between domestic ports. In 2014, 785 million tons of cargo were moved by barge, accounting for nearly 84 percent of all domestic waterborne commerce (see Figure II-3). In addition, the industry assists in both foreign and domestic trade by providing tugboat services to containerships and other self-propelled vessels, transporting goods to and from US ports. 13 PwC estimate based on industry data (see Appendix A). 14 Data on the number of new inland barges ordered was not available. See, 9


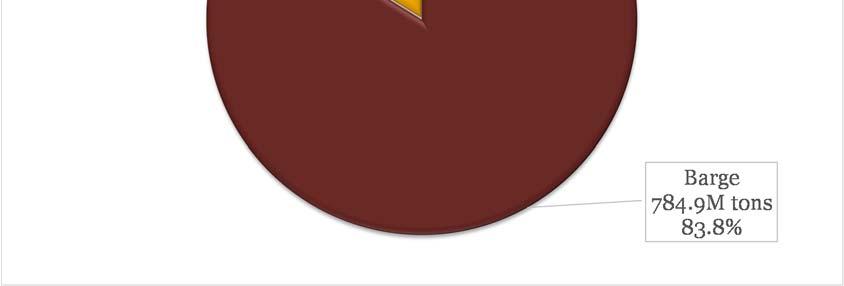
18 Figure II-2 US Waterborne Commerce, 2014 [Millions of Short Tons and Percentage of ] Source: The Army Corps of Engineers, Waterborne Commerce of the United States, Table 1-1. Figure II-3 US Domestic Waterborne Commerce, 2014 [Millions of Short Tons and Percentage of ] Source: The Army Corps of Engineers, Waterborne Commerce of the United States, Table
 and 9 percent within US")

19 Barge traffic is most prevalent on internal waterways (i.e., trade between US ports along the nation s rivers and canals). As shown in Figure II-4, internal waterways accounted for 75 percent of the barge traffic in 2014, compared to 12 percent for trade between coastal ports ( coastwise trade ) and 9 percent within US ports (i.e., intraport freight movement). Figure II-4 Domestic Barge Traffic, 2014 [Millions of Short Tons and Percentage of ] Source: The Army Corps of Engineers, Waterborne Commerce of the United States, Table In 2014, more than 3,700 tugboats and towboats and 27,000 barges operated on the Mississippi River System and the Gulf Intracoastal Waterway, accounting for 68 percent of all tugboats and towboats and 87 percent of the US barge fleet (see Figure II-5). Barges operating on the Mississippi River System and the Gulf Intracoastal Waterway had a total cargo capacity of 50.4 million tons in 2014, 82 percent of the total cargo capacity of the US barge fleet. 11

![Vessels and Percentage of ] So](/docs-images/84/89367692/images/20-2.jpg "urce: U.S.")

20 Figure II-5 US Tugboat, Towboat, and Barge Industry Fleet by Region, 2014 [Number of Vessels and Percentage of ] Source: U.S. Army Corps of Engineers, Waterborne Transportation Lines of the United States, Calendar Year 2014, Volume 1 National Summaries, Table 1. 12

.")

21 1. Products Shipped The types of products shipped by barge include raw materials such as oil, coal, and ore; agriculture products; and manufactured goods. By volume, petroleum and petroleum products represent the largest single commodity shipped by barge, amounting to 279 million tons or 35.5 percent of the total volume of cargo moved by barge in 2014 (see Figure II-6). Coal was the second largest commodity by volume, with 125 million tons shipped (16 percent of the total volume shipped by barge). Primary manufactured goods and manufactured equipment accounted for just 6 percent (47 million tons) of the volume of cargo shipped by barge between domestic ports. Figure II-6 Domestic Barge Traffic by Commodity Group, 2014 [Millions of Short Tons and Percentage of ] Barge Tonnage: million short tons in 2014 Source: U.S. Army Corps of Engineers, Waterborne Commerce of the United States, Calendar Year 2014, Part 5 National Summaries, Table 2-3. For additional detail on domestic waterborne commerce via barge see Appendix C. 13
22 1. Waterborne Commerce by State 15 In 2014, two states had total (domestic and international) waterway commerce tonnage in excess of 500 million short tons: Louisiana (544 million) and Texas (507 million) (see Table II-6). Louisiana, Illinois, and Texas were the states with the highest levels of outgoing domestic tonnage in 2014 (see Table II-7). Louisiana and Texas primarily ship refined petroleum products. Illinois primarily ships food and food products. Louisiana was also the state with the most incoming domestic tonnage, primarily receiving food and food products. Ohio and Indiana ranked second and third in terms of the destination for domestic waterborne commerce, primarily receiving coal and iron, respectively. Table II-8 provides estimates of the value of product shipments by water by state. 16 Combining domestic and international freight, the total value of commodities transported on our nation s waterways totaled more than $491 billion in 2014, of which $298 billion (61 percent) was related to domestic trade. Ranked by the total value of commodities transported, Texas ($142 billion), Louisiana ($81 billion), and California ($51 billion) were the largest states for domestic waterborne commerce. For additional detail on waterborne commerce by state see Appendix D. 15 Cargo volumes reported at the state-level include cargo transported by barge and cargo transported on selfpropelled vessels. Separate breakouts for cargo transported by barge are not available. The data provided includes both outbound and inbound cargo for each state, as well as intrastate shipments. As such, summing cargo volumes and values across all states results in double counting of cargo shipped across state borders. 16 Due to differences in coverage, the value of product shipments reported by the Bureau of Transportation Statistics is not directly comparable with volume data reported by the Army Corps of Engineers. For example, the Bureau of Transportation Statistics does not include the waterborne portion of mixed model freight transportation, while the Army Corps does. The Bureau of Transportation Statistics data also excludes intraport transportation unless there is a change in ownership of the freight. The Army Corps includes all intraport shipments. 14
23 Table II-6 Waterborne Commerce by Type, 2014 [Ranked by Domestic Tonnage, millions of short tons] State Freight Traffic Foreign Trade Domestic Trade US 2, , Louisiana Texas Illinois Kentucky Ohio Indiana West Virginia New Jersey Michigan Pennsylvania Florida Alabama Minnesota Missouri Washington Alaska Tennessee California New York Wisconsin Mississippi Arkansas Hawaii Oregon Virginia Maryland Connecticut Iowa Delaware Massachusetts Oklahoma Puerto Rico Rhode Island North Carolina South Carolina Georgia Maine Idaho New Hampshire Kansas District of Columbia Nebraska Source: US Army Corps of Engineeers, State to State Commodity Tonnages Public Domain Database. Note: Due to interstate commodity flows, state detail does not add to the national total. Tonnage includes all commodities shipped and received including goods transpoted by barge and by containership. Data includes cargo moved for military agencies on commercial vessels, but excludes cargo moved on military vessels. 15
24 Table II-7 Domestic Waterborne Commerce, Major Commodity* by State, 2014 [millions of short tons] State Tonnage Shipments Originating in State 2 Major Commodity Major / Tonnage Major Commodity Major / Alabama 28.4 Coal, Lignite, and Coal Coke 35% 16.5 Coal, Lignite, and Coal Coke 19% Alaska 31.7 Crude Petroleum 71% 3.4 Manufactured Goods 44% Arkansas 10.6 Food and Food Products 57% 7.5 Primary Metal Products 30% California 15.7 Petroleum Products 65% 14.0 Crude Petroleum 73% Connecticut 2.0 Petroleum Products 8% 7.5 Petroleum Products 82% Delaware 4.2 Petroleum Products 79% 2.4 Petroleum Products 53% District of Columbia 0.0 NA NA 0.1 No Detail Available 100% Florida 7.5 Manufactured Goods 19% 39.3 Petroleum Products 72% Georgia 0.6 No Detail Available 100% 0.8 Petroleum Products 22% Hawaii 11.0 Petroleum Products 11% 5.7 Petroleum Products 6% Idaho 0.8 No Detail Available 100% * No Detail Available 100% Illinois 85.8 Food and Food Products 35% 18.7 Chemical Fertilizers 17% Indiana 24.4 Food and Food Products 29% 46.8 Iron Ore, Iron, and Steel Waste and Scrap 51% Iowa 5.5 Food and Food Products 65% 3.3 Chemical Fertilizers 30% Kansas 0.2 No Detail Available 100% * No Detail Available 100% Kentucky 76.4 Coal, Lignite, and Coal Coke 55% 24.7 Coal, Lignite, and Coal Coke 25% Louisiana Petroleum Products 41% Food and Food Products 49% Maine 0.1 No Detail Available 100% 1.2 Petroleum Products 71% Maryland 8.2 Sand, Gravel, Shells, Clay, Salt, and Slag 16% 2.4 Petroleum Products 50% Massachusetts 0.5 Petroleum Products 52% 5.7 Petroleum Products 66% Michigan 31.3 Sand, Gravel, Shells, Clay, Salt, and Slag 57% 20.0 Coal, Lignite, and Coal Coke 73% Minnesota 32.1 Iron Ore, Iron, and Steel Waste and Scrap 83% 7.6 Sand, Gravel, Shells, Clay, Salt, and Slag 38% Mississippi 15.1 Petroleum Products 41% 10.2 Sand, Gravel, Shells, Clay, Salt, and Slag 24% Missouri 31.9 Sand, Gravel, Shells, Clay, Salt, and Slag 28% 6.9 Chemical Fertilizers 30% Nebraska 0.0 NA NA * No Detail Available 100% New Hampshire * No Detail Available 100% 0.5 Petroleum Products 89% New Jersey 41.6 Petroleum Products 75% 11.8 Crude Petroleum 49% New York 13.4 Crude Petroleum 32% 14.3 Petroleum Products 81% North Carolina 1.3 Primary Metal Products 22% 1.1 Iron Ore, Iron, and Steel Waste and Scrap 23% Ohio 29.4 Coal, Lignite, and Coal Coke 47% 57.1 Coal, Lignite, and Coal Coke 50% Oklahoma 3.1 Food and Food Products 60% 3.1 Chemical Fertilizers 52% Oregon 7.3 Sand, Gravel, Shells, Clay, Salt, and Slag 29% 6.8 Petroleum Products 36% Pennsylvania 19.6 Coal, Lignite, and Coal Coke 53% 29.5 Coal, Lignite, and Coal Coke 38% Puerto Rico 2.4 NA NA 3.6 Manufactured Goods 39% Rhode Island 0.3 No Detail Available 100% 3.6 Petroleum Products 74% South Carolina 0.7 No Detail Available 100% 1.3 Chemicals excluding Fertilizers 54% Tennessee 9.0 Food and Food Products 44% 25.8 Coal, Lignite, and Coal Coke 50% Texas Petroleum Products 43% 28.9 Petroleum Products 57% Virginia 7.7 Petroleum Products 20% 3.2 Petroleum Products 13% Washington 20.6 Petroleum Products 36% 18.1 Crude Petroleum 74% West Virginia 48.5 Coal, Lignite, and Coal Coke 81% 15.3 Coal, Lignite, and Coal Coke 42% Wisconsin 18.4 Coal, Lignite, and Coal Coke 57% 7.3 Sand, Gravel, Shells, Clay, Salt, and Slag 36% Source: US Army Corps of Engineeers, State to State Commodity Tonnages Public Domain Database. 1 The major commodity is the commodity with the largest tonnage leaving or coming into a state, excluding the other or unknown category. In some cases commodity detail was not available. 2 Includes intrastate shipments and shipments to US territories and overseas military facilities. An asterisk (*) denotes less than 50,000 tons. Shipments Received by State 16
25 Table II-8 Value of US Waterborne Commerce by Type, 2014 Ranked by Value of Domestic Waterborne Trade [in $ millions] State Foreign Trade Domestic Trade US $491,347 $193,723 $297,624 Texas $174,099 $31,912 $142,187 Louisiana $113,688 $33,032 $80,656 California $64,493 $13,293 $51,200 Alaska $34,310 $3,068 $31,242 Florida $25,336 $10,764 $14,573 Pennsylvania $19,740 $8,477 $11,263 Kentucky $10,528 $646 $9,881 Illinois $31,760 $22,969 $8,791 New Jersey $23,140 $15,300 $7,840 Missouri $7,773 $141 $7,631 Mississippi $10,477 $2,989 $7,488 Washington $13,236 $6,045 $7,191 Tennessee $4,869 $121 $4,748 West Virginia $4,575 $0 $4,575 Alabama $6,017 $1,703 $4,314 Ohio $8,249 $4,120 $4,129 Georgia $7,610 $4,290 $3,320 North Carolina $5,212 $2,253 $2,959 Minnesota $3,001 $654 $2,347 Indiana $2,629 $429 $2,200 Hawaii $2,226 $247 $1,979 Arkansas $3,134 $1,222 $1,912 Oklahoma $1,600 $9 $1,590 New York $36,061 $34,600 $1,461 Delaware $5,560 $4,234 $1,326 Maine $3,934 $2,656 $1,278 Iowa $2,384 $1,111 $1,273 Oregon $1,631 $985 $646 Virginia $7,359 $6,833 $526 Michigan $10,509 $10,033 $476 South Carolina $7,483 $7,237 $247 Wisconsin $4,558 $4,338 $220 Maryland $4,456 $4,364 $92 Kansas $78 $0 $77 Connecticut $8,519 $8,497 $22 Nebraska $15 $0 $15 New Mexico $3 $0 $3 North Dakota $42 $41 $1 Colorado $100 $100 $0 District of Columbia $479 $479 $0 Massachusetts $6,342 $6,342 $0 New Hampshire $4,894 $4,894 $0 Rhode Island $1,507 $1,507 $0 Vermont $157 $157 $0 Source: Bureau of Transportation Statistics, Freight Analysis Framework Version 4. Notes: Due to interstate commodity flows, state detail does not add to the national total. Data includes all commodities shipped and received including goods transported by barge and by containership but excludes the waterborne portion of mixed model freight transportation. Data on Puerto Rico was not provided in the Freight Analysis Framework Version 4. 17
26 2. Key Waterways and Ports Table II-9 (on the next page) summarizes foreign and domestic waterborne commerce for select US waterways. By volume, the Mississippi River System was the most important inland waterway for waterborne commerce with nearly 719 million tons of cargo moved in 2014, of which million tons was shipped between US ports. PwC estimates that 96 percent of the domestic waterborne commerce on the Mississippi River System is transported by barge. The US tugboat, towboat, and barge industry also plays an important role in the operation of our nation s ports, providing tug and tow services to containerships and other self-propelled vessels, transporting cargo by barge within the port, and providing a means to transport cargo inland via the nation s rivers. Table II-10 lists the 15 largest US ports, ranked by total tonnage. Five of the largest US ports are found in Louisiana. These five ports handled more than 533 million tons of cargo in 2014 (including 295 million tons of cargo shipped from other US ports). Four of the top 15 US ports are located in Texas and handled more than 454 million tons of cargo (167 million of which were shipped from other US ports). Table II Largest US Ports by Tonnage, 2014 [millions of short tons] Year Tonnage Domestic Trade For additional detail on select waterways see Appendix E. Foreign Trade Imports Exports South Louisiana, LA, Port of Houston, TX New York, NY and NJ Beaumont, TX Long Beach, CA Corpus Christi, TX New Orleans, LA Baton Rouge, LA Mobile, AL Los Angeles, CA Lake Charles, LA Plaquemines, LA, Port of Cincinnati-Northern KY, Ports Norfolk Harbor, VA Texas City, TX Source: PwC estimates based on data from The Army Corps of Engineers, Waterborne Commerce of the United States, Table
27 Table II-9 Waterborne Commerce by Type, Select US Waterways, 2014 [millions of short tons] Waterway Freight Traffic Foreign Trade Domestic Trade Percent by Imports Exports Barges Barge Atlantic Coast Hudson River, NY % James River, VA % Gulf Coast Black Warrior and Tombigbee Rivers, AL % Gulf Intercoastal Waterway, TX-FL % Tennessee-Tombigbee Waterway, AL and MS % Mississippi River System % Cumberland River, KY and TN % Illinois Waterway, IL % Kanawha River, WV % McClellan-Kerr Arkansas River, AK and OK % Mississippi River Stem % Ohio River System, PA, WV, OH, KY, IN, and IL % Ohio River % Tennessee River, TN, KY, MS, and AL % The Great Lakes % Pacific Coast Columbia River System, OR, WA, and ID % Columbia River % Snake River % Source: PwC estimates based on data from The Army Corps of Engineers, Manuscript Cargo Files ( Note: The percent by barge understates the role of the US tugboat, towboat, and barge industry in US waterborne commerce because it excludes tug and tow services related to international trade. 19
28 Economic Impact of the US Tugboat, Towboat, and Barge Industry
29 III. Economic Impact of the US Tugboat, Towboat, and Barge Industry This section presents estimates of the total economic contributions of the US tugboat, towboat, and barge industry in 2014 at the national and state levels, in terms of employment, labor income, value added (i.e., contribution to GDP), and taxes: Employment is defined as the number of payroll and self-employed jobs, including part time jobs. Labor income is defined as wages and salaries and benefits as well as proprietors' income. Value added is the industry s contribution to gross domestic product (GDP). Taxes include all federal, state, and local taxes borne and collected, other than personal taxes. The economic contributions of the US tugboat, towboat, and barge industry extends beyond vessel operations. The industry purchases goods and services as inputs from companies in other industries. In turn, those companies purchase other products to help meet the demand from the US tugboat, towboat, and barge industry. At each level of production, wages are paid to employees who then spend that money, generating additional economic impacts. The total economic impact reported below includes the direct impact (the jobs, labor income, and value added within the US tugboat, towboat, and barge industry industry), the indirect impact (the jobs, labor income, and value added occurring throughout the industry s supply chain), and the induced impact (the jobs, labor income, and value added resulting from household spending of income earned either directly or indirectly from the industry s spending). This report quantifies the industry s operational impact (due to purchases of intermediate inputs and payments of labor compensation and dividends) and capital investment impact (due to its investment in new structures and equipment, including vessels) at the national level. Separate detail is also provided on the industry s operational impact for the 50 states and the District of Columbia. 17 Industry Definition For purposes of this study, the US tugboat, towboat, and barge industry is defined to include all U.S.-flag tugboats, towboats, and barges that operate in whole or in part 17 The industry s capital investment impact is not quantified at the state level due to the nonavailability of capital expenditure data at the state level. 21
30 on the domestic waterways and ports of the United States, along with related shore jobs. As described in Table III-1, economic activity directly associated with the US tugboat, towboat, and barge industry is captured within six industry subsectors defined by the North American Industrial Classification System ( NAICS ). Table III-1 The US Tugboat, Towboat, and Barge Industry Industry Definition NAICS Code NAICS Description Coverage Towing Services Coastal and Great Lakes Freight Transportation Tugboat Services Freight Transportation (partial) Towing Services Inland Water Freight Transportation Tugboat Services Freight Transportation (partial) Port and Harbor Operations Related Shore Jobs Marine Cargo Handling Related Shore Jobs Navigational Services to Shipping Other Support Activities for Water Transportation Towing Services Tugboat Services Related Shore Jobs Towing Services Tugboat Services Related Shore Jobs The bulk of the industry s operations can be found in two subsectors: NAICS (Coastal and Great Lakes Freight Transportation) and NAICS (Inland Water Freight Transportation). These subsectors include tugboat and towboat services as well as waterborne freight transportation. Because waterborne freight transportation includes transportation of freight by both barge and by self-propelled vessels, data from the 2012 Economic Census and the Army Corps of Engineers was used to allocate economic activity in these subsectors between the US tugboat, towboat, and barge industry and self-propelled vessels. 18 NAICS and NAICS also contain some tugboat and towboat services. Data from the 2012 Economic Census was used to allocate economic activity in these subsectors between the US tugboat, towboat, and barge industry and other industries. 18 See Appendix A for details. 22
31 NAICS , , , and also contain shore jobs related to the operation of vessels in the US tugboat, towboat, and barge industry. 19 For purposes of this study, the manufacture and repair of tugboats, towboats, and barges is excluded from the definition above and estimates of the industry s direct economic impact. Instead, economic activity related to the manufacture and repair of tugboats, towboats, and barges is counted as part of the industry s indirect impacts. National-Level Economic Contributions In 2014, the US tugboat, towboat, and barge industry generated revenues of $15.9 billion, directly employed 50,480 workers, and paid out $4.7 billion in compensation (including wages and salaries and benefits), an average of $93,835 per worker. The industry also contributed $9.0 billion to US gross domestic product (GDP) and invested nearly $2.2 billion in property, plant, and equipment, including its purchases of vessels. In addition to 50,480 direct jobs, the US tugboat, towboat, and barge industry supported an additional 251,070 indirect and induced jobs in other sectors of the economy, approximately 5.0 additional jobs for each direct job in the industry. In total, combining both operational and capital investment impacts, the US tugboat, towboat, and barge industry directly or indirectly supported 301,550 jobs in 2014 (see Table III-2). Counting direct, indirect, and induced impacts, the US tugboat, towboat, and barge industry s total impact on labor income (including proprietors income) was $19.4 billion. The industry s total (direct, indirect, and induced) impact on US GDP was $33.8 billion in See Appendix A for details on how related shore jobs were estimated. 23
32 Table III-2 (Direct, Indirect, and Induced) Economic Contributions of the US Tugboat, Towboat, and Barge Industry, 2014 Indirect and Induced Impacts Direct Capital Operational Impacts Investment Impact Impacts Impacts Employment a 50, ,500 30, ,550 Labor Income ($ millions) b 4,737 12,768 1,891 19,397 Value Added ($ millions) 8,954 21,969 2,847 33,771 Tax Impact ($ millions) c $1,173 $3,591 $464 $5,227 Source: PwC calculations using the IMPLAN modeling system (2013 database) and data from the US Bureau of Labor Statistics, the Census Bureau, and the Army Corps of Engineers. Note: Details may not add to totals due to rounding. a Employment is defined as the number of payroll and self-employed jobs, including part time jobs. b Labor income is defined as wages and salaries and benefits as well as proprietors' income. c Includes all types of taxes (other than personal taxes) borne and collected at the federal, state and local level. Nationwide, the US tugboat, towboat, and barge industry directly paid or collected nearly $1.2 billion in federal, state, and local taxes in 2014, including corporate income taxes, excise and sales taxes, and other taxes borne or collected by businesses. Including direct, indirect, and induced tax impacts, the US tugboat, towboat, and barge industry had a combined tax impact of more than $5.2 billion in Most of the indirect and induced economic impact of the US tugboat, towboat, and barge industry is associated with the industry s ongoing operations, as its capital expenditures account for approximately 12.0 percent of the industry s indirect and induced impact. The largest amount of indirect and induced economic activity associated with the industry occurs in the services sector of the economy, which accounts for nearly 45.0 percent of the operational impact, in terms of indirect and induced jobs (see Table III-3). 24
33 Table III-3 Indirect and Induced Economic Impacts of the US Tugboat, Towboat, and Barge Industry, by Receiving Industry, 2014 Sector Description Employment a Labor Income ($ million) b GDP ($ million) Direct Impact 50,480 $4,737 $8,954 Indirect and Induced Impact on Other Industries 251,070 $14,660 $24,816 Operational Impact 220,500 $12,768 $21,969 Agriculture 2,320 $90 $146 Mining 4,570 $664 $1,527 Utilities 940 $133 $449 Construction 2,690 $181 $216 Manufacturing 10,800 $868 $2,147 Wholesale and retail trade 28,200 $1,376 $2,428 Transportation and warehousing 19,310 $1,087 $1,637 Information 4,390 $489 $1,126 Finance, insurance, real estate, rental and leasing 29,530 $1,617 $4,513 Services 97,570 $4,775 $5,945 Government 20,180 $1,488 $1,835 Capital Investment Impact 30,570 $1,891 $2,847 Economic Impact 301,550 $19,397 $33,771 Source: PwC calculations using IMPLAN modeling system (2013 database) and data from the US Bureau of Labor Statistics the Census Bureau, and the Army Corps of Engineers. Numbers may not add to total due to rounding. a Employment is defined as the number of payroll and self-employed jobs, including part-time jobs. b Labor income is defined as wages and salaries and benefits as well as proprietors' income. The transportation and warehousing sector also is a significant supplier of services to the US tugboat, towboat, and barge industry, providing cargo handling, navigational services, warehousing, and vessel cleaning and repair services to the industry. State-Level Economic Contributions In 2014, the US tugboat, towboat, and barge industry was active in 38 states. The industry, however, had an impact on the economies of all 50 states plus the District of Columbia through its indirect and induced economic impacts. Figure III-1 provides the top ten states in terms of direct employment in the US tugboat, towboat, and barge industry in The total number of jobs directly attributable to the industry s operations (i.e., not counting any capital investment impacts) were highest in Louisiana (15,620 jobs), Texas (5,560 jobs), Kentucky (3,320 jobs), Florida (2,680 jobs), and New York (2,470 jobs). Combined these five states accounted for 58.7 percent of all employment in the US tugboat, towboat, and barge industry in
34 Figure III-1 Direct Employment in the US Tugboat, Towboat, and Barge Industry, Top 10 States in ,000 16,000 14,000 12,000 10,000 15,620 8,000 6,000 5,560 4,000 3,320 2,680 2,470 2,240 2,020 1,950 1,880 2,000 1,300 0 The industry s total impact by state varies based on the level of direct activity and the share of the industry s supply chain in each state. In 2014, the total number of jobs directly or indirectly attributable to the US tugboat, towboat, and barge industry were highest in Louisiana, Texas, Kentucky, California, and New York (see Figure III-2). Combined these five states accounted for nearly 47.7 percent of all employment attributable to the US tugboat, towboat, and barge industry in
35 Figure III-2 (Direct, Indirect, and Induced) Employment in the US Tugboat, Towboat, and Barge Industry, Top 10 States in ,000 50,000 52,810 40,000 30,000 30,550 20,000 15,340 15,310 15,150 14,210 13,300 11,320 7,920 6,880 10,000 0 The direct economic impact of the US tugboat, towboat, and barge industry is shown by state in Table III-4, below. The industry s total (direct, indirect, and induced) contribution is shown by state in Table III-5. Further detail on the industry s statelevel economic impacts are provided in Appendix B. 27
36 Table III-4. Direct Economic Contributions of the US Tugboat, Towboat, and Barge Industry by State, 2014 State Direct Employment a Direct Labor Income b Direct GDP Direct Taxes Borne & Jobs ($ Million) ($ Million) Collected Percent of U.S. Percent of U.S. Percent of U.S. ($ Million) Alabama % $ % $ % $19.0 Alaska % % % 10.4 Arkansas % % % 2.8 California 2, % % % 25.2 Connecticut % % % 8.3 Delaware % % % 1.3 Florida 2, % % % 49.4 Georgia % % % 4.1 Hawaii % % % 15.6 Idaho % % % 0.1 Illinois 1, % % % 36.8 Indiana % % % 60.8 Iowa % % % 7.3 Kentucky 3, % % % 79.1 Louisiana 15, % 1, % 2, % Maine % % % 1.8 Maryland 1, % % % 28.3 Massachusetts % % % 3.5 Michigan % % % 8.4 Minnesota % % % 3.8 Mississippi 1, % % % 32.8 Missouri % % % 15.7 New Hampshire % % % * New Jersey % % % 22.1 New York 2, % % % 89.3 North Carolina % % % 2.2 Ohio % % % 9.3 Oklahoma % % % 0.6 Oregon % % % 18.3 Pennsylvania % % % 14.2 Rhode Island % % % 1.5 South Carolina % % % 4.4 Tennessee 2, % % % Texas 5, % % % Virginia % % % 7.5 Washington 1, % % % 55.2 West Virginia % % % 12.9 Wisconsin % % % 0.9 U.S. 50, % $4, % $8, % $1,173 Source: PwC calculations using IMPLAN modeling system (2013 database) and data from the US Bureau of Labor Statistics, the Census Bureau, and the Army Corps of Engineers. Numbers may not add to total due to rounding. * Indicates less than $0.5 million. a Employment is defined as the number of payroll and self-employed jobs, including part-time jobs. b Labor income is defined as wages and salaries and benefits as well as proprietors' income. 28
37 Table III-5. Economic Contributions of the US Tugboat, Towboat, and Barge Industry by State, 2014 Employment a Labor Income b GDP Combined State Percent of Percent of Percent of Tax Impacts Amount ($ Million) ($ Million) US US US ($ Million) Alabama 3, % $ % $ % $56.0 Alaska 2, % % % 65.7 Arizona 1, % % % 29.0 Arkansas 1, % % % 17.9 California 15, % 1, % 1, % Colorado 1, % % % 34.5 Connecticut 2, % % % 47.2 Delaware % % % 8.5 District of Columbia % % % 7.7 Florida 14, % % 1, % Georgia 3, % % % 51.9 Hawaii 2, % % % 53.6 Idaho % % % 6.2 Illinois 11, % % 1, % Indiana 5, % % % Iowa 1, % % % 27.9 Kansas 1, % % % 15.4 Kentucky 15, % % 1, % Louisiana 52, % 3, % 5, % Maine % % % 10.7 Maryland 5, % % % Massachusetts 2, % % % 48.1 Michigan 3, % % % 60.9 Minnesota 2, % % % 39.8 Mississippi 5, % % % 89.8 Missouri 4, % % % 64.5 Montana % % % 5.0 Nebraska % % % 8.9 Nevada 1, % % % 18.2 New Hampshire % % % 7.1 New Jersey 5, % % % New Mexico % % % 13.1 New York 15, % 1, % 2, % North Carolina 3, % % % 50.7 North Dakota % % % 7.3 Ohio 5, % % % 82.3 Oklahoma 1, % % % 27.3 Oregon 3, % % % 53.3 Pennsylvania 6, % % % Rhode Island % % % 9.4 South Carolina 1, % % % 28.0 South Dakota % % % 4.0 Tennessee 13, % % 1, % Texas 30, % 2, % 4, % Utah % % % 13.9 Vermont % % % 3.2 Virginia 3, % % % 55.7 Washington 7, % % 1, % West Virginia 2, % % % 38.8 Wisconsin 2, % % % 28.6 Wyoming % % % 10.4 Operational 270, % $17, % $30, % $4,764 Capital Investment Impact 30,570 1, , U.S. 301,550 $19,397 2 $33,771 $5,227 Source: PwC calculations using IMPLAN modeling system (2013 database) and data from the US Bureau of Labor Statistics, the Census Bureau, and the Army Corps of Engineers. Numbers may not add to total due to rounding. a Employment is defined as the number of payroll and self-employed jobs, including part-time jobs. b Labor income is defined as wages and salaries and benefits as well as proprietors' income.
38 Other Benefits of the US Tugboat, Towboat, and Barge Industry 1
39 IV. Other Benefits of the US Tugboat, Towboat, and Barge Industry The US tugboat, towboat, and barge industry plays an important role in the movement of freight throughout the nation, moving nearly 785 million tons of freight in The industry is estimated to employ 50,480 workers across 38 states and support another 251,070 jobs in other sectors of the economy. The industry s total (direct, indirect, and induced) contribution to US GDP was $33.8 billion in In addition, the industry provides a number of other important benefits. As discussed below, studies show that the industry provides an efficient, low-cost method for transporting a broad range of commodities. Furthermore, a number of studies show that barge transport tends to be more fuel efficient and have a lower environmental footprint. One of the main advantages of barge traffic is its ability to move large volumes of cargo over long distances. Table IV-1 provides a comparison of the standard cargo capacities across freight transportation modes. A single dry cargo barge can haul 1,750 tons of cargo, the same amount of cargo as 16 bulk rail cars or 70 tractor trailers. Similarly, in order to move 27,500 bbl of liquid cargo it would take 144 tanker trucks or 46 rail cars, compared to a single barge. Table IV-1 Standard Cargo Capacity by Freight Transportation Mode Cargo Cargo Units Equal to 1 Barge Capacity Capacity Liquid Modal Freight Unit (in tons) (in bbl) Dry Cargo Cargo Tractor Trailer Bulk Rail Car Dry Cargo Barge* 1, Liquid (Tank) Barge* , Source: Adapted from Texas Transportation Institute, "A Modal Comparison of Domestic Freight Transportation Effects on the General Public: ," January 2017, Table ES-1 and Figure ES-1. The capacity advantage of barge transportation is even more apparent when you consider that towboats generally push a number of connected barges (known as a tow). A tow may consist of as few as 4 or 6 barges lashed together on smaller waterways to as many as 40 barges on the Mississippi. A 15-barge tow is common on larger rivers and waterways. To haul the same amount of dry cargo as a 15-barge tow (26,250 tons) would require 216 rail cars or 1,050 tractor trailers. 20 To put this in perspective, if all cargo transported by barge in 2014 had to be moved by rail it would require 7.1 million rail cars. 21 If this volume had to be moved by truck, it would require an 31.4 million tractor trailers 22, adding an additional burden to the already congested highway system. In fact, a recent study by the Texas Transportation 20 See 21 Estimated as million tons divided by an average of cargo capacity of 110 tons per rail car. 22 Estimated as million tons divided by an average of cargo capacity of 25 tons per tractor trailer. 30
40 Institute found that diversion of waterway freight traffic to the nation s highway system would add 1,046 trucks per day per lane to the typical rural interstate (an increase of nearly 84 percent). 23 Similarly, for 2014, the same study found that diverting waterway freight traffic to the nation s railways would increase the total tonnage of freight moved by rail by nearly 16 percent. Impact on Transportation Costs In part due to its ability to move large volumes of cargo, these studies have consistently found that the cost per ton mile of moving cargo by barge is lower than the cost for other modes of freight transportation (see Table IV-2 below). In all of the studies surveyed, barge/water freight transportation costs were lower than the cost to move freight by rail or highway. Most studies found transportation costs of 1-2 cents per ton mile for barges and cents per ton-mile for rail. Highway freight cost estimates are cents per ton mile. Not surprisingly, air freight was the most costly mode. 24 Table IV-2. Freight Transportation Costs for Alternative Modes [Cents per Ton-Mile] Source/ Description Transportation Mode Barge/ Water Rail Highway Air Washington State Department of Transportation (2016) n.a. TRC Consulting, Ltd (2013) - Cost for grain movements n.a. Florida Department of Transportation (2008) University of Missouri Columbia (2007) 1.0 to to to 13.9 n.a. Bureau of Transportation Statistics (2016) - Revenues per ton mile in Transportation Research Board (2002) n.a. R. Ballou (1998) Sources/Notes: Washington State Department of Transportation, "Wheat Supply Chain Data Collection," WA-RD 853.1, February See Table 2. TRC Consulting, Ltd, "Maintaining A Track Record of Success: Expanding Rail Infrastructure to Accommodate Growth in Agriculture and Other Sectors," January See Table 27 for the cost per ton-mile of a "typical" grain shipment. It is important to note that the lower bound estimate for the cost of rail transport was less than the upper bound estimate for the cost of barge transport. The cost per ton mile for truck transport was 15 cents for the first 25 miles and 6 to 7 cents per ton-mile there after. Florida Department of Transportation, "The Effect of Rising Fuel Costs on Goods Movement Mode Choice and Infrastructure Needs," October See Table 1. Fuel costs were similar for rail (0.89 cents per ton-mile) and water (0.84 cents per ton-mile), while other costs were significantly lower for waterborne freight transportation. Food and Agricultural Policy Research Institute at the University of Missouri Columbia, "Impact of a Lock Failure on Commodity Transportation on the Mississippi or Illinois Waterway," FAPRI-MU Report #30-07, September Ranges represent differential costs for various commodity groups. Bureau of Transportation Statistics, "National Transportation Statistics," Table 3-21 (updated January 2016) was the most recent year for which barge data were available. Since 2004, revenues per ton-mile have risen for the other modes to 4.05 cents per ton-mile for rail in 2013, for truck in 2007, and for air in Transportation Research Board, "Comparison of Inland Waterways and Surface Freight Modes," TR News 221, July-August R. Ballou, Business Logistics Management, 4th ed., Prentice Hall, Texas Transportation Institute, A Modal Comparison of Domestic Freight Transportation Effects on the General Public: , January It should be noted that barge transport is one component of the larger freight transportation network and is not available in all regions or states. According to the Army Corps of Engineers, the nation s inland waterway system is comprised of approximately 12,000 miles of navigable waterways servicing 38 states. 31
41 A recent study prepared by the University of Kentucky and University of Tennessee, compared transportation and related costs faced by current waterway users to the costs they would face if they were forced to use the next best transportation alternative (see Table IV-3 below). 25 Cost savings from transporting goods by water ranged from a low of 84 cents per ton (for miscellaneous commodities shipped from origins along the lower Mississippi River to destinations along the Gulf Intracoastal Waterway) to $56.18 per ton (for chemicals shipped from origins along the upper Mississippi River to destinations along the along the lower Mississippi River). 26 The study found that, on average, across all regions and commodities, the average cost saving from water transportation was $22.56 per ton. The University of Kentucky and University of Tennessee study concludes that the inland waterway system saved roughly $12.5 billion in transportation costs. Using data from the Army Corps of Engineers and Bureau of Transportation Statistics, the Texas Transportation Institute estimated that, in 2014, waterborne cargo transportation resulted in an average cost savings of $20 per ton, which translates to more than $12.0 billion of transportation cost savings. 27 These cost savings make possible lower costs for consumers. 25 University of Kentucky and University of Tennessee, Inland Navigation in the United States: An Evaluation of the Economic Impacts and the Potential Effects of Infrastructure Investment, November Iron and Steel shipped between destinations along the gulf intracoastal waterway had a negative cost saving, suggesting that it is more costly to ship this commodity by water within the region. 27 Texas Transportation Institute, A Modal Comparison of Domestic Freight Transportation Effects on the General Public: , February
42 Table IV-3. Cost Savings from Water Transportation, by Commodity [2012 Dollars per Ton Moved] Commodity Origin Upper Mississippi Lower Mississippi Fuel Efficiency and Greenhouse Gas Emissions Destination Barges compare favorably to other modes of freight transportation in terms of fuel efficiency and emissions. Table IV-4, provides estimates of the average energy usage by mode of freight transport. In 2012, the most recent year for which data were available, the amount of energy required to move one ton of freight one mile, was lowest for waterborne freight and highest for trucks. Over the 10-year period from 2002 to 2012, energy efficiency increased significantly in waterborne and rail freight, but decreased for truck freight transportation. Ohio Gulf Intracoastal Aggregates Upper Mississippi Lower Mississippi Ohio Gulf Intracoastal All Other Upper Mississippi Lower Mississippi Ohio Gulf Intracoastal Chemicals Upper Mississippi Lower Mississippi Ohio Gulf Intracoastal Coal & Coke Upper Mississippi Lower Mississippi Ohio Gulf Intracoastal Grains Upper Mississippi Lower Mississippi Ohio Gulf Intracoastal Iron & Steel Upper Mississippi Lower Mississippi Ohio Gulf Intracoastal Minerals & Ores Upper Mississippi Lower Mississippi Ohio Gulf Intracoastal Petroleum Fuels Upper Mississippi Lower Mississippi Ohio Gulf Intracoastal Source: University of Kentucky and University of Tennessee, Inland Navigation in the United States: An Evaluation of the Economic Impacts and the Potential Effects of Infrastructure Investment, November See Table
43 Table IV-4. Average Energy Usage in Freight Transportation, by Mode [BTU per Ton-Mile] Water Rail Truck , , ,785 A large part of energy consumption in the transportation sector are fuels. Figure IV-1 provides fuel efficiency comparisons for inland towing, freight railroads, and freight trucks for Figure IV-1. Average Fuel Efficiencies for Freight Transportation by Mode, 2014 [Ton-Miles per Gallon] Source: Transportation Energy Data Book, Edition 35, October 2016 (Table 2-17). Truck numbers converted from BTU per vehicle mile using the ratio of vehiclemiles to ton-miles Ton-Miles per Gallon Inland Towing Freight Railroads Freight Trucks Source: Texas Transportation Institute, "A Modal Comparison of Domestic Freight Transportation Effects of the General Public: ," January 2017, Figure ES-4. The US tugboat, towboat, and barge industry provides a fuel efficient means for transporting freight. For 2014, inland towing was able to move one ton of freight 647 miles on a single gallon of fuel, compared to 477 miles for freight railroads and just 145 miles for freight trucks. As a result of better fuel efficiency, barge transport has lower greenhouse gas emissions than other forms of freight transportation (see Figure IV-2). 34
44 Figure IV-2. Greenhouse Gas Emissions of Freight Transportation by Mode, 2014 [Metric Tons per Million Ton Mile] Inland Towing Freight Railroads Freight Trucks Source: Texas Transportation Institute, "A Modal Comparison of Domestic Freight Transportation Effects of the General Public: ," January Inland towing provides the lowest emissions per ton mile for five key pollutants (see Table IV-5). 28 For example, inland towing emitted 15.6 grams of carbon dioxide (CO2) per ton-mile in 2014, compared to 21.2 grams for freight rail and grams for trucks. Furthermore, emissions have been declining. Between 2005 and 2014, CO2 emissions declined by nearly 11 percent for inland towing and by 13 percent for freight rail. CO2 emissions for freight trucking declined by 10.0 percent between 2005 and Early studies have found a similar pattern of emissions. For example, see: Transportation Research Board, Comparison of Inland Waterways and Surface Freight Modes, TR News 221, July-August 2002 and Table 4 in Government Accountability Office, Surface Freight Transportation: A Comparison of the Costs of Road, Rail, and Waterways Freight Shipments That Are Not Passed on to Consumers, GAO , January See Table ES-3 in the Texas Transportation Institute Report. 35
45 Table IV-5. Detail on Emissions by Freight Transportation Mode, 2014 [Grams per Ton-Mile] Mode Safety Impacts Hydro- Carbons* Carbon Monoxide Carbon Dioxide Nitrous Oxide As compared to waterborne freight, over the period, the injury rate per million ton miles was 81 times higher for freight rail and 696 times higher for freight truck (see Table IV-6). Over the same period, as compared to waterborne freight, the fatality rate per million ton miles was 8 times higher for freight railroad, and 30 times higher for freight truck. Table IV-6. Injury and Fatality Rates by Mode of Freight Transportation, [per Million Ton-Miles] PM-10** Inland towing Freight railroad Freight trucks Source: Texas Transportation Institute, "A Modal Comparison of Domestic Freight Transportation Effects on the General Public: ," January 2017, Table 8. *Volatile Organic Compounds (VOC) are reported for trucks. **PM-10 stands for Particulate Matter of diameter 10 micrometers or less. Annual Average Ton-Miles (billions) Average Annual Injuries Injury Rate per Billion Ton-Miles Freight Truck 2, , Freight Railroad 1,678 7, Waterborne Freight Annual Average Ton-Miles (Billions) Average Annual Fatalities Fatality Rate per Billion Ton-Miles Freight Truck 2,552 4, Freight Railroad 1, Waterborne Freight Source: PwC calculations based on data from Texas Transportation Institute, "A Modal Comparison of Domestic Freight Transportation Effects on the General Public: ," January
46 Appendix A: Methodology and Data Sources
47 Appendix A: Methodology and Data Sources This appendix describes the methodology and data sources used to derive the direct, indirect, and induced contributions of the US tugboat, towboat, and barge industry. It first describes the data sources used to develop estimates of the industry s direct employment and employee compensation. It then describes PwC s approach to estimating the remaining direct impacts as well as the industry s indirect and induced impacts. Direct Impacts As described in Section III of this report, for purposes of quantifying the industry s economic contributions, the US tugboat, towboat, and barge industry is defined based on the North American Industrial Classification System (NAICS) and includes employment from six separate NAICS subsectors: 1. NAICS Coastal and Great Lakes Freight Transportation, 2. NAICS Inland Water Freight Transportation, 3. NAICS Port and Harbor Operations, 4. NAICS Marine Cargo Handling, 5. NAICS Navigational Services to Shipping, and 6. NAICS Other Support Activities for Water Transportation. While each of these industries includes tugboat and towboat services (including related shore jobs), they all contain other economic activities as well. For example, NAICS codes and include transportation of freight by barge and containership, while NAICS codes and include marine salvaging services, radio beacon services, routine maintenance and repairs of ships, and drydock services. Shore jobs related to the operation of vessels other than tugboats and towboats also are included in NAICS sectors , , , and Vessel Direct Impacts: PwC collected data on employment and compensation in each of these industries from the US Bureau of Labor Statistics Quarterly Census of Employment and Wages. Information was obtained for the United States and each of the 50 states and the District of Columbia. In some cases, the count of employees was suppressed because of the small number of establishments in an industry in a given state. Relying on employment counts available for the industry at the national-level and for higher-level industries at the state-level, a two-stage "raking" process was used to estimate the state-level employee count. The raking process uses information from known sectors within a state and across states to impute information for the sectors with suppressed data. 30 A similar process was used to fill in missing values for employee compensation. Employee compensation was adjusted to include fringe benefits using data from the US Bureau of Economic Analysis. 30 Oh, H.L. and Scheuren, F. (1987). Modified Raking Ratio Estimation. Survey Methodology, vol. 13, no. 2, pp A-1
48 To estimate the portion of the employment in each of these industries that is tugboat, towboat, or barge employment, PwC used data on revenues by line of business from the 2012 Economic Census. Employment in a given NAICS industry and state were allocated between freight transportation, tug and towboat services, and other employment based on each business line s share of industry revenues. Freight transportation was allocated between international and domestic trade and between barge and containership using data from the Army Corps of Engineers. Domestic barge freight jobs were added to jobs related to tug and towboat services to derive our estimate of direct employment. Employee compensation for tugboats, towboats, and barges was estimated by applying the industry-wide compensation per employee to direct employment on tugboats, towboats, and barges. A final adjustment was made to assure consistency with data from the Army Corps of Engineers. Value added (i.e., GDP) was then estimated by allocating GDP for the water transportation sector within a state, as reported by the U.S. Bureau of Economic Analysis (BEA), to the US tugboat, towboat, and barge industry based on the industry s share of direct labor income in the water transportation sector. Taxes borne and collected by the industry were estimated using the IMPLAN model (described below). Taxes borne are taxes that are charged to the company, such as corporate income and property taxes. Taxes collected are taxes and fees that the company collects and administers on behalf of the government, such as employer s withholding of the employee share of payroll taxes individual income taxes, where the company is not the intended object of taxation. For purposes of this study, all federal, state, and local taxes (other than personal taxes 31 ) borne or collected by the industry are included. The analysis excludes personal income taxes on labor income earned by employees of the industry and its supply chain, as well as personal income taxes on business income earned by business owners in the industry and its supply chain. Related Shore Jobs and Associated Direct Impacts: As discussed below, the IMPLAN model was used to estimate indirect impacts associated with the industry s vessel operations including shore jobs. The portion of the indirect impacts that are attributable to the industry s shore jobs was estimated based on revenue data from (1) the Census Bureau s Service Annual Survey and (2) freight data from the Army Corp of Engineers. Indirect impacts from related shore jobs were then reclassified as direct impacts rather than indirect impacts. (This does not affect the number of jobs associated with the industry, only their classification as direct vs. indirect.) Capital Impacts To quantify the US tugboat, towboat, and barge industry s capital investment impact, PwC obtained data on the industry s purchases on new vessels in 2014 from the US 31 Personal taxes excluded include federal and state personal income taxes, including employer withholdings and personal income tax on business income, estate and gift taxes, state and local property taxes, motor vehicle licenses and other taxes and licenses paid by individuals. A-2
49 Maritime Administration and the average cost per vessel type from industry sources. Based on this information, PwC estimates that the industry spent nearly $2.2 billion on new vessels in Additional data from the Census Bureau was used to check the reasonableness of this estimate. 32 For the impact analysis, capital spending was mapped into purchases of capital assets by type through the use of the so-called capital flow matrix from the BEA. Indirect and Induced Impacts Estimates of the indirect and induced economic impacts of the US tugboat, towboat, and barge industry were derived using IMPLAN models for the US as a whole and for each of the 50 states and the District of Columbia. The IMPLAN model is built around an input-output table that relates the purchases that each industry has made from other industries to the value of the output of each industry. 33 To meet the demand for goods and services from an industry, purchases are made in other industries according to the patterns recorded in the input-output table. These purchases in turn lead to still more purchases by the industry s suppliers, and so on. Additionally, employees and business owners make personal purchases out of the additional income that is generated by this process, sending additional demands rippling through the economy. Multipliers describe these iterations. The Type I multiplier measures the direct and indirect effects of a change in economic activity. It captures the supply chain effects only, i.e., industries buying from other local industries. The Type II (Social Accounting Matrix or SAM) multiplier captures the direct and indirect effects and, in addition, induced effects (i.e., changes in spending by households as income increases or decreases due to the changes in production). The indirect and induced impacts by the US tugboat, towboat, and barge industry on other sectors of the economy in terms of employment, labor income, value added, and taxes were calculated through the multiplier process built into the model. 34 IMPLAN state models capture only the indirect and induced effects within that state and exclude the indirect and induced effects crossing state borders ( cross-state spillover effects ). PwC estimated and allocated the cross-state indirect and induced employment, labor income, and value added impacts for each industry across the 50 states and the District of Columbia in proportion to each state s share of national employment, labor income, and value added in each industry, respectively. 32 Data from the Annual Survey of Manufacturers indicates that US shipbuilders delivered $3.5 billion of nonpropelled vessels and platforms during This number includes exports. 33 For more information on the IMPLAN model see 34 Adjustments are made to the initial indirect and induced impact estimates to prevent doublecounting. A-3
50 Appendix B: Detail on State-Level Economic Contributions
51 Appendix B: Detail on State-Level Economic Contributions Table B-1, below, provides a state-by-state breakout of industry revenues. Tables B-2, B-3, and B-4 provide additional state-by-state detail on the direct, indirect, and induced impacts associated with the operations of the US tugboat, towboat, and barge industry. operational impacts by state exclude capital investment impacts due to the non-availability of state-level data. Table B-5 provides additional detail on the industry s combined tax impact by state. B-1
52 Table B-1. US Tugboat, Towboat, and Barge Industry Revenues, 2014 State Amount ($ millions) Alabama $179.2 Alaska Arizona - Arkansas 19.2 California Colorado - Connecticut Delaware 17.5 District of Columbia - Florida Georgia 54.9 Hawaii Idaho 6.8 Illinois Indiana Iowa 78.0 Kansas - Kentucky 1,371.3 Louisiana 4,582.7 Maine 26.6 Maryland Massachusetts 75.3 Michigan 84.8 Minnesota 50.2 Mississippi Missouri Montana - Nebraska - Nevada - New Hampshire 6.1 New Jersey New Mexico - New York North Carolina 37.0 North Dakota - Ohio Oklahoma 1.6 Oregon Pennsylvania Rhode Island 17.8 South Carolina 53.6 South Dakota - Tennessee 1,067.9 Texas 1,689.1 Utah - Vermont - Virginia 91.4 Washington West Virginia Wisconsin 13.6 Wyoming - US $15,935 Source: PwC estimates based on data from the US Census Bureau, IMPLAN, and the Army Corps of Engineers. B-2
53 Table B-2. Employment Associated with the US Tugboat, Towboat, and Barge Industry s Operations, 2014 State Direct Indirect Induced Employment Employment Employment Contribution Alabama 530 1,320 1,300 3,150 Alaska ,040 Arizona ,130 1,850 Arkansas ,080 California 2,020 4,950 8,340 15,310 Colorado ,090 1,890 Connecticut 340 1,050 1,150 2,540 Delaware District of Columbia Florida 2,680 5,330 6,190 14,210 Georgia 380 1,200 2,010 3,590 Hawaii 540 1, ,480 Idaho Illinois 1,950 4,580 4,790 11,320 Indiana 930 2,540 2,410 5,880 Iowa ,810 Kansas ,010 Kentucky 3,320 7,260 4,760 15,340 Louisiana 15,620 21,370 15,820 52,810 Maine Maryland 1,230 2,340 2,240 5,810 Massachusetts 200 1,120 1,620 2,940 Michigan 260 1,510 2,040 3,800 Minnesota ,410 2,490 Mississippi 1,300 2,590 1,650 5,530 Missouri 750 1,760 1,950 4,460 Montana Nebraska Nevada ,080 New Hampshire New Jersey 920 1,810 2,420 5,150 New Mexico New York 2,470 6,080 6,590 15,150 North Carolina 220 1,000 1,870 3,090 North Dakota Ohio 480 2,020 2,710 5,200 Oklahoma ,390 Oregon 700 1,260 1,440 3,390 Pennsylvania 950 2,600 3,330 6,880 Rhode Island South Carolina ,940 South Dakota Tennessee 2,240 6,450 4,610 13,300 Texas 5,560 13,190 11,800 30,550 Utah Vermont Virginia 640 1,090 1,810 3,540 Washington 1,880 2,930 3,120 7,920 West Virginia 480 1, ,280 Wisconsin ,240 2,060 Wyoming U.S. 50, , , ,980 Source: PwC calculations using IMPLAN modeling system (2013 database) and data from the US Bureau of Labor Statistics, the Census Bureau, and the Army Corps of Engineers. Numbers may not add to total due to rounding. Employment is defined as the number of payroll and self-employed jobs, including part-time jobs. B-3
54 Table B-3. Labor Income Associated with the US Tugboat, Towboat, and Barge Industry s Operations, 2014 [in $ Millions] State Direct Labor Indirect Labor Induced Income Income Labor Income Contribution Alabama $48.9 $69.3 $54.8 $173.0 Alaska Arizona Arkansas California ,115.8 Colorado Connecticut Delaware District of Columbia Florida Georgia Hawaii Idaho Illinois Indiana Iowa Kansas Kentucky Louisiana 1, , ,355.5 Maine Maryland Massachusetts Michigan Minnesota Mississippi Missouri Montana Nebraska Nevada New Hampshire New Jersey New Mexico New York ,303.4 North Carolina North Dakota Ohio Oklahoma Oregon Pennsylvania Rhode Island South Carolina South Dakota Tennessee Texas , ,170.5 Utah Vermont Virginia Washington West Virginia Wisconsin Wyoming U.S. $4,737 $7,231 $5,537 $17,505 Source: PwC calculations using IMPLAN modeling system (2013 database) and data from the US Bureau of Labor Statistics, the Census Bureau, and the Army Corps of Engineers. Numbers may not add to total due to rounding. Labor income includes wages and salaries and benefits as well as proprietors' income. B-4
55 Table B-4. GDP Associated with the US Tugboat, Towboat, and Barge Industry s Operations, 2014 [in $ Millions] State Direct GDP Indirect GDP Induced GDP Contribution Alabama $100.9 $128.9 $97.7 $327.6 Alaska Arizona Arkansas California ,925.8 Colorado Connecticut Delaware District of Columbia Florida ,391.5 Georgia Hawaii Idaho Illinois ,246.8 Indiana Iowa Kansas Kentucky ,532.3 Louisiana 2, , , ,900.3 Maine Maryland Massachusetts Michigan Minnesota Mississippi Missouri Montana Nebraska Nevada New Hampshire New Jersey New Mexico New York ,176.5 North Carolina North Dakota Ohio Oklahoma Oregon Pennsylvania Rhode Island South Carolina South Dakota Tennessee ,394.7 Texas , , ,002.7 Utah Vermont Virginia Washington ,005.5 West Virginia Wisconsin Wyoming U.S. $8,954 $12,388 $9,581 $30,924 Source: PwC calculations using IMPLAN modeling system (2013 database) and data from the US Bureau of Labor Statistics, the Census Bureau, and the Army Corps of Engineers. Numbers may not add to total due to rounding. B-5
56 Table B-5. Combined Tax Impact Associated with the US Tugboat, Towboat, and Barge Industry s Operations, 2014 [in $ Millions] Direct Taxes Indirect Taxes Induced Taxes Combined Tax State Paid Supported Supported Impact Borne Collected Borne Collected Borne Collected Borne Collected Alabama $11.4 $7.7 $11.2 $8.1 $8.1 $9.5 $30.7 $25.3 Alaska Arizona Arkansas California Colorado Connecticut Delaware District of Columbia Florida Georgia Hawaii Idaho Illinois Indiana Iowa Kansas Kentucky Louisiana Maine Maryland Massachusetts Michigan Minnesota Mississippi Missouri Montana Nebraska Nevada New Hampshire * * New Jersey New Mexico New York North Carolina North Dakota Ohio Oklahoma Oregon Pennsylvania Rhode Island South Carolina South Dakota Tennessee Texas Utah Vermont Virginia Washington West Virginia Wisconsin Wyoming US , ,827 1,936 Source: PwC calculations using the IMPLAN modeling system (2013 database). * Indicates less than $0.5 million. B-6
57 Appendix C: Detail on Waterborne Commerce in the United States
58 Appendix C: Detail on Waterborne Commerce in the United States The US Tugboat, Towboat, and Barge Industry in the US-Flagged Fleet The US-flagged fleet declined by 2.3 percent between 2005 and 2014, a decline of nearly 950 vessels (see Table C-1). Over the same period, the number of tugboats and towboats increased by 3.5 percent. The total number of barges declined by 3.1 percent, but the number of tank barges increased by 17.3 percent (718 vessels), more than any other vessel type. Table C-1. Summary of the U.S. Flag Vessels by Vessel Type, 2005 and 2014 Type of Vessels Percent Change Self-Propelled * 8,968 9, % Tugboats and Towboats 5,290 5, % Tankers % Offshore Support Vessels 1,768 1, % Passenger Vessels % Dry Bulk Cargo Vessels % Containerships % General Cargo Vessels % Specialized Vessels % Non-Self-Propelled 32,052 31, % Dry Cargo Barges 27,876 26, % Tank Barges 4,151 4, % Railroad Car Floats % Grand * 41,028 40, % * Detail does not add to total due to unclassified vehicles. Sources: Army Corps of Engineers, Wareborne Transportation Lines of the United States, Volume 1 - National Summaries, Table 1, various years. The US tugboat, towboat, and barge industry accounted for 91 percent of the USflagged fleet in 2014 (see Figure C-1). Barges accounted for nearly 85 percent of the US-flagged fleet s cargo capacity in that same year (see Figure C-2). C-1


59 Figure C-1. Summary of the US-Flagged Fleet by Vessel Type, 2014 Figure C-2. Cargo Capacity of the US-Flagged Fleet by Vessel Type, 2014 C-2
 between 2005 and 2014 (see Table C-2). Domestic trade by barge declined by 3.5 percent over the same period, compared to 8.9 percent for all domestic waterborne trade.")

60 The US Tugboat and Towboat Industry in US Waterborne Commerce Measured by total tons, the combined international and domestic waterborne commerce of the United States declined by 182 million tons (or 7.2 percent) between 2005 and 2014 (see Table C-2). Domestic trade by barge declined by 3.5 percent over the same period, compared to 8.9 percent for all domestic waterborne trade. The share of domestic waterborne commerce transported by barge increased from 79 percent in 2005 to nearly 84 percent in Table C-2. Foreign and Domestic Waterborne Commerce, [millions of short tons] Year Freight Traffic Foreign Trade Domestic Trade All Vessels Barges Percent by Barge , , , % , , , % , , , % , , % , , % , , % , , % , , % , , % , , % % Change -7.2% -6.0% -8.9% -3.5% Source: PwC estimates based on data from The Army Corp. of Engineers, Waterborne Commerce of the United States, Part 5 - National Summaries, Tables 1-5, 1-6, 1-8, and 1-12 (various years). Figure C-3. US Waterborne Commerce by Type, 2014 C-3


61 75 percent (592 million tons) of domestic barge commerce is conducted on inland waterways (see Figure C-4). Coastwise barge traffic amounted to 101 million tons in 2014, 13 percent of all barge traffic. Figure C-4. US Barge Traffic by Type, 2014 Source: Army Corps of Engineers, Waterborne Commerce of the United States, Part 5 National Summaries, 2014, Table 1-3. By volume, petroleum and petroleum products represent the largest commodity group moved on US waterways. In 2014, 338 million tons of petroleum and petroleum products were shipped between US ports, 82.4 percent (279 million tons) of which was transported by barge (see Table C-3). Coal was the second largest commodity group transported on US waterways with 189 million tons moved (170 million tons or 90 percent transported by barge). Crude materials, including lumber, stone, and various metal ores, was the only other commodity group with more than 100 million tons moved between US ports in million tons of crude materials were transported by barge in 2014, 69 percent of all crude materials moved by water in the US. Key industries served by the US tugboat, towboat, and barge industry include: coal mining (166.4 million tons moved by barge), gasoline and fuel refineries (159.2 million tons), oil and gas extraction (71.9 million tons), sand and gravel quarrying (46.2 million tons), Corn farming (35.2 million tons), limestone quarrying (32.7 million tons), and soybean farming (29.3 million tons). C-4
Inland Waterway Navigation
 Inland Waterway Navigation Value of Inland Navigation As the sun rises over the Mississippi River a 15-barge tow slides slowly past the St. Louis Harbor and heads south to New Orleans where its cargo of
State Five Year Tonnage Trend. Shipping Tons Receving Tons Within Tons Total Tons
 U.S. ARMY CORPS OF ENGINEERS BUILDING STRONG 2015 State Quick Facts (Tons in Millions) Tons Shipped - 234.4 Tons Received - 201.9 Tons Shipped Within State - 74.7 Total Commerical Docks - 430 Total Value
Economic Impact Study
 Economic Impact Study U.S.- Based Scrap Recycling Industry 2017 Prepared for the Institute for Scrap Recycling Industries, Inc. Executive Summary Scrap recycling is a major U.S.-based industry dedicated
THE AMERICAN WATERWAYS OPERATORS ABOUT US
 THE AMERICAN WATERWAYS OPERATORS ABOUT US JOBS AND THE ECONOMY The American Waterways Operators is the national advocate for the U.S. tugboat, towboat and barge industry, which serves the nation as the
2012 Distribution Best Practices Benchmarking Company Profile Data Packet
 American Gas Association January 2012 Company Name: DOT Operating ID(s): Person Completing Form: Phone Number: Email Address: Required Fields Deadline for data submittal in BESS, http://www.aga.org/research/bess/
THE 2016 NATIONAL ECONOMIC IMPACT OF IMPORTED IRON AND STEEL PRODUCTS ON THE U.S. MARINE TRANSPORTATION SYSTEM AND THE U.S.
 THE 2016 NATIONAL ECONOMIC IMPACT OF IMPORTED IRON AND STEEL PRODUCTS ON THE U.S. MARINE TRANSPORTATION SYSTEM AND THE U.S. ECONOMY Prepared for: American Institute for International Steel 1101 King Street
Knowledge Exchange Report
 Knowledge Exchange Report February 2016 The Economic Impact of a Minimum Wage Increase on New York State Agriculture New York State is considering a minimum wage increase from $9.00 to $15.00 statewide.
Chapter TRI Data and Trends (Original Industries Only)
") Chapter 3 1999 TRI Data and 1995 1999 Trends (Original Industries Only) Chapter 3 1999 TRI Data and 1995 1999 Trends (Original Industries Only) INTRODUCTION This chapter summarizes information reported
Chapter 3 1999 TRI Data and 1995 1999 Trends (Original Industries Only) Chapter 3 1999 TRI Data and 1995 1999 Trends (Original Industries Only) INTRODUCTION This chapter summarizes information reported
State Five Year Tonnage Trend. Shipping Tons Receving Tons Within Tons Total Tons
 U.S. ARMY CORPS OF ENGINEERS BUILDING STRONG 2015 State Quick Facts (Tons in Millions) Tons Shipped - 27.3 Tons Received - 6.7 Tons Shipped Within State - 4.9 Total Commerical Docks - 200 Total Value (billions)-
Missouri Freight Transportation Economy on the Move. Waterway Freight. Missouri Economic Research and Information Center
 Missouri Freight Transportation Economy on the Move Waterway Freight Waterway Industry Missouri is home to 14 public Port Authorities and over 200 private ports operating on over 1,000 miles of waterways
Marine Cargo Handling
 Marine Cargo Handling Industry Snapshot Emsi Q3 2018 Data Set August 2018 Georgia Power 75 Fi h Street NW Suite 175 Atlanta, Georgia 30308 404.506.2226 Emsi Q3 2018 Data Set www.economicmodeling.com Page
HOW BIG IS AFRICA? Rules. recommended grades: 3-6
 AFRICA HOW BIG IS AFRICA? recommended grades: 3-6 time needed: 25 MINUTES Description Students develop a sense of scale by using their bodies and other tools to measure the length and width of Africa.
Waterways 1 Water Transportation History
 Waterways 1 Water Transportation History Water Transportation Propulsion History Human (oars, poles) - - 7,000-10,000 BC Wind (sails) - - 3,000 BC Steamboat invented - - 1787 AD First diesel-powered ship
The Pyrogeographyof Wildfires in the Western U.S.
 The Pyrogeographyof Wildfires in the Western U.S. Dr. Michael Medler 1 2 3 4 The pumps buy you time, but minutes only. From this moment, no matter what we do, Titanic will founder. But this ship can't
Industrial Energy Efficiency as a Resource by Region
 Industrial Energy Efficiency as a Resource by Region Garrett Shields and Robert D. Naranjo, BCS Incorporated Sandy Glatt, U.S. Department of Energy ABSTRACT The energy intensity of specific manufacturing
Fatal Occupational Injuries in Maine, 2008
 MAINE DEPARTMENT OF LABOR Fatal Occupational Injuries in Maine, 2008 An Annual Report September 2009 By: Ann Beaulieu D EPARTMENT OF L ABOR B UREAU OF L ABOR STANDARDS 45 STATE HOUSE STATION AUGUSTA, MAINE
AAPA Facilities Engineering Seminar & Expo
 AAPA Facilities Engineering Seminar & Expo Wade M. Battles New Orleans Nov 9, 2011 Opportunities for Port Growth Through Marine Highway Development ATKINS Who we are Global, full-service professional planning,
Accelerating Energy Efficiency in Texas
 Accelerating Energy Efficiency in Texas Southwest Partnership for Energy Efficiency As a Resource Houston, Texas August 5, 2014 Jim Lazar RAP Senior Advisor The Regulatory Assistance Project 50 State Street,
Asphalt Pavement Mix Production Survey On Reclaimed Asphalt Pavement, Reclaimed Asphalt Shingles, And Warm-mix Asphalt Usage:
 Asphalt Pavement Mix Production Survey On Reclaimed Asphalt Pavement, Reclaimed Asphalt Shingles, And Warm-mix Asphalt Usage: 2009-2010 Appendix A Purpose The National Asphalt Pavement Association is working
Farm Radio Habits Wave 1, Winter Conducted by Millennium Research, Inc.
 Farm Radio Habits Wave 1, Winter 2015 Conducted by Millennium Research, Inc. TAKE A PICTURE OF THE RADIO YOU LISTEN TO THE MOST OFTEN? 2 Radio Is An Important Part Of Farmers And Ranchers Day I started
The American Clean Energy Security Act (ACES) Creates More American Jobs and Saves Americans Money
 Creates More American Jobs and Saves Americans Money") The American Clean Energy Security Act (ACES) Creates More American Jobs and Saves Americans Money State-by-state figures on job creation, electric bill reductions, and transportation savings from the
The American Clean Energy Security Act (ACES) Creates More American Jobs and Saves Americans Money State-by-state figures on job creation, electric bill reductions, and transportation savings from the
Watershed Condition Framework
 US Forest Service - Watershed Condition Classification Maps http://www.fs.fed.us/publications/watershed/ Page 1 of 2 1/9/2013 Watershed Condition Framework The Forest Service has released the first national
UNDERSTANDING THE GLOBAL IMPACT OF INCREASED WATERWAY COMMERCE. Bruce Lambert Executive Director, Institute for Trade and Transportation Studies
 UNDERSTANDING THE GLOBAL IMPACT OF INCREASED WATERWAY COMMERCE Bruce Lambert Executive Director, Institute for Trade and Transportation Studies Does Waterway Commerce: Improve system efficiency Encourage
APPENDIX B COMMODITY FLOWS NOVEMBER 2018 DRAFT
 APPENDIX B COMMODITY FLOWS NOVEMBER 2018 DRAFT 2 CURRENT COMMODITY FLOWS IN THE BIRMINGHAM REGION A commodity flow analysis for a region allows for an understanding of which commodities generate a significant
Methodology. Respondents. Survey Process
 Methodology The 2011 ABA Compensation & Benefits Survey was designed to meet the needs of banks across the nation. The survey was administered by enetrix, A Division of Gallup, Inc., and an invitation
Knowledge Exchange Report. Economic Impact of Mandatory Overtime on New York State Agriculture
 Farm Credit East Knowledge Exchange Report September, 2014 Economic Impact of Mandatory Overtime on New York State Agriculture The New York State Legislature and Governor Andrew Cuomo are considering legislation
total 2011 tonnage. The total value of Illinois domestic internal commodity movements was over $21.2 billion.
 Illinois The state of Illinois borders or contains over 1,000 miles of the inland waterway system. The state s western border is defined by 580 miles of the upper River. The Illinois Waterway flows for
THE 2016 NATIONAL ECONOMIC IMPACT OF IMPORTED IRON AND STEEL PRODUCTS ON THE U.S. MARINE TRANSPORTATION SYSTEM AND THE U.S. ECONOMY: EXECUTIVE SUMMARY
 THE 2016 NATIONAL ECONOMIC IMPACT OF IMPORTED IRON AND STEEL PRODUCTS ON THE U.S. MARINE TRANSPORTATION SYSTEM AND THE U.S. ECONOMY: EXECUTIVE SUMMARY Conducted by Martin Associates www.martinassoc.net
ANNEX E: Methodology for Estimating CH 4 Emissions from Coal Mining
 1 1 1 1 1 1 1 1 0 1 0 1 ANNEX E: Methodology for Estimating CH Emissions from Coal Mining The methodology for estimating methane emissions from coal mining consists of two distinct steps. The first step
How Much Do Exports Matter?
 Evaluating the Economic Contributions of U.S. Grain Exports on State and Congressional District Economies Prepared For: April 2016 Table of Contents I. EXECUTIVE SUMMARY... 1 II. INTRODUCTION... 2 III.
Pollution Control Exemptions for Pipelines
 Pollution Control Exemptions for Pipelines Greg Wood Ryan, LLC Atlanta, Georgia 30303 Greg.Wood@Ryan.com (919) 219-5605 Keith Fuqua Colonial Pipeline Company Alpharetta, Georgia 30009 kfuqua@colpipe.com
Idaho s Forest Products Business Sector:
 Policy Analysis Group College of Natural Resources Report No. 26 August 2006 Idaho s Forest Products Business Sector: Jobs, Wages and Salaries, Direct and Indirect Effects Linkages, Multipliers, and Economic
https://aba2.issi.net/team/admin/wizard/survey/loadinstance.asp?formid=208&instanc...
 https://aba2.issi.net/team/admin/wizard/survey/loadinstance.asp?formid=208&instanc... Page 1 of 1 Print Last edited by Vicki Osman on Mar 28 2016 8:54AM Marketplace 2017 Associate Profile Page 1/1 Please
CALCULATING THE SUPPLEMENTAL NUTRITION ASSISTANCE PROGRAM (SNAP) PROGRAM ACCESS INDEX: A STEP-BY-STEP GUIDE FOR 2015
 PROGRAM ACCESS INDEX: A STEP-BY-STEP GUIDE FOR 2015") Food and Nutrition Service January 2017 CALCULATING THE SUPPLEMENTAL NUTRITION ASSISTANCE PROGRAM (SNAP) PROGRAM ACCESS INDEX: A STEP-BY-STEP GUIDE FOR 2015 Introduction The Program Access Index (PAI)
Food and Nutrition Service January 2017 CALCULATING THE SUPPLEMENTAL NUTRITION ASSISTANCE PROGRAM (SNAP) PROGRAM ACCESS INDEX: A STEP-BY-STEP GUIDE FOR 2015 Introduction The Program Access Index (PAI)
Presentation to 2017 Annual Alabama Water Resources Conference. By: Larry Merrihew, Presdent Warrior-Tombigbee Waterway Association
 Presentation to 2017 Annual Alabama Water Resources Conference By: Larry Merrihew, Presdent Warrior-Tombigbee Waterway Association Alabama s Inland Navigable Waterways Alabama River Apalachicola Chattahoochee
General Manager: Front Desk Manager: Front Desk/Shift Supervisor: Housekeeping or Environmental Services Manager: Housekeeping Supervisor/Inspector:
 1 Report Summary WageWatch, Inc. has partnered with AAHOA to provide its members with a Hospitality Salary Survey Report for limited/select service hotels twice a year. This is the first report and is
Legislative Trends: Upcoming Increases to Minimum Wage Round-up 2018
 Legislative Trends: Upcoming Increases to Minimum Wage Round-up 2018 While the last federal minimum wage increase was on July 24, 2009, when it rose from $6.55 to $7.25 per hour, many state and local governments
ENERGY STAR Oil Furnaces Product List
 ENERGY STAR Oil Furnaces Product List Below are currently qualified ENERGY STAR models available for sale in the U.S. and Canada * Air Leakage data was not collected under the Version 3.0 ENERGY STAR Program
CALCULATING THE SUPPLEMENTAL NUTRITION ASSISTANCE PROGRAM (SNAP) PROGRAM ACCESS INDEX: A STEP-BY-STEP GUIDE FOR 2013
 PROGRAM ACCESS INDEX: A STEP-BY-STEP GUIDE FOR 2013") Food and Nutrition Service January 2015 CALCULATING THE SUPPLEMENTAL NUTRITION ASSISTANCE PROGRAM (SNAP) PROGRAM ACCESS INDEX: A STEP-BY-STEP GUIDE FOR 2013 Introduction The Program Access Index (PAI)
Food and Nutrition Service January 2015 CALCULATING THE SUPPLEMENTAL NUTRITION ASSISTANCE PROGRAM (SNAP) PROGRAM ACCESS INDEX: A STEP-BY-STEP GUIDE FOR 2013 Introduction The Program Access Index (PAI)
Signature Print Name Title Date ANNUAL AUDIT REPORT OCTOBER 1, 2017 SEPTEMBER 30, 2018 PHILIPS PUBLISHING GROUP
 Please review your report carefully. If corrections are needed, please fax us the pages requiring correction. Otherwise, sign and return to your Verified Account Coordinator by fax or email. Fax to: 415-461-6007
MAINE STATE LEGISLATURE
 MAINE STATE LEGISLATURE The following document is provided by the LAW AND LEGISLATIVE DIGITAL LIBRARY at the Maine State Law and Legislative Reference Library http://legislature.maine.gov/lawlib Reproduced
Fatal Occupational Injuries in Maine 2004
 Fatal Occupational Injuries in Maine 2004 BLS 732 D EPARTMENT OF LABOR B UREAU OF LABOR S TANDARDS 45 STATE HOUSE STATION AUGUSTA, MAINE 04333-0045 LAURA A. FORTMAN COMMISSIONER JOHN ELIAS BALDACCI GOVERNOR
Marine Manufacturing
 Marine Manufacturing Industry Snapshot Emsi Q3 2018 Data Set August 2018 Georgia Power 75 Fi h Street NW Suite 175 Atlanta, Georgia 30308 404.506.2226 Emsi Q3 2018 Data Set www.economicmodeling.com Page
U.S. Department of Transportation Maritime Administration
 U.S. Department of Transportation Maritime Administration Organization of American States Hemispheric Conference on Inland Ports, Waterways, and Dredging: Inland Transport as an Engine for Competitiveness
Intermodal Fuel Surcharge An Intermodal Fuel Charge will be assessed per container/trailer on all inland rates 'Door' location rates.
 Crowley Liner Date Filed: Date Effective: Rule 14 Revision: Org 023286 8/22/2018 8/29/2018 Intermodal Fuel Surcharge Publishing Code: A 1 Tariff 002 Intermodal Fuel Surcharge An Intermodal Fuel Charge
NEAUPG Annual Fall Meeting
 NEAUPG Annual Fall Meeting 1 Presentation Overview What does it mean to be Sustainable? What asphalt technologies are considered Sustainable and why? Why do we need to quantify our impact? What tools are
DFARS Procedures, Guidance, and Information
 (Revised November 4, 2016) PGI F, PART 2--CONTRACT QUALITY ASSURANCE ON SHIPMENTS BETWEEN CONTRACTORS PGI F-201 Procedures. (1) Use the supplier's commercial shipping document/packing list to enter performance
Fiscal Year 2010 Drinking Water and Ground Water Statistics
 Fiscal Year 2010 Drinking Water and Ground Water Statistics U.S. Environmental Protection Agency Office of Ground Water and Drinking Water EPA 817K11001 June 2011 Table of Contents Introduction... 4 Acronyms
Statement of the American Road & Transportation Builders Association. State of the Highway Trust Fund: Long-Term Solutions for Solvency
 Statement of the American Road & Transportation Builders Association State of the Highway Trust Fund: Long-Term Solutions for Solvency House Budget Committee April 24, 2013 Chairman Ryan and Representative
Energy and Regional Economics
 Energy and Regional Economics Michael Carliner International instability and possible war affect the overall US economy, and economic conditions in different regions, in a variety of ways. Changes in energy
STATE LEGISLATIVE ACTION FOR THE DEVELOPMENT OF A HEMP INDUSTRY IN THE U.S. Hawaii Representative Cynthia Henry Thielen
 (AL) Alabama -- -- -- (AK) Alaska -- -- (AZ) Arizona -- (AR) Arkansas -- SR13 (adopted 1999): Requires the University of Arkansas to conduct studies to determine the feasibility of growing hemp as an alternative
The Economic Impact of Mandatory Overtime Pay for New York State Agriculture
 Farm Credit East Report The Economic Impact of Mandatory Overtime Pay for New York State Agriculture Legislation has been introduced in the New York State Senate and Assembly that would require agricultural
Updated State-level Greenhouse Gas Emission Coefficients for Electricity Generation
 Updated State-level Greenhouse Gas Emission Coefficients for Electricity Generation 1998-2000 Energy Information Administration Office of Integrated Analysis and Forecasting Energy Information Administration
INLAND WATERWAYS INDUSTRY STUCTURE
 INLAND WATERWAYS INDUSTRY STUCTURE Kimberly Vachal,, Gene Griffin, and Jill Hough Upper Great Plains Transportation Institute North Dakota State University OVERVIEW Waterways in Multimodal Freight System
THE VW SETTLEMENT HANDBOOK: Overview, Timeline, and Actions
 THE VW SETTLEMENT HANDBOOK: Overview, Timeline, and Actions Table of Contents: What is the VW Settlement?... 2 Why Do We Care About NOx and Transportation?... 3 The Environmental Mitigation Trust... 4
The Point Intermodal River Port Facility at the Port of Huntington Project Benefit Cost Summary
 The Point Intermodal River Port Facility at the Port of Huntington Project Benefit Cost Summary The Lawrence County Port Authority 216 Collins Avenue South Point, Ohio 45638 P a g e Contents I. Base Case...
Comparison of CAIR and CAIR Plus Proposal using the Integrated Planning Model (IPM ) Mid-Atlantic Regional Air Management Association (MARAMA)
 Mid-Atlantic Regional Air Management Association (MARAMA)") Draft Report Comparison of CAIR and CAIR Plus Proposal using the Integrated Planning Model (IPM ) Prepared for Mid-Atlantic Regional Air Management Association (MARAMA) Prepared by ICF Resources, L.L.C.
Draft Report Comparison of CAIR and CAIR Plus Proposal using the Integrated Planning Model (IPM ) Prepared for Mid-Atlantic Regional Air Management Association (MARAMA) Prepared by ICF Resources, L.L.C.
SAMPLE REPORT. Competitive Landscape for Wholesale Distribution: Fasteners $ RESEARCHED & PRODUCED BY:
 $295.95 2015 Competitive Landscape for Wholesale Distribution: Fasteners ANNUAL MARKET DATA, TRENDS AND ANALYSIS FOR THE NORTH AMERICAN WHOLESALE DISTRIBUTION INDUSTRY 2015 by Gale Media, Inc. All rights
Welcome to the BPA Brand Report
 Welcome to the BPA Brand Report You are looking at the contemporary design that has replaced BPA s traditional green sheets and pink sheets. No longer called a Circulation Statement, the BPA Brand Report
Clean and Secure Energy Actions Report 2010 Update. GHG Policies
 Alabama Alaska Arizona Arkansas California Colorado Connecticut Delaware Florida Georgia Participant in Climate Registry; climate action plan: Policy Planning to Reduce Greenhouse Gas Emissions in Alabama
Radiology Staffing Survey 2010
 Radiology Staffing Survey 2010 A Nationwide Survey of Registered Radiologic Technologists Conducted by the American Society of Radiologic Technologists Reported June 2010 2010 ASRT. All rights reserved.
INLAND WATERWAYS TRANSPORTATION: Our Competitive Advantage. Delbert R Wilkins Canal Barge Company Big River Moves Leadership Forum April 15, 2013
 INLAND WATERWAYS TRANSPORTATION: Our Competitive Advantage Delbert R Wilkins Canal Barge Company Big River Moves Leadership Forum April 15, 2013 INLAND WATERWAYS TRANSPORTATION: Our Competitive Advantage
Eric Thomas Benchmark River and Rail Terminals
 Eric Thomas Benchmark River and Rail Terminals CORBA s Mission The Central Ohio River Business Association (CORBA) is an alliance of businesses and industry engaged in river commerce on and along the Ohio
The Contributions of Insulation to the U.S. Economy in 2016
 The Contributions of Insulation to the U.S. Economy in 2016 Economics & Statistics Department American Chemistry Council February 2017 TABLE OF CONTENTS EXECUTIVE SUMMARY... 2 THE INSULATION INDUSTRY IN
THE LOCAL AND REGIONAL ECONOMIC IMPACTS OF THE US DEEPWATER PORT SYSTEM, 2006 PREPARED FOR: AMERICAN ASSOCIATION OF PORT AUTHORITIES SEPTEMBER 5, 2007
 THE LOCAL AND REGIONAL ECONOMIC IMPACTS OF THE US DEEPWATER PORT SYSTEM, 2006 PREPARED FOR: AMERICAN ASSOCIATION OF PORT AUTHORITIES SEPTEMBER 5, 2007 MARTIN ASSOCIATES 941 WHEATLAND AVE, SUITE 203 LANCASTER,
Ohio Maritime Study. Ohio Transportation Engineering Conference (OTEC) October 10, 2017 Columbus, OH
 October 10, 2017 Columbus, OH") Ohio Maritime Study Ohio Transportation Engineering Conference (OTEC) October 10, 2017 Columbus, OH Presentation Map Context the Great Lakes Region Ohio Maritime Transportation Study What Overview Comes
Ohio Maritime Study Ohio Transportation Engineering Conference (OTEC) October 10, 2017 Columbus, OH Presentation Map Context the Great Lakes Region Ohio Maritime Transportation Study What Overview Comes
Trends in. U.S. Delivered Coal Costs: July 2012
 Trends in U.S. Delivered Coal Costs: 2004-2011 July 2012 By Teresa Foster, William Briggs and Leslie Glustrom Version 1.1 Inquiries or corrections to info@cleanenergyaction.org 1 2 Table of Contents INTRODUCTION...
Does your company lease any provider networks from other dental plans or network management companies? (Please check all that apply)
") Name Company Phone Email Address Which type of Dental benefit products does your company currently offer? (Please check all that apply) 1. 2. 3. DEPO 4. Dental Indemnity 5. Medicaid/CHIP 6. Medicare 7.
Name Company Phone Email Address Which type of Dental benefit products does your company currently offer? (Please check all that apply) 1. 2. 3. DEPO 4. Dental Indemnity 5. Medicaid/CHIP 6. Medicare 7.
The Oklahoma First Energy Plan: A Pragmatic Path Forward
 Office of the Oklahoma Secretary of Energy The Oklahoma First Energy Plan: A Pragmatic Path Forward C. Michael Ming Secretary of Energy State of Oklahoma Southern States Energy Board Washington, DC February
Exhibition Attendance Certification
 ion Attendance Certification for TS 2 2003 2003 Location: Washington Convention Center, Washington DC Date of Exposition: July 22-24, 2003 Date of Conference: July 21-24, 2003 Year Established: 1973 Frequency:
RAIL COMMODITY FLOWS
 RAIL COMMODITY FLOWS. The major commodities handled by rail are bulk, with the exception of the automotive traffic. The following pages provide detailed information rail commodities in California, and
The next big reliability challenge: EPA revised ozone standard
 The next big reliability challenge: EPA revised ozone standard Eugene M. Trisko Attorney-at-Law SSEB Clean Coal Technology Committee Kingsport, TN May 19, 2015 Background EPA is proposing to lower the
Case Study: market growth strategy. - Selection of slides
 Case Study: market growth strategy - Selection of slides 1 Objective of the collaboration Situation: The Client, global AC player, would like to enhance its positioning in the USA In this sense, the overall
Facts on Direct-to-Consumer Food Marketing
 United States Department of Agriculture Agricultural Marketing Service May 2009 Facts on Direct-to-Consumer Food Marketing Incorporating Data from the 2007 Census of Agriculture Written by: Adam Diamond
PROJECTS. The KIPDA MPO s Central Location
 PROJECTS Freight The economy of the Louisville KY-IN) Metropolitan Planning Area MPA), similar to that of the United States as a whole, is largely dependent on the efficient, reliable, and safe movement
Emission Factors and Energy Prices. for Leonardo Academy s. Cleaner and Greener Program
 Emission Factors and Energy Prices for Leonardo Academy s Cleaner and Greener Program Prepared by Leonardo Academy Inc. For the Multiple Pollutant Emission Reduction Reporting System (MPERRS) Funding for
Salvatore Ray Granata, P.E., S.E. 146 Lee Road 2012 Opelika, AL Work: (678) Cell: (770) salgranata.
 Cell: (770) salgranata.") CAREER HIGHLIGHTS Salvatore Ray Granata, P.E., S.E. 146 Lee Road 2012 Opelika, AL 36804 Work: (678) 367-3151 Cell: (770) 301-5817 sal@srgpe.net salgranata.com A registered Civil / Professional Engineer,
CAREER HIGHLIGHTS Salvatore Ray Granata, P.E., S.E. 146 Lee Road 2012 Opelika, AL 36804 Work: (678) 367-3151 Cell: (770) 301-5817 sal@srgpe.net salgranata.com A registered Civil / Professional Engineer,
ECONOMIC IMPACT OF THE TEXAS PORTS ON THE STATE OF TEXAS AND THE UNITED STATES, 2015
 ECONOMIC IMPACT OF THE TEXAS PORTS ON THE STATE OF TEXAS AND THE UNITED STATES, 2015 Prepared for: TEXAS PORTS ASSOCIATION 1000 Foust Road Brownsville, TX 78521 www.texasports.org Prepared by: MARTIN ASSOCIATES
Benchmarking Standards, Model Codes, Codes and Voluntary Guidelines on the HERS Index
 Benchmarking Standards, Model Codes, Codes and Voluntary Guidelines on the HERS Index Importance of Benchmarking Quantifying energy efficiency programs and codes helps: Consumers understand the performance
The Economic Impact of Privately-Owned Forests in the United States
 The Economic Impact of Privately-Owned Forests in the United States The Economic Impact of Privately-Owned Forests in the United States Prepared for: National Alliance of Forest Owners Contact: Gretchen
BRAND REPORT FOR THE 6 MONTH PERIOD ENDED JUNE 2017 (Including Supplementary Data)
") BRAND REPORT FOR THE 6 MONTH PERIOD ENDED JUNE 2017 (Including Supplementary Data) No attempt has been made to rank the information contained in this report in order of importance, since BPA Worldwide
BRAND REPORT FOR THE 6 MONTH PERIOD ENDED JUNE 2017 (Including Supplementary Data) No attempt has been made to rank the information contained in this report in order of importance, since BPA Worldwide
America s Inland Waterways
 America s Inland Waterways Original prepared by Steve Little Crounse Corporation Modified by Chuck Knowles Kentucky Transportation Center America s Inland Waterways: An Inland Marine Highway for Freight
THE IMPORTANCE OF BARGE TRANSPORTATION FOR AMERICA'S AGRICULTURE. Jerry Fruin
 MN DEPT OF TRANSPORTATION 3 0314 00024 5042 Staff Paper Series Staff Paper P95-4 February 1995 THE IMPORTANCE OF BARGE TRANSPORTATION FOR AMERICA'S AGRICULTURE by Jerry Fruin CTS HE 595.F3 F78 1995 i Department
A Study of United States Hydroelectric Plant Ownership
 INL/EXT-06-11519 A Study of United States Hydroelectric Plant Ownership Douglas G. Hall, INL Project Manager Kelly S. Reeves, NPS June 2006 The INL is a U.S. Department of Energy National Laboratory operated
Louisiana Ports: The Industry that Drives all Others. Presented By: Paul G. Aucoin Executive Director, Port of South Louisiana
 Louisiana Ports: The Industry that Drives all Others Presented By: Paul G. Aucoin Executive Director, Port of South Louisiana Ports Impact Every Region of LA 1. Central Louisiana Regional Port 2. Avoyelles
Interstate Movement Of Municipal Solid Waste
 1.S: P'E C I A L R E P 0 R T: 2 Interstate Movement Of Municipal Solid Waste February 1992 The United States has an intricate web of beneficial interstate movements of municipal solid waste. Where interstate
Labor Market Outlook. Labor Market Outlook Survey Q (October December) Published by the Society for Human Resource Management
 Published by the Society for Human Resource Management") October December 2009 Labor Market Outlook Published by the Society for Human Resource Management Labor Market Outlook Survey Q4 2009 (October December) LABOR MARKET OUTLOOK SURVEY Q4 2009 (October December)
October December 2009 Labor Market Outlook Published by the Society for Human Resource Management Labor Market Outlook Survey Q4 2009 (October December) LABOR MARKET OUTLOOK SURVEY Q4 2009 (October December)
Overview and Background: Regulation of Power Plants under EPA s Proposed Clean Power Plan
 Overview and Background: Regulation of Power Plants under EPA s Proposed Clean Power Plan Jennifer Macedonia Council of State Governments Annual Meeting August 11, 2014 BACKGROUND: EPA S PROPOSED CLEAN
THE LOCAL AND REGIONAL ECONOMIC IMPACTS OF THE PORT OF CORPUS CHRISTI
 THE LOCAL AND REGIONAL ECONOMIC IMPACTS OF THE PORT OF CORPUS CHRISTI prepared for February 10, 2004 Martin Associates 2938 Columbia Avenue, Suite 602 Lancaster, PA 17603 TABLE OF CONTENTS EXECUTIVE SUMMARY...1
Coal and the Waterways: The View from Washington
 Coal and the Waterways: The View from Washington Debra Calhoun, Senior Vice President/CEO, WCI September 19, 2017 National Coal Transportation Association 1 Waterways Council, Inc. s sole mission is to
Data and Analysis from EIA to Inform Policymakers, Industry, and the Public Regarding Power Sector Trends
 Data and Analysis from EIA to Inform Policymakers, Industry, and the Public Regarding Power Sector Trends for Power Sector Trends in the Eastern Interconnection Atlanta, GA by Howard Gruenspecht, Deputy
Challenges with Evaluating Container Port Projects and the Corps of Engineers
 Challenges with Evaluating Container Port Projects and the Corps of Engineers Smart Rivers Conference 14 September 2011 Kevin Knight Economist Institute for Water Resources U.S. Corps of Engineers 1 Trends
THE LOCAL AND REGIONAL ECONOMIC IMPACTS OF THE US DEEPWATER PORT SYSTEM, 2007 PREPARED FOR: AMERICAN ASSOCIATION OF PORT AUTHORITIES JUNE 6, 2008
 THE LOCAL AND REGIONAL ECONOMIC IMPACTS OF THE US DEEPWATER PORT SYSTEM, 2007 PREPARED FOR: AMERICAN ASSOCIATION OF PORT AUTHORITIES JUNE 6, 2008 MARTIN ASSOCIATES 941 WHEATLAND AVE, SUITE 203 LANCASTER,
WATERWAYS: Working for America
 Robert J. Hurt WATERWAYS: Working for America George G Leavell Wepfer Marine, Inc. Mississippi River Parkway Commission September 19, 2014 Robert J. Hurt WATERWAYS: Working for America Waterways transportation
Port of Baltimore and Economic Development
 Port of Baltimore and Economic Development Presentation to the National Conference of State Legislatures Fiscal Analysts Seminar Department of Legislative Services Office of Policy Analysis Annapolis,
Salvatore Ray Granata, P.E., S.E. 146 Lee Road 2012 Opelika, AL Work: (678) Cell: (770) salgranata.
 Cell: (770) salgranata.") CAREER HIGHLIGHTS Salvatore Ray Granata, P.E., S.E. 146 Lee Road 2012 Opelika, AL 36804 Work: (678) 367-3151 Cell: (770) 301-5817 sal@srgpe.net salgranata.com A registered Civil / Professional Engineer,
CAREER HIGHLIGHTS Salvatore Ray Granata, P.E., S.E. 146 Lee Road 2012 Opelika, AL 36804 Work: (678) 367-3151 Cell: (770) 301-5817 sal@srgpe.net salgranata.com A registered Civil / Professional Engineer,
Yokohama Part Number. AVID Touring S 215/65R16 98T CCHB81T0709 CCHB81T1509
 TECHNICAL SERVICES BULLETIN Yokohama AVID Touring S Recall 10/10/2012 Yokohama Tire Corporation is initiating a voluntary recall of certain Yokohama AVID Touring S tires manufactured in 2009. These tires
Potential Impacts to Texas of EPA s Clean Power Plan. Brian Tulloh Austin Electricity Conference April 9, 2015
 Potential Impacts to Texas of EPA s Clean Power Plan Brian Tulloh Austin Electricity Conference April 9, 2015 Luminant Is Texas Largest Competitive Power Generator 15.4 GW of generation capacity: 8.0 GW
The Economic Impacts of the Indiana Maritime Industry
 The Economic Impacts of the Indiana Maritime Industry Study Completed 2015 Prepared for: Martin Associates 941 Wheatland Avenue Suite 203 Lancaster, PA 17603 www.martinassoc.net TABLE OF CONTENTS EXECUTIVE
States Use Gentle Hand in Taxing Timberland
 March 2009 No. 164 FISCAL FACT States Use Gentle Hand in Taxing Timberland By Travis Greaves In the realm of real property taxation, the best-known tax is on residential property. Every U.S. homeowner