Quantifying the Impacts of Shoaling in Navigation Channels via Historical Waterborne Commerce Data
|
|
|
- Evelyn Harris
- 5 years ago
- Views:
Transcription


1 Quantifying the Impacts of Shoaling in Navigation Channels via Historical Waterborne Commerce Data Kenneth Ned Mitchell, PhD U.S. Army Engineer Research and Development Center CAPT David MacFarland NOAA CMTS-TRB R&D Conference Washington, D.C. June 26 th, 2012 US Army Corps of Engineers


2 USACE Maintenance Dredging USACE invests hundreds of millions of dollars annually in maintenance dredging of the deep-draft navigation project portfolio. Due to limited funds, difficult decisions must be made concerning where to direct maintenance dredging resources. Priority should be given to portions of the MTS with the greatest national benefits right?

3 NOAA National Ocean Service NOAA s National Ocean Service seeks to promote the value of the MTS in supporting coastal communities, robust coastal economies, and environmentally sustainable utilization of marine resources. It is critical that the value of the NOAA-NOS mission be conveyed in terms of economic benefits of supported coastal port activity.
4 Access to MTS Commerce Data The Corps Waterborne Commerce Statistics Center (WCSC) collects and collates data from several sources concerning commercial use of US waterways. Dock-level, origin-to-destination routing (Corps-use-only) Includes tons, commodity types, vessel counts, drafts Aggregated data already published at project level Corps Ops community has not consistently used this data beyond project-level tonnage and ton-mile metrics for O&M budget development. Both USACE and NOAA-NOS can benefit from streamlined, interactive access to this rich data source.

5 Channel Portfolio Tool (CPT)
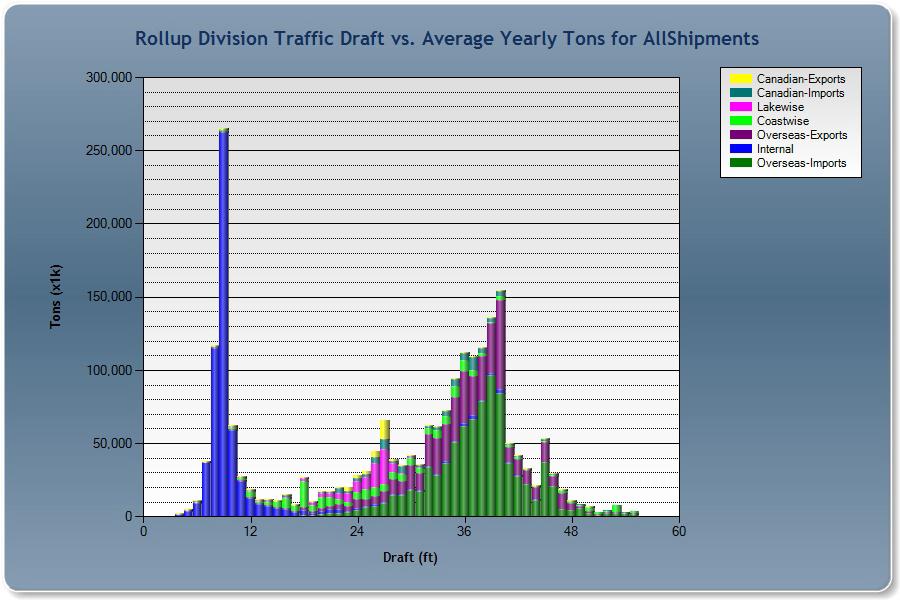
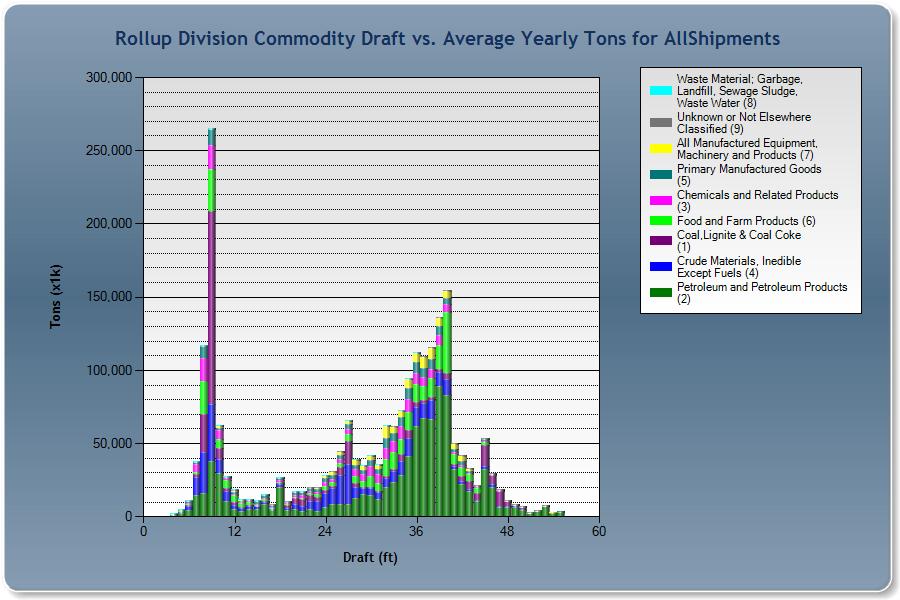
6 Depth-Utilization Profiles
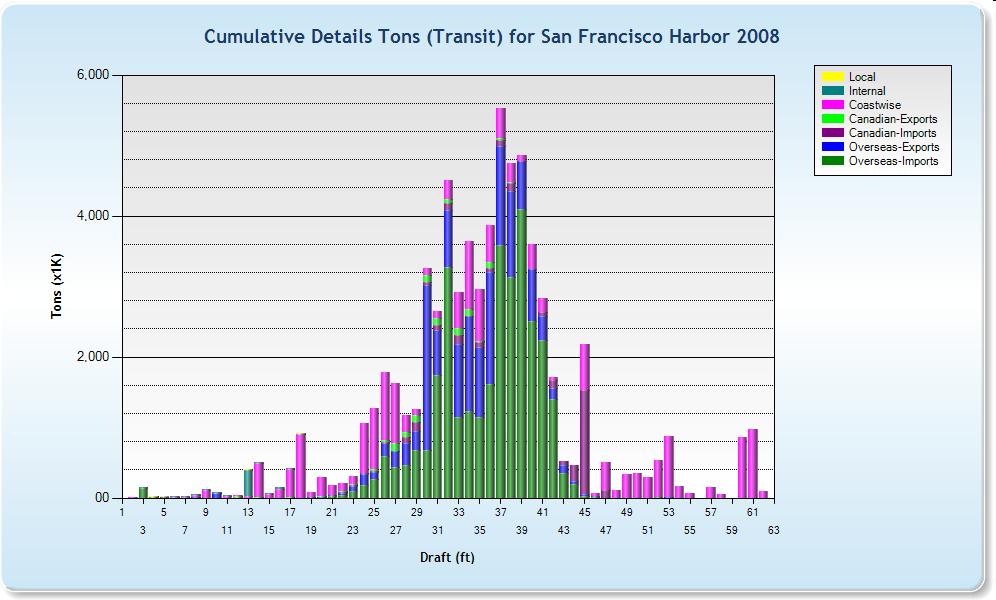
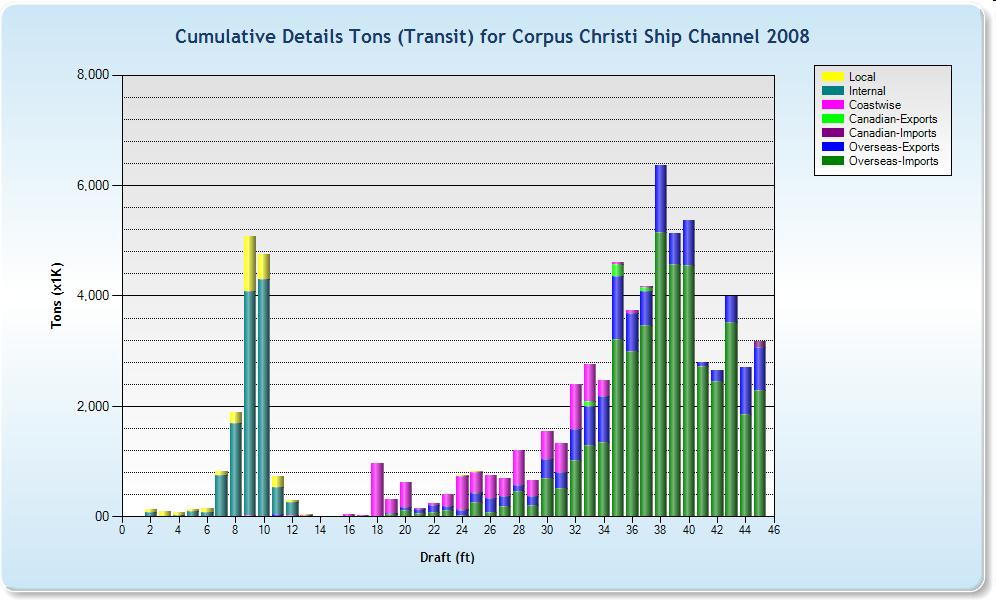
7 Focus on Shoal-vulnerable Cargo We need a way to readily quantify the true disruptions from shoaling. ERDC-CHL BUILDING STRONG 7


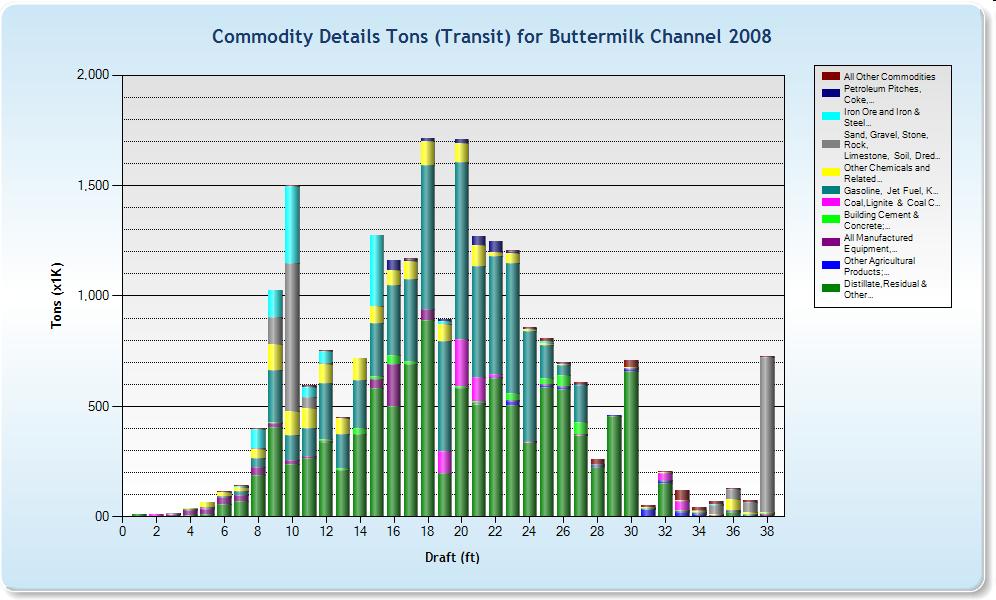
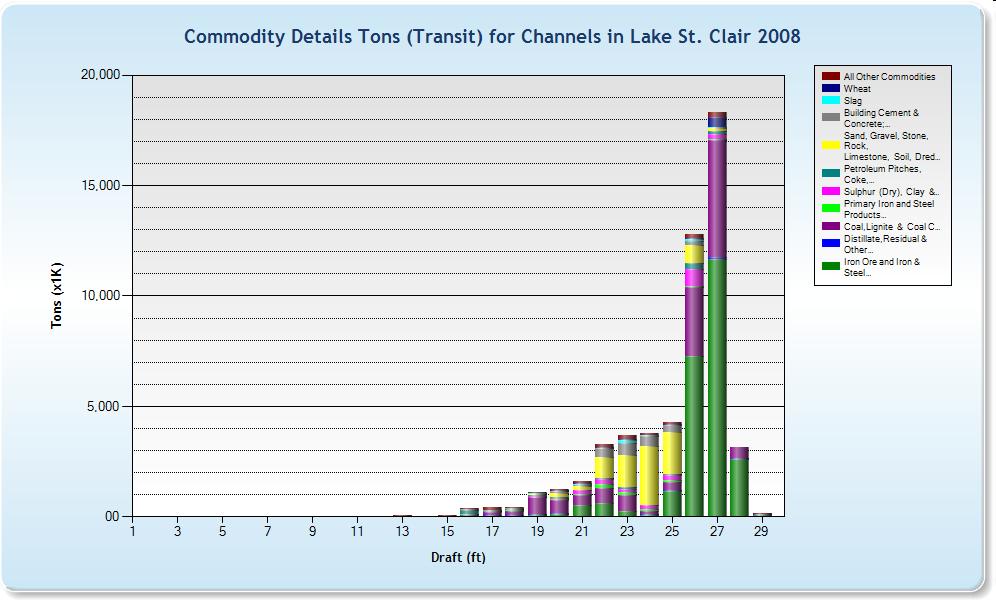
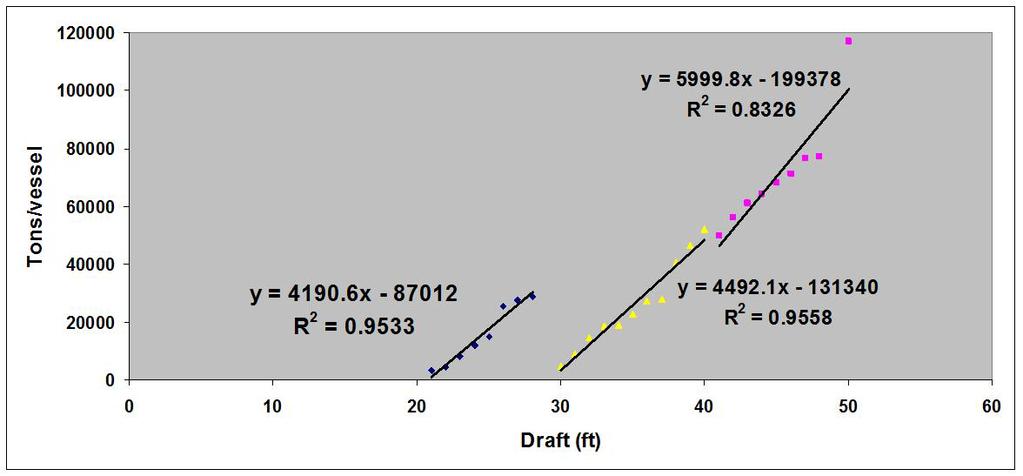
8 Need to Quantify Light-loaded Cargo Need to understand the relationship between depth of transit and cargo carried per voyage. CPT gives us a straightforward means of analyzing these relationships for scalable navigation systems.


9 Need to Quantify Light-loaded Cargo 140, ,000 Tons/vessel 100,000 y = x R 2 = ,000 60,000 This slope is the average reduction 40,000 in cargo per vessel per foot of reduced draft 20, Draft (ft)
10 National Summary Dry Bulk
11 National Summary Tankers
12 National Summary Containerized Cargo
13 National Summaries Vessel Type Tanker Tanker Dry Bulk Dry Bulk Container Container Imports/Exports Imports Exports Imports Exports Imports Exports Avg. Tons/ft/vessel R 2 6,858 (.95) 2,579 (.95) 6,243 (.99) 4,665 (.98) 39.6x x (.97) [5,049 at 42 ft.] 74.1x x (.99) [2,273 at 42 ft.]
14 Vessel Type National Summaries Imports/ Exports # Vessels Disrupted by 2-ft Shoaling Scenario Thousand Short Tons Disrupted Tanker Imports 1,624 11,137 Tanker Exports Dry Bulk Imports 801 5,001 Dry Bulk Exports 742 3,461 Container Imports Container Exports 555 1,418 TOTAL: 21,885
15 National Summaries Vessel Type Imports/ Exports # of Additional Voyages Needed to Transport Disrupted Cargo (2-ft Shoaling Scenario) Tanker Imports 139 Tanker Exports 15 Dry Bulk Imports 83 Dry Bulk Exports 58 Container Imports 97 Container Exports 59 Total: 452
 Venezuela 1750 Estonia 6950 Mexico 650 Brazil 3750 Colombia 1650 India 13300 The Netherlands 5600 Spain 5100 United Kingdom 5300 Egypt 7300 Average")
16 Lower Mississippi River Average voyage distances, US Census data on foreign countries of origin/destination for Lower Mississippi River used to estimate average distance per voyage: Sample Countries of Origin/Destination Distance (mi) Venezuela 1750 Estonia 6950 Mexico 650 Brazil 3750 Colombia 1650 India The Netherlands 5600 Spain 5100 United Kingdom 5300 Egypt 7300 Average Voyage Distances Tanker Imports: Dry Bulk Imports: 3640 mi 4853 mi Tanker Exports: Dry Bulk Export: 7311 mi 6574 mi

17 Further Automation of Metrics Continued development of CPT will enable rapid, scalable metrics to estimate additional shipping costs due to shoaling.
18 Quantifying the Impacts of Shoaling in Navigation Channels via Historical Waterborne Commerce Data Questions? Dr. Ned Mitchell CAPT David MacFarland