April 18, South Carolina s Inland Port. ULI Spartanburg
|
|
|
- Osborne Dennis
- 5 years ago
- Views:
Transcription


1 April 18, 2013 South Carolina s Inland Port ULI Spartanburg


2 CenterPoint Properties CenterPoint Properties Active Markets Company Overview Undertakes complex logistics issues and creates opportunities for our customers Brings together private and public entities to create successful solutions that benefit our customers, the industry and the communities surrounding our sites Competencies and Strengths Tackle complex projects with successful results Public-Private Partnerships (P3) expertise Brownfield redevelopment Vast environmental project knowledge Logistics relationships Ports Investment Snap-Shot $2.6 billion company 6,000+ acres for development 42.5 million SF portfolio Annual activity over $500 million Office Locations Chicago, IL - Headquarters Hampton Roads, VA Los Angeles, CA Kansas City, MO Rail Ocean Carriers Beneficial Cargo Owners (BCOs) Extensive governmental agency experience Work with competing stakeholders for win-win solutions On-dock development capability 2

3 Center Point Investments Nationwide Map of CenterPoint s Invested Markets 3
4 Intermodal Advantages Investment Rationale DISTRIBUTION CENTERS IMMEDIATELY ADJACENT TO INFRASTRUCTURE ASSETS (INTERMODAL YARDS/ PORTS) SIGNIFICANTLY REDUCE THE TOTAL LANDED COST OF THEIR PRODUCT. 60.0% 50.0% 50.3% Logistics Cost Breakdown 40.0% 30.0% 20.0% 10.0% 0.0% 21.8% 9.5% 7.8% Transportation Inventory Labor Customer Service 4.3% 2.7% 2.2% 1.2% Rent Admin. Supplies Other Source: Establish,Inc/ Herbert W. Davis and Company 2006 Database 4

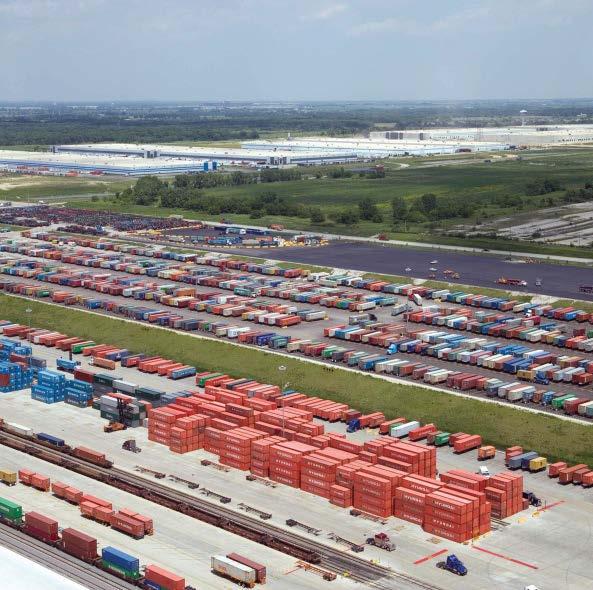
5 CenterPoint Intermodal Center Joliet/ Elwood Park Aerial 5

6 CenterPoint Intermodal Center Joliet/ Elwood UP and BNSF The Nation s Largest Inland Port Nation s Largest Inland Port and Third Largest U.S. Port 2.6 million TEUs annually; 6 million TEUs annually at full build out $2 billion invested to date; $3 billion at full build out 6,500 acre integrated logistics center; 3,600 acre industrial park 730 acre BNSF intermodal facility 835 acre UPRR intermodal facility International and domestic intermodal service 11.5 million SF industrial facilities; 36 million SF at full build out Grain and bulk transload facilities 116 acres of container storage yards; 600 acres at full build out Top 15 North American Container Port Rankings (2011 Total TEU) 12,000,000 10,000,000 8,000,000 6,000,000 4,000,000 2,000,000 0 CIC Joliet/ Elwood - 2,600,000 TEUs Annually Source: JOC - May,

7 Real World Transportation Savings Example Today s Industry Objective 7


8 Greenville/ Spartanburg s Market Advantages SCIP Concept Plan Location Strategy Norfolk Southern Connection SCIP will be served by the Norfolk Southern who will run short haul trains out of the Port of Charleston Superior infrastructure and business friendly climate has led to over $3.8 billion of new capital invested in Upstate SC over the last 2.5 years The Greenville/Spartanburg- Located between two of the nations largest urban regions 100 miles from Charlotte, 130 miles from Atlanta Connected by the commerce-rich Boom Belt I miles from The Port of Charleston Served by both the NS and CSX 8 Market Overview

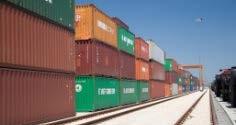
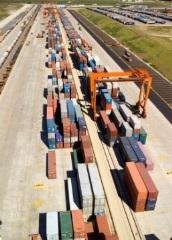
9 Economic, Environmental and Traffic Impacts Traffic Impacts of the SCIP IT IS ESTIMATED THAT APPROXIMATELY 60,000 70,000 CONTAINERS ANNUALLY, PREVIOUSLY TRANSPORTED VIA TRUCK, WILL NOW BE TRANSPORTED TO GREENVILLE / SPARTANBURG VIA RAIL. Estimated co-location annual savings of approximately ($150 per container) Environmental Impacts of the SCIP One gallon of diesel fuel moves One ton of freight More than 435 miles via rail Less than 100 miles via truck Trucks emit 4x more Greenhouse gases than freight rail Intermodal rail hubs lessen national carbon footprint Freight transported by rail is 4x more energy efficient Modern, efficient exurban intermodal hubs reduce inner city congestion & train idling Strategically located intermodal facilities reduce truck drayage to distribution warehouses Integrated green logistics campus 9 Market Overview
. Combined North American Rail volume totaled 19,440,940 carloads (down 2%) and 15,459,909 trailers and containers (up 4.2%) in 2012.")
10 2012 Intermodal Trends Intermodal US Class I Intermodal Growth Year-end Summary: Major U.S. railroads report continued Intermodal Growth Intermodal in Intermodal volume in 2012 second highest on record (2006). Combined North American Rail volume totaled 19,440,940 carloads (down 2%) and 15,459,909 trailers and containers (up 4.2%) in Indicators of Further Intermodal Growth: New trucking regulations effective July, 2013 estimated to cost motor carrier industry 3-5 percent productivity. Washington D.C. s pro-intermodal attitude requesting a 10% transfer of the nation's trucking freight to rail. Trucking Companies, such as Swift Transportation, shrinking tractor capacity and expanding intermodal divisions. Major US Railroads Traffic Comparison Intermodal Vs. Carload Traffic Growth year-over-year INTERMODAL 3.2% 2012 CARLOADS -3.1% ,000,000 4,000,000 6,000,000 8,000,000 10,000,000 12,000,000 Source: Association of American Railroads, Weekly Railroad Traffic 10 Property Location & Images