Georgia Statewide Water Loss Program
|
|
|
- Joleen Cain
- 5 years ago
- Views:
Transcription


1 Georgia Statewide Water Loss Program Presented by: Steve Cavanaugh, PE Principal in Charge, Georgia Water Loss Program Member IWA, Water Loss Specialist Group Member, Georgia Water Loss Control Committee Outreach Chair, AWWA Water Loss Control Committee Co-author: Jason Bodwell

2 Audience Participation! M R S


3 3
4
5
6 Training Drivers Auditing Requirement Technical Assistance Validation Planned Use of Audits
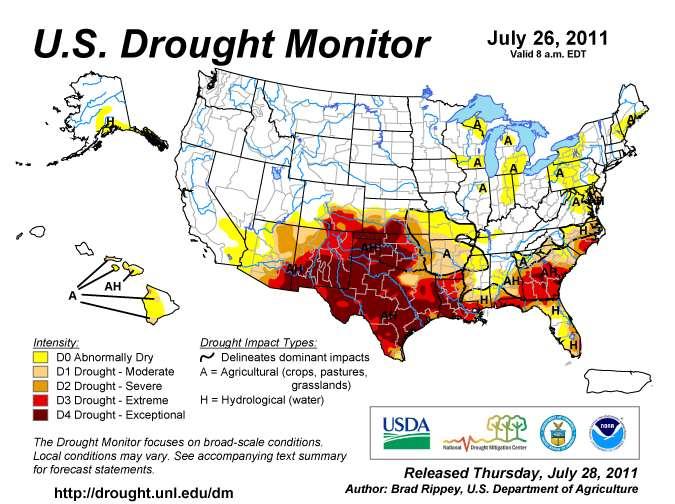
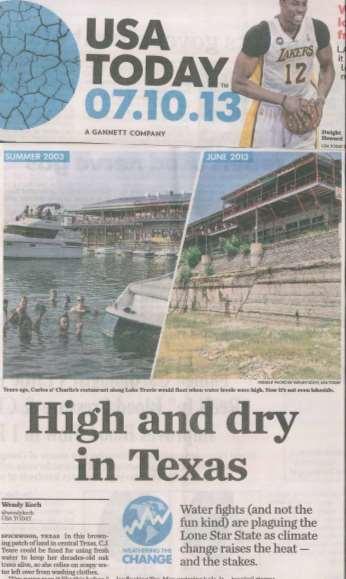
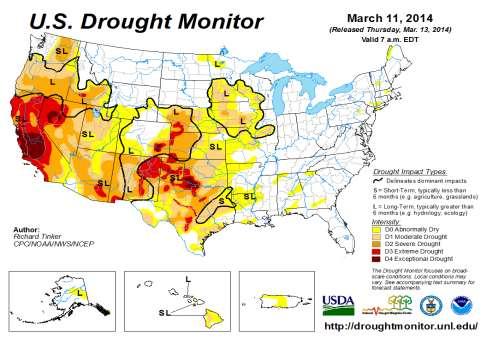
7 Timeline Severe Drought in Georgia Water Stewardship Act of 2010 requires annual water loss audits March 2012 Large water systems submit first AWWA water loss audit State hires experts to provide free 10- month training to small utilities on water auditing; small systems submit their first audits (Phase 1) Early 2013 State commissions 3 rd party validation for all audits (large and small systems) Late 2013 & 2014 State provides free technical assistance to small utilities for water loss field work (Phase 2, 2A)
8 Training Drivers Auditing Requirement Technical Assistance Validation Planned Use of Audits


9 Drivers that Compel Change


10 10

11 Water Audit Regulatory Drivers in GA

12 Landscape of Water Loss Auditing, Reporting & Performance Targets WA OR MN WI NY NH CA MO IL IN TN KY PA MD WV VA NC SC NM GA TX FL
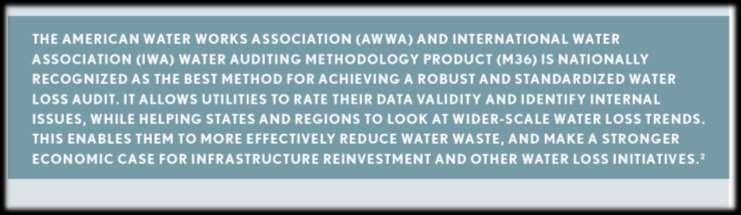
13 Requirements or References to AWWA M36 Methodology for Water Auditing & Loss Control WA OR MN WI NY NH MA IL IN PA MD WV VA NJ DE CA MO TN KY NC SC NM GA TX FL
14 IWA/AWWA Standard Water Balance Own Sources Water Imported Total System Input ( allow for known errors ) Water Exported Water Supplied Authorized Consumption Water Losses Billed Authorized Consumption Unbilled Authorized Consumption Apparent Losses Real Losses Revenue Water Non- Revenue Water Billed Water Exported Billed Metered Consumption Billed Unmetered Consumption Unbilled Metered Consumption Unbilled Unmetered Consumption Unauthorized Consumption Customer Metering Inaccuracies Systematic Data Handling Errors Leakage on Mains Leakage on Service Lines Leakage & Overflows at Storage
15 Unaccounted For Water Unaccounted For Water Percentage 15


16 2003 Inconsistent use and interpretation Unreliable indicator of performance Fails to segregate loss into its components for effective management 16
17 MGD Water Loss as a Percentage of Supply is not an Indicator of Performance Water Supplied (MGD) Authorized Consumption (MGD) Water Loss (MGD) Water Loss (Percent of Supply) 28% 26% 24% 22% 20% 18% 16% 14% 5 12% 0 10% 17


18 Unaccounted-For No More
19 Training Drivers Auditing Requirement Technical Assistance Validation Planned Use of Audits


20 Large >10,000 population Small ,000 population
 + Click to add a comment Reporting Year: 2013 1/2013-12/2013 Please")
 using the drop-down list to the left of the input cell.")

21 AWWA Tools for Water Loss Control AWWA Free Water Audit Software: Reporting Worksheet WAS v5.0 American Water Works Association. Copyright 2014, All Rights Reserved.? Click to access definition Water Audit Report for: Northern San Leandro Combined Water Sewer Storm Utility District ( ) + Click to add a comment Reporting Year: / /2013 Please enter data in the white cells below. Where available, metered values should be used; if metered values are unavailable please estimate a value. Indicate your confidence in the accuracy of the input data by grading each component (n/a or 1-10) using the drop-down list to the left of the input cell. Hover the mouse over the cell to obtain a description of the grades AWWA Free Water Audit Software: System Attributes and Performance Indicators WAS v5.0 American Water Works Association. Copyright 2014, All Rights Reserved. All volumes to be entered as: MILLION GALLONS (US) PER YEAR Water Audit Report for: Philadelphia Water Department To select the correct data grading for each input, determine the highest grade where the utility meets or exceeds all criteria for that grade and all grades below it. Master Meter Error Adjustments Reporting Year: / /2013 WATER SUPPLIED < Enter grading in column 'E' and 'J' > Pcnt: Value: Volume from own sources: +? 5 1, MG/Yr +? MG/Yr *** YOUR WATER AUDIT DATA VALIDITY SCORE IS: 77 out of 100 *** Water imported: +? MG/Yr +? MG/Yr Water exported: +? System MG/Yr Attributes: +? MG/Yr Enter negative % or value for under-registration Apparent Losses: 7, MG/Yr WATER SUPPLIED: MG/Yr Enter positive % or value for over-registration. + Real Losses: 21, MG/Yr AUTHORIZED CONSUMPTION Click here:? Billed metered: +? MG/Yr for help using option = Water Losses: 28, MG/Yr Billed unmetered: +? MG/Yr buttons below Unbilled metered: +? MG/Yr Pcnt: Value: Unbilled unmetered: +? ? Unavoidable Annual Real Losses (UARL): 2, MG/Yr MG/Yr 1.25% MG/Yr Default option selected for Unbilled unmetered - a grading of 5 is applied but not displayed Use buttons to select Annual cost of Apparent Losses: $54,788,450 AUTHORIZED CONSUMPTION:? MG/Yr percentage of water supplied Annual cost of Real Losses: $7,368,338 Valued at Variable Production Cost OR value Return to Reporting Worksheet to change this assumpiton WATER LOSSES (Water Supplied - Authorized Consumption) MG/Yr Apparent Losses Performance Indicators: Pcnt: Value: Unauthorized consumption: +? MG/Yr 0.25% MG/Yr Unauthorized consumption volume entered is greater than the recommended default value Non-revenue water as percent by volume of Water Supplied: 38.1% Financial: Customer metering inaccuracies: +? MG/Yr 1.00% MG/Yr Non-revenue water as percent by cost of operating system: 25.2% Real Losses valued at Variable Production Cost Systematic data handling errors: +? MG/Yr 0.25% MG/Yr Apparent Losses:? MG/Yr Apparent Losses per service connection per day: gallons/connection/day Real Losses (Current Annual Real Losses or CARL) Real Losses = Water Losses - Apparent Losses:? MG/Yr Real Losses per service connection per day: gallons/connection/day Operational Efficiency: WATER LOSSES: MG/Yr Real Losses per length of main per day*: N/A NON-REVENUE WATER NON-REVENUE WATER:? MG/Yr Real Losses per service connection per day per psi pressure: 1.70 gallons/connection/day/psi = Water Losses + Unbilled Metered + Unbilled Unmetered SYSTEM DATA Length of mains: +? miles From Above, Real Losses = Current Annual Real Losses (CARL): 21, million gallons/year Number of active AND inactive service connections: +? 6 1,000 Service connection density:? 10 conn./mile main? Infrastructure Leakage Index (ILI) [CARL/UARL]: 8.52 Are customer meters typically located at the curbstop or property line? Yes (length of service line, beyond the property Average length of customer service line: +? ft boundary, that is the responsibility of the utility) * This performance indicator applies for systems with a low service connection density of less than 32 service connections/mile of pipeline Average length of customer service line has been set to zero and a data grading score of 10 has been applied Average operating pressure: +? psi WAS v5.0 AWWA Free Water Audit Software: Water Balance COST DATA American Water Works Association. Copyright 2014, All Rights Reserved. Total annual cost of operating water system: +? 5 $1,000,000 $/Year Customer retail unit cost (applied to Apparent Losses): +? 7 $3.50 $/1000 gallons (US) Variable production cost (applied to Real Losses): +? 7 $3, $/Million gallons Use Customer Retail Unit Cost to value real losses Water Audit Report for: Philadelphia Water Department Reporting Year: / /2013 WATER AUDIT DATA VALIDITY SCORE: Data Validity Score: 77 *** YOUR SCORE IS: 60 out of 100 *** Water Exported A weighted scale for the components of consumption and water loss is included in the calculation of the Water Audit Data Validity Score Billed Water Exported 5, PRIORITY AREAS FOR ATTENTION: Billed Metered Consumption (water Based on the information provided, audit accuracy can be improved by addressing the following components: Revenue Water Billed Authorized Consumption exported is removed) 1: Volume from own sources 49, : Customer metering inaccuracies Authorized 3: Total annual cost of operating water system Own Sources 49, Billed Unmetered Consumption 49, Consumption (Adjusted for known errors) 51, Unbilled Metered Consumption Non-Revenue Water Unbilled Authorized Consumption (NRW) 86, , Unbilled Unmetered Consumption 1, Water Supplied Unauthorized Consumption 30, Apparent Losses 2, , , Customer Metering Inaccuracies 1, Systematic Data Handling Errors Water Losses 3, Leakage on Transmission and/or Water Imported 28, Distribution Mains Real Losses Not broken down Leakage and Overflows at Utility's Storage 21, Tanks Not broken down Leakage on Service Connections Not broken down
 Reporting Year: 2013 1/2013-12/2013 Please")
22 AWWA Free Water Audit Software AWWA Free Water Audit Software: Reporting Worksheet WAS v5.0 American Water Works Association. Copyright 2014, All Rights Reserved.? Click to access definition + Click to add a comment Water Audit Report for: Northern San Leandro Combined Water Sewer Storm Utility District ( ) Reporting Year: / /2013 Please enter data in the white cells below. Where available, metered values should be used; if metered values are unavailable please estimate a value. Indicate your confidence in the accuracy of the input data by grading each component (n/a or 1-10) using the drop-down list to the left of the input cell. Hover the mouse over the cell to obtain a description of the grades All volumes to be entered as: MILLION GALLONS (US) PER YEAR To select the correct data grading for each input, determine the highest grade where the utility meets or exceeds all criteria for that grade and all grades below it. Master Meter Error Adjustments WATER SUPPLIED < Enter grading in column 'E' and 'J' > Pcnt: Value: Volume from own sources: +? 5 1, MG/Yr +? MG/Yr Water imported: +? MG/Yr +? MG/Yr Water exported: +? MG/Yr +? MG/Yr Enter negative % or value for under-registration WATER SUPPLIED: MG/Yr Enter positive % or value for over-registration. AUTHORIZED CONSUMPTION Click here:? Billed metered: +? MG/Yr for help using option Billed unmetered: +? MG/Yr buttons below Unbilled metered: +? MG/Yr Pcnt: Value: Unbilled unmetered: +? MG/Yr 1.25% MG/Yr Default option selected for Unbilled unmetered - a grading of 5 is applied but not displayed AUTHORIZED CONSUMPTION:? MG/Yr Use buttons to select percentage of water supplied OR WATER LOSSES (Water Supplied - Authorized Consumption) MG/Yr value Apparent Losses Pcnt: Value: Unauthorized consumption: +? MG/Yr 0.25% MG/Yr Customer metering inaccuracies: +? MG/Yr 1.00% MG/Yr Systematic data handling errors: +? MG/Yr 0.25% MG/Yr Apparent Losses: Real Losses (Current Annual Real Losses or CARL) Real Losses = Water Losses - Apparent Losses: WATER LOSSES: NON-REVENUE WATER NON-REVENUE WATER: = Water Losses + Unbilled Metered + Unbilled Unmetered SYSTEM DATA Unauthorized consumption volume entered is greater than the recommended default value MG/Yr MG/Yr MG/Yr MG/Yr Length of mains: +? miles Number of active AND inactive service connections: +? 6 1,000 Service connection density:? 10 conn./mile main??? Are customer meters typically located at the curbstop or property line? Yes (length of service line, beyond the property Average length of customer service line: +? ft boundary, that is the responsibility of the utility) Average length of customer service line has been set to zero and a data grading score of 10 has been applied Average operating pressure: +? psi Industry Standard (M36) Free Defaults provided ~10 Volume Inputs ~7 System Data Inputs COST DATA Total annual cost of operating water system: +? 5 $1,000,000 $/Year Customer retail unit cost (applied to Apparent Losses): +? 7 $3.50 $/1000 gallons (US) Variable production cost (applied to Real Losses): +? 7 $3, $/Million gallons Use Customer Retail Unit Cost to value real losses awwa.org/waterlosscontrol
23 Training Drivers Auditing Requirement Technical Assistance Validation Planned Use of Audits
24

25 Small System Water Loss Audit Training Phase I 25
26 Water Audit Training Phase 1 Program Overview Kickoff Webinar& Workshop Round 1: Fundamentals Homework Step 1: Practice Audit Workshop Round 2: Reinforce & Next Steps Homework Step 2: Launch Data Protocols & Monthly Team Meetings Workshop Round 3: Reinforcement & Continuous Improvement Homework Step 3: Final Validation with Trainers: Program Completion Submittal of Validated 2012 Audit JUN 2012 JULY 2012 AUG 2012 SEPT - DEC 2012 JAN - FEB 2013 FEB 2013 MARCH

 Discovered production numbers were significantly")

27 Utility Feedback: Discoveries Massive amounts of unbilled usage Found accounts being metered and billed in different units (gallons vs. CCF) Discovered production numbers were significantly off, even though they were calibrating the production meters Water meters are our cash registers and our cash registers need to be functioning properly


28 Utility Feedback: Some of the Biggest Surprises Performing the audit was easier than we originally thought. Apparent vs Real Loss - didn't realize how much could be lost through faulty meters. Amount of money we do not collect Impact of water loss on finances The more money/water will find, the less we may need to borrow for capital projects
29 Utility Feedback: Common Themes We should have been doing this all along We got it over time
30 Training Drivers Auditing Requirement Technical Assistance Validation Planned Use of Audits


31 Critical Importance of Validation California % Texas 2,046 34% % Georgia: Database of 230 Utilities Number of Audits (est) Erroneous Units 15 Negative Water Supplied 4 Negative Water Loss 6 >100% Water Loss 3 ILI <

32 Critical Importance of Validation Quality control for input errors Verification of data grading Uniform adherence to grading matrix definitions Consistent definitions and calculations 32

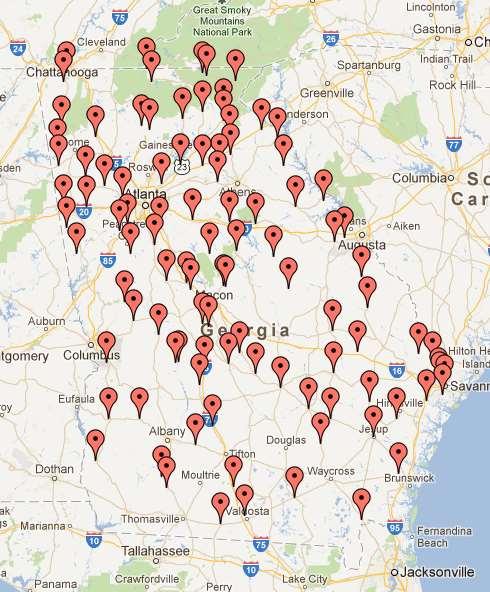
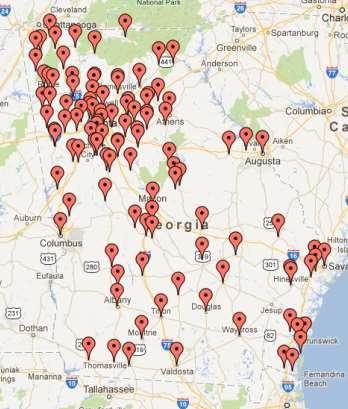
33 Validated Audit Results >200 Validated Water Loss Audits 33
34 Training Drivers Auditing Requirement Technical Assistance Validation Planned Use of Audits


35 Small System Water Loss Technical Assistance Phase II & IIA 100 Projects
 connection 3 Cochran 62 29 2 7 fire hydrant 4 Vienna 77 25 2 7 fire hydrant; valve 4 Clayton 153 30 12 46 hydrant; main; svc;")


36 Small Water Systems Technical Assistance Leak Detection Utility # Utility Total Miles of Main in the system Actual Miles Surveyed # of Leaks Found Total Estimated Leak Water Loss (gpm) Leak Type 1 Butler fire hydrant 2 Byron valve; service (svc) connection 3 Cochran fire hydrant 4 Vienna fire hydrant; valve 4 Clayton hydrant; main; svc; meter; valve 5 Commerce hydrant; main; meter; svc connect 5 McRae fire hydrant 6 Towns County hydrant; svc connection 6 Sylvester fire hydrant; svc connection; main 7 Washington blow-off; hydrant; svc connection 7 Adel fire hydrant; svc connection 8 Cave Spring hydrant; svc connection 8 Swainsboro fire hydrant; svc connection; main 9 Heard County svc connection 9 Rincon fire hydrant; svc connection; main 10 Madison hydrant; main; meter; svc connect 10 Walthourville fire hydrant 11 Savannah fire hydrant; svc connection Utility # Utility Total Miles of Main in the system Actual Miles Surveyed # of Leaks Found Total Estimated Leak Water Loss (gpm) Leak Type 1 Blue Ridge main; svc connection; meter 2 Clarkesville main; svc connection; meter; valve 3 Cornelia hydrant; main; svc; meter; valve 11 Palmetto hydrant; svc connection 12 Tallapoosa main; valve; svc connection Total: Total: 1,

37 Small Water Systems Technical Assistance Phase II Project Summary Production costs include chemical and energy costs often times these are forgotten
 Customer Meter Testing")


38 Phase II Technical Assistance Customer Meter Testing (CMT) Customer Meter Testing UNTESTABLE 6% CMT Global Statistics Summary Displacement Compound/Fireline/Ultrasonic total # meters Pass Fail N/A FAIL 40% PASS 54%


39 Phase II Technical Assistance Finished Water Meter Testing FWMFV Global Statistics Summary total # meters 39 7 Pass Fail Inconclusive total # meters not tested Finished Water Meter Flow Verification PASS UNTESTABLE 18% 33% FAIL 49%


40 Training Drivers Auditing Requirement Technical Assistance Validation Planned Use of Audits


41 Planned Use of Water Audit Results 41


42 Planned Use of Water Audit Results 42


43 Georgia s water loss initiatives are gaining national attention
44 Statewide Water Loss Management Program Model Implementation Phase 1 Establish Annual M36 Water Auditing Phase 2 Phase 3 Achieve Minimum Standard of Audit Reliability Manage Water Loss Performance for Long- Term Reduction Requirement Outreach Training & Tech Asst Implement established requirement for annual M36 Water Audits Educate Regulatory Community on M36 Method and appropriate use of performance indicators Establish Statewide Water Loss Control Committee Develop State Manual and Training Framework Provide extended, progressive training to utilities (funded) Data Management Validation Certification Develop and implement data management system Establish posting system and communication protocols Establish minimum standards of validation for quality assurance Determine by Agency or 3 rd Party Establish validation program until certification program is in place Design and implement a Certified Water Audit program for sustained quality control Statewide Water Loss Control Committee administers certification of individuals Benchmarking Compliance Suite of Performance and Process Measures System specific improvement over time in a cost-effective manner No universal targets Excessive thresholds established Annual audit submission threshold exceedances System specific progress review at permit renewals and extensions Statewide Water Loss Statewide Data Validity Year 1 Year 2 Year 3 Year 4 Year 5 Year 6 Year 7 Resource Management Grade C Resource Management Grade B Resource Management Grade A 44
45 Will Jernigan, PE - Cavanaugh Acknowledgements Jason Bodwell Georgia Environmental Finance Authority Lebone Moeti, PhD Georgia Environmental Protection Division Brian Skeens, PE CH2M HILL
46 Audience Participation! M R S
47