Naim Rasheed, NYCDOT Shakil Ahmed, NYCDOT Luigi Casinelli, HDR. July 18, 2012 ITE Technical Conference
|
|
|
- Ashlynn Norman
- 5 years ago
- Views:
Transcription


1 Naim Rasheed, NYCDOT Shakil Ahmed, NYCDOT Luigi Casinelli, HDR July 18, 2012 ITE Technical Conference 1

2 CEQR Overview/Process Updates to Transportation ti Chapter HCM Model Calibration Tips and Tricks 2
3 NEPA 1969 Requires to evaluate environmental consequences of proposed projects and consider alternatives CEQR 1973 Mayor s Executive Order No. 87 (environmental review of major projects) Mayor s Executive Order No. 91 in 1977 (established CEQR) SEQRA 1975 Article 8 of NYS Environmental Conservation Law NYSDEC promulgated regulations to guide the SEQRA review process (6 NYCRR 617) 3


4 CEQR City Environmental Quality Review Process for review of proposed discretionary actions Purpose is to identify the potential effects on the environment Requires agencies to assess, disclose and mitigate impacts EAS & EIS are disclosure documents used to inform decisions 4
5 DISCRETIONARY, not ministerial i i May affect environment Executed, funded, and/or approved by a city agency Adoption of rules, laws, codes, etc. 5
6 Discretionary Actions Rezoning/Mapping Adoption of regulations Site selections Permits (marine transfer station) Ministerial Actions Building permits Certain licenses 6
7 Type II Type I Unlisted No environmental review is required Actions have no significant Impacts City uses 6 NYCRR Part 617 list Likely Requires an EIS Agencies may add other actions An action that is not Type I or Type II EAS is required EIS may be required 7
8 Lead agency one that can approve, fund or undertake an action and is principally responsible for the environmental review Involved agency one that can approve, fund or undertake an action Interested agency one that lacks jurisdiction to approve, fund or undertake an action, but requests or is requested to participate because of special concerns or expertise 8
9 Land Use, Zoning, and Public Policy Socioeconomic Conditions Community Facilities and Services Open Space Shadows Historic Resources Urban Design/Visual Resources Natural Resources Hazardous Materials Water and Sewer Infrastructure Solid Waste and Sanitation Services Energy Transportation Air Quality Greenhouse Gas Emissions Noise Public Health Neighborhood Character Construction Alternatives 9
10 10
11 11
12 Consolidated Chapter Traffic and Parking, and Transit and Pedestrian Transportation Determination of Transportation Assessment Minimum Development Densities Requiring Transportation Analysis (Table 16-1) Level 1 Screening Assessment (trip generation) Level 2 Screening Assessment (trip assignment) 12


13
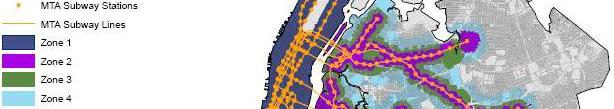
14 Development Type Zone 1 Zone 2 Zone 3 Zone 4 Zone 5 Residential (DUs) Office (1,000 gsf) Retail (1,000 gsf) Restaurant (1,000 gsf) Community Facility (1,000 gsf) Public Parking Facility (No. of new spaces) 14
15 Table 16-2 Examples of Previously Approved and Researched Trip Generation Rates (Weekday and Saturday) Weekday Peak Hour Percentage Land Use Weekday Daily Person Trips AM Midday PM Saturday Daily Person Trips Saturday Peak Hour Percentage Office (multi-tenant type building) 18.0 per 1,000 sf per 1000 sf 17 Residential (3 or more floors) per DU per DU 8 Residential (2 floors or less) 12.6 per DU per DU 8 Hotel oe 9.4 per room per room 9 Home Improvement Store 72 per 1,000 sf per 1,000 sf 10 Supermarket 175 per 1,000 sf per 1,000 sf 9 Museum 27 per 1,000 sf per 1,000 sf 17 Passive Park Space 44 per acre per acre 6 Active Park Space 139 per acre per acre 6 Local Retail 205 per 1,000 sf per 1,000 sf 10 Destination Retail 78.2 per 1,000 sf per 1,000 sf 11 Academic University 26.6 per 1,000 sf 16 NA per 1,000 sf 16 Cineplex 3.26 per seat per seat 5 Health Club 44.7 per 1,000 sf per 1,000 sf 9 Television Studio 10 per 1,000 sf NA NA Daily Vehicle Trips Saturday Daily Vehicle Trips Truck Local Retail 0.35 per 1,000 sf per 1,000 sf 11 Office 0.32 per 1,000 sf per 1,000 sf 11 Residential 0.06 per DU per DU 9 NOTES: NA = Not Available; DU = Dwelling Unit These trip generation rates are for all boroughs. The truck trip generation rates are based on the use of a directional split. 15
16 Traffic Counts Nine-day ATR counts including two weekends Pedestrian verification counts Bicycle - part of classification counts Passenger Car Equivalents (PCEs) Table 16-3 Table 16-3 Passenger Car Equivalents (PCEs) Vehicle Type Vehicle Class PCE Factor Personal Auto Passenger Car Trucks/Buses with 2 Axles and Light Truck 1.5 waste collection vehicles Trucks/Buses with 3 Axles Medium Truck 2.0 Trucks with 4 or more Axles Heavy Truck
17 NYMTC Best Practices Model For projects that would cause major changes in regional and citywide travel patterns. Other Analysis Tools/Methodologies Other software or simulation i models may be employed if: Compatible with air quality models; Provides the same performance measures as the HCM outputs (i.e., levels of service, delays, etc.); and, Demonstrates consistency with the traffic engineering principles and theories of traffic flow as described the HCM. Requires NYCDOT approval prior to utilizing new analysis tools/methodologies 17
18 Person-delay calculation Accounts for the benefits related to the implementation and/or improvements of surface transit (i.e., BRT, SBS) projects. Lower Annual Background Growth Rates Table 16-4 Annual Background Growth Rates Section of the City 1 to 5 years Year 6 and beyond Manhattan 0.25% 0.125% Bronx 0.25% 0.125% Downtown Brooklyn 0.25% 0.125% Other Brooklyn 0.50% 0.250% Long Island City 0.25% 0.125% Other Queens 0.50% 0.250% St. George (Staten Island) 0.50% 0.250% Other Staten Island 1.00% 0.500% 18
19 Determination of Significant Impacts Traffic Eliminated one second impact criteria under LOS F Modified language for Impacts to be considered mitigated Pedestrian Redefined impact criteria for pedestrian elements (i.e., crosswalk, corner, and/or sidewalk) based on a sliding scale for CBD and non-cbd areas 19
20 TABLE SIGNIFICANT IMPACT GUIDANCE FOR CORNERS AND CROSSWALKS NON-CBD LOCATION With-Action Condition Ped. Space Reduction to be No-Action Condition Considered Ped Space Significant Impact (sf/ped) (sf/ped) >26.6 With-Action Condition < to 26.6 Reduction > to 25.7 Reduction > to 24.8 Reduction > to 23.9 Reduction > to 23.0 Reduction > to 22.1 Reduction > to Reduction > to 20.3 Reduction > to 19.4 Reduction > to 18.5 Reduction > to 17.6 Reduction > to 16.7 Reduction > to 15.8 Reduction > to 14.9 Reduction > to 14.0 Reduction > to 13.1 Reduction > to 12.2 Reduction > to 11.3 Reduction > to 10.4 Reduction > to 9.5 Reduction > to 8.6 Reduction > to 7.7 Reduction > to 6.8 Reduction > to 5.9 Reduction > 0.3 < 5.1 Reduction >


21 Parking Inability of a proposed action or the surrounding area to accommodate a project s future parking demand is considered a shortfall not an impact Parking shortfalls in Zones 1 and 2 are not considered significant due to the magnitude of available alternative modes of transportation 21
22 Street Design Manual Identification of feasible and practical mitigation Guided by City DOT s 2009 Street Design Manual Table 16-8 Describes typical traffic mitigation measures The approvals required before including any mitigation in the EIS NYCDOT Street Design Manual s policies that guide the design of certain mitigation/improvement measures 22
23 Table Type of measure Approval required Must follow 511. Low-cost, readily implementable measures Signal phasing and timing modifications DOT Signals Division Parking regulation modifications DOT Borough Engineering Lane restriping and pavement marking changes DOT Highway Design and Construction Street Design Manual Street direction and other signage-oriented changes NYC DOT Traffic Planning Division, Highway Design and Construction, Borough Engineering 512. Moderate-cost, fairly readily implementable measures Intersection channelization improvements DOT Highway Design and Construction Street Design Manual Traffic signal installation DOT Signals Division Intersection Control Analysis 513. Higher-Cost Mitigation Measures Geometric improvements DOT Highway Design and Construction Street Design Manual Street widening DOT Highway Design and Construction Street Design Manual Construction of new streets DOT Highway Design and Construction Street Design Manual Construction of new highway ramps. DOT Highway Design and Construction, Street Design Manual 514. Enforcement Measures Traffic enforcement agents NYPD 515. Trip Reduction or Travel Demand Management Measures Carpooling and vanpooling Staggered work hours and flextime programs Improved bus service New transit services Telecommuting Bicycle/Pedestrian facilities NYS DOT (for State-owned highways) h MTA New York City Transit DOT Highway Design and Construction (if geometric changes are proposed) MTA New York City Transit DOT Office of Bicycle and Pedestrian Programs Street Design Manual (if geometric changes are proposed) 23

24 Minimum Pedestrian Time Pedestrian Walking Speed An average walking speed of 3.5 fps For schools and senior areas, 3.0 fps should be used 24
25 Traffic Monitoring Plan Medium- to large-scale developments that have identified unmitigatible impacts Projects that t propose capital improvements Helps verify the need and effectiveness of the proposed mitigation measures identified in the EIS New York City Local Law 24 (CRIA) A review process in the event of the closure of a publicly mapped street Community Reassessment Impact Amelioration (CRIA) statement is required if a street is closed for more than 180 consecutive days for which a permit from City DOT is needed One public forum must be held prior to the issuance of the CRIA/EAS/EIS 25


26 26


27 27


28 28
29 TIP #1 - Collect the best possible data Latest in traffic data collection technologies Detailed field inventories Peak hour field observations 29
30 30
31 31
32 Trick #1 Meet with NYCDOT Determine required study locations Provide local knowledge Inform Any recent counts - TIMS Placement of ATRs Capture Demand 32


33 Tip #2 Volume Development New MTMC data and ATR data New and historical MTMC data Sinks and Sources Estimated/adjusted traffic volume Graphical presentation and quality check 33
34 Trick #2 Meet with NYCDOT Walk through your balancing/adjustments Peak hours in Manhattan 8:00 9:00 AM 12:00 1:00 PM 5:00 6:00 PM Validation (use historical data, other data) Be conservative and reasonable 34


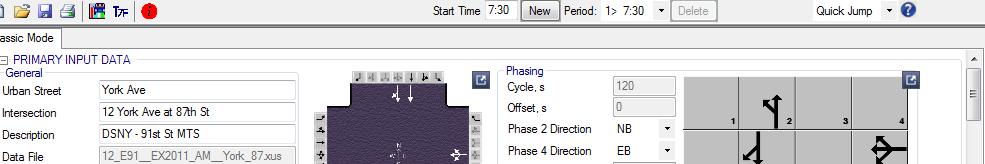
35 TIP #3 - Signal Timings Official signal timing records Traffic signal timing verification Traffic Enforcement Agent (TEA) 35
36 Trick #3 Call NYCDOT Operational and geometric changes Verify before submitting to DOT May M need to change No-Build 36
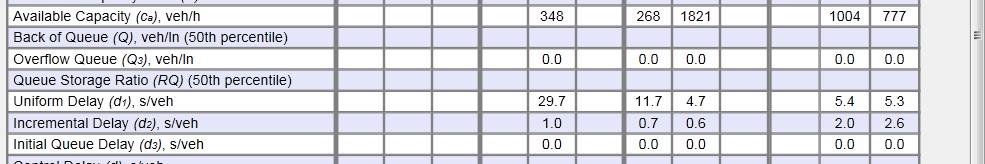
37 TIP #4 - HCS Parameter Adjustments Factors and assumptions for HCS to replicate observed field conditions that are verifiable and quantifiable. Lane group s calculated volume to capacity ratio (v/c) should be less than or equal to 1.05 for existing condition. 37
38 Trick #4 Call/Meet NYCDOT Capacity analysis factor guidelines Discuss unique circumstances Document D all changes 38
39 NYCDOT HCS Guidelines Standing or Queued Vehicles Start-up Lost Time Traffic volumes Saturation Flow Rate Arrival Type Peak Hour Factor (PHF) Area Type Extension of Green Lane width Right-turn and left-turn factors Unmet Demand Right Turn On Red I-factor Conflicting Pedestrians Heavy vehicle percentages Bus Blockages Bus Lanes Parking Maneuvers 39
40 40
.")

41 TIP #5 - Do not use new software until fully tested t HCS 2010 Experience 1. Opposing shared left-through lanes operating with permitted phasing (i.e. not split phase). 2. Unopposed left-turns on major streets. 3. Permitted double-left turns where one lane is a left-only lane and the other is a shared left- through h lane. 41


42 42
43 Conducting video traffic counts in all boroughs Measure gaps under congested conditions NEED Volunteers. Join the ITE Technical Projects Committee! 43
44 Naim Rasheed, NYCDOT Shakil Ahmed, NYCDOT Luigi Casinelli, HDR July 18,