Fueling the Fire of Kaizen throughout the Lean Enterprise. Mark Preston, cell
|
|
|
- Osborn Quinn
- 5 years ago
- Views:
Transcription


1 Fueling the Fire of Kaizen throughout the Lean Enterprise Mark Preston, cell

2 Lean Foundations Elimination of Waste Success Foundation Operational Excellence or Lean is a mindset. It s all about how we can work better together cross functionally and collaboratively to make a difference for our customers, and to make a difference by eliminating waste. It demands excellence in everything we do through our processes and by continuously improving. 2


 Jim")
3 Lean Foundations Some of The History behind Lean: Henry Ford Switched from batch to continuous flow in 1913 (90% improvement) Taichi Ohno Toyota Production System Just in Time and Kanban Deming (Plan-Do-Check-Act) Jim Womack and Dan Jones
4 Lean Principles 1. Specify Value through the Eyes of the Customer 2. Identify the Value Stream (end-to-end process) 3. Identify and Eliminate Waste 4. Make Value Flow at the Pull/Demand of the Customer 5. Create or Enhance Process Flexibility 6. Continuously Improve in Pursuit of Perfection 7. Involve Associates (Cross representation) 8. Create a Visual Management System 9. Do Not Reward Overcoming, Drive Root Cause Elimination 10. Don t Fool Yourself!!
5 The Eight Wastes Type of Waste Definition Example Motion Motion Unnecessary movement of people or information Handoffs of information, poor website design and layout Processing Over-Production Processing Unnecessary process steps or variation of process methods Unneeded audits of information by systems or people Transportation and Walking Defects Over- Production Unnecessary information Excessive reporting, copies, notifications and alerts that do not add value Inventory Waiting Transportation and Walking Walking (people) or routing (information) Routing of AE s/other approvals, inadequate office layout Unused Creativity Defects Quality issues with information or products/ services Verifying, adding, or fixing information on forms or documents Inventory A task waiting to be started (WIP) Inboxes (physical or electronic), electronic work queues, excess catalogs and brochures Waiting Delays and queues System downtime, waiting for approval - Peter Drucker Unused Creativity Time not given for improvement Improvement ideas that are developed but not implemented
 Sales Channels to Market Your Company Suppliers")
6 The Lean Enterprise Value stream is from raw material to final consumer All companies along the value stream comprise the Lean Enterprise The Entire Lean Enterprise must be healthy in order for it to survive Every component of the Lean Enterprise needs to be lean (i.e. continuously improving) Sales Channels to Market Your Company Suppliers


7 Strategy Deployment Process Map Process Mapping - Transformation Plan - Charters Improvement at the Point of Impact!! - Suggestion System Recognition - Celebration - Training - Teaming Sustaining - Report Card Mgt. - SharePoint Mgt. - Visual Management System - Key Performance Indicators Kaizen - Planning - Training - Facilitation of Event - Report out - Mentoring - Plan Do Check-Act
 Executive Team Individual Sales Channel SD Matrix and Sales Support SD Matrix (3yr.")
8 Strategy Deployment Strategy Deployment Process Executive Team SD Matrix (3yr. Breakthrough and Next Year Annual Improvement Priorities) Sales SD Matrix (3yr. Breakthrough and Next Year Annual Improvement Priorities) Executive Team Individual Sales Channel SD Matrix and Sales Support SD Matrix (3yr. Breakthrough and Next Year Annual Improvement Priorities) Sales Team Value Stream, Operations and Support teams Individual, Regional or Vertical SD Matrix (3yr. Breakthrough and Next Year Annual Improvement Priorities) Factory Teams The Purpose of Strategy Deployment: - Communication of Goals throughout the organization - Get everyone involved in Kaizen (Change for the Good)


9 Kaizen Process Value Stream Map Current and Future with Transformation Plan Charter for Kaizen Target and Deliverables Type of Kaizen Std. Work, Kanban, SMED, TPM, ETC. Training Day 1 Benchmarking and Suggestions Implementation Report out with Report Card day Follow up for Sustainment
10 Value Stream Mapping Pacific Steel Pacific Co. Steel Pacific Co. Steel Co. Raw materials Suppliers Weekly delivery C/T = 3.5 second C/O = 15 sec Yield = 99% 1 Person EPE = 4 weeks I Steel Balls 15 days NUT MANUF. 6 - week Forecast Weekly Fax I Raw bolts 10 days C/T = 7.5 seconds C/O = None Yield= 100% 1 Person EPE = Day BOLT Hardening I PRODUCTION CONTROL MRP Weekly Schedule PAINT (NUTS) 5 days 15 days C/T = 6 seconds C/O = 0 Yield = 95% 1 Person EPE = 4 weeks Plts 5 days Bolts 5 days Nuts 90/60/30 day Forecasts Daily Order ASSEMBLY C/T = 15 seconds C/O = 0 Daily Ship Schedule Yield = 98% 2 People EPE= 4 Weeks I 15 days Daily CUSTOMER 80 linkages/mo -40 silver - 20 gold - 20 black Tray 10 Pieces 2 shifts 1X Week SHIPPING Staging 15 days Concurrent work add longest lead-time 5 days 10 days 15 days 15 days 7 sec 15 sec 12 sec 30 sec Production Lead Time = 55 days (3300 sec) Value Added Time = 64 sec.(<1 day)

11 The Three Flows Information Product Time / Value Added


12 Definition of Kaizen To Break Apart To Modify To Change Think Make Good Make Better Change for Better Improvement Continuous Improvement
13 4M s of Operations and Office Plant Operations Man Machine Material Method Training Opportunities Communication Systems TPM Total Preventative Maintenance Cycle Time Autonomation Material Flow / Pull Kanban Replenishment Lead time improvement Process Improvement Standard Work Best Practices Office Man Metrics Missing Method Training Opportunities Communication Systems Key Performance Drivers Windshield and Rear View Mirror Thinking Missing Opportunities Gaps that we need to close Process Improvement Standard Work Best Practices
14 Learning to See Seeing the Whole and the Details

15 Learning to See Going on a Rattlesnake Hunt

16

17 Area and Cell World Class Needs: Non Negotiables No Long Term Handwritten Signs No Outdated, Torn or Non-Laminated Signs No Unpainted Wood or Steel Cables must be all tied and organized No wires on the floor Upon leaving the Cell All tools are on Shadow Boards. The 5-S To-Do List must accompany all 5S audit sheets. Labeling on every designated location Correct any Safety issues immediately Designate a red tag area in the plant and disposition everything within 60 days. Aisle ways are clearly marked and clear at all times. Pallet Jacks, Carts and Forklifts are painted and not scratched Andon Lights must have descriptive signs of meaning. Eliminate Cardboard where ever possible All equipment and benches remain clean and painted. Color coding consistency must exist No Flat Surfaces above 6 ft.

18 Daily Gemba Walk Why can a Sensei take 3 steps into the Factory and say there is no Standard Work? First Impression Area WOW Factor 5-S Culture Everything has a place and Everything is in it s place Closed Loop Systems Visual Management 4 M Control Data Root Cause Counter Measure System Measurement Feedback to the Cell Level Visual Evidence of Ownership and Accountability
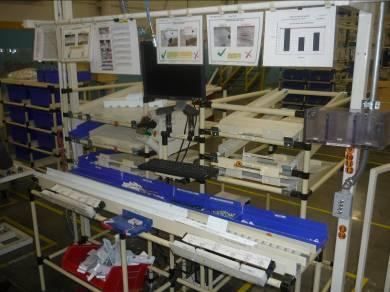


19 Plant Conversion Conveyor Lines to U-Shaped Cells

20 From Lines to Cells Before 28 people producing 280units/hr. in 5000 sq. ft.

21 After 16 people producing 300 units/hr. in 2200 sq. ft. with 2 cells

")


22 5S & Standard Work Assessment Loop System Closed Responsibility Map Monthly Results Summary (Averaged by Plant and Area) Stand. Work Assess. Summary 5S Results Summary Graphs by Cell / Area Primary Area of Responsibility (Color Coded & Person s name and picture) 2 2

23 5s and S/W -- Responsibility Map 5S & SW Top Performers Also Include Auditor Role Picture 2 3 Primary Area of Responsibility Assigned Color Coded with Person s Name & Picture)

24


25 Kanban Events flow to cells Supermarket From Supermarket to Production Cell Kanban mixed: Visual Kanban by bins and Kanban by Cards. Kitting Cars identified by cell and workstations


26


27 Making Product Flow from the Customer Pull

28 ABS in our Value Streams

29

30 Plant KPI Board
")
31 Focused Factory (Value Stream) Level
32 Cell Level Safety Cross 5S Audit 5S Cleaning Roles Std. Work Audit Cell Layout Operator Loading Chart TPM Checklist Kaizen Newspaper Training Matrix Kaizen Report Card Hourly Performance Info. Cell Information Green Color when Target is Met Hourly Comments Assembly Cell Hourly & KPI Board Red Color when Target isn t Met KPI Charts (EQDC) 3 2


33 Lego Plant Layout True scale model Lego Layout

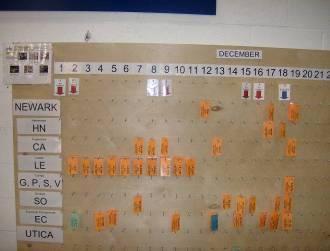
34 Monthly Kaizen transformation Board


35 Lean Leadership Training Lean Leaders Standard Work Seeing the Whole and the Details Lean Leaders Playbook Reference Material 4M Questions and Answers Individual Standard Work


36 2. Kaizen War Room Organization Mobile Cart with all Kaizen Supplies for point of use availability Dedicated Location for Every Part, Every Part in its Location MAINTENANCE


37 1. Employee Ownership Warehouse Rack Responsibility Assignation

38

39

40


41 ABS with Suppliers Sur-Seal Cleaning Station Carts Remove Cabinet Doors Organize No Hidden Waste


42


43
44 Playing a Round of Golf with the Lean Golf Bag for Sales Strategy Deployment Process Mapping Lean Leadership Value Analysis 5-S Kaizen Key Performance Indicators Playbooks Value Stream Management Visual Management Supply Chain Management Root Cause Counter Measure Continuous Improvement Lean Lean Tool bag Solving Problems with the right Club
45 Create High Level Map First SIPOC Company, Value Stream, Team, Job --- Great Place to Start SIPOC Diagram Physical Suppliers Suppliers Information Suppliers Internal Customers External Inputs Processes / Activities Outputs Physical Information Physical Information 4M Opportunities Man Metrics Method Missing Data Box


46 Visual Management Sales Project Board Sales People $10K to $40K $40K to $100K > $100K Week 1 30 Week Week 2 60 Week Week 3 90 Week >90 >90 >3 weeks >90 >3 weeks >90 >90 Opportunity Spec Complete Quote Request Quote Issued Job Awarded Buy Price Issued Hold Order Submittal Required Submital Complete and Forwarded Hold Order w/ Approved Submittal Won Lost

47 Sales KPI Boards 5 Key Performance Visual Indicator Goal vs. Metrics and Trend Actual Owner Root Cause Corrective Action

48 Team Suggestion Board

 Job Playbook 2.")

49 Types of Playbooks For each customer demand level or planned process deviation, there is a Play 1.) Job Playbook 2.) Business Unit Playbook Channel, Value Stream 3.) Product Playbook What is in a Playbook?

50 Results and Accomplishments from Playbooks Unified Message Clear understanding of the Products - - Pros-Cons-Gaps Sales Approach Best Practices Product Portfolio Roadmap Model Best Practice Approaches for each Specifier Type Communication and Connection to the Product Value Streams Checklist 90 Day Plan 50


51 Brainstorm Ideas Clarify Gain common understanding - Eliminate Duplicates Categorize Sort into related Categories Multi-vote Identify Top Priority Items

52 Time-bound Process Map Each day is represented by pink post it Each hour is represented by vertical line Duration for each process steps is represented by the number of post its in relation to the vertical line Takt Time = 1 per month


53 Create Time-bound As-Is Process Map PT = 12 hours Marketing Concept 1 2 LT = 24 hours %C &A = 98% Marcom Manager Platform is Created VA Correct? No Insp Yes New Job Opened PT = 3 hours LT = 16 hours %C &A = 80% Traffic Log new Job Update log Insp Update log and sign Lit code needed? 3 PT = 1 hours LT = 8 hours %C &A = 98% Graphics Draft Copy Created VA Create imagery Assemble 1st Proof Place Sticker/ Log into tracking sys Insp PT = 16 hours LT = 40 hours %C &A = 99% Production Notify External Vendors/ Quote PT =.5 hours LT = 5 hours Total PT = 32.5 hours %C &A = 98% Total LT = 93 hours Insp


54 Process Mapping with Customers


55

56 Lean World

57 Questions?