Chapter #9 TRAVEL DEMAND MODEL
|
|
|
- Jemima Armstrong
- 5 years ago
- Views:
Transcription


1 Chapter #9 TRAVEL DEMAND MODEL

2 TABLE OF CONTENTS 9.0 Travel Demand Model Introduction Overview Study Area Travel Demand Modeling Process The Memphis Model update Demographics and Socio-Economic Data Future year model results Travel Demand Model Integration into the LRTP LIST OF FIGURES Figure 9.1 MPO Study Area and Travel Demand Model Boundary Figure 9.2 Screenline/Cutline Locations LIST OF TABLES Table 9.1 Total Number of Households by County Table 9.2 Total Employment by County Table 9.3 Special Generator Forecasts Table 9.4 Year 2040 VMT by Functional Classification Table 9.5 Year 2040 Screenline/Cutline Volume i
3 9.0 TRAVEL DEMAND MODEL 9.1 Introduction In the development of the Direction 2040 Long Range Transportation Plan (LRTP), the Memphis MPO s Travel Demand Model (TDM) was used to estimate future travel demand and traffic conditions. The travel estimates from the TDM were then used to identify existing and projected deficiencies in the region's transportation system. The TDM was also used as a tool to evaluate the effectiveness of the proposed projects and to assist the air quality conformity determination process. This chapter describes the data and modeling process used by the Memphis MPO Travel Demand Model. 9.2 Overview The TDM is a validated mathematical representation of the regional transportation system and its users' travel behavior. The model estimates the number of trips that will be made, the distribution patterns of the trips throughout the region, the likely mode used for the trips, and the actual roadways and transit lines used for auto and transit trips. Traffic volume projections from these simulations help assess transportation system performance and identify future road and transit needs Study Area The MPO Study Area boundary for the LRTP includes all of Shelby County and the western four miles of Fayette County in Tennessee, and the northern ten miles of DeSoto County in Mississippi. However, for the purpose of more accurately modeling travel conditions in the outlying area around the MPO study area boundary, the TDM boundary is slightly larger than the MPO Study Area, as shown in Figure 9.1. The Model boundary includes all of Shelby County and portions of Tipton and Fayette Counties in Tennessee, along with all of Desoto County and a small portion of Marshall County in Mississippi. West Memphis in Crittenden County Arkansas, although in the same Census Metropolitan Statistics Area, belongs to a different FHWA region and has its own MPO. Crittenden County in Arkansas was not included in the model boundary. The model encompasses an area of approximately 1,825 square miles, with 1,260 square miles in Tennessee and 565 square miles in Mississippi. Approximately 2,400 miles of roadway are included in the 2004 base year model. The roadway network in the Memphis TDM includes all roads of regional significance, including all interstates, freeways, and arterials within the Memphis MPO region. The model also includes collectors and local roads that have heavy traffic volumes or provide connectivity. The transit network in the TDM includes all local and express bus routes and trolley routes operated by Memphis Area Transit Authority (MATA). 9-1

4 Figure 9.1 MPO Study Area and Travel Demand Model Boundary 9-2
5 9.2.2 Travel Demand Modeling Process For traffic analysis purposes, the region is subdivided into 1,237 geographical areas with similar socio-economic characteristics and land use patterns, called Traffic Analysis Zones (TAZ). Housing units, vehicles, commercial and industrial development, schools and universities, and other socio-economic data within each TAZ are aggregated to make the mathematical computation more efficient. In addition, roadway data (such as number of lanes and posted speed) and transit routes data (such as bus stops and frequency) are gathered and used to create a mathematical presentation of the regional transportation network. With the network and TAZ data, the Memphis TDM uses the following four-step process to model travel within the region: Step 1: Trip Generation (How many trips) As the first step of the modeling process, the trip generation step determines the number of trips that will be produced from and attracted to each TAZ. Trips originating from TAZs where people live are referred to as productions. Trips coming into the TAZs where people work or conduct other activities are referred to as attractions. Trips produced from a TAZ will be determined by attributes such as number of households, workers, and students. Trips attracted to a TAZ will be based on the number of employment by various categories, such as retail, office, or service. To more accurately simulate the trip making process, the person trips made internally within the region were modeled for the following nine trip purposes: Journey to work Home-based school Home-based university Home-based shopping Home-based pickup/drop-off Home-based social recreational Home-based other Non-home-based work Non-home-based non-work The model parameters for each of the nine trip purposes are developed from the 1998 Memphis Area Household Travel Survey. These nine trip purposes are carried over from the trip generation step to the mode choice step, as described below. STEP 2: Trip Distribution (Where do trips go) The trip distribution step will determine the trip interchange between TAZ pairs. For example, the shopping trips produced in a residential neighborhood are distributed to other TAZs providing shopping opportunities, and work trips are distributed to all TAZs providing employment opportunities. The Memphis MPO s Model includes a set of multinomial logit destination choice models to simulate traveler s choice of destination. In a Logit destination choice model, a utility value is calculated to represent the traveler s relative satisfaction to a destination zone based on a group of variables such as location proximity and travel time. The probability of a traveler choosing a particular destination TAZ is determined by the utility values in relative to all other potential destinations. 9-3
6 STEP 3: Mode Choice (How do we get there) After knowing where the trips are going, the mode choice step will simulate travelers' decisions on the mode of transportation. People may walk to the work place if it is within walking distance, or take a bus if a bus stop is nearby, or choose to drive a car either alone or with family members or coworkers. Mode choice models are multinomial logit models developed for the same nine trip purposes. The travel modes included in the models were: Non-motorized; Drive-alone; Shared-ride; Walk access bus; Walk access trolley; and Drive access transit. STEP 4: Trip Assignment (Which route to take) During the final step of the four-step modeling process, the vehicular trips are assigned to the roadway and transit network based on the quickest route from origin to destination. The result is a representation of the roadway network with traffic volumes assigned to each individual roadway segment, and of the transit network with a number of passengers on board for each transit route. Travel Model Validation and Approval The Memphis Model was completed in 2007 using TransCAD as the software platform. To validate the base year travel demand model, a series of highway and transit validation and reasonableness checking criteria were used. The majority of these criteria were based on the Model Validation and Reasonableness Checking Manual, Federal Highway Administration (FHWA), The model development underwent an extensive review process through a local steering committee, an expert panel review, and a peer review process. The completed model has also been reviewed and approved by the appropriate State Departments of Transportation, FHWA and Federal Transit Authority (FTA). For more technical details of the TDM and its development and validation process, Technical Memoranda 1 through 12 of the Memphis Model is included in Appendix G. 9.3 The Memphis Model update The existing Memphis MPO Model was completed in Since 2007, the MPO has maintained and updated the TDM to assist the on-going LRTP and Transportation Improvement Program (TIP) amendment process. The existing Memphis MPO Model has a base year of 2004 and a horizon year of 2030 with various interim years of 2008, 2010, 2011, 2014, 2017, and To assist the development of the 2040 LRTP using the current travel demand model, the land use projections and future year forecast capabilities were updated to evaluate the future travel demand and transportation network deficiencies for horizon year 2040 and an additional interim year of Additional information regarding the Memphis MPO Model update is included in Appendix G. 9-4
7 9.3.1 Demographics and Socio-Economic Data Two sets of data are required at the TAZ level to model transportation demand. They include the production related information from the demographic level (household data), and attraction related information from the economic or employment data. The base year 2004 household information was based on the data from the Census The employment data for the base year was primarily based on the private database purchased by the Memphis MPO from InfoUSA. In September 2009, the Memphis MPO began a regional visioning and scenario planning process called Imagine 2040: Mid-South Transportation + Land Use Plan. Imagine 2040 was performed in tandem with the 2040 LRTP process and involved the general public, regional stakeholders and local agencies as well as local community representation to evaluate alternate growth strategies for the region. A vital component of Imagine 2040 was a land use model projecting population and employment growth based on adopted regional growth plans. CommunityViz, an extension of ESRI s ArcGIS software, enabled the MPO staff to allocate projected future household and employment growth throughout the study area, based on a number of suitability factors. Availability (developed v. undeveloped) and suitability for development were two primary suitability factors used to evaluate land at the parcel level. Land suitability represents the likelihood that a parcel will experience growth by 2040, and is based in part on access to public infrastructure and proximity to jobs and services. Certain environmental constraints such as wetlands prevent allocation of growth to underlying parcels. The fine-grained nature of the analysis allowed only the upland portion of a parcel to be assigned projected growth. The model allocates growth in order of most suitable to least suitable land. As part of the Imagine 2040 scenario planning process, participating planners throughout the region collaborated on the identification of two alternative growth visions, a Base Growth scenario and a Centers and Corridors scenario. The Imagine 2040 land use planning effort and the resulting Measures of Effectiveness (MOE) evaluation allowed the MPO s Transportation Policy Board (TPB) and Transportation Plan Advisory Committee (TPAC) to make an informed recommendation regarding which alternative vision best reinforces the local goals and objectives of the region. The TPB and TPAC reviewed the MOE results along with the public outreach activities, the established goals and objectives, and the vision statement (summarized in Chapter 1 - Introduction), prior to concluding that the Base Growth Scenario more closely aligns with desired growth patterns than the Centers and Corridors Scenario. The Base Growth Scenario was approved as the preferred alternative for use in the development of the LRTP by the Transportation Policy Board (TPB) on July 28, This decision allowed the MPO to move forward with the development of a long range transportation plan that responds to the allocation of growth described in the Base Growth Scenario. For more detailed discussion of the land use and scenario planning process, see Chapter 2 - Land Use and Scenario Planning of the LRTP. The CommunityViz model allocates growth to 1/4 mile square grids within the MPO Study Area. Using the allocation results from the CommunityViz model, an integration tool was developed inside the TDM to aggregate the allocation results to the TAZ level, apply the cross-classification distribution, and convert the data to native TransCAD format for the TDM to use. The year 2040 growth data was presented to each local jurisdiction for review and comments. Manual adjustments were made based on the comments from local planners to smooth the data. Demographics and Socio-Economic Data Forecasts for the MPO Study Area The CommunityViz model allocates the growth of total number of households for horizon year 2040 and interim years of 2010, 2017, 2020, 2025, and Table 9.1 summarizes the total number of households by county. Table 9.1 Total Number of Households by County 9-5

8 County \ Year Shelby 346, , , , , , ,762 DeSoto* 44,918 58,685 73,913 80,493 91, , ,803 Fayette* 2,870 4,401 5,015 5,281 5,729 6,177 7,084 * Portion of the county within the Study Area only. The trip generation model and the vehicle availability model of the TDM require stratification of the households into bins for the following four categories: Income stratification, Household size (number of persons), Number of workers per household, and Number of persons under the age of 18. In each category, distribution curves were developed for each TAZ according to the base year (2004) model data. These distributions were assumed to hold true for all future years. Using the numbers for household growth allocated by the CommunityViz model, the distribution curve from the base year was applied at the TAZ level to obtain the number of households in each stratification bin for each future year. The TDM requires employment data grouped by the following six categories: Industrial/Manufacturing, Wholesale/Transportation, Retail, Office, Service, and Government. The CommunityViz model allocates the growth of employment for all future years for the first five categories. It was assumed that there would be no change in government employment in future years. Table 9.2 summarizes the total employment by county. Table 9.2 Total Employment by County County \ Year Shelby 484, , , , , , ,268 DeSoto* 36,091 41,000 47,974 51,533 58,239 66,109 86,238 Fayette* ,068 1,174 1,458 * Portion of the county within the Study Area only. Forecasts for Area outside the MPO Study Area Boundary The CommunityViz model was only developed for the areas inside the MPO Study Area boundary. Since the CommunityViz model does not include the area outside the MPO boundary in detail, the existing household and employment growth forecasts for 2030 developed as part of the original TDM development in 2007 were used to estimate the population and employment for TAZs outside the MPO Study Area. The growth for interim year 2025 was interpolated from the existing year 2020 and 2030 projections. The growth for horizon year 2040 was extrapolated from the existing and year 2030 projections. Special Generators 9-6
9 There are three unique special generators in the Memphis MPO region: Memphis International Airport, the FedEx Hub, and Graceland. The forecast methodology adopted by the existing TDM for the airport demand was based on the Federal Aviation Administration (FAA) forecasts for total airport operations and passenger enplanements. Assuming the same growth rate will continue from 2030 to 2040, the airport person trips for 2040 were extrapolated from the existing year 2030 projections. Similarly, the interim year 2025 person trips were interpolated from the existing 2020 and 2030 projections. Trips in and out of the FedEx Hub were assumed to grow proportionally to the operations forecasted at the airport. The same extrapolation and interpolation methods were used to obtain forecast for year 2025 and For Graceland, the existing TDM forecasts were based on growth data provided by Graceland at an annual rate of 0.89%. This same growth rate was applied to obtain the person trips for Graceland for year 2025 and Table 9.3 shows the future year demand at each special generator. Table 9.3 Special Generator Forecasts Location \ Year Airport 32,000 39,680 48,640 52,480 58,880 65,280 78,080 FedEx ,122 Graceland 2,600 2,739 2,901 2,970 3,086 3,202 3,433 School/University Demand Forecasts School (K-12) and university enrollment forecasts are inputs that must be manually forecast for use in the travel demand model. Since no long-term forecasts were available for school systems in the area, the existing TDM forecasts for educational enrollment were tied closely to the population forecast, along with observed growth at the University of Memphis. Growth was then allocated to TAZs using the existing enrollment in each zone as a guide. For school and university enrollment, the growth for interim year 2025 was interpolated from the existing year 2020 and 2030 projections. The growth for horizon year 2040 was extrapolated from the existing year 2030 projections. External Stations The future year external trips were developed by applying a growth rate to the base year external trips. During the TDM development process in 2007, the growth rates were determined based on a number of different criteria including state, functional class of roadway, historic count data, and historic population growth by census tract inside and outside the model boundary. The same growth rates at each individual external station were used to obtain the external station demand for year 2025 and Model Highway Network Updates Since the completion of the TDM development process in 2007, the Memphis MPO has continued to maintain and update the TDM to assist the on-going LRTP and Transportation Improvement Program (TIP) amendment process. The TDM highway network was updated to incorporate the following changes: Incorporated all regionally significant roadway projects that are completed and opened to traffic from 2004 to Included all committed projects in the current TIP with construction funds allocated. 9-7
10 Chapter 4 - Existing Conditions and Needs Assessment of the LRTP outlines the committed projects in detail. 9.4 Future year model results After incorporating the changes into the TDM, two model runs were conducted to identify the deficiencies of the Existing + Committed (E+C) network at year 2025 (the year for high priority LRTP projects) and 2040 (the year for low priority LRTP projects). For year 2040 model results, the vehicle miles traveled (VMT) were summarized by roadway functional classification and compared with the base year 2004 results as shown in Table 9.4. Assigned traffic volumes across screenlines and cutlines, which help validate traffic volumes from the model, are also compared with the base year 2004 results in Table 9.5. Figure 9.2 shows the screenline and cutline locations. Table 9.4 Year 2040 VMT by Functional Classification 2040 Functional Classification 2004 VMT Model VMT % Difference Freeways 8,781,000 15,515,100 77% Principal Arterials 8,420,700 15,433,400 83% Minor Arterials 7,124,900 12,411,100 74% Collectors 2,653,000 7,108, % Total 26,980,700 50,468,300 87% To help validate traffic volumes from the model, three screenlines and five cutlines were defined, as shown in Figure 9.2. Typically, screenlines follow natural boundaries and barriers, such as rivers, streams, railroad tracks, and access controlled facilities, as deemed appropriate. Cutlines are applied with less rigorous standards, and have been used to capture movements in particular corridors. Assigned traffic volumes across screenlines and cutlinesare also compared with the base year 2004 results in Table 9.5. Table 9.5 Year 2040 Screenline/Cutline Volume Screen Line /Cut Line 2004 Count Total 2004 Model Volume 2040 Model Volume # of Counts % Difference Screenline 1 276, , , % Screenline 2 764, ,688 1,211, % Screenline 3 805, ,391 1,099, % Cutline 1 1,306,195 1,299,488 1,794, % Cutline 2 162, , , % Cutline 3 72,168 90, , % Cutline 4 74,900 69, , % Cutline 5 31,680 29,055 54, % 9-8

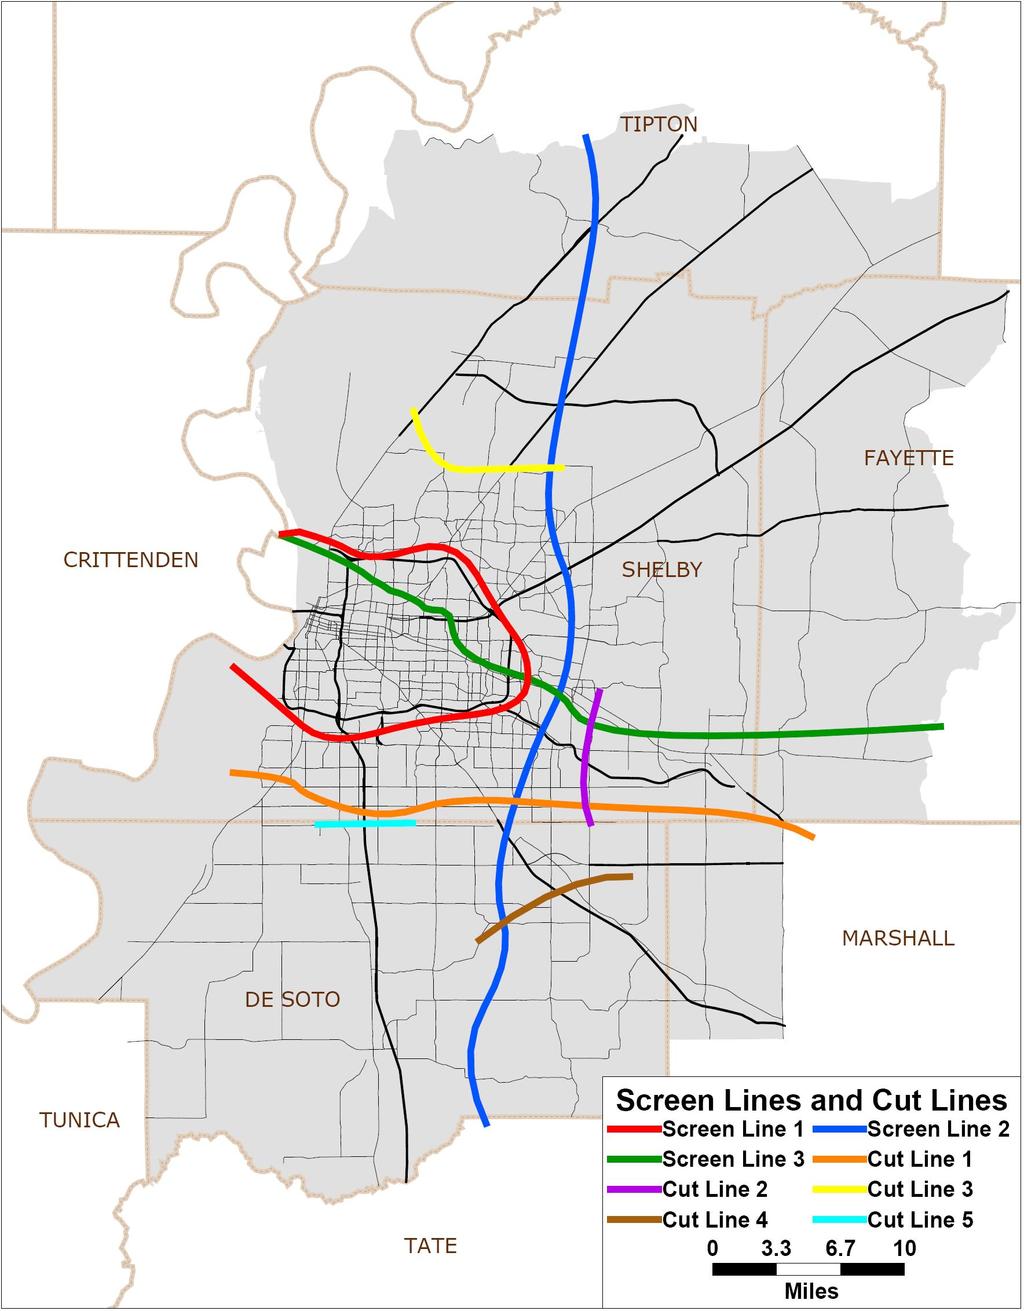
11 Figure 9.2 Screenline/Cutline Locations 9-9
12 9.5 Travel Demand Model Integration into the LRTP The travel demand model is useful for forecasting regional travel patterns for planning purposes. However, due to the macroscopic nature of the regional model, the model does not effectively analyze walking, biking or local street traffic volumes at detailed analysis levels. The Memphis MPO Model was used at various stages throughout the creation of the LRTP. One of the first ways the TDM was used was to identify the congested networks. The maps in Chapter 5 Transportation Strategies show the congested corridors identified using the Model. Identifying the congested areas in our current and future transportation network is the first step in working towards a solution. The Memphis MPO Model was also used to provide information on the effect of proposed transportation improvements. For example, if a road is found to be congested, the Memphis MPO Model can estimate how much that congestion will be reduced by: widening the road way, providing alternative routes, or applying other congestion mitigation strategies such as HOV lanes on the freeway. The outcomes of the improvement strategies can be modeled thereby estimating how much each will reduce congestion. This can be used to aid decision makers with the process of choosing and prioritizing future transportation improvements. Many of the improvements listed in the LRTP were identified by modeling the effectiveness of their potential to reduce congestion. However, the Memphis MPO Model was not the only tool used to evaluate the effectiveness of the projects, and congestion reduction was not the only criterion used to select transportation improvements. Ultimately, the goals and objectives listed in Chapter 1 Introduction served as the guiding principles used for selecting the transportation improvements to be included in the LRTP. 9-10