Mann Avenue Development 87 Mann Avenue Noise Control Study
|
|
|
- Shanon Taylor
- 5 years ago
- Views:
Transcription
1 Mann Avenue Development 87 Mann Avenue Noise Control Study Prepared By: NOVATECH ENGINEERING CONSULTANTS LTD. Suite 200, 240 Michael Cowpland Drive Ottawa, Ontario K2M 1P6 August 13, 2013 Novatech File: Ref: Report # M:\2013\113130\DATA\Reports\Noise\AfterMarkUp29Jul2013\113130MannAve_NCS1.doc
2
3 Noise Control Study Mann Avenue Development (87 Mann Avenue) TABLE OF CONTENTS 1.0 INTRODUCTION BACKGROUND PROJECT DESCRIPTION NOISE SOURCES CITY OF OTTAWA NOISE CONTROL GUIDELINES SOUND LEVEL CRITERIA NOISE ATTENUATION REQUIREMENTS PREDICTION OF OUTDOOR NOISE LEVELS ROADWAY TRAFFIC NOISE LEVEL ANALYSIS NOISE LEVEL RESULTS IMPLEMENTATION CONCLUSIONS... 8 Appendices Appendix A: Sound Level Calculations Appendix B: Acoustic Insulation Factor Tables Tables Table 1: Table 2: Table 3: Table 4: Table 5: Table 6: Table 7: Table 8: Table 9: City of Ottawa Outdoor Noise Level Criteria City of Ottawa Indoor Noise Level Criteria City of Ottawa Noise Attenuation Requirements Traffic and Roadway Parameters Mitigation Results Percentage Window and Wall Area to Room Area Typical Window and Wall Assemblies to Meet AIF Equivalent Sound Transmission Class 9 STC Values Required Noise Attenuation Measures Figures Figure 1: Figure 2: Figure 3: Key Plan Mann Avenue Residential Development Site Plan Mann Avenue Residential Development Receiver Location Plan Mann Avenue Residential Development Plans Grading Plan Noise Control Plan Typical Floor Plan Novatech Engineering Consultants Ltd. 0
 INTRODUCTION This report is submitted on behalf of Black Iris Developments for the Mann Avenue Residential Development, located at 87 Mann Avenue.")
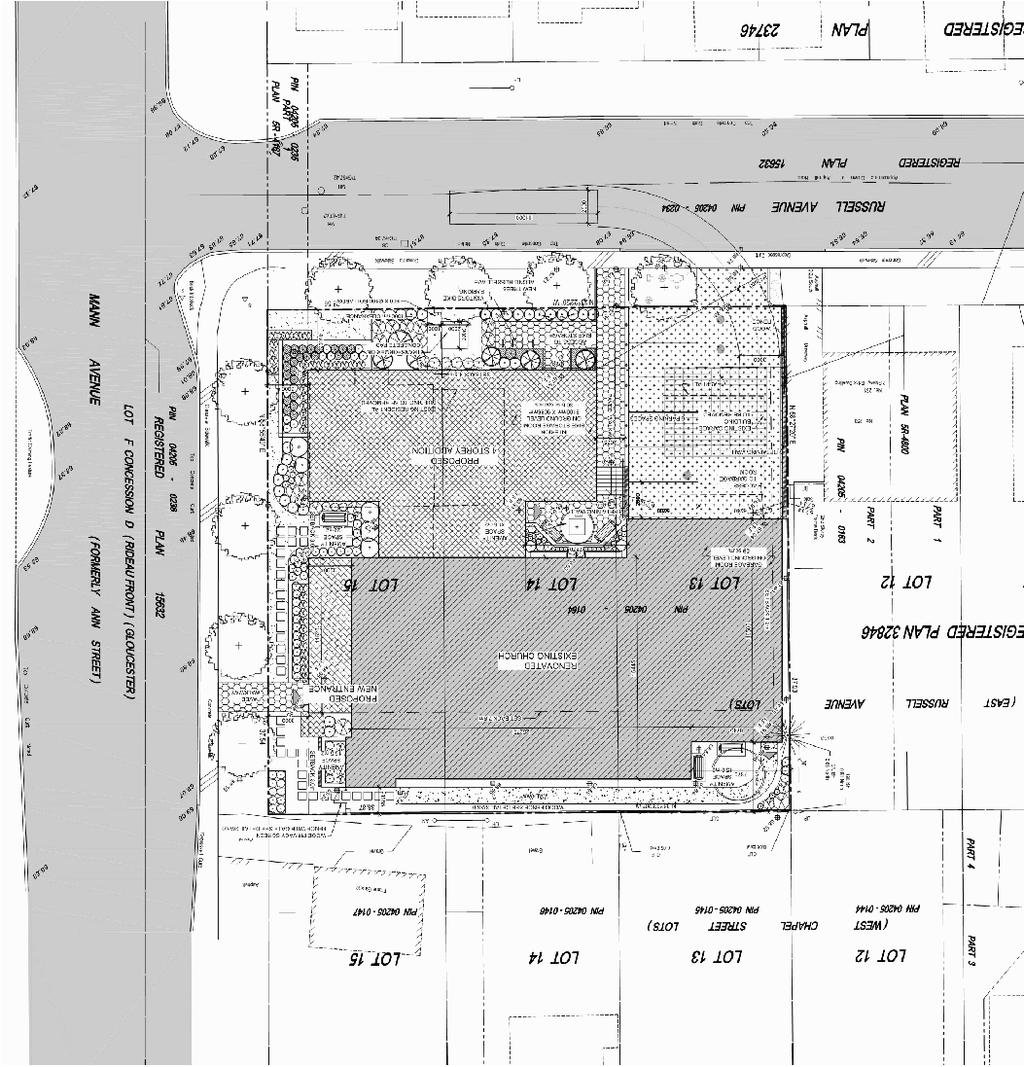
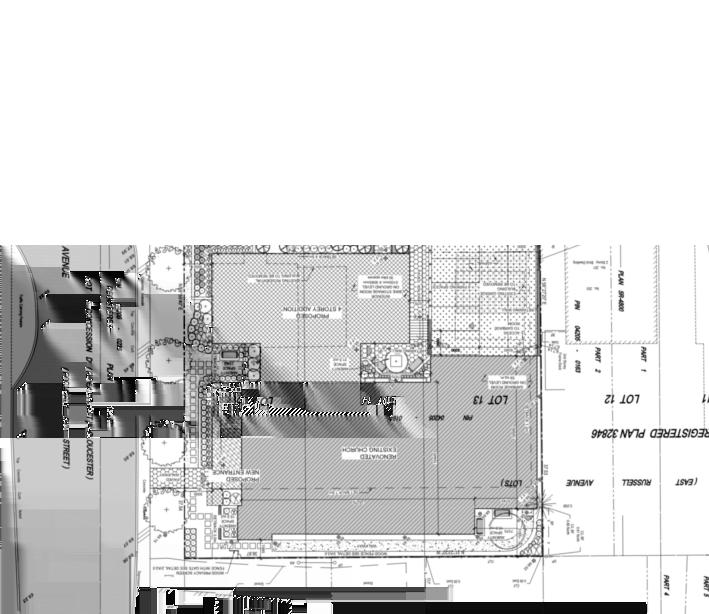
4 Noise Control Study 1.0 Mann Avenue Development (87 Mann Avenue) INTRODUCTION This report is submitted on behalf of Black Iris Developments for the Mann Avenue Residential Development, located at 87 Mann Avenue. The report assesses the impact of traffic noise on the proposed development and outlines the appropriate mitigation measures. 2.0 BACKGROUND 2.1 Project Description Black Iris Developments is proposing a residential development at 87 Mann Avenue in Ottawa. The site has an area of 1,446 m2 (15,564 ft2) and is located at the north9west corner of Mann Avenue and Russell Avenue, as shown in Figure 1 (Key Plan). The building will include 3 stories and consist of approximately 60 residential units with a total of 6 parking spaces as presented in Figure 2 Site Plan. Figure 1 Key Plan 87 Novatech Engineering Consultants Ltd. 1
5
6 Noise Control Study Mann Avenue Development (87 Mann Avenue) 2.2 NOISE SOURCES The City of Ottawa Official Plan stipulates that a noise study shall be prepared when a new development is proposed within 100 metres of an arterial, major collector roadway or bus transitway, 250m of a light rail corridor or highway and 500m of a major 400 freeway series. For the purpose of this report the new development will be analyzed as it is within 100m of collector roads and 500m of the 417 Queensway. Within the area of the proposed site, Schedule F, Section 7, Annex 1965 of The City of Ottawa Official Plan, entitled Urban Road Network stipulates: Mann Avenue: An existing undivided collector road with a protected right of way (ROW) width of 20.2m, consisting of one eastbound and one westbound lane with on street parking and a posted speed of 50Km/hr. Chapel Street: An existing undivided collector road with a protected right of way (ROW) width of 24.3m, consisting of one northbound and one southbound lane with on street parking and a posted speed of 50Km/hr. 417 Queensway: Refer to MOE Noise Control Guidelines. No rail or airport noise affects this site. 3.0 CITY OF OTTAWA NOISE CONTROL GUIDELINES 3.1 Sound Level Criteria The City of Ottawa is concerned with noise from aircraft, roads, transitways and railways as expressed in the City of Ottawa Official Plan (May 2003) since it can affect the quality of life of residents. To protect residents from unacceptable levels of noise, the City of Ottawa has specific environmental noise control guidelines, which are based on the technical guidelines and recommendations prepared by the Ontario Ministry of Environment. The City of Ottawa s Environmental Noise Control Guidelines (ENCG), Final Draft 9 May 10, 2006 has been used for the purpose of this report. The quantitative sound level criteria, which require that specific outdoor and indoor living areas of residential developments meet certain energy equivalent sound levels (Leq), are summarized in Table 1 and Table 2, respectively. Compliance with the outdoor sound level criteria will generally ensure compliance with the indoor sound level criteria when normal construction materials are utilized. Novatech Engineering Consultants Ltd. 2
7 Noise Control Study Mann Avenue Development (87 Mann Avenue) Table 1: City of Ottawa Outdoor Noise Level Criteria Time Period Daytime (07:00 23:00) Outdoor Living Area (OLA) Daytime (07:00 23:00) Nighttime (23:00 07:00) Plane of Window (POW) at Living/Dining Rooms Receiver Location Plane of Window (POW) at Bedrooms/Sleeping Quarter Noise Level Criteria (Leq) 55 dba 55 dba 50 dba The outdoor living area is defined as that part of an outdoor amenity area, which is provided for the quiet enjoyment of the outdoor environment during the daytime period. These amenity areas are typically backyards, gardens, terraces and patios. Table 2: City of Ottawa Indoor Noise Level Criteria Time Period Daytime (07:00 23:00) Receiver Location Living/Dining Rooms of residential dwelling units, theatres, places of worship, school, individual or semi9private offices, conference rooms, reading rooms, classrooms, etc Noise Level Criteria (Leq) 45 dba Nighttime (23:00 07:00) Sleeping quarters of residential units, hospitals, nursing homes, senior citizen homes, etc 40 dba 3.2 Noise Attenuation Requirements When sound levels are predicted to be less than the specified criteria for the daytime and nighttime conditions, no attenuation measures are required by the proponent. As the noise criteria is exceeded, a combination of attenuation measures are available to modify the development environment. These attenuation measures may include: Construction of a noise barrier wall and/or berm; Installation of a forced air ventilation system with provision for central air conditioning; Installation of central air conditioning; Custom building design, construction and/or acoustic insulation. If noise levels are expected to exceed the applicable sound level criteria, the City of Ottawa recommends a warning clause be registered on title. This warning clause serves to alert potential buyers and/or renters of the possible noise condition and of any limitations that may exist on his/her property. The warning clause would be registered on title and incorporated in the Development Agreement and in the Agreement of Purchase and Sale. Novatech Engineering Consultants Ltd. 3
8 Noise Control Study Mann Avenue Development (87 Mann Avenue) Noise attenuation requirements at the Outdoor Living Areas (OLA) and Plane of Window (POW) are outlined in Table 3. Table 3: City of Ottawa Noise Attenuation Requirements Noise Level (dba) Daytime (07:00923:00) Nighttime (23:00907:00) Unattenuated Attenuated Unattenuated Attenuated Noise Attenuation Requirements OLA < 55 OUTDOOR LIVING AREA (OLA) None 55 < OLA < 60 Noise Clause Type A OLA > 60 OLA < 55 Noise Barrier OLA > 60 OLA > 55 Noise Barrier Noise Clause Type B PLANE OF WINDOW (POW) POW < 55 POW < 50 None 55 < POW < < POW < 60 POW > 65 POW > 60 Forced Air Ventilation Noise Clause Type C Central Air Conditioning Noise Clause Type D Building Façade Analysis The wording of the warning clauses to be placed on title and included in the Development Agreement and the Offer of Purchase and Sale are as follows: Type A Purchasers/tenants are advised that sound levels due to increasing road traffic may occasionally interfere with some activities of the dwelling occupants as the sound levels exceed the City s and the Ministry of Environment s noise criteria. Type B Purchasers/tenants are advised that despite the inclusion of noise control features in this development and within the building units, sound levels due to increasing road traffic may on occasions interfere with some activities of the dwelling occupants as the sound levels exceed the City s and the Ministry of the Environment s noise criteria. Type C This dwelling unit is fitted with a forced air heating system and the ducting, etc was sized to accommodate a central air conditioning system. Installation of central air conditioning by the occupant will allow windows and exterior doors to remain closed, thereby ensuring that the indoor sound levels are within the City s and the Ministry of Environment s noise criteria. (Note: The location and installation of the outdoor air conditioning device should be done so Novatech Engineering Consultants Ltd. 4
9 Noise Control Study Mann Avenue Development (87 Mann Avenue) as to comply with noise criteria of MOE Publication NPC9216, Residential Air Conditioning Devices and thus minimize the noise impacts both on and in the immediate vicinity of the subject property. ) Type D This dwelling unit has been supplied with a central air conditioning system which will allow windows and exterior doors to remain closed, thereby ensuring that the indoor sound levels are within the City s and the Ministry of Environment s noise criteria. 4.0 PREDICTION OF OUTDOOR NOISE LEVELS 4.1 Roadway Traffic Noise levels from Mann Avenue, Chapel Street and the 417 Queensway were assessed using the ultimate road and traffic data from Table 1.7 of the City of Ottawa s Environmental Noise Control Guidelines. The traffic and roadway parameters used for sound level predictions are shown in Table 4. Table 4: Traffic and Roadway Parameters Mann Avenue Chapel Street 417 Queensway Roadway Classification 29Lane Collector 9 Undivided 29Lane Collector 9 Undivided 69Lane Freeway Annual Average Daily Traffic (AADT) 8000 veh/day 8000 veh/day 18333/Lane Day/Night Split (%) 92/8 92/8 92/8 Medium Trucks (%) Heavy Trucks (%) Posted Speed 50Km/hr 50Km/hr 100Km/hr 4.2 NOISE LEVEL ANALYSIS The noise levels were analyzed using Version 5.03 of the STAMSON computer program issued by the MOE. Shielding from traffic noise generated by the 417 and Chapel St was inputted into STAMPSON in the form of No of house rows and House density. These values can be seen in Appendix A 9 Sound Level Calculations. Grading was required for the software and were obtained from NCC topographic plans shown on the grading plan contained in the back of this report. Receiver locations used in the noise simulations are shown on Figure 3 Receiver Location Plan. A larger scale plan is included in the back of the report. Novatech Engineering Consultants Ltd. 5
10
11 Noise Control Study Mann Avenue Development (87 Mann Avenue) 4.3 Noise Level Results STAMPSON simulated output noise levels (dba) or total leq (noise level equivalent) from all sources, can be viewed in Appendix A. Chapel St, Mann Ave and the 417 Queensway exceed the allowable noise level criteria, resulting in a required building façade analysis and warning clauses. The predicted noise levels at the selected receiver locations within the development are illustrated in Table 5. Daytime and nighttime noise levels are shown for the plane of window (POW). The receivers for the apartment units were located at the north9east side for the Mann Avenue Building. The balconies do not meet the City of Ottawa OLA criteria (e.g., OLA needs to be a minimum of 4.0m deep per Appendix B59B6 of ENCG). A receiver was placed at the north9east end of said OLA which presents the worst case sound exposure. Table 5: Simulation Results Noise Levels Leq (dba) File Name (R=Receiver) Daytime (POW Living/Dining) Nighttime (POW 9 Bedroom) R1 (Ground Floor) R2 (Third Floor) Implementation The City of Ottawa ENCG requires that noise clauses be applied when noise levels are above 55dBA and wall & window construction be reviewed when noise levels exceed 60 dba. The acoustical insulation factor (AIF) method recognized by the City of Ottawa is used to assess the wall and window requirements. The Acoustic Insulation Factor (AIF) is used as a measure of the reduction of outdoor noise provided by the elements of the outer surface of a building. The difference between the indoor noise criterion and the outdoor noise level establishes the acoustical insulation requirement for the exterior shell. The exterior shell is comprised of primarily two components; windows and walls (patio doors are treated as windows). Novatech Engineering Consultants Ltd. 6
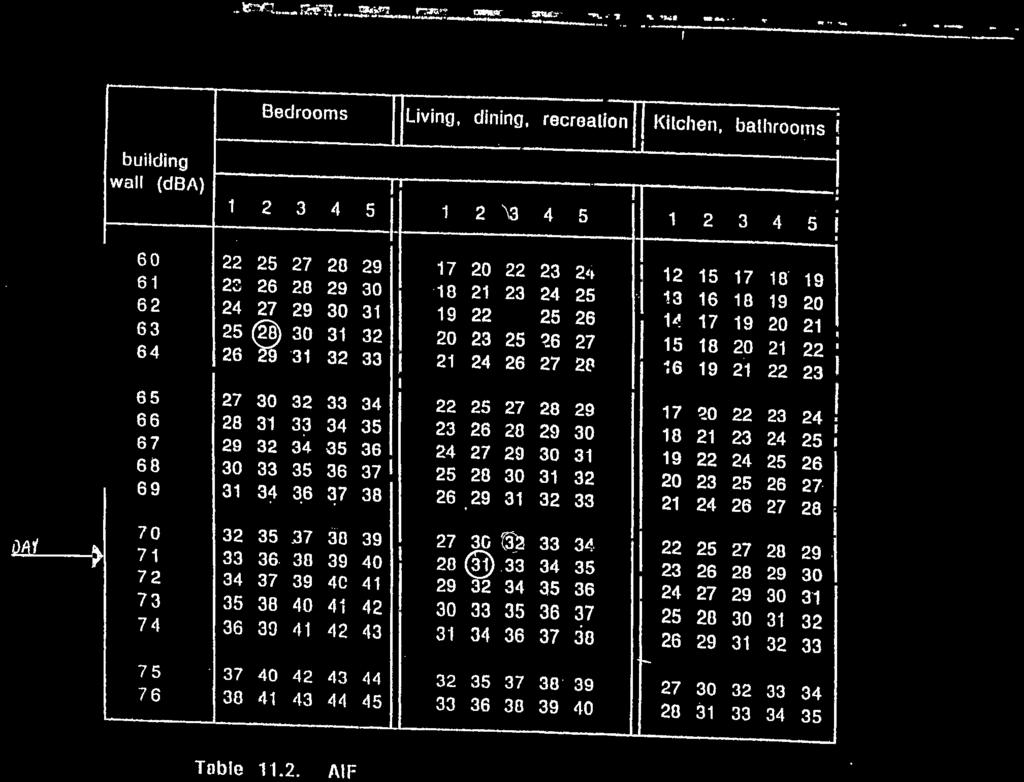
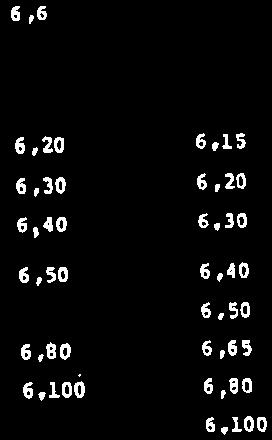
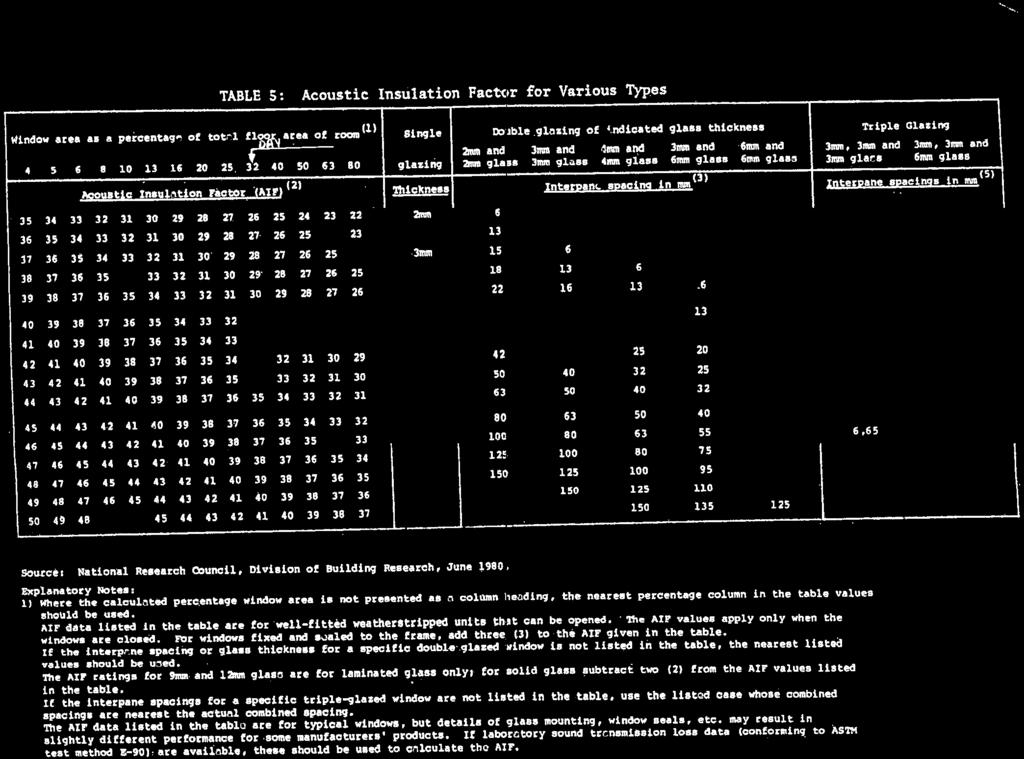
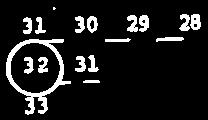
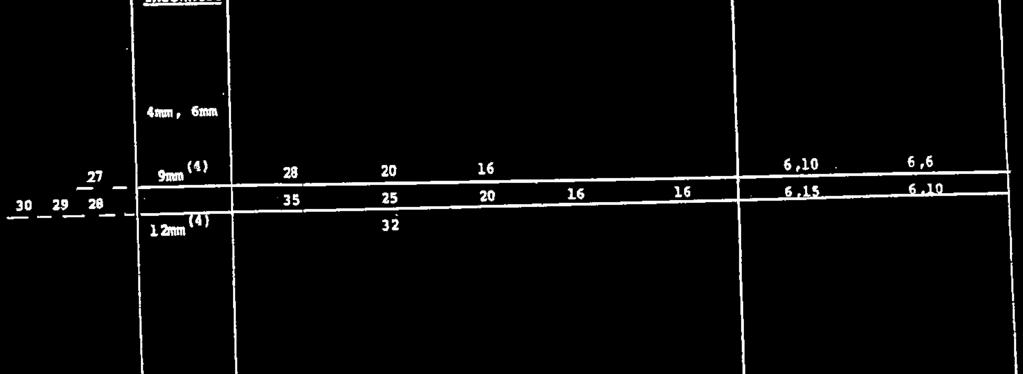
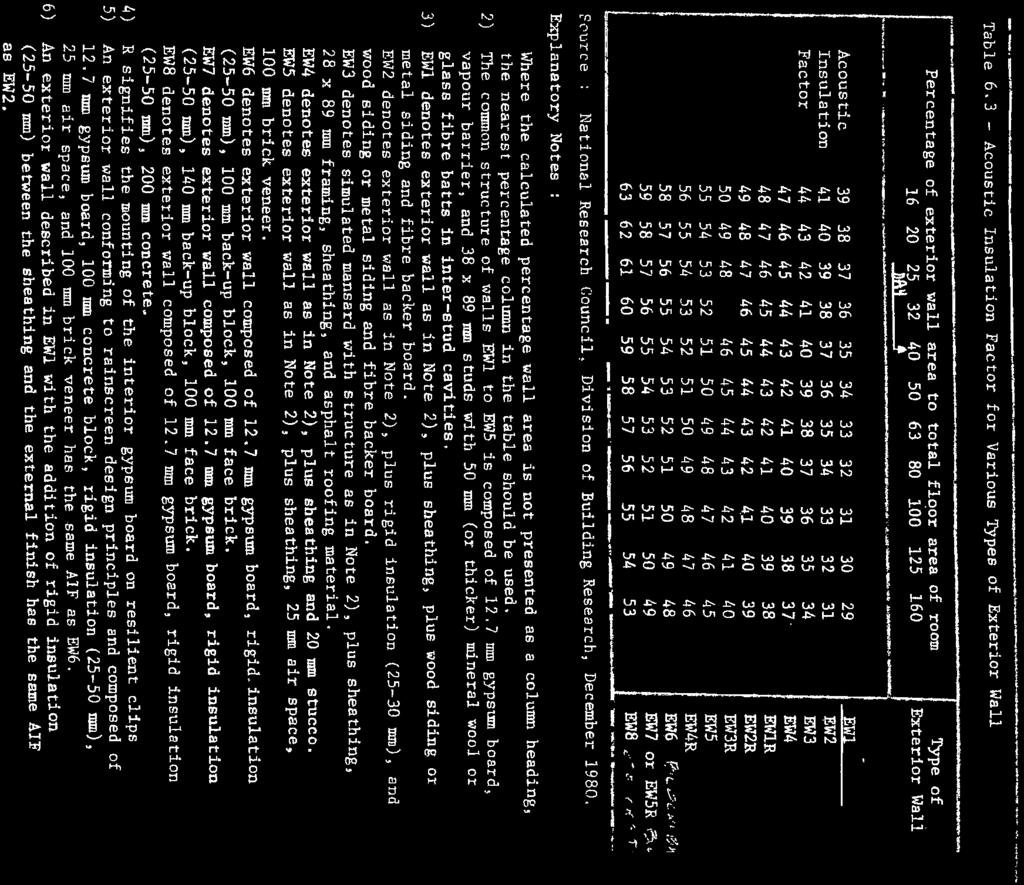
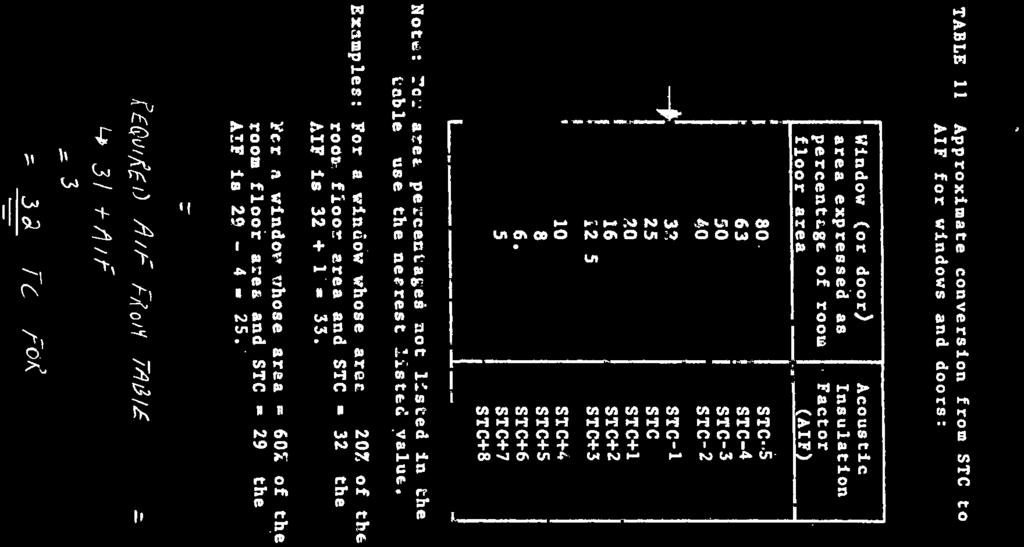
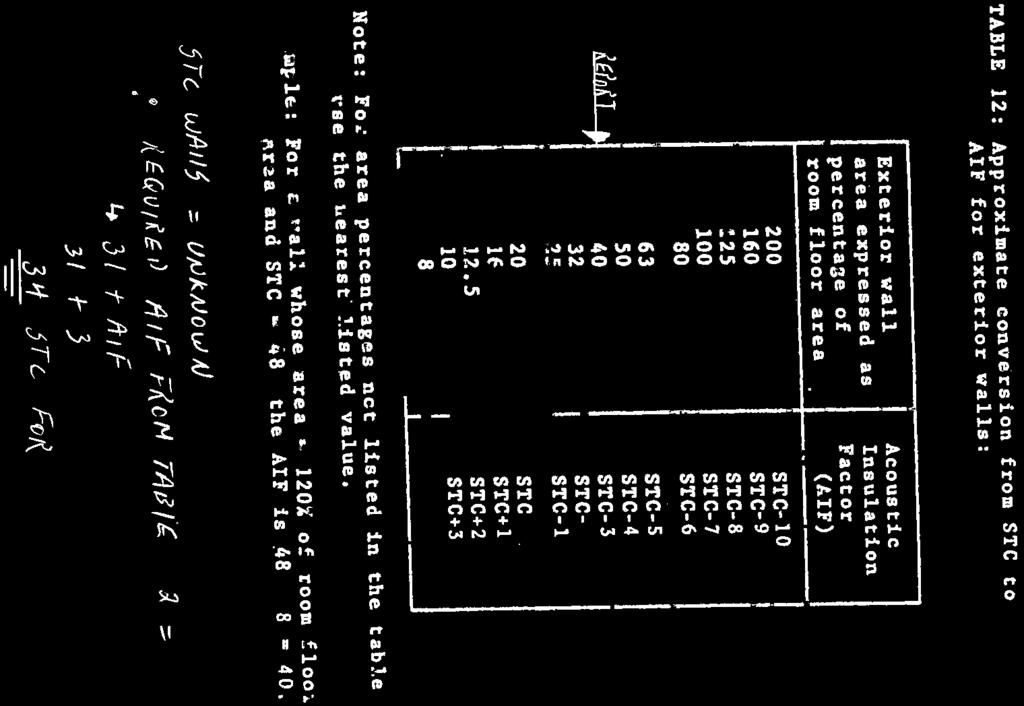
12 Noise Control Study Mann Avenue Development (87 Mann Avenue) Canada Mortgage and Housing (CMHC) Standards 1 require that no component transmit more than 1/N of the total sound power that would give the maximum acceptable noise level inside the room. Thus, in a room with two exterior components, neither should transmit more than one9half of the total allowable sound power. Mathematically, this basic requirement can be expressed as: Required AIF = L eg (Outside) L eg (Inside) + 10 log 10 (N) +2dBA Where, N = Number of components; L = Sound Level expressed on a common decibel scale. The acoustical insulation factor for each of the buildings, day time giving the highest result, is calculated as follows: 87 Mann Avenue; AIF Day9time = 67 dba 45 dba + 10log(2) dba + 2dBA = 27 dba The above value can also be referenced directly from Table 11.2 in Appendix B. Tables from the document entitled Acoustic Insulation Factor: A Rating for the Insulation of Buildings Against Outdoor Noise, produced by the Division of Building Research, National Research Council of Canada, June 1980 (J.D. Quirt) were used to assess the exterior facade against the required AIF. This reference material is included in Appendix B. In order to assess the façade against the required AIF, percentage of window to room area and exterior wall to room area are required. This information was derived from the typical floor plan, which was obtained from the architect and is included in the back of this report. Results are presented in Table 6. Note, the height of windows and walls were extrapolated as typical heights being 1.5 to 2.0m respectively. Table 6: Percentage Window and Wall Area to Room Area Description Number and Type of Components Forming Building Envelope = 2 (Windows and Exterior Walls) Percentage of Window Area to Total Floor Area of Room Percentage of Wall Area to Total Floor Area of Room Values Corner Unit 87 Mann Ave Using the percentage of window area to room area, and the required acoustical insulation factor (AIF), Table 5 in Appendix B was used to identify the various window assembles that would satisfy the required AIF. Similarly, Table 6.3 in Appendix B was used to select the 1 Road and Rail Noise: Effects on Housing, CMHC, Ottawa. Publication NHA #185 1/78, 1978 Novatech Engineering Consultants Ltd. 7
13 Noise Control Study Mann Avenue Development (87 Mann Avenue) typical wall assembly that would satisfy the required AIF. Results of this exercise are provided in Table 7. Table 7: Selected Window and Wall Assemblies to Meet AIF Description AIF Window Assembly Options Typical Wall Assembly Residential Corner Unit 27 2 mm 13 mm 2 mm EW1 Tables 11 and 12 in Appendix B were used to convert the AIF values to Sound Transmission Class, or STC values. Results are summarized in Table 8. Table 8: Equivalent Sound Transmission Class, STC Values Windows Walls 87 Mann Avenue AIF Conversion STC Conversion STC Corner Residential Unit 27 AIF AIF The attenuation measures required to satisfy the City of Ottawa noise criteria and the noise clauses that are to be included on title and in the Agreement of Purchase and Sale for the various dwelling units are summarized in Table Mann Avenue 9 All Table 9 9 Required Noise Attenuation Measures Units Attenuation Measure Notice on Title Central Air Conditioning. Acoustically selected walls and windows for all rooms. D 5.0 CONCLUSIONS An analysis of the roadway traffic along Mann Avenue, Chapel Street and the 417 Queensway indicates attenuation measures will be necessary. The following is a summary of the attenuation measures and noise clauses to be placed on title for all residential units All Units 87 Mann Avenue Provide Central Air Conditioning Provide window assembly to meet a sound transmission class, STC of 28. Provide wall assembly to meet a sound transmission class, STC of 30. Notice on title: This dwelling unit has been supplied with a central air conditioning system which will allow windows and exterior doors to remain closed, thereby ensuring that the indoor sound levels are within the City s and the Ministry of Environment s noise criteria. Novatech Engineering Consultants Ltd. 8

14
15 APPENDIX A SOUND LEVEL CALCULATIONS
16 STAMSON 5.0 SUMMARY REPORT Date: :25:43 MINISTRY OF ENVIRONMENT AND ENERGY / NOISE ASSESSMENT Filename: R1.te Description: Time Period: Day/Night 16/8 hours Road data, segment # 1: Mann (day/night) Car traffic volume : 6477/563 veh/timeperiod * Medium truck volume : 515/45 veh/timeperiod * Heavy truck volume : 368/32 veh/timeperiod * Posted speed limit : 50 km/h Road gradient : 2 % Road pavement : 1 (Typical asphalt or concrete) * Refers to calculated road volumes based on the following input: 24 hr Traffic Volume (AADT or SADT): 8000 Percentage of Annual Growth : 0.00 Number of Years of Growth : 0.00 Medium Truck % of Total Volume : 7.00 Heavy Truck % of Total Volume : 5.00 Day (16 hrs) % of Total Volume : Data for Segment # 1: Mann (day/night) Angle1 Angle2 : deg deg Wood depth : 0 (No woods.) No of house rows : 0 / 0 Surface : 2 (Reflective ground surface) Receiver source distance : / m Receiver height : 1.50 / 1.50 m Topography : 1 (Flat/gentle slope; no barrier) Reference angle : 0.00 Road data, segment # 2: Chapel (day/night) Car traffic volume : 6477/563 veh/timeperiod * Medium truck volume : 515/45 veh/timeperiod * Heavy truck volume : 368/32 veh/timeperiod * Posted speed limit : 50 km/h Road gradient : 2 % Road pavement : 1 (Typical asphalt or concrete) * Refers to calculated road volumes based on the following input: 24 hr Traffic Volume (AADT or SADT): 8000 Percentage of Annual Growth : 0.00 Number of Years of Growth : 0.00 Medium Truck % of Total Volume : 7.00 Heavy Truck % of Total Volume : 5.00 Day (16 hrs) % of Total Volume : M:\2013\113130\DATA\Reports\Noise\AfterMarkUp29Jul2013\Simulations_R1.doc Page 1
17 Data for Segment # 2: Chapel (day/night) Angle1 Angle2 : deg deg Wood depth : 0 (No woods.) No of house rows : 2 / 2 House density : 25 % Surface : 2 (Reflective ground surface) Receiver source distance : / m Receiver height : 1.50 / 1.50 m Topography : 2 (Flat/gentle slope; with barrier) Barrier angle1 : deg Angle2 : deg Barrier height : 4.00 m Barrier receiver distance : / m Source elevation : m Receiver elevation : m Barrier elevation : m Reference angle : 0.00 Road data, segment # 3: QWay_E (day/night) Car traffic volume : 44527/3872 veh/timeperiod * Medium truck volume : 3542/308 veh/timeperiod * Heavy truck volume : 2530/220 veh/timeperiod * Posted speed limit : 100 km/h Road gradient : 3 % Road pavement : 1 (Typical asphalt or concrete) * Refers to calculated road volumes based on the following input: 24 hr Traffic Volume (AADT or SADT): Percentage of Annual Growth : 0.00 Number of Years of Growth : 0.00 Medium Truck % of Total Volume : 7.00 Heavy Truck % of Total Volume : 5.00 Day (16 hrs) % of Total Volume : Data for Segment # 3: QWay_E (day/night) Angle1 Angle2 : deg deg Wood depth : 0 (No woods.) No of house rows : 4 / 4 House density : 38 % Surface : 2 (Reflective ground surface) Receiver source distance : / m Receiver height : 1.50 / 1.50 m Topography : 4 (Elevated; with barrier) Barrier angle1 : deg Angle2 : deg Barrier height : 6.00 m Elevation : m Barrier receiver distance : / m Source elevation : m Receiver elevation : m Barrier elevation : m Reference angle : 0.00 M:\2013\113130\DATA\Reports\Noise\AfterMarkUp29Jul2013\Simulations_R1.doc Page 2
18 Road data, segment # 4: QWay_W (day/night) Car traffic volume : 44527/3872 veh/timeperiod * Medium truck volume : 3542/308 veh/timeperiod * Heavy truck volume : 2530/220 veh/timeperiod * Posted speed limit : 100 km/h Road gradient : 3 % Road pavement : 1 (Typical asphalt or concrete) * Refers to calculated road volumes based on the following input: 24 hr Traffic Volume (AADT or SADT): Percentage of Annual Growth : 0.00 Number of Years of Growth : 0.00 Medium Truck % of Total Volume : 7.00 Heavy Truck % of Total Volume : 5.00 Day (16 hrs) % of Total Volume : Data for Segment # 4: QWay_W (day/night) Angle1 Angle2 : deg deg Wood depth : 0 (No woods.) No of house rows : 4 / 4 House density : 38 % Surface : 2 (Reflective ground surface) Receiver source distance : / m Receiver height : 1.50 / 1.50 m Topography : 4 (Elevated; with barrier) Barrier angle1 : deg Angle2 : deg Barrier height : 6.00 m Elevation : m Barrier receiver distance : / m Source elevation : m Receiver elevation : m Barrier elevation : m Reference angle : 0.00 Result summary (day) ! source! Road! Total! height! Leq! Leq! (m)! (dba)! (dba) Mann! 1.50! 64.34! Chapel! 1.50! 51.60! QWay_E! 1.50! 54.91! QWay_W! 1.50! 55.06! Total dba M:\2013\113130\DATA\Reports\Noise\AfterMarkUp29Jul2013\Simulations_R1.doc Page 3
19 Barrier table for segment # 2: Chapel (day) Barrier! Elev of! Road! Tot Leq! Height! Barr Top! dba! dba! ! 75.50! 48.93! 48.93! 6.00! 76.00! 48.19! 48.19! 6.50! 76.50! 47.50! 47.50! 7.00! 77.00! 46.87! 46.87! 7.50! 77.50! 46.27! 46.27! 8.00! 78.00! 45.71! 45.71! 8.50! 78.50! 45.34! 45.34! 9.00! 79.00! 44.96! 44.96! 9.50! 79.50! 44.62! 44.62! 10.00! 80.00! 44.33! 44.33! Barrier table for segment # 3: QWay_E (day) Barrier! Elev of! Road! Tot Leq! Height! Barr Top! dba! dba! ! 77.50! 53.43! 53.43! 8.00! 78.00! 52.99! 52.99! 8.50! 78.50! 52.56! 52.56! 9.00! 79.00! 52.16! 52.16! 9.50! 79.50! 51.77! 51.77! 10.00! 80.00! 51.40! 51.40! 10.50! 80.50! 51.04! 51.04! 11.00! 81.00! 50.70! 50.70! 11.50! 81.50! 50.36! 50.36! 12.00! 82.00! 50.16! 50.16! Barrier table for segment # 4: QWay_W (day) Barrier! Elev of! Road! Tot Leq! Height! Barr Top! dba! dba! ! 77.50! 53.58! 53.58! 8.00! 78.00! 53.14! 53.14! 8.50! 78.50! 52.72! 52.72! 9.00! 79.00! 52.32! 52.32! 9.50! 79.50! 51.93! 51.93! 10.00! 80.00! 51.56! 51.56! 10.50! 80.50! 51.20! 51.20! 11.00! 81.00! 50.86! 50.86! 11.50! 81.50! 50.52! 50.52! 12.00! 82.00! 50.32! 50.32! M:\2013\113130\DATA\Reports\Noise\AfterMarkUp29Jul2013\Simulations_R1.doc Page 4
20 Result summary (night) ! source! Road! Total! height! Leq! Leq! (m)! (dba)! (dba) Mann! 1.50! 56.74! Chapel! 1.50! 44.01! QWay_E! 1.50! 47.31! QWay_W! 1.50! 47.46! Total dba Barrier table for segment # 2: Chapel (night) Barrier! Elev of! Road! Tot Leq! Height! Barr Top! dba! dba! ! 75.50! 41.34! 41.34! 6.00! 76.00! 40.60! 40.60! 6.50! 76.50! 39.91! 39.91! 7.00! 77.00! 39.27! 39.27! 7.50! 77.50! 38.68! 38.68! 8.00! 78.00! 38.11! 38.11! 8.50! 78.50! 37.75! 37.75! 9.00! 79.00! 37.36! 37.36! 9.50! 79.50! 37.03! 37.03! 10.00! 80.00! 36.74! 36.74! Barrier table for segment # 3: QWay_E (night) Barrier! Elev of! Road! Tot Leq! Height! Barr Top! dba! dba! ! 77.50! 45.83! 45.83! 8.00! 78.00! 45.39! 45.39! 8.50! 78.50! 44.97! 44.97! 9.00! 79.00! 44.56! 44.56! 9.50! 79.50! 44.17! 44.17! 10.00! 80.00! 43.80! 43.80! 10.50! 80.50! 43.44! 43.44! 11.00! 81.00! 43.10! 43.10! 11.50! 81.50! 42.77! 42.77! 12.00! 82.00! 42.56! 42.56! M:\2013\113130\DATA\Reports\Noise\AfterMarkUp29Jul2013\Simulations_R1.doc Page 5
21 Barrier table for segment # 4: QWay_W (night) Barrier! Elev of! Road! Tot Leq! Height! Barr Top! dba! dba! ! 77.50! 45.99! 45.99! 8.00! 78.00! 45.54! 45.54! 8.50! 78.50! 45.12! 45.12! 9.00! 79.00! 44.72! 44.72! 9.50! 79.50! 44.33! 44.33! 10.00! 80.00! 43.96! 43.96! 10.50! 80.50! 43.60! 43.60! 11.00! 81.00! 43.26! 43.26! 11.50! 81.50! 42.93! 42.93! 12.00! 82.00! 42.73! 42.73! TOTAL Leq FROM ALL SOURCES (DAY): (NIGHT): M:\2013\113130\DATA\Reports\Noise\AfterMarkUp29Jul2013\Simulations_R1.doc Page 6
22 STAMSON 5.0 SUMMARY REPORT Date: :30:59 MINISTRY OF ENVIRONMENT AND ENERGY / NOISE ASSESSMENT Filename: R2.te Description: Time Period: Day/Night 16/8 hours Road data, segment # 1: Mann (day/night) Car traffic volume : 6477/563 veh/timeperiod * Medium truck volume : 515/45 veh/timeperiod * Heavy truck volume : 368/32 veh/timeperiod * Posted speed limit : 50 km/h Road gradient : 2 % Road pavement : 1 (Typical asphalt or concrete) * Refers to calculated road volumes based on the following input: 24 hr Traffic Volume (AADT or SADT): 8000 Percentage of Annual Growth : 0.00 Number of Years of Growth : 0.00 Medium Truck % of Total Volume : 7.00 Heavy Truck % of Total Volume : 5.00 Day (16 hrs) % of Total Volume : Data for Segment # 1: Mann (day/night) Angle1 Angle2 : deg deg Wood depth : 0 (No woods.) No of house rows : 0 / 0 Surface : 2 (Reflective ground surface) Receiver source distance : / m Receiver height : 5.50 / 5.50 m Topography : 1 (Flat/gentle slope; no barrier) Reference angle : 0.00 Road data, segment # 2: Chapel (day/night) Car traffic volume : 6477/563 veh/timeperiod * Medium truck volume : 515/45 veh/timeperiod * Heavy truck volume : 368/32 veh/timeperiod * Posted speed limit : 50 km/h Road gradient : 2 % Road pavement : 1 (Typical asphalt or concrete) * Refers to calculated road volumes based on the following input: 24 hr Traffic Volume (AADT or SADT): 8000 Percentage of Annual Growth : 0.00 Number of Years of Growth : 0.00 Medium Truck % of Total Volume : 7.00 Heavy Truck % of Total Volume : 5.00 Day (16 hrs) % of Total Volume : M:\2013\113130\DATA\Reports\Noise\AfterMarkUp29Jul2013\Simulations_R2.doc Page 1
23 Data for Segment # 2: Chapel (day/night) Angle1 Angle2 : deg deg Wood depth : 0 (No woods.) No of house rows : 2 / 2 House density : 25 % Surface : 2 (Reflective ground surface) Receiver source distance : / m Receiver height : 5.50 / 5.50 m Topography : 2 (Flat/gentle slope; with barrier) Barrier angle1 : deg Angle2 : deg Barrier height : 4.00 m Barrier receiver distance : / m Source elevation : m Receiver elevation : m Barrier elevation : m Reference angle : 0.00 Road data, segment # 3: QWay_E (day/night) Car traffic volume : 44527/3872 veh/timeperiod * Medium truck volume : 3542/308 veh/timeperiod * Heavy truck volume : 2530/220 veh/timeperiod * Posted speed limit : 100 km/h Road gradient : 3 % Road pavement : 1 (Typical asphalt or concrete) * Refers to calculated road volumes based on the following input: 24 hr Traffic Volume (AADT or SADT): Percentage of Annual Growth : 0.00 Number of Years of Growth : 0.00 Medium Truck % of Total Volume : 7.00 Heavy Truck % of Total Volume : 5.00 Day (16 hrs) % of Total Volume : Data for Segment # 3: QWay_E (day/night) Angle1 Angle2 : deg deg Wood depth : 0 (No woods.) No of house rows : 4 / 4 House density : 38 % Surface : 2 (Reflective ground surface) Receiver source distance : / m Receiver height : 5.50 / 5.50 m Topography : 4 (Elevated; with barrier) Barrier angle1 : deg Angle2 : deg Barrier height : 6.00 m Elevation : m Barrier receiver distance : / m Source elevation : m Receiver elevation : m Barrier elevation : m Reference angle : 0.00 M:\2013\113130\DATA\Reports\Noise\AfterMarkUp29Jul2013\Simulations_R2.doc Page 2
24 Road data, segment # 4: QWay_W (day/night) Car traffic volume : 44527/3872 veh/timeperiod * Medium truck volume : 3542/308 veh/timeperiod * Heavy truck volume : 2530/220 veh/timeperiod * Posted speed limit : 100 km/h Road gradient : 3 % Road pavement : 1 (Typical asphalt or concrete) * Refers to calculated road volumes based on the following input: 24 hr Traffic Volume (AADT or SADT): Percentage of Annual Growth : 0.00 Number of Years of Growth : 0.00 Medium Truck % of Total Volume : 7.00 Heavy Truck % of Total Volume : 5.00 Day (16 hrs) % of Total Volume : Data for Segment # 4: QWay_W (day/night) Angle1 Angle2 : deg deg Wood depth : 0 (No woods.) No of house rows : 4 / 4 House density : 38 % Surface : 2 (Reflective ground surface) Receiver source distance : / m Receiver height : 5.50 / 5.50 m Topography : 4 (Elevated; with barrier) Barrier angle1 : deg Angle2 : deg Barrier height : 6.00 m Elevation : m Barrier receiver distance : / m Source elevation : m Receiver elevation : m Barrier elevation : m Reference angle : 0.00 Result summary (day) ! source! Road! Total! height! Leq! Leq! (m)! (dba)! (dba) Mann! 1.50! 64.34! Chapel! 1.50! 58.28! * 3.QWay_E! 1.50! 59.42! * 4.QWay_W! 1.50! 59.62! * Total dba * Bright Zone! M:\2013\113130\DATA\Reports\Noise\AfterMarkUp29Jul2013\Simulations_R2.doc Page 3
25 Barrier table for segment # 2: Chapel (day) Barrier! Elev of! Road! Tot Leq! Height! Barr Top! dba! dba! ! 75.50! 58.28! 58.28! 6.00! 76.00! 58.28! 58.28! 6.50! 76.50! 58.28! 58.28! 7.00! 77.00! 55.93! 55.93! 7.50! 77.50! 55.40! 55.40! 8.00! 78.00! 54.49! 54.49! 8.50! 78.50! 53.41! 53.41! 9.00! 79.00! 52.33! 52.33! 9.50! 79.50! 51.32! 51.32! 10.00! 80.00! 50.39! 50.39! Barrier table for segment # 3: QWay_E (day) Barrier! Elev of! Road! Tot Leq! Height! Barr Top! dba! dba! ! 77.50! 59.42! 59.42! 8.00! 78.00! 59.42! 59.42! 8.50! 78.50! 59.42! 59.42! 9.00! 79.00! 59.42! 59.42! 9.50! 79.50! 59.42! 59.42! 10.00! 80.00! 59.42! 59.42! 10.50! 80.50! 59.42! 59.42! 11.00! 81.00! 59.42! 59.42! 11.50! 81.50! 58.88! 58.88! 12.00! 82.00! 58.23! 58.23! Barrier table for segment # 4: QWay_W (day) Barrier! Elev of! Road! Tot Leq! Height! Barr Top! dba! dba! ! 77.50! 59.62! 59.62! 8.00! 78.00! 59.62! 59.62! 8.50! 78.50! 59.62! 59.62! 9.00! 79.00! 59.62! 59.62! 9.50! 79.50! 59.62! 59.62! 10.00! 80.00! 59.62! 59.62! 10.50! 80.50! 59.62! 59.62! 11.00! 81.00! 59.59! 59.59! 11.50! 81.50! 58.97! 58.97! 12.00! 82.00! 58.32! 58.32! M:\2013\113130\DATA\Reports\Noise\AfterMarkUp29Jul2013\Simulations_R2.doc Page 4
26 Result summary (night) ! source! Road! Total! height! Leq! Leq! (m)! (dba)! (dba) Mann! 1.50! 56.74! Chapel! 1.50! 50.68! * 3.QWay_E! 1.50! 51.83! * 4.QWay_W! 1.50! 52.02! * Total dba * Bright Zone! Barrier table for segment # 2: Chapel (night) Barrier! Elev of! Road! Tot Leq! Height! Barr Top! dba! dba! ! 75.50! 50.68! 50.68! 6.00! 76.00! 50.68! 50.68! 6.50! 76.50! 50.68! 50.68! 7.00! 77.00! 48.33! 48.33! 7.50! 77.50! 47.81! 47.81! 8.00! 78.00! 46.89! 46.89! 8.50! 78.50! 45.82! 45.82! 9.00! 79.00! 44.74! 44.74! 9.50! 79.50! 43.73! 43.73! 10.00! 80.00! 42.79! 42.79! Barrier table for segment # 3: QWay_E (night) Barrier! Elev of! Road! Tot Leq! Height! Barr Top! dba! dba! ! 77.50! 51.83! 51.83! 8.00! 78.00! 51.83! 51.83! 8.50! 78.50! 51.83! 51.83! 9.00! 79.00! 51.83! 51.83! 9.50! 79.50! 51.83! 51.83! 10.00! 80.00! 51.83! 51.83! 10.50! 80.50! 51.83! 51.83! 11.00! 81.00! 51.83! 51.83! 11.50! 81.50! 51.28! 51.28! 12.00! 82.00! 50.63! 50.63! M:\2013\113130\DATA\Reports\Noise\AfterMarkUp29Jul2013\Simulations_R2.doc Page 5
27 Barrier table for segment # 4: QWay_W (night) Barrier! Elev of! Road! Tot Leq! Height! Barr Top! dba! dba! ! 77.50! 52.02! 52.02! 8.00! 78.00! 52.02! 52.02! 8.50! 78.50! 52.02! 52.02! 9.00! 79.00! 52.02! 52.02! 9.50! 79.50! 52.02! 52.02! 10.00! 80.00! 52.02! 52.02! 10.50! 80.50! 52.02! 52.02! 11.00! 81.00! 52.00! 52.00! 11.50! 81.50! 51.38! 51.38! 12.00! 82.00! 50.72! 50.72! TOTAL Leq FROM ALL SOURCES (DAY): (NIGHT): M:\2013\113130\DATA\Reports\Noise\AfterMarkUp29Jul2013\Simulations_R2.doc Page 6
28 APPENDIX B ACCOUSTIC INSULATION FACTOR TABLES
29
30
31

32
33
34
35
36