An Overview of the Western Grain Handling and Transportation System
|
|
|
- Nigel Chapman
- 5 years ago
- Views:
Transcription


1 An Overview of the Western Grain Handling and Transportation System Association of Canadian Port Authorities Annual Meeting Thunder Bay, September 8, 2016


2 Total Supply (Western Canada Production and Carry In Stock) * Forecast


3 Where does Western Grain Go? ( ) Total = 50.6 MMT

")
4 Western Canada Traffic ( ) Total = 38.5 MMT


5 Increased Volume and Diversity in Crop Types
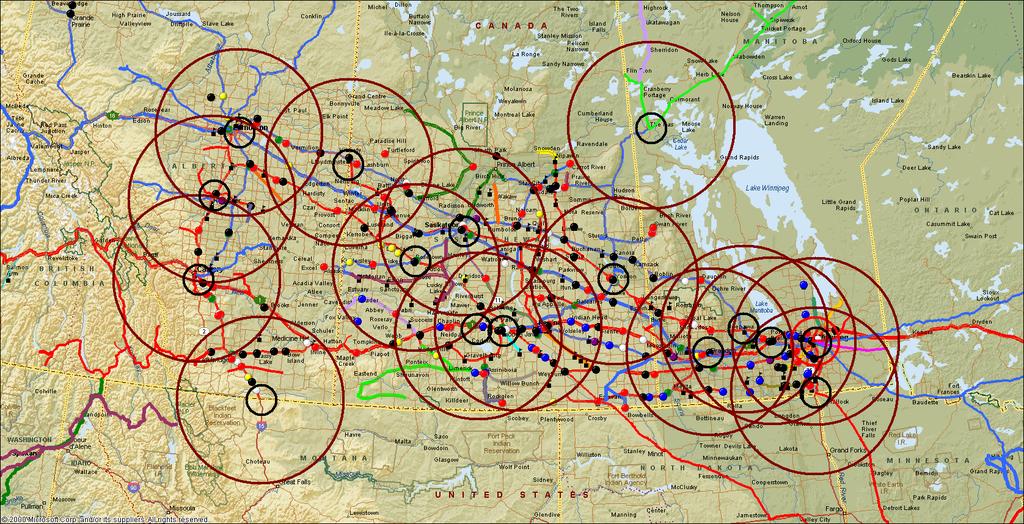
6 Port Terminals Capacity and Location

7 Port Terminals 5 Year Avg. Volumes
8 Capacity at Port 17 facilities at 4 ports in Western Canada with MMT of storage capacity Focus in last five years on throughput capacity Richardson: Increased storage, railcar unloading and ship loading efficiency at Vancouver; increased efficiency at Thunder Bay Viterra and Cargill: railcar unloading and ship loading efficiency All terminals have improved plant throughput efficiency AGT to replace gallery and ship loaders next year 1 new and 1 expanded terminal in Hamilton G3 terminal in planning stages for Vancouver North Shore
 53% are HTP facilities (up from 12% in 1999) 7 new builds on")
9 Capacity in Country Stations from 685 to 271 Facilities from 1,004 to 383 Storage from 7.03 to 7.8 MMT 60% are with the major companies (down from 94%) 53% are HTP facilities (up from 12% in 1999) 7 new builds on stream in next 12 months


10 Shipments from Port: % lower than last year 2.2% lower than 5 year average Last 3 months dropped to TMT weekly from 800+

11 Time in the System (Days)


12 Country and Port Turnover Ratios

13 Railway Car Cycles

14 Railcar Cycles - Western Canada Traffic - days Crop Year YTD 38.2

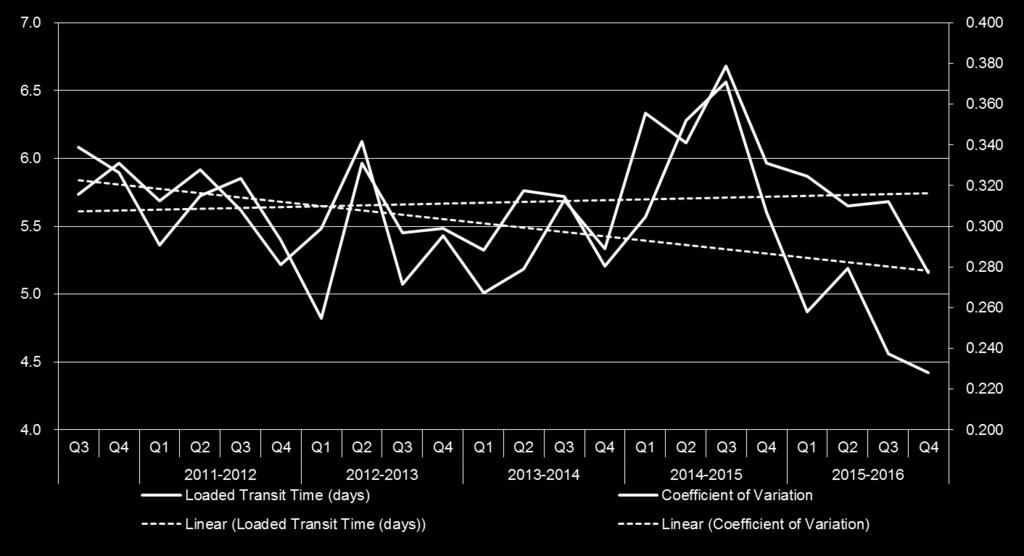
15 Loaded Transit Time


16 West Coast Vessel Lineups Vancouver Prince Rupert 15
17 Issues

18 Average Vessel Time in Port (days)

19 BDI vs. Days in Port

20 Railcar Fleet Size

21 Lifespan of the Covered Hopper fleet
22 What is The Revenue Cap or Entitlement The term Revenue Cap is a misnomer as it does NOT a place an absolute cap on railway revenues. What it does do is: Provide a statutory limit on the amount of revenue a prescribed railway can earn from the movement of regulated grain in western Canada. Provide an effective dynamic control mechanism limiting the amount of revenue per tonne that a railway company may derive from the movement of regulated grain It does not penalize the railways for: Handling more grain; length of haul Inflationary effects
23 Why did the MRE come into force? In the 1990 s: Railways were constrained by inflexibility of maximum tariff regulations set by the CTA and wanted the ability to price differentially. Concern by shippers and producers on the lack of market competition led to the belief that railways needed a control mechanism for rate structures Railways developed the MRE as an alternative means by which rates could be limited using total revenues as a base and having the average rate increasing by a proxy for CPI
24 Under the MRE. The railways have the ability to set rates: To reflect differences in commodity type, geographic location at both origin and destination, the season etc.. To price differentially for the car block size (known as multi car block rates). To differentiate grain movements so as to incent shippers towards specific routes, origins, destinations or seasons, over others. The CTA sets a price index adjusted annually to reflect changes in railway operating costs, which is applied through an agreed upon formula
 Over the period from 1980, when the Crow Rate was still in effect, to 2013, the rail freight has increased from $5/ tonne to over $47.")
25 Rail Freight Rates since 1980 Four rail freight rate regimes have been used over the last 30 years: The Crow rate The Western Grain Transportation Act/ Agency The Maximum rate scale The Maximum Revenue Entitlement - MRE (Rev Cap) Over the period from 1980, when the Crow Rate was still in effect, to 2013, the rail freight has increased from $5/ tonne to over $47.
26 Supply Chain Relationships Generic Supply Chain Model Relationships Money Flow Production/ Manufacturer Transportation Provider Distributor Transportation Provider Distributor End User/ Buyer Canadian Grain Supply Chain Model (Bulk through Grain Company) Producer (Truck (Owned or hired) Grain Company (Country) Railway Port Terminal Shipping Line End User/ Buyer
27 Churchill Currently still in negotiation Discussion over funding model and price For 2016 season, approx. 20,000 MT of applications for CPUP received it wasn t enough 29,500 tonnes of stock in position (reported) Questions: Will they open next year? Who will buy them? Where will the funding come from?
28 Extended Interswitching
29 Canadian Grain Logistics in the Global market Length of haul to port of export Brazil: miles (Truck 90% ++) Australia: miles (Truck 50%/ Rail 50%) United States: miles (Rail 60%+, Truck Barge) Canada: 790 1,150 miles (Rail 95%, Truck 5%) Agriculture dependency on Exports (% of Crop Exported) Brazil: 9% (27 M of 318 M) Australia: 23% (17 M of 74 M) United States: 12% (61 M of 500 M) Canada: 55% (52 M of 95 M) Covers all field crops exported against total grains production) Other Issues Climate Distance to market (Ocean) Relative market position (size)

30 Global Competition The average price of wheat back to the producer has been gradually decreasing All time low in 2016 Partially reflective of productivity; Partially of increased global competition To compete globally, Canada must have the most efficient grain supply chain
31 Thank You 9/9/2016