CIF Project 377 Promotion of Expanded Recycling Program & Distribution of Large Curbside Containers Final Report
|
|
|
- Clare Price
- 5 years ago
- Views:
Transcription

1 CIF Project 377 Promotion of Expanded Recycling Program & Distribution of Large Curbside Containers Final Report January 23, 2013 Submitted by: Jennifer Wilson, Supervisor, Waste Management Public Works & Environmental Service 183 Main Street of Delhi, Delhi ON N4B 2M or Ext 1503 Page 1
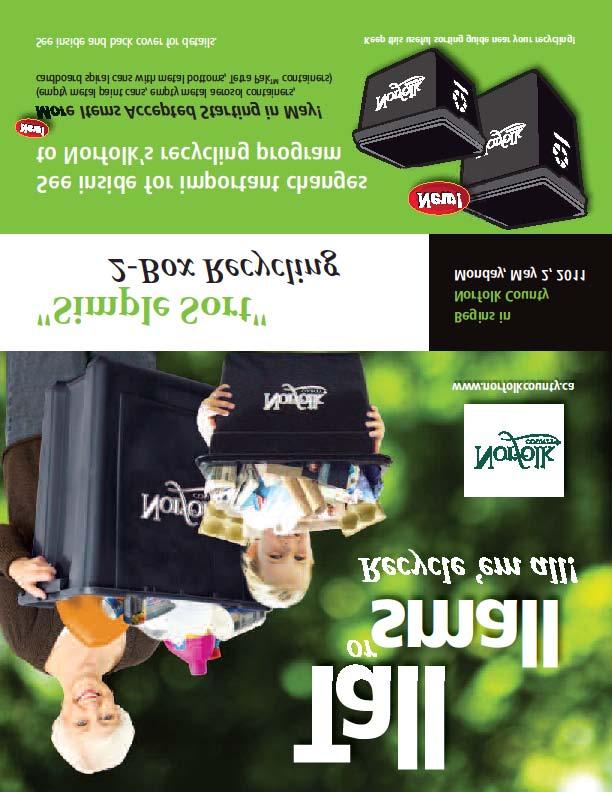
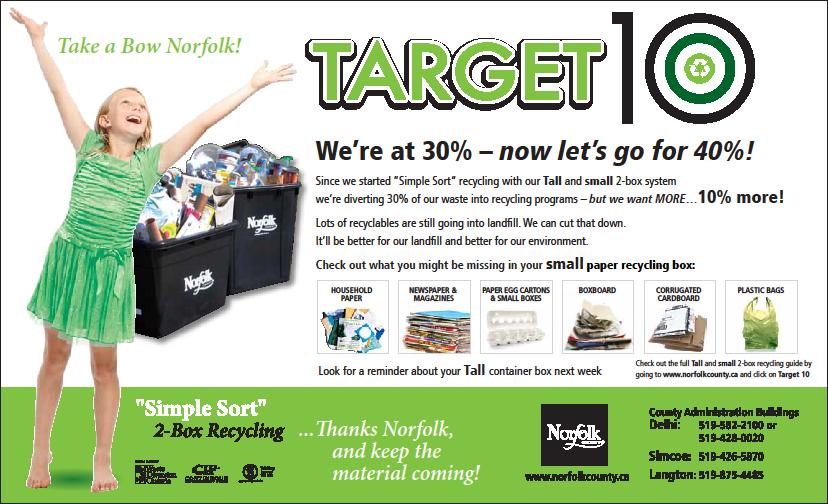
2 Project Background Prior to this project, Norfolk County s curbside recycling box collection provided one box to each household and collected recyclables through a six stream sort at the curbside. Residents placed comingled containers in the recycling box, placed newspapers in a plastic bag to be set beside or on top of the recycling box. Boxes of boxboard, bags of plastic bags and bundled corrugate cardboard were to be set beside the box. In 2010 the diversion rate as reported via WDO data call was 29.43%. In April 2011, a second larger recycling box was delivered to each household in Norfolk County to create a two stream collection system. The intent was to make the sorting and preparation for collection easier for residents and make a simpler curbside sort for the collector. The hope was that this change would increase the capture of all materials. Residents were instructed to use the new taller 22 gallon box for recyclable containers and their existing smaller (16 gallon) recycling box for paper fibres recycling. The additional larger container was to provide double the storage capacity for recyclables thereby providing sufficient space for large plastics and containers as well as the addition of any new container materials. The official launch date to start using the new simple two stream sort recycling program called Simple Sort was May 2, The new boxes had the County logo hot stamped on the front and sorting information on the opposite side of the box. Black boxes were used to match the existing recycling boxes already being used. Study Overview The project was initiated in March 2011 with collection starting May 2, The new program was designed to include new materials for collection and provide increase diversion from landfill of recyclable materials while providing additional storage capacity for residents. The project consisted of a three phase implementation: initial promotion & education (P&E)campaign, larger box distribution, and maintenance P&E campaign approximately one year after implementation. It was anticipated that these changes would increase the recovery of recyclables by 10%. Resources utilized to achieve the project included media consultant, logistics and distribution company, graphic designers, existing customer service staff to handle inquiries, media relationships and summer student labour for miscellaneous follow up deliveries. Methodology Initial Campaign A P&E campaign was launched to explain the reason for the change in collection method, the new recyclables targeted for collection and to explain how to use the new and existing recycling box. Tactics used for the P&E campaign included newspaper and radio advertisement, website notices, radio Page 2
3 interviews, recycling box brochures, magnets, and press releases. Examples are attached in Appendix 2 of this report. Larger Recycling Boxes In April 2011, a second larger recycling box was delivered to each household in Norfolk County. The taller 22 gallon box was to be used for recyclable containers, and residents were instructed to use their existing smaller (16 gallon) recycling box for paper fibres recycling. The official launch date to start using the new simple two stream sort recycling program was May 2, The new boxes had the County logo hot stamped on the front and sorting information on the opposite side of the box. Black boxes were used to match the existing recycling boxes already being used. Maintenance Campaign It is typical for people to become lackadaisical in their recycling performance following a burst of activity prompted by a change in the program. For that reason, the media consultant advised that it is a best practice to engage them at periodic intervals to remind them to maintain their improved behaviour. Norfolk s campaign was intended to remind the residents of Norfolk County of the importance of recycling all of the materials accepted in the recycling program. A three week campaign was designed and rolled out. Instead of describing all of the materials accepted in the program, this follow-up campaign showcased specific materials or groups of materials and explained how a 10% increase could be achieved. It is well known that the presence of any recycling related promotion will prompt people to recycle more of everything. Monitoring for Success Recyclables collected were measured by incoming tonnage monitored on a monthly basis. The monthly tonnage reports were compiled from the weigh scale tickets for the collection trucks. The reports are compiled by the contractor and submitted to the County with the original weigh scale tickets. Monthly tonnages were compared month over month and an average monthly increase was calculated. Calls into the customer service staff were also monitored to ensure that changes in customer service call activity were not related to confusion over the changes to the recycling program. Staff also planned to keep in contact with the collection crews to ensure recyclable were being set out as instructed in the P&E campaign. Summary of Results Performance Outcomes 1. A decrease in net annual blue box program costs was anticipated. This did not happen. Costs actually increased due to new processing contract costs. 2. A 10% increase in capture of recyclables materials was anticipated. This did happen. See Figure 1 below for a month by month tonnage report. Page 3
4 As a result, Norfolk s diversion rate increased GAP Diversion Rate* was 29.43% and 2011 GAP Diversion rate was 32.23%. Recycling tonnage collected in 2010 was 4400 MT and in 2011 it was 4879 MT or 11%. * The GAP Diversion Rate reflects diversion achieved through all of the municipality's diversion programs (i.e. not solely recycling). 3. Cost effectiveness (cost per tonne of marketed recyclables) decreased as was anticipated. This was due to the increased cost per tonne to process the expanded list of targeted recyclables. 4. Successful adaptation to changes in the material mix was anticipated. Call records showed a reduction in the number of calls from residents from 2010 to 2012 overall, a portion of which would represent calls regarding collected materials. Meaning resident where not confused by the changes. Collection staff reported that the large majority of the residents were using the new box, including the new materials and sorting and setting out the material correctly. 5. Multi-municipal coordination was planned and was successful. Information and resources were shared with Haldimand County. Haldimand County was able to use and continues to use Norfolk s processing facility for their material on an as needed basis since both municipalities converted to the same number of recycling streams. 6. A payback was anticipated to be achieved through an increased diversion rate to contribute to increased WDO funding in 2013 along with other factors. 7. Project timelines were accurate for majority of the project. The timing of the maintenance campaign was adjusted slightly to avoid competition with other waste management program changes that were being communicated at that time. Impact A tonnage report is provided below in Figure 1. It shows a comparison of recycling tonnages from 2010 to both 2011 and The project success of the program was measured by comparing the monthly tonnages collected before and after the distribution of the boxes and promotional campaigns. Two boxes are now used to collect material that was placed in and beside the recycling boxes. Second box reduces the fugitive material on collection day from previous materials that were set beside the box, although many residents were already using additional containers to set out their recyclables. Since the launch of the Simple Sort two stream recycling program 19 months ago: There was a significant increase in tonnage in the first two months after the launch: from May and June There was an increase in tonnage in all but 2 month of the 19 months. Increases in year 2 were not as significant as first 12 months of the program, but year 2 tonnages were still above 2010 levels. Average monthly increase from 2010 levels were 11.2% since May Increase in tonnage from 2012 were achieved after October following the maintenance campaign. Page 4
5 Figure 1. TONNAGE (MT) Jan Feb Mar April May June July Aug Sept Oct Nov Dec A more detailed tonnage report can be found in Appendix 1. Learnings Figure 1: A comparison of 2010, 2011 & 2012 Recycling Tonnages, focusing on differences after implementation of 'Simple Sort' The maintenance promotional campaign was intended to be conducted in May, but it was moved to September. After discussing it with the media consultant, who was working with us on this project, and due to the timing of other waste management programs at the County, we decided to amend the schedule of the maintenance campaign for the Simple Sort. Three other waste management programs were being promoted and advertised in May including one new brand new program. With four competing waste related messages the maximum return on the investment would not be realized for the Simple Sort promotional maintenance campaign. We rescheduled the maintenance campaign for September to avoid information overload and waste management fatigue for residents. For more information about this project, please contact: Jennifer Wilson, Supervisor, Waste Management Public Works & Environmental Service 183 Main Street of Delhi, Delhi ON N4B 2M or Ext 1503 Page 5
6 Appendix 1. FIGURE 1 Simple Sort' Evaluation by Tonnage Simple Sort' begins in May 2011 Jan Feb Mar April May June July Aug Sept Oct Nov Dec Green shading indicates increase tonnage from before Simple Sort 2 stream % Diff 2010 to % Diff 2011 to TONNAGE (MT) Jan Feb Mar April May June July Aug Sept Oct Nov Dec Figure 1: A comparison of 2010, 2011 & 2012 Recycling Tonnages, focusing on differences after implementation of 'Simple Sort' Page 6


7 Appendix 2 Attached is the Maintenance Campaign. The previous submission to CIF included the original box delivery plan and the promotional campaign. Below are some of examples of the promotion and education materials. Page 7
8 Page 8