Final. Project Summary Report
|
|
|
- Randolf Golden
- 5 years ago
- Views:
Transcription


1 Final Project Summary Report February 2017
2 TABLE OF CONTENTS PROJECT SUMMARY REPORT FINAL Prepared for: FDOT District 5 Prepared by: Parsons Brinckerhoff, Inc. March 2017 i February 2017
3 TABLE OF CONTENTS Table of Contents 1.0 INTRODUCTION Purpose of Report Study Documents Purpose and Need Goals and Objectives Evaluation Methodology Initial Transit Mode Screening Methodology Screening Results Corridor Screening Analysis Initial Build Alternatives Initial Build Alternative #1 - Express Bus to Orlando and DeLand Initial Build Alternative #2 - I-4 Commuter Rail from DeBary Station Initial Build Alternative #3 - I-4 Express Bus from DeBary Station Initial Build Alternative #4 - U.S. 17/92 and DeLand Station BRT Initial Build Alternative #5 - I-4 Commuter Rail via S.R Initial Build Alternative #6 - I-4 Express Bus via S.R Public Alternative - U.S. 92 Commuter Rail Initial Build Alternatives Evaluation Summary of Initial Build Alternatives Analysis Refined Alternatives Analysis Description of Refined Alternatives Evaluated Summary of Refined Alternatives Evaluation IMPLEMENTATION STRATEGY Overview Additional Studies Assessment of FTA Rating Criteria for Smaller Project Reevaluate Other Corridors Over Time Transit Improvements ii February 2017
4 TABLE OF CONTENTS Identify New Funding Sources Local Bus Service Improvements Integrate Transit Priority and Stop Improvements into Roadway or Development Projects Develop New Transit Centers and Initial Park-n-Rides Premium Bus Service Implementation Acquire Land and Develop Commuter Rail Land Development Need for Increased Density Land Development Strategies TOD Assessment Potential Next Steps List of Tables Table 2-1. Goals and Objectives for Volusia Transit Connector Study Table 2-2. Transit Mode Screening Evaluation Criteria Table 2-3. Transit Mode Screening Criteria Scoring Matrix Table 2-4. Transit Modes Eliminated from Further Evaluation Table 2-5. Transit Modes Retained for Further Evaluation Table 2-6. Project Goals, Objectives and Initial Corridor Screening Measures Table 2-7. Corridor Screening Measure Thresholds Table 2-8. Initial Corridor Screening Results Table 2-9. Initial Build Alternatives Screening Thresholds Table Initial Build Alternatives Screening Results Table Initial Build Alternatives Screening Results Scoring Table Initial Rail Alternatives Comparison Table Initial Bus Alternatives Comparison Table Station Locations and Access Mode Table Parcels Impacted - Refined Build Alternative # Table Refined Build Alternative #4 ROW Cost Estimate Table Refined Build Alternative #5 Baseline and S.R. 472 Option ROW Cost Estimate iii February 2017
5 TABLE OF CONTENTS Table Refined Build Alternative #5 I-95 Undercrossing ROW Cost Estimate Table Refined Build Alternatives Capital Cost Estimates Table Refined Build Alternatives O&M Cost Estimates* Table Refined Build Alternative #4 - Daily Ridership Results Table Refined Build Alternative #5 Daily Ridership Results Table Transit Signal Priority Assessment for U.S. 17/92 and U.S Table Summary of Environmental Evaluation of Refined Alternatives Table FTA Project Justification Criteria Summary for Refined Build Alternatives Table 3-1. Applicability of Local Funding Options for Transit Table 3-2. Transit Mode Applicability vs. Development Density Table 3-3. Development Density around Commuter Rail Stations Table 3-4. TOD Readiness Assessment Summary List of Figures Figure 1-1. Study Area Figure 2-1. Results of PAG Survey, Issues and Needs Figure 2-2. Top Three Purposes from PAG Survey Figure 2-3. Transit Mode/Corridor Evaluation Process Figure 2-4. Initial Transit Modes Screened Figure 2-5. Initial Project Corridors Figure 2-6. Results of Corridor Screening Figure 2-7. Initial Project Alternative #1 Express Bus to Orlando and Deland Figure 2-8. Initial Project Alternative #2 I-4 Commuter Rail from DeBary Station Figure 2-9. Initial Project Alternative #3 I-4 Express Bus from DeBary Station Figure Initial Project Alternative #4 U.S 17/92 and DeLand Station BRT Figure Initial Project Alternative #5 I-4 Commuter Rail via S.R Figure Initial Project Alternative #6 I-4 Express Bus via S.R Figure Public Alternative U.S. 92 Commuter Rail Figure Refined Build Alternative #4 - BRT Figure Refined Build Alternative #5 -Commuter Rail iv February 2017
6 TABLE OF CONTENTS Figure New and Small Starts Project Evaluation and Rating Figure 3-1. Transit Improvement Strategy Figure 3-2. Votran TDP Update FY Route Modifications West Volusia County Figure 3-3. Votran TDP Update FY Route Modifications East Volusia County Figure 3-4. Highest Modal Sustainability Based on 2040 Population & Employment Projections Figure 3-5. Land Development Strategies Figure 3-6. Station Areas Evaluated in the TOD Assessment v February 2017
7 1.0 INTRODUCTION 1.0 INTRODUCTION The Florida Department of Transportation (FDOT), in association with the River to Sea Transportation Planning Organization (R2CTPO), MetroPlan Orlando, Volusia County, Seminole County, Votran, LYNX, and the cities of Sanford, DeBary, Deltona, Orange City, Lake Helen, DeLand and Daytona Beach has completed the Volusia Transit Connector Study (VTCS). The purpose of the VTCS was to identify and evaluate the need for premium transit service between S.R. 46 in Sanford and U.S. 1 in the vicinity of the Votran Transit Plaza in Daytona Beach, Florida (Study Area) - see Figure 1-1). 1.1 Purpose of Report The purpose of this Report is to summarize the results of the VTCS. The VTCS evaluated options for providing premium transit service between the major activity centers in the Study Area and included the development and analysis of alternatives to improve connectivity with SunRail. The Study included extensive data collection efforts, alternatives analysis and stakeholder input resulting in a final recommendation. A No-Build Alternative and four Refined Build Alternatives were developed and analyzed. The No-Build alternative was developed and evaluated as a baseline condition to compare against the refined Build Alternatives. These alternatives identified premium transit improvements determined to best meet the future transportation needs within the Study Area. The analysis of the alternatives considered: community input; ridership potential; environmental and socio-cultural impacts; financial requirements; and policy needs. The analysis framework utilized in the Study was consistent with Federal Transit Administration (FTA) guidance for the evaluation of transit improvement alternatives provided in FTA s Procedures and Technical Methods for Transit Project Planning. 1.2 Study Documents The VTCS included the development of technical reports and supporting materials to document decisions made during the Study. The study documents listed below are those that were developed during the VTCS and used as resources in developing this Project Summary Report: Final Existing Conditions Report, April 2015 Final Purpose and Need and Evaluation Methodology Report, May 2015 Final Initial Screening of Alternatives Report, November 2015 Final Conceptual Definition of Alternatives, Report May 2016 Draft Transit-Oriented Development Readiness Analysis Report, June 2016 Final Draft Evaluation of Refined Alternatives Report, August February 2017

8 1.0 INTRODUCTION Figure 1-1. Study Area 1-2 February 2017
9 The overall alternatives analysis for the VTCS involved the following steps: 1. Develop Purpose and Need statement; 2. Establish project Goals and Objectives based on purpose and need; 3. Develop evaluation methodology and measures for comparative analysis of alternatives; 4. Initial transit mode screening; 5. Corridor segment screening and analysis; 6. Definition and evaluation of conceptual alternatives; and, 7. Definition and evaluation of refined alternatives. Public input and local government agency coordination played a key role in the decision-making process for the VTCS. A Project Advisory Group (PAG) was established at the beginning of the Study and consisted of representatives from the following local and regional entities: River to Sea Transportation Planning Organization (R2CTPO), MetroPlan Orlando, Volusia County, Seminole County, Daytona Beach International Airport; Votran, LYNX, and the cities of Sanford, DeBary, Deltona, Orange City, Lake Helen, DeLand and Daytona Beach. A Community Liaison Group (CLG) was also formed to serve as a community-based compliment to the PAG. The CLG consisted of representatives from the business community, educational institutions; environmental groups, minority and other special populations, neighborhoods and other civic organizations. In addition to regular meetings with the PAG and CLG, public meetings and briefings to local elected officials were held during the Study to obtain comprehensive community input. A summary of the results of the VTCS alternatives analysis, consistent with the steps identified above, is provided in the following sections. 2.1 Purpose and Need Defining the Purpose and Need was a critical step in the overall planning process. The Purpose and Need Statement, associated with a set of locally adopted goals and objectives, led to the development and evaluation of alternatives. It will also provide the foundation for future federal review of the project in accordance with the National Environmental Policy Act (NEPA). The project Purpose and Need was based on conditions and trends as identified in the VTCS Existing Conditions Report Final, April This included an initial assessment of year 2010 demographics in Volusia County, and projected year 2040 demographics and travel patterns identified from the Central Florida Regional Planning Model (CFRPM) Version 5.6. There were several factors considered in the development of the Purpose and Need Statement for this Study, including: consistency with adopted plans; capacity needs including existing deficiencies, future year travel demand and mobility; social demands/economic development; modal interrelationships; system continuity; and, safety. 2-1 February 2017
10 Additionally, as an aid in developing a final Purpose and Need Statement, the PAG was asked to identify individual agency priorities with respect to Purpose and Need. Figure 2-1 summarizes the survey responses. The top priorities were: Improving system linkage (31%) Meeting capacity/transportation demand (22%) Serving transit-dependent people and fostering economic development (21%) Figure 2-1. Results of PAG Survey, Issues and Needs Safety 2% Modal Interrelationships 14% Planning Consistency 10% Social Demands/ Economic Development 21% System Linkage 31% Capacity/ Transportation Demand 22% Probing further into desired attributes, Figure 2-2 identifies the three top purposes of an enhanced transportation system for Volusia County. The top responses from the PAG actually included four attributes associated with the project purpose and need: Livability Economic health Alleviate future congestion Improve mobility These responses focused on what premium transit could do to improve the overall quality of life for residents, workers, and tourists in the County. 2-2 February 2017

11 Figure 2-2. Top Three Purposes from PAG Survey Based on the characteristics of the various factors related to Purpose and Need and input from the PAG on their relative values and priorities as discussed above, the following Purpose and Need Statement for the Study was developed: To provide increased transportation choices and to better serve the transit-dependent population in Volusia County, an expanded premium transit investment in the Study Area is needed. This transit improvement should: improve access to employment and other major trip attractions; help alleviate congestion and improve safety on I-4, U.S. 17/92, and U.S. 92 and major local roadways; and serve as a stimulus for transit-oriented development. SunRail has provided a connection for travel to employment and economic opportunities between Volusia County and Seminole County. Based on future congestion from planned developments and population growth, there is an opportunity to provide enhanced transit service in the reverse direction for new development, the protection of natural resources, and resident access to employment and recreational destinations. The final identified improvement should be accepted into locally adopted plans and be cost-effective with minimal social and environmental impacts. 2.2 Goals and Objectives Building upon the identified Purpose and Need, a set of goals and objectives was developed to guide the development and evaluation of transit mode and routing alternatives for the Study. These goals and objectives, listed in Table 2-1, are consistent with those identified in other premium transit studies recently sponsored by FDOT and other agencies in Central Florida, and are consistent with the River to Sea TPO Long-Range Transportation Plan. 2-3 February 2017
12 Table 2-1. Goals and Objectives for Volusia Transit Connector Study Goal 1. Improve Transportation Mobility, Accessibility and Safety in Study Area Objective 1. Improve service to areas with densities supportive of transit 2. Improve Service to areas with transit-dependent population 3. Improve connectivity between transportation systems and increase opportunities for future local and regional transit services 4. Reduce transit travel time for longer distance trips 5. Accommodate the added variable travel demands associated with special events 6. Provide safe, multi-modal access to the transit system 1. Maximize the use of existing transportation corridors and infrastructure 2. Develop a Transportation System that is the Most Efficient, which Leverages Limited Resources for the Greatest Public Benefit 3. Preserve and Enhance the Quality of the Environment and Cultural Resources 4. Stimulate Transit-Oriented and Overall Economic Development 2. Maximize the potential for a variety of project funding sources, including federal, state and local government agencies and the private sector 3. Develop transportation options that use proven technologies suitable to the Study Area 4. Provide a transportation improvement that can be implemented in a phased manner 1. Minimize potential adverse impact on residences, businesses, and the built environment 2. Minimize potential adverse impacts on the natural environment 3. Improve air quality by reducing auto emissions and pollutants 1. Provide transit investments supportive of City and County development/ redevelopment and land use plans 2. Maximize the economic benefits gained from transit capital investments 3. Promote eco-tourism and use of cultural resources 5. Relieve Traffic Congestion on Regional and Local Roadway System 1. Increase the transit mode share of trips made within the County and external to adjacent areas 2. Develop transit infrastructure improvements that will facilitate transit usage without undue increase in roadway traffic congestion or reduction in safety 2-4 February 2017
13 2.3 Evaluation Methodology Once the Purpose and Need Statement and Goals and Objectives were established, an evaluation methodology was developed for the Study to guide the technical evaluations. The purpose of this evaluation methodology was to assist in selecting an enhanced transit mode and service configuration that would improve transit mobility and system reliability, increase the competitiveness of premium transit for commuting and other trip-making purposes and support regional goals for development, redevelopment, and sustainability. The evaluation framework applied in the VTCS consisted of a transit mode screening analysis followed by a two-tiered Corridor Screening process as shown in Figure Initial Transit Mode Screening The purpose of the initial transit mode screening evaluation was to assess a range of mass transit technologies to determine the most appropriate application for the VTCS. The process included: 1) development of a list of potential transit modes and their service and physical characteristics; 2) evaluation of the modes against screening criteria; and 3) documentation of the screening results Methodology The assessment of potential transit modes for application in the VTCS started with the development of a comprehensive listing of technology categories, including their descriptions and operating characteristics to be screened. This evaluation is documented in the Final Initial Screening of Alternatives Report, November February 2017
14 Figure 2-3. Transit Mode/Corridor Evaluation Process 2-6 February 2017

15 Transit modes can be categorized into several classifications, each of which has particular characteristics that serve a variety of mobility needs and settings. For example the local bus enhancement category is best suited for short distance travel in medium to high-density developments. Automated Guideway Transit (AGT) or people movers as well as Monorail are best suited for shortdistance travel in high-pedestrian or activity areas like airports. Streetcars are best suited to serve short to medium distance trips in medium to high density development such as an urban center or downtown setting. For medium and long distance travel, express buses, bus rapid transit (BRT), and light rail transit (LRT) are typical solutions depending on the population density and type of development of the corridor. For longer distances, commuter rail such as SunRail may work best. The initial transit mode screening addressed the following modes which are illustrated in Figure 2-4: Commuter rail Light rail transit Streetcar Monorail/Automated guideway transit Express bus Bus rapid transit Local bus enhancements Figure 2-4. Initial Transit Modes Screened 2-7 February 2017
16 At the outset of this screening, a basic question was answered related to any mode(s) which had been eliminated in previous studies/discussions for reasons still considered valid. Upon applying this to every mode and corridor, further screening then proceeded to a basic evaluation of mode applicability in each corridor within the Study Area. The major criteria applied in this mode screening was consistent with the process applied in the recent FDOT-sponsored U.S. 441 Corridor Study, as documented in its Initial Alternatives Development and Screening Memorandum 1. Additional criteria were added as needed for the VTCS. The criteria used in the transit mode screening analysis for the VTCS included: Consistency of the technology with the Study Area s operating environment and existing rights-of-way. Technologies were ranked based on whether they would be compatible with the scale and travel characteristics for specific corridors in the Study Area, and whether the technology was in current use in the Study Area. Flexibility of the technology in providing regional connectivity. Technologies were ranked based on whether they could serve the travel characteristics of travelers in the Study Area today and in the future. Availability of the technology from multiple vendors. Technologies were ranked based on whether various components of the system were available from a number of different vendors, which would enable competitive bidding, cost-effective implementation, and cost-effective maintenance. Maturity of the technology. Technologies were ranked based on whether they have been implemented in a variety of locations and were proven as a reliable transit mode. Expandability of the technology. Technologies were ranked based on whether they could be expanded easily to meet the short and long-term needs of the corridor. Appropriate capacity to serve demand. Technologies were ranked based on minimum development thresholds shown to support such transit service for the designated corridors in the Study Area, in terms of population and employment by density. Impact of technology footprint on surrounding environment. Technologies were ranked based on whether the footprint and associated right-of-way (if needed) for the mode could fit into a corridor, without significant adjacent property impacts. The analysis was summarized by rating each mode against each criterion as High, Medium or Low. In addition, the ability of the mode to connect with SunRail or another mode in Seminole County or Volusia County, to provide access south to Orlando from Daytona Beach, DeLand and SW Volusia County, was also evaluated. The evaluation categories and rating thresholds are presented in Table 2-2. The initial comparative evaluations of potential modes for enhanced transit service under consideration for the Study were intended to attach qualitative judgments to each criterion within the various categories of qualities as defined in Table US 441 Corridor Study, Technical Memorandum - Initial Alternatives Development and Screening, June February 2017
17 The alternative modes considered were rated against the evaluation criteria and a score assigned. The scoring was based upon the selection of a response that best meets the expected results from the application of a specific mode in the corridor, as follows: Low not expected or poorly meets criterion; Medium may meet criterion; and High expected to meet criterion. The mode screening criteria were weighed equally, and points for each criterion were totaled. Modes that scored higher than 30 were advanced for further evaluation and those that scored less than 30 were eliminated. The outcome of the initial transit mode screening was a refined set of premium transit modes to be further evaluated for certain corridors within the Study Area Screening Results Table 2-3 presents the results of the overall transit mode screening evaluation. Based on the mode screening evaluation, Table 2-4 presents the transit modes eliminated from further evaluation, and Table 2-5 identifies the transit modes retained for further consideration. 2-9 February 2017
18 Table 2-2. Transit Mode Screening Evaluation Criteria Thresholds Service Characteristics and Community Acceptance Compatible with Travel Characteristics Community Acceptance Compatibility with Other Transit Modes/Regional Connectivity Existing and Future Expansion Support Competitive Procurement Availability of Modes from Multiple Vendors Maturity of Mode Technical Maturity System Capacity Right of Way Requirements Estimated Cost Reliability Supportive Land use (Pop/Emp density) Expansion Environmental Sustainable Horizontal / Vertical Clearances Capital O&M High Mode is highly applicable to address corridor travel demand Service characteristics are common and at an appropriate scale for corridor application Compatibility of mode results in little or no disruption to the operating system and community Adequate number of vendors for a nonproprietary design Proven technology based upon many years of operation Low implementation risk/many systems in operation throughout the U.S. Adequate mode capacity for corridor passenger volumes High operational flexibility to respond to capacity needs Low disruption to the existing environment Does not require additional rightof way and roadway reconfiguration Low conceptual capital cost investment Low operating expense Medium Mode is moderately applicable to address corridor travel demand Service characteristics are minimally responsive to the corridor Mode compatibility causes minimal disruption to the operating system and community Moderate number of vendors for a nonproprietary design Technology continues to evolve Moderate implementation risk/few systems in operation throughout the U.S. Minimal mode capacity for corridor passenger volumes Moderate operational flexibility to respond to capacity needs Minimal disruption to the existing environment Requires minimal right of way and moderate roadway reconfiguration Moderate conceptual capital cost investment Moderate operating cost Low Mode is not appropriate application to address travel demand Service characteristics are uncommon and not an appropriate scale for corridor application Mode is not compatible and causes significant disruption to the operating system and community Limited number of vendors and proprietary design Relatively new technology High implementation risk/with no systems in operation throughout the U.S. Mode capacity is not adequate for corridor passenger volumes Low operational flexibility to respond to capacity needs Significant Requires disruption to the additional rightof way for transit existing environment imrpovement High conceptual capital cost investment High operating cost Low Medium High 2-10 February 2017
19 Table 2-3. Transit Mode Screening Criteria Scoring Matrix Mode Service Characteristics and Community Acceptance Compatible with Travel Characteristics Community Acceptance Compatibility with Other Transit Modes/Regional Connectivity Existing and Future Expansion Support Competitive Procurement Availability of Modes from Multiple Vendors Technical Maturity Maturity of Mode Reliability System Capacity Supportive Land use (Pop/Emp density) Expansion Right of Way Requirements Environmental Sustainable Horizontal / Vertical Clearances Estimated Cost Capital O&M Score Advance Mode for Corridor Segment Evaluation Commuter Rail Yes Light Rail Transit No Streetcar No Automated Guideway Transit (AGT) No Monorail No Bus Rapid Transit Yes Express Bus Yes Local Bus Yes Low Medium High 2-11 February 2017
20 Table 2-4. Transit Modes Eliminated from Further Evaluation Mode Score Streetcar 30 LRT 28 AGT 20 Monorail 18 Table 2-5. Transit Modes Retained for Further Evaluation Mode Score Local Bus 60 BRT 60 Express Bus 58 Commuter Rail Corridor Screening Analysis Building on the transit mode screening process described above, a total of seven project segments and associated corridors within each of those segments were identified and analyzed as part of the initial corridor screening process. The seven segments and associated corridors that were reviewed as part of the initial corridor screening analysis are listed below and shown in Figure South to Seminole County: CSX Line and Interstate 4 (I-4) 2. DeBary to DeLand: U.S. 17/92 and I-4 3. SunRail to I-4: Dirksen Road, Utility Easement, Highbanks Road, Saxon Boulevard, and S.R DeLand: U.S. 92, U.S. 17/92, and S.R East-West Connector: U.S. 92 and I-4 6. West Daytona: U.S. 92, Bellevue Road/Midway Avenue, and I-4 7. East Daytona: George W Engram Boulevard, Dr. Mary McLeod Bethune Boulevard, U.S. 92, and Beville Road Table 2-6 identifies the specific measures applied in the initial corridor screening process, related to the goals and objectives established in the Purpose and Need effort. Table 2-7 identifies the specific values for low, medium and high ratings for each measure February 2017

21 PROJECT SUMMARY REPORT Figure 2-5. Initial Project Corridors February 2017
22 Table 2-6. Project Goals, Objectives and Initial Corridor Screening Measures Goals/Objectives Initial Corridor Screening Measures Goal 1: Improve Transportation Mobility, Accessibility, and Safety in the Study Area Improve service to areas with densities supportive of transit Population within ½ mile Employees within ½ mile Transit-dependent population within ½ mile (under age 18 and over age 65) Improve service to areas with transit-dependent population Transit-dependent population within ½ mile (below poverty level) Transit-dependent population within ½ mile (households with 0 or 1 vehicle) Improve connectivity between transportation systems and increase opportunities for future local and regional transit services Reduce transit travel time for longer distance trips Accommodate the added variable travel demands associated with special events Provide safe, multi-modal access to the transit system Number of connections to local and regional transit service, and to regional airports Volume-to-capacity (V/C) ratio on roadways where transit would operate Number of signalized intersections traversed Number of sport/community event venues within ¼ mile Percent of corridor with parallel sidewalk and bicycle connections Goal 2: Develop a Transportation System that is the Most Efficient, which Leverages Limited Resources for the Greatest Public Benefit Maximize the use of existing transportation corridors and infrastructure Develop transportation options that use proven transportation modes suitable to the Study Area Percent of corridor on existing roadway right-of-way Percent of corridor with available right-of-way for transit improvements Application of mode evaluation criteria Goal 3: Preserve and Enhance the Quality of the Environment and Cultural Resources Minimize potential adverse impact on residences, businesses, and the built environment Minimize potential adverse impact on the natural environment Percent of corridor adjacent to residences and businesses Percent of corridor adjacent to historic districts Number of contaminated sites adjacent to the corridor Percent of corridor adjacent to environmentally-sensitive land Goal 4: Stimulate Transit-Oriented and Overall Economic Development Provide transit investments supportive of City and County development/redevelopment and land use plans Maximize the economic benefits gained from transit capital investments Promote ecotourism and use of cultural resources Number of planned new developments directly served in corridor Linear miles through designated economic development areas Conceptual capital cost estimate based on length Number of natural/cultural tourist attractions within ½ mile Goal 5: Relieve Traffic Congestion and Regional and Local Roadway System Increase the transit mode share of trips made within the County and external to adjacent areas Develop transit infrastructure improvements that will facilitate transit usage without undue increases in roadway traffic congestion or reduction in safety Number of miles transit operates on roadways with LOS E/F Reduction in roadway capacity 2-14 February 2017
23 Table 2-7. Corridor Screening Measure Thresholds Initial Corridor Screening Measure Thresholds Low Medium High 2040 Population within ½ mile Less than 7,800 7,800 to 13,400 Higher than 13, Employees within ½ mile Less than 7,700 7,700 to 14,100 Higher than 14, Transit-dependent population within ½ mile (under age 18 and over age 65) 2010 Transit-dependent population within ½ mile (below poverty level) 2010 Transit-dependent population within ½ mile (households with 0 or 1 vehicle) Number of connections to local and regional transit service, and to regional airports Volume-to-capacity (V/C) ratio on roadways where transit would operate Less than 2,600 2,600 to 4,400 Higher than 4,400 Less than 1,100 1,100 to 2,400 Higher than 2,400 Less than 2,100 2,100 to 4,400 Higher than 4,400 Less than 6 connections Between 6 to 11 connections More than 11 connections V/C> <V/C<0.6 V/C<0.6 Number of signalized intersections traversed More than 14 intersections Between 7 to 14 intersections Less than 7 intersections Number of sport/community event venues within ¼ mile Does not serve venues 3 or less venues More than 3 venues Percent of corridor with parallel sidewalk and bicycle connections Less than 16% of the corridor Between 16% to 43% of the corridor More than 43% of the corridor Percent of corridor on existing roadway right-of-way Less than 60% on existing ROW More than 60% on existing ROW ROW acquisition not required Percent of corridor with available right-of-way for transit improvements Less than 50% of ROW available Between 50% to 80% of ROW available More than 80% of ROW available Application of mode evaluation criteria Percent of corridor adjacent to residences and businesses Local bus is the highest mode applicable More than 47% of the corridor BRT or express bus is the highest mode applicable Between 32% to 47% of the corridor Commuter rail or street car is the highest mode applicable Less than 32% of the corridor Percent of corridor adjacent to historic districts More than 12% 4% to 12% Less than 4% Number of contaminated sites adjacent to the corridor More than 13 sites 6 to 13 sites Less than 6 sites Percent of corridor adjacent to environmentally-sensitive land More than 75% of the corridor Between 46% to 75% of the corridor Less than 46% of the corridor Number of planned new developments directly served in corridor Linear miles through designated economic development areas Conceptual capital cost estimate based on length Does not serve planned new developments Does not serve economic development areas Capital investment higher than $250k Serves at least 1 planned new development Less than 1 mile through economic development areas Serves more than 1 planned new development More than 1 mile through economic development areas Between $75k and $250k Capital investment less than $75k Number of natural/cultural tourist attractions within ½ mile Less than 3 natural/cultural attractions served Between 3 and 7 natural/cultural attractions served More than 7 natural/cultural attractions served Number of miles transit operates on roadways with LOS E/F More than 10 miles on congested roadways Less than 10 miles on congested roadways Does not use congested roadways Reduction in roadway capacity Transit improvement expected to significantly impact roadway capacity Transit improvement expected to moderately impacted roadway capacity Transit improvement expected to minimally impact roadway capacity 2-15 February 2017
24 Based on the application of the initial corridor screening measures as identified in Table 2-7, each of the corridors was assigned a high, medium, or low designation. These designations were weighted using a point system: five (5) for a high score, three (3) for a medium score, and one (1) for a low score. The total points were then calculated to determine the overall score for each corridor. The initial corridor screening analysis is described in more detail in the Final Initial Screening of Alternatives Report, November 2015 including the individual results for each of the corridors within the seven project segments. Figure 2-6 and Table 2-8 show the highest rated corridors. Within each of the seven segments, certain corridors had stronger results than others. Below is a discussion of the highest ranking corridors within all segments. Overall, the highest ranking corridors in the Study Area are located in Segment 7 - East Daytona, demonstrating that the greater development conditions and special attractions in this area have a higher propensity for transit service. The CSX line within Segment 1 - South to Seminole, and the U.S. 17/92 corridor in Segment 2 - DeBary to DeLand also ranked high among the corridors that were assessed. The higher ranking features of the U.S. 17/92 corridor in Segment 4 - DeLand include the greater proportion of surrounding population, including transit-dependent persons, the existing sidewalk and bicycle connections, traversing designated economic development areas, and the proximity to nearby attractions. Similar to the corridors in Segment 7 - East Daytona, the U.S. 17/92 corridor in Segment 4 - DeLand demonstrated demographic and operating characteristics that would have a higher propensity for transit use by potentially transit-dependent and choice transit users. Using the results of the initial corridor screening and input from the PAG, the highest performing corridors and modes were combined into a series of alignments that were further analyzed as Initial Project Alternatives. The evaluation of Initial Project Alternatives is summarized in the following section February 2017


25 PROJECT SUMMARY REPORT Figure 2-6. Results of Corridor Screening 2-17 February 2017
26 Segment 1 South to Seminole CSX I Segment 2 DeBary to DeLand U.S. 17/92 I Table 2-8. Initial Corridor Screening Results Segment 3 Rail to I 4 Dirksen Rd Utility Easement Highbanks Rd Saxon Blvd S.R Segment 4 DeLand U.S. 92 U.S. 17/92 S.R Segment 5 East West Connection U.S. 92 I Segment 6 West Daytona U.S. 92 Midway Ave North Midway Ave South I Segment 7 East Daytona George W Egram Dr Mary McLeod U.S. 92 Beville Rd Blvd Bethune Blvd Green High Yellow Medium Red Low 2-18 February 2017
27 2.6 Initial Build Alternatives A combination of the best performing corridors within the seven segments in the Study Area and the applicability of the refined set of enhanced transit modes resulted in six Initial Build Alternatives covering the entire Study Area. These include: #1 Express Bus to Orlando and DeLand #2 I-4 Commuter Rail from DeBary Station #3 I-4 Express Bus from DeBary Station #4 U.S. 17/92 and DeLand Station BRT #5 - I-4 Commuter Rail via S.R. 472 #6 I-4 Express Bus via S.R. 472 The six Initial Build Alternatives provided connections between west Volusia County and the existing Votran transfer center in Daytona Beach and are discussed in detail beginning in section below. There were several current or previous studies that were considered as part of Project Alternatives analysis as it related to intermodal connectivity including: 1. The Intermodal Transit Station Study completed in 2014 sponsored by FDOT: This study identified five potential sites as potential locations for a new intermodal station site on the west side of the Daytona Beach area. Further evaluation during the VTCS, using criteria such as accessibility, safety, and cost pending the selection of a recommended alignment and mode, assisted with the identification of a recommended site for the intermodal station. 2. The International Speedway Boulevard (ISB) Corridor Transportation Plan completed in 2011: The mode and alignment for the connection between the potential intermodal station in Daytona Beach and the Votran downtown transit center was determined in part through a reassessment of the modes and findings of this study. 3. The ISB Corridor Management Master Plan was a final resource considered in the VTCS to further consider and evaluate pedestrian and bicycle connections along ISB in Daytona Beach. The Initial Build Alternative analysis is described in detail in the Final Initial Screening of Alternatives Report, November The following is a summary of this analysis Initial Build Alternative #1 - Express Bus to Orlando and DeLand Initial Build Alternative #1 (Figure 2-7) would provide express bus service connecting Daytona Beach to Orlando and DeLand. This alternative would operate along I-4 from the potential west side intermodal station in Daytona Beach to downtown Orlando. A second express bus service to DeLand would operate along I-4 from Daytona Beach to the S.R 44 interchange, then head west on S.R. 44 to serve downtown DeLand and the northern terminus of the SunRail Phase 2 North expansion at DeLand Amtrak station. To serve the existing Votran downtown transit center from the potential intermodal station, the express bus would be operating in a BRT mode along U.S. 92 (express buses are typically over-the-road coach buses, and while not prohibited from making more frequent/closely stops, the vehicle types are not typical of BRT operations) or would transfer to streetcar or local bus. Potential station locations for the express bus service to Orlando were identified at major interchanges along I-4: S.R. 44, S.R. 472, Saxon Boulevard, and Dirksen Road. For express bus service to DeLand, two added potential station locations were identified at downtown DeLand and the DeLand Amtrak station February 2017

28 PROJECT SUMMARY REPORT Figure 2-7. Initial Project Alternative #1 Express Bus to Orlando and Deland 2-20 February 2017
29 2.6.2 Initial Build Alternative #2 - I-4 Commuter Rail from DeBary Station Initial Build Alternative #2 (Figure 2-8) would provide commuter rail service from the DeBary SunRail station to Daytona Beach. Connection to the existing Votran downtown transit center would require transfer to streetcar, BRT, or local bus from the potential intermodal transit center. This alternative would operate along the utility easement north of Dirksen Road to connect the DeBary SunRail station to I-4; then continue to the potential intermodal transfer station in Daytona Beach using the planned transit envelope in the I-4 median. Potential commuter rail stations included the major interchanges along I-4: Saxon Boulevard, S.R. 472 and S.R Initial Build Alternative #3 - I-4 Express Bus from DeBary Station Initial Build Alternative #3 (Figure 2-9) would operate from the potential intermodal station in Daytona Beach to the DeBary SunRail station via I-4 and Dirksen Road. To serve the existing Votran downtown transit center from the potential intermodal station express bus could operate in a BRT mode along U.S. 92 or transfer to streetcar or local bus. Potential stations for this alternative were identified at the major interchanges along I-4: Dirksen Road, Saxon Boulevard, S.R. 472 and S.R Initial Build Alternative #4 - U.S. 17/92 and DeLand Station BRT Initial Build Alternative #4 (Figure 2-10) would provide BRT service to connect Daytona Beach to the DeBary SunRail Station. BRT would operate in express bus mode along U.S. 92 between Daytona Beach and DeLand. BRT service would continue south operating along U.S. 17/92 and S.R. 44 to serve the northern terminus of the SunRail Phase 2 North expansion at DeLand Amtrak station. Service to the DeBary SunRail Station would operate along U.S. 17/92. To serve the Votran downtown transit center, BRT would either continue east of the potential intermodal transit center or offer transfer to streetcar or local bus. Potential BRT stations identified for this alternative included major intersections along U.S. 17/92: Saxon Boulevard, Graves Avenue, S.R. 472, Downtown DeLand and U.S. 92. The existing DeLand Intermodal Facility would also be served Initial Build Alternative #5 - I-4 Commuter Rail via S.R. 472 Initial Build Alternative #5 (Figure 2-11) would provide commuter rail service between Orange City and Lake Helen to Daytona Beach. This alternative would operate along an extension of S.R. 472 to connect with the SunRail Phase 2 North corridor. Commuter rail service would operate along the planned transit envelope in the I-4 median to the potential new intermodal station in Daytona Beach. Connecting service from the potential intermodal station to the existing Votran downtown transit center would be provided by BRT, local bus, or streetcar. Potential stations for this alternative were identified along the SunRail Phase 2 North corridor at Orange City (access via an extension of SR 472), the I-4 /S.R. 472 interchange, and the I-4/S.R. 44 interchange February 2017


30 Figure 2-8. Initial Project Alternative #2 I-4 Commuter Rail from DeBary Station 2-22 February 2017

31 PROJECT SUMMARY REPORT Figure 2-9. Initial Project Alternative #3 I-4 Express Bus from DeBary Station 2-23 February 2017


32 Figure Initial Project Alternative #4 U.S 17/92 and DeLand Station BRT 2-24 February 2017


33 Figure Initial Project Alternative #5 I-4 Commuter Rail via S.R February 2017
34 2.6.6 Initial Build Alternative #6 - I-4 Express Bus via S.R. 472 Initial Build Alternative #6 (Figure 2-12) would provide express bus service connecting the potential intermodal station in Daytona Beach and a new Orange City station along SunRail Phase 2 North, via I-4 and S.R Express bus could operate in BRT mode between the potential intermodal transit station and the existing Votran downtown transit center or transfer to streetcar or local bus service. Potential stations for this alternative included: Orange City SunRail station, U.S. 17/92, S.R. 472/I-4 Interchange and S.R. 44/I-4 interchange Public Alternative - U.S. 92 Commuter Rail Based on public input received during the initial set of public meetings held in April 2015, an additional alternative was identified. Designated as the Public Alternative (Figure 2-13), this alternative would extend commuter rail service north of the DeLand SunRail Station, the current planned northern terminus of SunRail Phase 2 North, and would connect to the potential new intermodal station in Daytona Beach. This alternative would require additional CSX right-of-way to extend north of the DeLand SunRail station. The rail line would run parallel to Green Dairy Road to connect to U.S. 92 at the U.S. 17/92 intersection, and then continue along U.S. 92 to Daytona Beach. Connection between the potential intermodal station and the Votran downtown transit center would be provided by BRT, local bus, or streetcar. There would be one added potential station for the Public Alternative at U.S. 17/92 in north DeLand February 2017


35 PROJECT SUMMARY REPORT Figure Initial Project Alternative #6 I-4 Express Bus via S.R February 2017


36 PROJECT SUMMARY REPORT Figure Public Alternative U.S. 92 Commuter Rail 2-28 February 2017
37 2.6.8 Initial Build Alternatives Evaluation The Initial Build Alternatives evaluation process was the method by which the Initial Project Alternatives were assessed and either advanced or eliminated from further consideration. The Initial Project Alternatives were derived from the results of the initial corridor screening process. The public alternative was suggested during the public involvement process and was also evaluated as part of the assessment described in this section. The process was designed to progress logically from the six Initial Project Alternatives to a smaller list of alternatives to be evaluated in further detail, known as the Refined Alternatives. The evaluation process was developed and conducted transparently and collaboratively so that stakeholders had the opportunity to contribute to the process. This consultation ensured defensible screening results, support of the alternatives, and an efficient progression to the next level of alternative development and evaluation. The Initial Build Alternatives screening incorporated a comprehensive level of qualitative criteria along with select quantitative criteria; was tied to the Goals and Objectives; and included preliminary cost estimates, travel time and potential environmental impacts. The screening included the same measures applied for the initial corridor screening and described in Table 2-7. A rating of Low, Medium, or High was assigned to each criterion which was applied to each Initial Project Alternative. The thresholds for the rating of Low, Medium, and High for each criterion are shown in Table 2-9. These thresholds were calculated using the average of the values identified for each alternative under each criterion; the average was used as the lower value for the medium threshold. Then, the standard deviation was calculated and added to the average to identify the higher value for the medium threshold. The overall ratings for the Initial Build Alternatives were evaluated to identify the alternatives to advance to the Refined Alternatives phase. This evaluation was consistent with the desire to advance only the most feasible alternatives with the best potential to meet the Study Area needs and satisfy the project Goals and Objectives. Two build alternatives, along with the No Build Alternative, were expected to comprise the Refined Alternatives list. Table 2-10, presents the results of the Initial Build Alternatives screening. A score was then given to each screening measure based on the rating as follows: high = 5, medium = 3, low = 1; the overall score for the alternative was then calculated as the sum of the individual score assigned to each measure as shown in Table Conceptual capital and operations and maintenance (O&M) costs were also developed for the Initial Build Alternatives and the Public Alternative. Because of the conceptual level of design development and the potential for unknown existing conditions, the estimated capital costs were used to provide a comparison among alternatives and were not used to establish project budgets. A more rigorous bottoms-up cost estimate based on advanced design would be needed to establish a reliable budget level estimate. In the same fashion, because of the conceptual level of operating plan development and the potential for significant changes, the estimated O&M costs were used to provide a comparison among alternatives and were not used to establish project operating budgets. A refined O&M cost estimate based on a detailed operating plan, including feeder bus service would be needed to establish a reliable budget level estimate February 2017
38 Table 2-9. Initial Build Alternatives Screening Thresholds Objective Initial Corridor Screening Measure Thresholds Goal 1: Improve Transportation Mobility, Accessibility and Safety in Study Area LOW MEDIUM HIGH Improve service to areas with densities supportive of transit 2040 Population within 1/2 mile of potential stations less than 5, 605 5,605 to 7,983 7,984 and up 2040 Employees within 1/2 mile of potential stations less than 26,203 26,203 to 32,363 32,364 and up Improve service to areas with transit dependent population 2010 Transit dependent population within 1/2 mile of potential stations under 18/over Transit dependent population within 1/2 mile of potential stations population below poverty level 2010 Transit dependent population within 1/2 mile of potential stations households with 0 or 1 vehicle less than 3,907 3,907 to 5,261 5,262 and up less than 3,696 3,696 to 4,551 4,552 and up less than 2,468 2,468 to 3,451 3,452 and up Improve connectivity between transportation systems and Number of connections to local and regional transit increase opportunities for future service, and to regional airports local and regional transit services less than to and up V/C ratio on roadways where transit would operate 0.71 and up 0.7 to 0.6 less than 0.6 Reduce transit travel time for longer distance trips Number of signalized intersections traversed less than to and up Accommodate the added variable travel demands associated with special events Proximity to Daytona Speedway Number of other sport/community event venues within 1/4 mile All alternatives were given a "high" score. All alternatives serve the Daytona Speedway less than 9 9 to and up Provide safe, multi modal access to the transit system Percent of corridor with parallel sidewalk and bicycle connections less than 11% 11% to 21% 22% and up 2-30 February 2017
39 Table 2-9. Initial Build Alternatives Screening Thresholds (Cont.) Objective Initial Corridor Screening Measure Thresholds Goal 2: Develop a Transportation System that is the Most Efficient, which Leverages Limited Resources for the Greatest Public Benefit LOW MEDIUM HIGH Maximize the use of existing transportation corridors and infrastructure Develop transportation options that use proven transportation modes suitable to the Study Area Percent of corridor on existing roadway right of way less than 80% 80% to 95% 96% and up Percent of corridor with available right of way for transit improvement Application of mode evaluation criteria Local bus lesst than 75% 75% to 85% 86% and up Express Bus/ BRT, Express Bus/Local Bus Commuter Rail/Streetcar, Commuter Rail/Local Bus or BRT Goal 3: Preserve and Enhance the Quality of the Environment and Cultural Resources LOW MEDIUM HIGH Minimize potential adverse impact on residences, businesses, and the build environment Percent of corridor adjacent to residences and businesses 30% and up 29% to 22% less than 22% Percent of corridor adjacent to historic districts 5% and up 4% to 1% less than 1% Minimize potential adverse impacts on the natural environment Number of contaminated sites adjacent to corridor 45 and up 44 to 31 less than 31 Percent of corridor adjacent to environmentallysensitive land 64% and up 63% to 53% less than 53% Goal 4: Stimulate Transit Oriented and Overall Economic Development LOW MEDIUM HIGH Provide transit investments supportive of City and County development/ redevelopment and land use plans Number of planned new developments directly served in corridor Linear miles through designated economic development areas less than 1 1 to 2 3 and up less than 2 2 to 3 4 and up Maximize the economic benefits gained from transit capital investments Conceptual capital cost estimate less than to and up Promote ecotourism and use of cultural resources Number of natural/cultural tourist attractions within 1/2 mile less than to and up Goal 5: Relieve Traffic Congestion on Regional and Local Roadway System LOW MEDIUM HIGH Increase the transit mode share of trips made within the County and external to adjacent areas Number of miles transit operates on roadways with LOS E/F 13 and up 12 to 5 less than 5 Develop transit infrastructure improvements that will facilitate transit usage without undue increase in roadway traffic congestion or reduction in safety Reduction in roadway capacity Transit improvement expected to have significant impact in roadway capacity Transit improvement expected to have moderate impact in roadway capacity Transit improvement expected to have minimal impact in roadway capacity 2-31 February 2017
40 Table Initial Build Alternatives Screening Results Objective Initial Corridor Screening Measure Alternative 1 Alternative 2 Alternative 3 Alternative 4 Alternative 5 Alternative 6 Public Alternative Goal 1: Improve Transportation Mobility, Accessibility and Safety in Study Area I 4 Orlando & S.R. 44 Express Bus I 4 Commuter Rail from DeBary I 4 / DeBary Station Express Bus U.S. 17/92 &DeLand Station BRT I 4 Commuter Rail Via S.R. 472 I 4 Express Bus via S.R. 472 U.S. 92 Commuter Rail Improve service to areas with densities supportive of transit Improve service to areas with transitdependent population Improve connectivity between transportation systems and increase opportunities for future local and regional transit services Reduce transit travel time for longer distance trips 2040 Population within 1/2 mile of potential stations Employees within 1/2 mile of potential stations Transit dependent population within 1/2 mile of potential stations under 18/over Transit dependent population within 1/2 mile of potential stations population below poverty level Transit dependent population within 1/2 mile of potential stations households with 0 or 1 vehicle Number of connections to local and regional transit service, and to regional airports V/C ratio on roadways where transit would operate Number of signalized intersections traversed Accommodate the added variable travel demands associated with special events Proximity to Daytona Speedway Number of other sport/community event venues within 1/4 mile Serve Potential Intermodal Station/Daytona Speedway Serve Potential Intermodal Station/Daytona Speedway Serve Potential Intermodal Station/Daytona Speedway Serve Potential Intermodal Station/Daytona Speedway Serve Potential Intermodal Station/Daytona Speedway Serve Potential Intermodal Station/Daytona Speedway Serve Potential Intermodal Station/Daytona Speedway Provide safe, multi modal access to the transit system Percent of corridor with parallel sidewalk and bicycle connections 12% 9% 8% 33% 2% 7% 7% Goal 2: Develop a Transportation System that is the Most Efficient, which Leverages Limited Resources for the Greatest Public Benefit I 4 Orlando & S.R. 44 Express Bus I 4 Commuter Rail from DeBary I 4 / DeBary Station Express Bus U.S. 17/92 &DeLand Station BRT I 4 Commuter Rail Via S.R. 472 I 4 Express Bus via S.R. 472 U.S. 92 Commuter Rail Maximize the use of existing transportation corridors and infrastructure Develop transportation options that use proven transportation modes suitable to the Study Area Percent of corridor on existing roadway right of way 100% 93% 100% 100% 94% 94% 94% Percent of corridor with available right of way for transit improvement Application of mode evaluation criteria 70% 84% 73% 55% 80% 76% 86% Express Bus/BRT Commuter Rail/Streetcar,BRT,Lo cal Bus Express Bus/Local Bus BRT/Express Bus Commuter Rail/BRT Express Bus/BRT Commuter Rail/BRT Green High Yellow Medium Red Low 2-32 February 2017
41 Table Initial Build Alternatives Screening Results (Cont.) Objective Initial Corridor Screening Measure Alternative 1 Alternative 2 Alternative 3 Alternative 4 Alternative 5 Alternative 6 Public Alternative Goal 3: Preserve and Enhance the Quality of the Environment and Cultural Resources I 4 Orlando & S.R. 44 Express Bus I 4 Commuter Rail from DeBary I 4 / DeBary Station Express Bus U.S. 17/92 &DeLand Station BRT I 4 Commuter Rail Via S.R. 472 I 4 Express Bus via S.R. 472 U.S. 92 Commuter Rail Minimize potential adverse impact on residences, businesses, and the build environment Minimize potential adverse impacts on the natural environment Percent of corridor adjacent to residences and businesses 26% 22% 22% 34% 18% 18% 16% Percent of corridor adjacent to historic districts 1% 0% 0% 8% 0% 0% 0% Number of contaminated sites adjacent to corridor Percent of corridor adjacent to environmentally sensitive land 60% 66% 64% 42% 69% 70% 73% Goal 4: Stimulate Transit Oriented and Overall Economic Development I 4 Orlando & S.R. 44 Express Bus I 4 Commuter Rail from DeBary I 4 / DeBary Station Express Bus U.S. 17/92 &DeLand Station BRT I 4 Commuter Rail Via S.R. 472 I 4 Express Bus via S.R. 472 U.S. 92 Commuter Rail Provide transit investments supportive of City and County development/ redevelopment and land use plans Number of planned new developments directly served in corridor Linear miles through designated economic development areas Maximize the economic benefits gained from transit capital investments Conceptual capital cost estimate based on length Promote ecotourism and use of cultural resources Number of natural/cultural tourist attractions within 1/2 mile Goal 5: Relieve Traffic Congestion on Regional and Local Roadway System I 4 Orlando & S.R. 44 Express Bus I 4 Commuter Rail from DeBary I 4 / DeBary Station Express Bus U.S. 17/92 &DeLand Station BRT I 4 Commuter Rail Via S.R. 472 I 4 Express Bus via S.R. 472 U.S. 92 Commuter Rail Increase the transit mode share of trips made within the County and Number of miles transit operates on roadways with LOS E/F external to adjacent areas Develop transit infrastructure improvements that will facilitate transit usage without undue increase Reduction in roadway capacity Moderate Minimal Moderate Significant Minimal Minimal Minimal in roadway traffic congestion or reduction in safety Green High Yellow Medium Red Low 2-33 February 2017
42 Table Initial Build Alternatives Screening Results Scoring Objective Initial Corridor Screening Measure Alternative 1 Alternative 2 Alternative 3 Alternative 4 Alternative 5 Alternative 6 Public Alternative Goal 1: Improve Transportation Mobility, Accessibility and Safety in Study Area I 4 Orlando & S.R. 44 Express Bus I 4 Commuter Rail from DeBary I 4 / DeBary Station Express Bus U.S. 17/92 &DeLand Station BRT I 4 Commuter Rail Via S.R. 472 I 4 Express Bus via S.R. 472 U.S. 92 Commuter Rail Improve service to areas with densities supportive of transit Improve service to areas with transitdependent population Improve connectivity between transportation systems and increase opportunities for future local and regional transit services Reduce transit travel time for longer distance trips 2040 Population within 1/2 mile of potential stations Employees within 1/2 mile of potential stations Transit dependent population within 1/2 mile of potential stations under 18/over Transit dependent population within 1/2 mile of potential stations population below poverty level Transit dependent population within 1/2 mile of potential stations households with 0 or 1 vehicle Number of connections to local and regional transit service, and to regional airports V/C ratio on roadways where transit would operate Number of signalized intersections traversed Accommodate the added variable travel demands associated with special events Proximity to Daytona Speedway Number of other sport/community event venues within 1/4 mile Provide safe, multi modal access to the transit system Percent of corridor with parallel sidewalk and bicycle connections Goal 2: Develop a Transportation System that is the Most Efficient, which Leverages Limited Resources for the Greatest Public Benefit I 4 Orlando & S.R. 44 Express Bus I 4 Commuter Rail from DeBary I 4 / DeBary Station Express Bus U.S. 17/92 &DeLand Station BRT I 4 Commuter Rail Via S.R. 472 I 4 Express Bus via S.R. 472 U.S. 92 Commuter Rail Maximize the use of existing transportation corridors and infrastructure Develop transportation options that use proven transportation modes suitable to the Study Area Percent of corridor on existing roadway right of way Percent of corridor with available right of way for transit improvement Application of mode evaluation criteria Green High Yellow Medium Red Low 2-34 February 2017
43 Table Initial Build Alternatives Screening Results Scoring (Cont.) Objective Initial Corridor Screening Measure Alternative 1 Alternative 2 Alternative 3 Alternative 4 Alternative 5 Alternative 6 Public Alternative Goal 3: Preserve and Enhance the Quality of the Environment and Cultural Resources I 4 Orlando & S.R. 44 Express Bus I 4 Commuter Rail from DeBary I 4 / DeBary Station Express Bus U.S. 17/92 &DeLand Station BRT I 4 Commuter Rail Via S.R. 472 I 4 Express Bus via S.R. 472 U.S. 92 Commuter Rail Minimize potential adverse impact on residences, businesses, and the build environment Minimize potential adverse impacts on the natural environment Percent of corridor adjacent to residences and businesses Percent of corridor adjacent to historic districts Number of contaminated sites adjacent to corridor Percent of corridor adjacent to environmentally sensitive land Goal 4: Stimulate Transit Oriented and Overall Economic Development I 4 Orlando & S.R. 44 Express Bus I 4 Commuter Rail from DeBary I 4 / DeBary Station Express Bus U.S. 17/92 &DeLand Station BRT I 4 Commuter Rail Via S.R. 472 I 4 Express Bus via S.R. 472 U.S. 92 Commuter Rail Provide transit investments supportive of City and County development/ redevelopment and land use plans Maximize the economic benefits gained from transit capital investments Promote ecotourism and use of cultural resources Number of planned new developments directly served in corridor Linear miles through designated economic development areas Conceptual capital cost estimate based on length Number of natural/cultural tourist attractions within 1/2 mile Goal 5: Relieve Traffic Congestion on Regional and Local Roadway System I 4 Orlando & S.R. 44 Express Bus I 4 Commuter Rail from DeBary I 4 / DeBary Station Express Bus U.S. 17/92 &DeLand Station BRT I 4 Commuter Rail Via S.R. 472 I 4 Express Bus via S.R. 472 U.S. 92 Commuter Rail Increase the transit mode share of trips made within the County and Number of miles transit operates on roadways with LOS E/F external to adjacent areas Develop transit infrastructure improvements that will facilitate transit usage without undue increase Reduction in roadway capacity in roadway traffic congestion or reduction in safety Green High Yellow Medium Red Low Total Alternative 1 Alternative 2 Alternative 3 Alternative 4 Alternative 5 Alternative 6 Public Alternative I 4 Orlando & S.R. 44 Express Bus I 4 Commuter Rail from DeBary via Utility Easement I 4 / DeBary via Express Bus U.S. 17/92 &DeLand Station BRT I 4 Commuter Rail Via S.R. 472 I 4 Express Bus via S.R. 472 U.S. 92 Commuter Rail February 2017
44 2.6.9 Summary of Initial Build Alternatives Analysis Overall, the commuter rail alternatives (Initial Build Alternatives #2, #5, and the Public Alternative) had some strengths when compared to the bus-based alternatives (Initial Build Alternatives #1, #3, #4 and #6). They include: competitive travel times with the auto, high travel time reliability, and a strong potential to attract choice riders and support compact development. The two major weaknesses, however, were higher costs for both capital and operations and maintenance. Table 2-12 summarizes the evaluation of the rail alternatives as compared to each other. Initial Rail Build Alternative #2 Pros o o Cons o o o o o Operates along I-4 planned transit envelope Provides greater accessibility to City of Deltona, with station at Saxon Road Direct business impact to Seminole Pre-Cast Manufacturing Requires co-location with Duke Energy for operations along the utility easement north of Dirksen. The relocation of a transmission line would be required for rail operations adding to the capital cost for this alternative Indirect community and residential impacts including VFW Post and Memorial Park Noise and vibration adjacent to utility easement Visual impacts with elevated section east of Mansion Road Initial Rail Build Alternative #5 Pros o o o o o Cons o Highest initial screening total score among rail alternatives Avoids business impact at Seminole Pre-Cast Manufacturing Minimizes indirect community and residential impacts Minimal impact to conservation lands Operates along I-4 planned transit envelope Elevated section along I-4 north of S.R. 472 might have some noise and visual impacts Public Alternative Pros o Direct connection from West DeLand Station to U.S. 92 corridor Cons o Requires right-of-way acquisition from CSX north of SunRail Phase 2 North o Requires residential relocations west of Grand Avenue o Residential impact along Greens Diary Road o Parcel severance east of Stone Street o Requires significant reconstruction along U.S. 92 o Does not serve markets south and east of DeLand 2-36 February 2017
45 Table Initial Rail Alternatives Comparison Rail Alternatives Initial Screening Evaluation Total Score Average Estimated Capital Cost (Millions and 2015 $$) Estimated O&M Costs (Per Year, in Millions, 2015 $$) Potential Number of Stations West of Daytona Station Locations Alternative 2, DeBary to I-4 co-located with Duke Energy Alternative 5, S.R. 472 to I-4 64 $689.5 $ $589.1 $ I-4/Saxon I-4/S.R. 472 I-4/S.R. 44 I-4/S.R. 472 I-4/S.R. 44 Public Alternative Using Greens Dairy Road and U.S $526.3 $ U.S For the bus alternatives (Initial Build Alternatives #1, #3, #4, and #6), the primary strength was the lower capital, operating, and maintenance costs. However, the primary trade-offs with these alternatives were longer travel times, lower travel time reliability, and less potential to attract choice riders and support compact development. Table 2-13 summarizes the comparison of the bus alternatives. Initial Bus Build Alternative #1: Pros o o o o o o Cons o Second highest initial screening total score Serves second highest population and highest number of employees total within ½ mile of potential stations Can use existing highway travel lanes at relatively high rates of speed This subarea has connections to two of the existing SunRail Stations Operates on I-4 and S.R. 44 corridors; no ROW acquisition is needed There are three natural and cultural attractions along this corridor Second highest capital cost among bus alternatives Initial Bus Build Alternative #3: Pros o o Cons o o Lowest capital cost Operates along I-4 corridor Lowest initial screening total score Serves lower concentrations of population and employees Initial BRT Build Alternative #4: Pros o o Highest initial screening total score Highest level of service among bus alternatives 2-37 February 2017
46 o Provides connections to DeLand Municipal Airport, DeLand Amtrak Station and DeLand Intermodal Station o Serves the highest concentrations of population and second highest number of employees o Highest number of potential stations o Provides access to Stetson University o Operates in U.S. 17/92 corridor; no ROW acquisition is needed o Lower proximity to environmentally sensitive lands Cons o Highest capital and operating costs among bus alternatives Initial Bus Build Alternative #6 Pros Cons o High level of adjacent bicycle and pedestrian connectivity o Second lowest initial screening total score o Serves lowest concentrations of population and employees o Does not provide access to natural or cultural attractions o Requires roadway extension of S.R 472 Table Initial Bus Alternatives Comparison Bus Alternatives Initial Screening Evaluation Total Score Estimated Capital Cost (in Millions and 2015$) Estimated O&M Costs (Per Year, in Millions, 2015$) Potential Number of Stations Alternative 1, I 4/Orlando and SR 44 Express Bus Alternative 3, I 4/DeBary Station Express Bus Alternative 4, US and DeLand Stations BRT/Express Bus Alternative 6, I 4 Express Bus via SR $38.6 $ $27.3 <$ $51.4 $ $27.6 <$1 5 Highest Scoring Alternatives Initial Build Alternative #4 scored the highest of all alternatives considered. This alternative would involve BRT operations along U.S. 17/92 connecting southwest Volusia with DeLand where a high concentration of population and employment exists as well as a medium-high concentration of transitdependent population. This alternative would also serve events and cultural attractions. Initial Project Alternative #4 would provide a connection to Daytona Beach using the U.S. 92 corridor. This alternative would also serve major attractions in the Daytona Beach area and it would connect to the Votran Transit Center. BRT service has the flexibility to share a travel lane to operate in mixed traffic on urban and suburban streets with some level of priority treatment or utilize designated right-of-way that applies various types of infrastructure and technology to reduce dwell time and accelerate transit travel time within a transportation corridor February 2017
47 Initial Build Alternative #5 received the second highest score based on the screening evaluation. This alternative involves commuter rail service from the DeBary SunRail Station to the new intermodal facility in Daytona Beach. This alternative would operate along an extension of S.R 472 to connect to the existing CSX corridor with the planned I-4 transit envelope providing an opportunity to serve Deltona without major impacts to communities or conservation lands. Based on the results of the screening evaluation and in consideration of overall input from the PAG and general public, Initial Build Alternative #4 and Initial Build Alternative #5 were retained as viable alternatives to advance to the refined alternatives analysis phase of the Study. 2.7 Refined Alternatives Analysis The Refined Alternatives were further developed with input from the Project Advisory Group, and County and City Councils/Commissions. Additional data collection and analysis was completed as part of this effort, including the following: Feeder bus service Parcels for proposed stations and Park-n-Ride facilities Service (operating) plans Daily ridership estimates for peak and non peak periods Refined capital cost estimates Refined operating and maintenance (O&M) cost estimates Impacts to land use, traffic, and the environment The Refined Alternatives evaluation represented the final screening performed for the Study. Complete details of the Refined Alternatives screening process are documented in the following technical reports: Final Conceptual Definition of Alternatives, Report May 2016 Draft Transit-Oriented Development Readiness Analysis Report, June 2016 Final Evaluation of Refined Alternatives Report, August 2016 The Refined Alternatives analysis included a qualitative, quantitative, and comparative evaluation, all directly tied to the Goals and Objectives. This final evaluation provided more detail than the previous screenings due to higher level of conceptual engineering, operational, environmental, ridership, and cost data that was developed for each Refined Alternative. This final screening included an analysis that focused on the key differences between the alternatives across the quantitative and qualitative measures, highlighting the advantages and disadvantages of each alternative and identifying the key trade-offs, costs and benefits. The Evaluation of Refined Alternatives Report presents the different impact assessments conducted, including: right-of-way needs and impacts; capital and operating cost estimates, transportation system impacts; and socio-economic and environmental impacts. The report also applies the Federal Transit Administration (FTA) rating evaluation to each of the Refined Build Alternatives. The report concludes by identifying a framework for a potential implementation strategy which is presented in Section 3.0 of this Project Summary Report February 2017
48 2.7.1 Description of Refined Alternatives Evaluated The following is a description of the alternatives advanced to the Refined Alternatives stage. No Build Alternative The No-Build Alternative was developed as a baseline to compare with the Refined Build Alternatives with respect to estimated travel time and ridership impacts. It reflects local transportation conditions without any major improvements, beyond those that are already planned for in the Cost Feasible Element of the River to Sea TPO s 2040 Long Range Transportation Plan. The No-Build Alternative includes: the existing transit network in Volusia County; the SunRail Phase 2 North extension to DeLand; and two planned feeder bus routes that would serve the future SunRail DeLand station. Refined Build Alternative #4 Bus Rapid Transit (BRT) Refined Build Alternative #4 is a bus rapid transit (BRT) alternative which would provide service connecting southwest Volusia with DeLand, and further from DeLand to Daytona Beach. This connection would be provided with two BRT services, one operating from the existing DeBary SunRail station, and the other from the planned DeLand SunRail station to Daytona Beach (see Figure 2-7). This alternative represents a more substantial premium transit service, with more frequent service and stops than an express bus service. In Daytona Beach, the services would connect with a new Westside Intermodal Station, and then continue to the existing Votran Transfer Plaza off U.S. 1, using International Speedway Boulevard (ISB). The service from the DeBary SunRail station would operate on U.S. 17/92 and U.S. 92 (ISB), with a total length of 36 miles. The service from a new DeLand SunRail station would operate on S.R. 44, U.S. 17/92 and U.S. 92, with a total length of 27 miles. For the DeBary to Daytona Beach BRT route, service was assumed to operate every 30 minutes during weekdays and weekends. The DeLand Station to Daytona Beach service would only operate during weekday peak periods with 30-minute frequency. Along both routes, the BRT service would operate in mixed traffic. To provide some level of priority to BRT vehicles, Business Access Transit (BAT) lanes, where BRT vehicles and right turn traffic would share the outside lane, were analyzed on six- or eightlane sections on U.S. 92 and U.S. 17/92 and are also shown in Figure The results of the analysis for BAT lane implementation are presented in Chapter 6 of this report February 2017


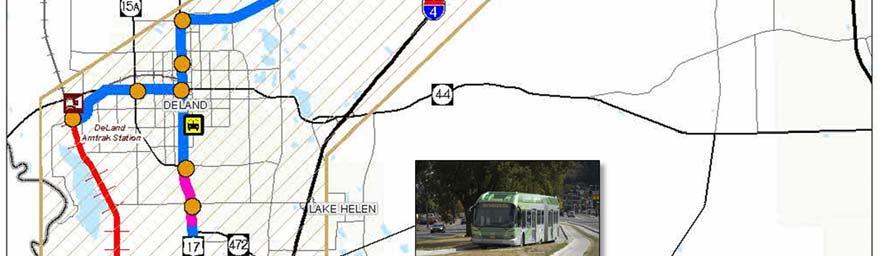
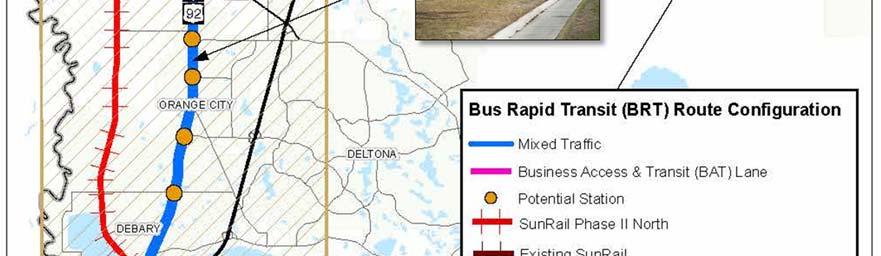

49 Figure Refined Build Alternative #4 - BRT 2-41 February 2017
50 Refined Build Alternative #5 Commuter Rail The Refined Build Alternative #5 would provide new commuter rail service from the existing DeBary SunRail Station to a new Intermodal Transit Station in Daytona Beach north of Daytona International Airport and east of the Daytona International Speedway. The overall length of the alternative would be approximately 34 miles, with approximately 26 miles of new rail corridor. A total of four stations would be provided at: S.R. 472 and I-4; S.R. 44 and I-4; U.S. 92 and LPGA Boulevard; and the intermodal station at Daytona International Airport. All but the new Intermodal Transit Station would have parkand-ride facilities. A base rail alignment and two options were developed for the refined alternatives evaluation. The two options were developed to reduce the number of rail crossings required and to improve physical design features. The options depart from the base alignment along S.R. 472 in Orange City, and along U.S. 92 in West Daytona Beach. Figure 2-15 shows the Alternative. Base Alignment The base alignment would depart from the proposed SunRail Phase 2 North corridor near Fatio Road approximately eight miles north of the existing DeBary SunRail Station. From there, the alignment would transition to the south side of Fatio Road. The alignment would follow Fatio Road and an unimproved roadway/ utility corridor at-grade across U.S. 17/92 where it would transition either to the median or the east side of S.R The alignment would continue along S.R. 472, to past Martin Luther King (MLK) Boulevard, northwest of the I-4/S.R. 472 interchange. At this point, it would curve north along the west side of I-4, then transition on an elevated structure into the median of I-4. The alignment would continue in the median of I-4 to the U.S. 92/ I-95 Interchange area, where the alternative would turn north into the I-4/ U.S. 92 connector crossing the westbound lanes of I-4 on elevated structure, then transition either to the median or south side of U.S. 92. From there, the alignment would proceed along U.S. 92 through the U.S. 92/ I-95 interchange, then transition to an elevated structure and curve south crossing Williamson Boulevard. The alignment would then transition to grade and proceed east along the south side of relocated Midway Avenue to the new Intermodal Transit Station north of the airport. S.R. 472 East Side Option The S.R. 472 east side option was developed to reduce roadway/rail crossings on S.R The rail alignment would be constructed in the existing westbound lanes of S.R. 472 and the S.R. 472 westbound lanes would be relocated to the existing median. At S.R. 472/ MLK Boulevard, the alignment would join the base alignment at the S.R. 472/ I-4 station. This option would require additional roadway reconstruction along S.R I-95 Undercrossing Option An undercrossing option at I-95 was developed to avoid the tight geometry of the base option that is required due to the Daytona Beach International Airport Runway Protection Zone and the U.S. 92/ I- 95 interchange structures. This option would depart from the median of I-4 just after the U.S. 92 connector ramp and cross the westbound lanes of I-4 on structure. The alignment would transition to grade and turn east along the south side of U.S. 92 to a point approximately ¼ miles east of Gene Daniels Road, where it would transition below grade to a tunnel section. The alignment would continue in a tunnel under the U.S. 92/ I-95 interchange and Williamson Boulevard, then transition to grade to join the base alignment along the south side of a relocated Midway Avenue. This option would require significant tunnel structure, ventilation and drainage February 2017

51 PROJECT SUMMARY REPORT Figure Refined Build Alternative #5 -Commuter Rail 2-43 February 2017

52 Table Station Locations and Access Mode Summary of Refined Alternatives Evaluation This section presents a summary of the evaluation of refined alternatives including the following assessments: right-of-way needs and impacts; capital and operating cost estimates; transportation system impacts; socio-economic and environmental impacts; and summary of the preliminary rating evaluation using FTA s Project Justification rating criteria. Right-of-Way Impacts and Costs The Refined Build Alternatives will require right-of-way acquisition as part of the project development. From the conceptual alignment layout plans and a GIS analysis, FDOT developed conceptual stage Right-of-Way (ROW) cost estimates for the Refined Build Alternatives. Refined Build Alternative #4 BRT The right-of-way impact would be associated with the construction of BRT stations outside of existing public ROW, as well as for the park-n-ride facilities. It should be noted that the station locations identified during this study were preliminary and locations could shift as project development progresses. Anticipated impacts are identified below: The following proposed station locations along U.S. 17/92 may result in potential business damages due to loss of parking: Rhode Island Avenue northbound, Pennsylvania Avenue southbound and Spring Garden Avenue eastbound February 2017
53 The proposed Saxon Boulevard northbound station may impact the capacity of an existing water retention pond capacity. The proposed Orange Camp Road southbound station and the proposed U.S. 17/92 and U.S. 92 westbound station would require relocation of the main display sign of businesses operating at this location. Further evaluation is recommended for the proposed station locations listed above to identify mitigation measures for the potential impacts identified. Table 2-15 presents a summary of the number of parcels impacted by parcel type. Table Parcels Impacted - Refined Build Alternative #4 Parcel Type Number of Parcels Impacted Business 12 Residential 0 Unimproved 6 Total 18 Relocates 0 The typical size of an on-street station was assumed to be 10 x 70, with minimal impacts to parking in most cases. However, some of the platforms were so far into parking areas that potential business damages were included to account for the impact shown by the taking. In addition, an allocated contingency of 25% was applied to the ROW cost estimates prepared by FDOT. Due to the high number of stations and the potential for these stations to move over time given potential adjacent local land use changes or roadway improvements, the ROW impact and associated ROW cost was assumed by FDOT to be of lesser precision. Therefore the 25% contingency amount was established as a conservative approach for ROW cost additives. This contingency is also reflective of possible ancillary BRT station features outside of station platform and potential localized roadway widening. Table 2-16 summarizes the ROW cost estimates for the Refined Build Alternative # February 2017
54 Table Refined Build Alternative #4 ROW Cost Estimate Description Cost Direct Labor Costs $180,000 Land Costs* $3,369,000 Operations** $722,000 Subtotal $4,271,000 Contingency (25%) $1,067,750 Total $5,338,750 *Land Costs: Land, improvements, severance damages, administration, settlements, litigation awards, business damages, owner appraisal fees, owner CPA fees, defendant attorney fees, other condemnation costs. **Operations: Appraisal fees, business damage CPA fees, court reporter and witness fees, and attorney fees (outside counsel). Refined Build Alternative #5 Commuter Rail This alternative involved additional considerations related to potential right-of-way impacts as identified below. A portion of the Refined Build Alternative #5 alignment traverses an area that has high-voltage power lines. The ROW estimate does not include any costs associated with relocating these power lines. This alternative also includes the option of elevating the rail line over some commercial properties on the east side of the U.S. 92/I-95 interchange. Due to the conceptual nature of this study s design, specific design criteria were not yet available so assumptions were made regarding the possible damages associated with an elevated track. No major improvements would be allowed under the train tracks as part of this estimate. This alignment would also go through an RV Park and Car Rental facility that is leased out by Volusia County on the site where the potential Intermodal Transit Station would be located north of the Daytona International Airport. Severance and business damages would be associated with the RV Park and Car Rental facility based on the current concept design for Refined Build Alternative # February 2017
55 Table 2-17 presents a summary of the number of parcels impacted by parcel type. Table Parcels Impacted - Refined Build Alternative #5 Parcel Type Number of Parcels Impacted Baseline I-95 Undercrossing Business 9 10 Residential 5 5 Unimproved Total Relocate 3 3 The ROW costs developed for Refined Build Alternative #5 include land acquisition, relocation, operations and direct labor. The land acquisition cost estimate included property acquisition costs associated with the new rail alignment, rail storage/maintenance facility, and stations and park-n-rides to the extent they extend outside of public right-of-way. Additionally, an allocated contingency of 15% was applied to the ROW cost estimates prepared by FDOT. This contingency reflects any added property needed for rail ancillary features such as signal housing and localized roadway widening. The contingency percentage of 15% is less than that assumed for BRT (25%) to account for a perceived greater potential to reduce rail ROW impacts in future design phases. Table 2-18 summarizes the ROW cost estimates for the Refined Build Alternative #5 baseline and S.R. 472 option alignments. Table 2-19 summarizes the ROW cost estimates for the Refined Build Alternative #5 I-95 undercrossing alignment. Table Refined Build Alternative #5 Baseline and S.R. 472 Option ROW Cost Estimate Description Cost Direct Labor Costs $930,000 Relocation Costs $185,000 Land Costs* $46,336,000 Operations** $3,324,000 Subtotal $50,775,000 Contingency (25%) $12,694,000 Total $63,469,000 *Land Costs: Land, improvements, severance damages, admin. settlements, litigation awards, business damages, owner appraisal fees, owner CPA fees, defendant attorney fees, other condemnation costs. **Operations: Appraisal fees, business damage CPA fees, court reporter and witness fees, move cost estimates fees, demolition contracts, attorney fees (outside counsel), hazardous waste investigations February 2017
56 Table Refined Build Alternative #5 I-95 Undercrossing ROW Cost Estimate Description Cost Capital Cost Estimates Direct Labor Costs $1,030,000 Relocation Costs $115,000 Land Costs* $35,958,000 Operations** $2,935,000 Subtotal $40,038,000 Contingency (25%) $10,010,000 Total $50,048,000 *Land Costs: Land, improvements, severance damages, admin. settlements, litigation awards, business damages, owner appraisal fees, owner CPA fees, defendant attorney fees, other condemnation costs. **Operations: Appraisal fees, business damage CPA fees, court reporter and witness fees, move cost estimates fees, demolition contracts, attorney fees (outside counsel), hazardous waste investigations. In accordance with the FTA recommended cost estimating methodology procedures, capital costs were estimated in nine major component categories. There are five FTA Standard Capital Cost (SCC) construction categories which include: guideway elements, stations, support facilities, site work, and systems. The other four SCC categories are right-of-way, vehicles, professional services, and contingencies. The capital costs for the Refined Build Alternative #4 were derived based on BRT projects in Florida. Capital cost estimates for the Refined Build Alternative #5 were derived from the SunRail Phase 2 project cost estimates, as presented in the SunRail Phase 2 South Explanation of Estimate Report. The five FTA SCC construction category cost elements were estimated with the following assumptions: Guideway & Track Elements o BRT (Alt #4) - assumed to operate on existing roadways. Guideway costs for BAT lanes with the BRT alternative assumed costs for striping and signing only. o Commuter Rail (Alt #5) - implementation of new rail tracks and bridge structures were assumed for the rail alternative. Stations o BRT (Alt #4) - design of BRT stations assumed provision for shelter, benches, real-time information, lighting, bike racks and emergency call box design of rail stations consistent with recent SunRail station amenities. o Commuter Rail (Alt #5) in addition to the standard SunRail station passenger amenities noted above, a specific number of park-and-ride spaces at rail stations were assumed based on ridership projections. Support Facilities: o BRT (Alt #4) n/a - A new bus operations & maintenance facility was not included in this Alternative given Votran s existing west side facility and the need for Votran to 2-48 February 2017
57 expand the east side facility, irrespective of future BRT development. Also, there was a desire to minimize project costs related to items that might be warranted with regular service increases. o Commuter Rail (Alt #5) - a light maintenance facility for the rail alternative was assumed. A representative site was used to estimate right-of-way acquisition and infrastructure costs. The light maintenance facility will generally consist of storage for trains, fueling, washing and minor maintenance. Site Work & Special Conditions: o BRT (Alt #4) and Commuter Rail (Alt #5) - includes demolition, site utilities, environmental mitigation, pedestrian / bike access, landscaping, automobile access, and temporary facilities. Systems: o BRT (Alt #4) includes passenger information systems at stations and fare collection systems. o Commuter Rail (Alt #5) - includes train control and wayside signals, passenger information systems at stations and fare collection systems. Right-of-way and Relocation Costs o BRT (Alt #4) and Commuter Rail (Alt #5) - provided by FDOT and previously presented. Vehicles: o BRT (Alt #4) - vehicle costs were determined based on peer BRT project cost estimates. BRT vehicles were assumed to be standard 40-foot coaches. o Commuter Rail (Alt #5) - vehicle costs were determined based on SunRail costs. Commuter rail vehicle costs were estimated by train sets to include the locomotive, one cab car, and one coach. o BRT (Alt #4) and Commuter Rail (Alt #5) - the projected number of vehicles was estimated based on an operating plan developed for each Refined Build Alternative, reflective of assumed service frequency and hours of operation and predicted operating speeds. The number of vehicles required to provide premium transit service headways was calculated taking predicted operating factors into consideration. The number of vehicles by technology for each alternative was multiplied by the estimated vehicle cost. Professional Services: o BRT (Alt #4) and Commuter Rail (Alt #5) - engineering, management and administration costs include anticipated future allowances for preliminary engineering (4%), final design (6%), project management (5%), construction management (8%), surveys (3%), testing and inspection (3%), startup (1%). These allowances are applied to the total civil construction costs. Audits, legal fees, and permits were assumed to be included under each civil construction and vehicle category. Allocated Contingencies: o BRT (Alt #4) and Commuter Rail (Alt #5) contingencies were applied to the capital costs. Allocated contingencies ranging from 5% for BRT vehicles and 15% for commuter rail vehicles to 35% for all civil construction items were assumed at this initial level of design. This contingency factor typically covers items that were not identified 2-49 February 2017
58 during the conceptual design and provides an allowance for unforeseeable expenses that the project may incur. The capital cost estimates were prepared at a conceptual engineering level, reflective of general site layouts and typical sections for civil construction items. Table 2-20 is a summary table that presents the capital cost estimates, in year 2015 dollars. Costs for Business Access and Transit (BAT) lanes, as discussed in the Evaluation of Refined Alternatives Report, have been included in the capital cost estimates, including signing and striping and overhead signage. Transit Signal Priority (TSP) capital costs, however, were not included in the capital cost estimate for BRT (Alternative #4) because it was assumed that any TSP application would be covered by FDOT as part of the Regional TSP implementation program currently underway. The more detailed FTA SCC definitions and worksheets for the capital cost estimates for each Refined Build Alternative were provided in Appendix A of the Evaluation of Refined Alternatives Report. FTA SCC Table Refined Build Alternatives Capital Cost Estimates Description Refined Build Alternative #4 BRT * Refined Build Alternative # 5 Rail * Baseline S.R. 472 Option I-95 Undercrossing 10 Guideway & Track Elements $0.7 $331.0 $329.1 $ Stations, Stops, Terminals, Intermodal Support Facilities: Yards, Shops, Admin. Buildings $6.5 $25.1 $25.1 $25.1 $0.0 $19.1 $19.1 $ Sitework & Special Conditions $8.0 $144.3 $151.2 $ Systems: Control Signals, Communications, Fare Collection ROW, Land, Existing Improvements $2.0 $159.4 $159.4 $159.4 $5.3 $63.5 $63.5 $ Vehicles** $32.0 $51.0 $51.0 $ Professional Services $6.1 $217.2 $218.9 $ Unallocated Contingency $0.4 $67.9 $68.4 $81.9 Total $61.1 $1,103.6 $1,090.7 $1,264.2 * Cost estimates in millions of 2015 dollars ** Vehicle cost includes feeder bus service vehicle cost Operating and Maintenance Cost Estimates Operating & Maintenance (O&M) cost estimates were developed based on the assumed operating plan for each of the Refined Build Alternatives. Operating statistics were projected based on general operating assumptions for each alternative and included calculation of peak vehicles and annual vehicle-hours which were used as inputs along with Votran and SunRail Phase 1 unit operating costs. Total fleet vehicle requirements were calculated for use in the capital cost estimates as well February 2017
59 The O&M cost estimates for the Refined Build Alternatives were derived by use of actual bus and commuter rail O&M costs experienced in the region. For the new BRT service and the assumed local feeder bus service to be provided by Votran, actual Votran bus O&M cost per revenue hour was applied. Service hours for the greater bus network for the BRT Alternative assumed decreased Votran service levels on the west side of the County; and increased service to certain locations such as the County jail, based on Study Project Advisory Group input, to address the replacement of Route 60 service with the new BRT service. For commuter rail, the actual SunRail Phase 1 O&M costs experienced to date was applied on a unit cost basis. The unit O&M costs for both BRT and commuter rail include the following components: Operator Salaries & Wages Other Salaries & Wages Fringe Benefits Services Fuel & Lubricants Tires & Tubes Other Materials & Supplies Yards and Facilities Maintenance Utilities Casualty & Liability Taxes Expense Transfers To identify the feeder bus cost estimates, the incremental service frequency addition to match the commuter rail and BRT service levels compared to the no-build scenario service levels was applied. The O&M cost associated with service improvements identified in the Votran Transit Development Plan (TDP) were not included. The O&M cost estimates were prepared at a conceptual engineering level, reflective of general operating assumptions as described in the Evaluation of Refined Alternatives Report. Table 2-21 presents the O&M cost estimates, in year 2015 dollars, for the assumed service plan. Further details on O&M costs, including bus fleet requirements, are presented in Appendix B of the Evaluation of Refined Alternatives Report February 2017
60 Table Refined Build Alternatives O&M Cost Estimates* Refined Build Alternative Service Frequency Annual Service Hours No. of Vehicles/ Train Sets Required Annual O&M Cost * Feeder Bus Cost* Total O&M Cost Alternative #4 -to DeBary Station Alternative #4 - to DeLand Station 30 min, 14 hrs/day, 7 days/week 30 min. weekday peak 53, $4.3 7,600 5 $0.6 $11.5 BRT Total 60, $4.9 $11.5 $16.4 Alternative #5 - Main Line Alternative #5 - Shuttle to DeLand 30 min. weekday peak, 2 hours offpeak 30 min. weekday peak, 2 hours offpeak 10,600 5 $16.8 5,400 $8.6 Rail Total 16,000 5 $25.4 $8.5 $34.0 * Cost estimates in millions of 2015 dollars Travel Time and Ridership The FTA Simplified Transit Operations Program Software (STOPS) model was applied in developing both 2015 and 2040 transit ridership projections for the No-Build and Refined Build Alternatives, assuming the build alternative transit improvements would be in place in both years. As an input to the ridership projections, travel time estimates for the build alternatives were derived, accounting for the number and spacing of stops and level of transit priority treatments applied. The STOPS model applied future 2040 adopted population and employment projections that were used in developing the R2CTPO 2040 LRTP. Ridership projections were developed for both average weekday and annual conditions, including local/feeder bus ridership for each alternative. Refined Build Alternative #4 -BRT For the Daytona Beach to DeBary SunRail station BRT route, the average travel time of 1:09 for both directions is approximately 50% less than the current local bus travel time (2:05) between the existing Votran Transfer Station in Daytona Beach and the DeBary SunRail station (the No- Build condition). Table 2-22 includes overall ridership results for the alternative. The BRT trips associated with Refined Build Alternative #4 increased 46% between the current year (2015) and horizon year (2040). In terms of numbers of trips, this is an increase from 1,400 to 2,050 trips over the 25 year period. Additionally, the Votran system as a whole is projected to have a 30% increase in boardings. In 2015, 1,500 of the Votran system boardings were projected to be from new routes that were added to the system to provide connectivity with Refined Build Alternative #4.. In 2040, the new routes account for 2,300 of the system boardings. One of the primary markets for the BRT is home-based work trips (employees traveling from home to work). These account for 60% of the 2015 BRT trips and 61% of the trips in Additionally, the regional linked trips are projected to increase by 43% between 2015 and 2040.The increase $ February 2017
61 in regional linked trips is very similar to the increase in trips as a result of the Refined Build Alternative #4. Table Refined Build Alternative #4 - Daily Ridership Results Result Performance Measure % Change Home-Based Work Trips 875 1,275 46% All Other Trips % Total Trips 1,400 2,050 46% Transit Dependent Trips % New Regional Linked Trips 2,050 2,925 43% VMT Reduction (1.3 persons/vehicle) (9,300) (14,075) 51% SunRail Boardings 5,675 8,275 46% Votran System Boardings 14,550 18,850 30% Source: Project FTA STOPS Model Refined Build Alternative #5 Commuter Rail The Refined Build Alternative #5 Commuter Rail was coded and run using the STOPS model, again assuming the build alternative improvements would be in place in both 2015 and 2040, for comparison purposes. Inputs and parameters for the model are discussed in previous sections of the document. For the commuter rail route from the DeBary SunRail Station to Daytona Beach, the average travel time of 41 minutes is almost 70% faster than the existing local bus connection between these points (2:05), and 41% faster than the identified BRT connection (1:09). Table 2-23 includes overall rail ridership results for the alternative. The trips associated with Refined Build Alternative #5 increase by 50% between the 2015 and 2040 build scenarios. This is an increase from 475 to 725 commuter rail trips. Additionally, the Votran system as a whole projected a 28% increase in boardings. In the 2015 existing year, 675 of the Votran system boardings are from new routes that were added to the system to provide connectivity to Refined Build Alternative #5. In 2040, the new routes are projected to account for 1,000 of the system boardings. Table Refined Build Alternative #5 Daily Ridership Results Result Performance Measure % Change Home-Based Work Trips % All Other Trips % Total Project Trips % Transit Dependent Trips % New Regional Linked Trips 2,300 3,150 37% VMT Reduction (1.3 persons/vehicle) (7,400) (13,550) 83% SunRail Boardings 5,600 8,325 49% Votran System Boardings 15,500 19,850 28% Source: Project FTA STOPS Model Transportation System Evaluation The transportation system evaluation focused on the impacts the Refined Build Alternatives would have on traffic operations in the study corridor. This included the impact of a package of transit priority 2-53 February 2017
62 treatments for the BRT alternative in particular semi-exclusive bus lanes, queue jumps, and transit signal priority, and a determination of the feasibility of such treatments in the short vs. long-term. For the rail alternative, the impact of at-grade rail crossings on traffic operations, and the need for any grade separation of rail at a particular crossing, was assessed. Refined Build Alternative #4 BRT Business Access and Transit (BAT) Lanes Traffic operations analyses along U.S. 17/92, from S.R. 472 to S.R. 15A/Taylor Road; and along U.S. 92 (International Speedway Boulevard), from I-95 to S.R. 5A (Nova Road); were conducted to understand how the signalized intersections along each corridor would operate upon converting the outside travel lanes to Business Access Transit (BAT) lanes. A BAT lane serves as a semi - exclusive transit lane with the exception that it also serves as a right-turn lane for general traffic and a lane for local deliveries and passenger pickups/drop-offs. U.S. 17/92 from S.R. 472 to S.R. 15A/Taylor Road is a six-lane divided urban section, located at the southern edge of DeLand. The implementation of BAT lanes would require converting the outside northbound and southbound travel lanes to BAT lanes. As a result, the northbound/southbound through movements at the primary signalized intersections within this section of U.S. 17/92 would be reduced to two lanes in each direction for general traffic with the third lane serving as a right-turn lane for general traffic while also accommodating the through movement for transit vehicles. The analysis for U.S. 17/92 focused on evaluating how the intersections at Orange Camp Road/McGregor Road and S.R. 15A/Taylor Road operate upon reducing the northbound and southbound through movements to two lanes. Relative to U.S. 92 (International Speedway Boulevard), located within Daytona Beach in Volusia County, the focus was on the implementation of BAT lanes within the existing eight-lane section between I-95 and S.R. 5A (Nova Road). Similar to U.S. 17/92, operational analyses were conducted at the signalized intersections to understand how each location will function with three eastbound and westbound through lanes and the BAT lanes. The analyses indicated a 28% travel time savings benefit could be achieved if BAT lanes iwere developed in the existing six-lane or eight-lane roadway sections) This was derived from content in the Transit Capacity and Quality of Service Manual, 3 rd Edition. However, the results of the intersection capacity analysis involving BAT lanes along the six lane section of U.S and eight-lane section of U.S. 92 indicated that additional roadway widening would be needed to achieve acceptable levels of service at certain locations. Given the right-of-way impact of widening U.S. 17/92 or U.S. 92, other more cost feasible approaches for BRT operations were considered, including intersection priority treatments such as queue jump lanes and transit signal priority. Queue Jump Lanes Traffic operations analyses were conducted for five (5) intersections on U.S. 17/92 for the purposes of evaluating how projected queues for northbound and/or southbound through movements on U.S. 17/92 may impact the potential for implementing transit queue jump lanes at these intersections. For the purposes of this analysis, the focus was on providing transit queue jump lanes for buses traveling northbound and/or southbound through the intersections. Northbound and southbound through buses on U.S. 17/92 would use an exclusive right-turn lane for the purposes of continuing through an intersection. The right-turn lane (queue jump lane) would have a separate signal phase to allow vehicles in the lane to receive a green light in advance of the vehicles 2-54 February 2017
63 in the adjacent traffic lanes. Thus, a bus in the queue jump lane would continue north/south through the intersection in advance of all other through vehicles. Should queues in the lanes of adjacent through movements extend beyond a right-turn lane that is planned to be used as a queue jump lane, then the viability of the queue jump lane would be compromised unless the right-turn lane was lengthened, as buses would not be able to access the queue jump lane. This analysis was conducted to determine if the queues in the adjacent through lanes extend beyond the northbound and/or southbound right-turn lanes for the following intersections where right turn lanes are present (as of September 2016): U.S. 17/92 at Highbanks Road (DeBary) U.S. 17/92 at Pine Meadows Drive (DeBary) U.S. 17/92 at New York Avenue (Orange City) U.S. 17/92 at Minnesota Avenue (Orange City) U.S. 17/92 at Plymouth Avenue (DeLand) Given the results of the queue jump analysis, some lengthening of existing right turn lanes would be required to allow buses to access the lane during peak periods to take advantage of a queue jump signal. Given the difficulty of extending existing right turn lanes at identified locations, queue jump lanes were not assumed in the operating plan for Alternative #4 BRT. Transit Signal Priority Transit Signal Priority (TSP) is another strategy used at signalized intersections in which the traffic signal controllers are able to detect approaching transit vehicles and adjust signal timing/sequencing to advance or preserve a green signal indication for the transit vehicles, thereby reducing the delay transit vehicles experience at the traffic signals. While TSP is not currently programmed on either U.S. 17/92 or U.S. 92 in Volusia County, a qualitative assessment of which intersections would be likely to experience a benefit by the installation of TSP was conducted for this Study. Along the U.S. 17/92 corridor from Dirksen Avenue in DeBary to U.S. 92 in DeLand there are 28 signalized intersections, inclusive of Dirksen Avenue and U.S. 92. Along U.S. 92, from U.S. 17/92 in DeLand to U.S. 1 in Daytona Beach, there are 27 signalized intersections. While traffic data and capacity analyses were not readily available for all intersections, it was available for several of the locations. Utilizing the available data/analyses and local knowledge of the corridor, Table 2-24 provides a summary of those intersections where TSP may prove to be beneficial. For purposes of this analysis, TSP was determined to be a viable alternative if the anticipated overall intersection level of service (LOS) for year 2040 ranged between LOS C and E. In this range of LOS, there would be travel time savings benefits to buses with negligible or minor impact on general traffic operations. Conclusion Based on the various traffic analyses conducted, TSP was identified as the only cost-effective strategy for a transit priority treatment with the BRT application in the U.S. 17/92 ad U.S. 92 corridors February 2017
64 Table Transit Signal Priority Assessment for U.S. 17/92 and U.S. 92 Major Roadway Intersecting Roadway TSP Beneficial? Major Roadway Intersecting Roadway TSP Beneficial? Dirksen Dr Likely Amelia Ave N/A Highbanks Rd Likely Garfield Ave N/A Pine Meadow Dr DeBary Plantation Blvd Unlikely Detrick Ave/Jacobs Rd N/A Unlikely Kepler Rd N/A Saxon Blvd Likely West Pkwy N/A Enterprise Rd Likely Indian Lake Rd N/A Rhode Island Ave Likely LPGA Blvd Unlikely Ohio Ave Unlikely Tomoka Farms Rd Unlikely Blue Springs Ave Unlikely I-95 NB Off-Ramp Likely Graves Ave Likely Indigo Dr Unlikely French Ave Unlikely Thames Rd Unlikely U.S. 17/92 New York Ave Likely Williamson Blvd Unlikely Minnesota Ave (Orange City) Unlikely Turn One Dr Unlikely Firehouse Rd Likely U.S. 92 Fentress Blvd Likely Orange Camp Rd Unlikely Plaza Entrance Unlikely S.R. 15A Unlikely Industrial Pkwy Likely New Hampshire Ave Unlikely Bill France Blvd Unlikely Beresford Ave Unlikely Midway Ave Likely Voorhis Ave Likely Hagen Terrace Unlikely Howry Ave Likely S.R. 483/Clyde Morris Blvd Unlikely S.R. 44 Likely Tarragona Way Unlikely Indiana Ave Likely Seneca St Likely Rich Ave Likely S.R. 5A/Nova Rd Unlikely Wisconsin Ave N/A Adams St N/A Minnesota Ave (DeLand) Pennsylvania Ave N/A Lincoln St N/A N/A Martin Luther King Blvd Plymouth Ave Likely U.S. 1 Likely U.S. 92 Likely N/A - Data and Analyses are not available to make a determination N/A 2-56 February 2017
65 Refined Build Alternative #5 Commuter Rail The preliminary alignment identified for the potential extension of SunRail to eastern Volusia County, includes at-grade crossings across several roadways. The following discussion summarizes anticipated impacts of potential at-grade rail crossings as it relates to the operations of the roadways and intersections along the identified commuter rail corridor in the year The areas of focus included: Southbound U.S. 17/92 to eastbound S.R. 472 ramp S.R. 472 at MLK Jr. Beltway intersection U.S. 92 at LPGA Boulevard intersection U.S. 92 at Tomoka Farms Road intersection For the purposes of this analysis it was estimated that SunRail trains will operate with 30-minute headways in each direction during the weekday AM and PM peak periods. Thus, each at-grade crossing will have four train crossings every hour. The findings of the at-grade crossing assessment are as follows: The at-grade rail crossing analysis revealed that crossing commuter rail at-grade through the S.R. 472/MLK Jr. Beltway, U.S. 92/LPGA Blvd. and U.S. 92/Tomoka Farms Road intersections would in itself not have a major impact on traffic operations, given the limited train headway. However, each of those intersections will need to be improved with auxiliary lanes, as well as potential through lane additions to provide under-capacity conditions (without rail) during weekday peak periods in ROW costs associated with approaches to the grade crossings were included in the capital cost estimates. Further evaluation will be required to assess the ultimate required intersection configuration, and potential rail grade separation at S.R. 472/MLK Parkway and U.S. 92/LPGA Blvd., if rail is integrated into the recommended alternative. A rail grade separation in the median at the U.S. 92/Tomoka Farms Road intersection is not physically feasible as it cannot tie into the elevated alignment option east of I-95. Preliminary Environmental Evaluation A preliminary environmental evaluation was performed by determining potential impacts to social, natural, cultural, and physical resources within the Study Area resulting from the implementation of the refined build alternatives. FDOT s Project Development and Environment (PD&E) Manual, as well as federal and state regulations, provided a general framework for this preliminary environmental evaluation. The concept plans for the refined build alternatives were presented in the Conceptual Definition of Alternatives Report for the VTCS provide the physical alignments and right-of-way and typical section requirements used to assess potential project impacts. The environmental conditions were identified and reviewed using Geographical Information Systems (GIS). Base line data reported in this section provides the basis upon which more detailed environmental assessments may be conducted in subsequent project development phases. Social Environment Within the current timeframe and the planning horizon of the R2CTPO s 2040 LRTP, Volusia County does not have the land use densities and intensities to support premium transit modes. Because of the desire for premium transit in Volusia County and focus on promoting more regional connectivity, the LRTP included a transit oriented development land use scenario. Proper planning and urban design is 2-57 February 2017
66 needed to achieve the desired densities and intensities for the implementation of a premium transit system in the future. The segments of Refined Build Alternative #4 that operate within mixed-traffic are not expected to impact any of the community resources or interfere with existing community services. Right-of-way acquired for stations and the associated construction may impact the surrounding property owners. However, for the BRT service, the physical impacts are expected to be limited, and will provide a social benefit of better access to community services along the corridor. The alignment for Refined Build Alternative #5 traverses more rural areas of Volusia County; therefore, there are fewer community services within the buffers that were analyzed. However, there is a potential to moderately impact retail property owners and various conservation areas while providing limited access to the county s community services located between the major station locations. Some of the more rural station locations may have the potential to spur economic development in that area; therefore, creating access to services in the future. Refined Build Alternative #5 provides more direct regional connectivity compared to Refined Build Alternative #4 due to the requirement to transfer between buses during the course of the trip. Both alternatives have the potential to provide regional connectivity and job access to residents and visitors of Volusia County. If either alternative was advanced, more in depth review of potential economic impacts would be evaluated. The Environmental Justice (EJ) analysis assessed the alternatives based on the low-income and minority population surrounding the corridor alignments and the associated impacts and benefits that may be a result of implementing the Refined Build Alternatives. Refined Build Alternative #4 appeared to provide enhanced transit service and generally provided an affordable transportation alternative for both EJ and non-ej individuals. The Refined Build Alternative #5 presented benefits that would be associated with the implementation of rail service, including decreased cross-county travel time, environmental benefits, and economic benefits of providing access to expanded employment opportunities. Therefore, the social, economic, and environmental benefits will be borne by the same populations that would have the burden of the construction and facility location impacts. Prior to implementation of these alternatives, further study would be needed of the final designs, specifically the siting of maintenance facilities and construction impacts. Natural Environment The assessment of the natural environment included an evaluation of impacts around each of the designated stations as well as the alignment or routing between stations. For the Refined Build Alternative #4, there are no natural upland or wetland habitats for protected species and no anticipated impacts to wetlands or wildlife for most of the potential station locations. The southbound Saxon Boulevard station would require a survey for both gopher tortoises and scrub-jays if expansion outside of the existing right of way is needed. The LPGA station and Tomoka Farms station would be located adjacent to a jurisdictional surface water ditch. Proposed impacts could require mitigation. The assessment for natural environment for the Refined Build Alternative #5 revealed various potential impacts to both natural upland or wetland habitats for protected species. Based on the results of the preliminary environmental evaluation conducted for this study, further detailed evaluations of potential impacts to the natural environment, including but not limited to species specific surveys and effect determinations, may be required during subsequent project development phases and potential impacts may require mitigation prior to project implementation February 2017
67 Cultural Environment The Refined Build Alternative #4 presented minimal involvement with cultural resources. During subsequent project development phases, construction in the vicinity of previously recorded significant resources should be coordinated with the Florida State Historic Preservation Officer (SHPO) to gain an official no adverse effect determination. Similarly, the BRT route through the historic districts should also be reviewed by SHPO during future project development. The Refined Build Alternative #5 presents very little involvement with cultural resources. No archaeological survey is recommended for construction within the I-4 median. Construction areas beyond the existing right-of-way (e.g., park and ride facilities, stations, new alignment, etc.) should be subjected to a cultural resource assessment survey including archaeological testing and architectural history survey for both Refined Build Alternatives (during future project development). Physical Environment The environmental analysis revealed that most impacts to the environment would be associated with the development of Refined Build Alternative #5. In particular, the sections of new rail line which would not be constructed within the median of roadways such as the new tracks and light maintenance facility south of Fatio Road, and for the rail alignment options on the east side of S.R. 472, on the south side of U.S. 92, and in the southeast quadrant of the U.S. 92/I-4 interchange, would have greater noise and potential vibration impacts where adjacent to sensitive residential and retail properties. The rail alternative would also provide the greatest air quality improvement, by reducing CO, NO x, and PM emissions more than the BRT alternative. However, the BRT alternative would provide some benefit in emissions reduction as compared to the No-Build alternative. Summary Table 2-25 summarizes the social, natural, cultural and physical environment impacts of the refined BRT and commuter rail alternatives compared to the no-build. For each environment category a rating of either high (no or minimal impact), medium (moderate impact), or low (high impact) was identified. Table Summary of Environmental Evaluation of Refined Alternatives Environmental Resource SOCIAL No-Build Alt #4 BRT Alt #5 Commuter Rail Land Use Medium Medium Low Community Facilities Medium High Medium Socio-Economic Low Medium High Environmental Justice Low High Medium Regional Mobility Low Medium High NATURAL Wetlands High High Medium Wildlife Habitat High High Medium CULTURAL Historical/Archaeological High Medium Medium PHYSICAL Air Low Medium High Noise Medium Medium Low-Medium 2-59 February 2017
68 Contamination Low Medium Medium OVERALL Low-Medium Medium-High Medium 2-60 February 2017
69 FTA Project Justification and Rating Criteria The two Refined Build Alternatives were evaluated and rated according to the Federal Transit Administration (FTA) project justification criteria associated with its New Starts/Small Starts discretionary funding program. Based on estimated capital cost, Refined Build Alternative #4 was evaluated as a potential Small Starts project (under $100 million) and Refined Alternative #5 was evaluated as a potential New Starts project (over $100 million). FTA must rate and evaluate potential premium transit projects for funding in terms of both Project Justification and Local Financial Commitment (see Figure 2-16). For each criterion in these two categories, five potential ratings were identified: High, Medium-High, Medium, Medium-Low and Low. This section of the report summarizes an initial evaluation of the base project alternatives with respect to the two categories of criteria. Six Project Justification criteria have been identified by FTA: Mobility Improvements Cost-Effectiveness Environmental Benefits Economic Development Land Use Congestion Relief FTA weighs these six project justification criteria equally (16.67%) to determine a summary project justification rating for each project submitted for funding consideration. Three local financial commitment criteria have been identified: Current Financial Condition of Sponsor Commitment of Capital and Operating Funds Reasonableness of Financial Plan FTA weighs the first two local commitment criteria 25% each and reasonableness of financial plan 50%. In developing a total project rating, both the project justification rating and the local financial commitment rating each weigh 50%. FTA requires calculating the measures for evaluation criteria for the build alternative(s) assuming they were developed and operational in the current year. FTA also recognizes projects are design to address future growth. Given the need to balance the enhanced reliability of short-term estimates with the need to account for longer term benefits, project measures can be quantified in both current year and a horizon year. FTA will give a weight of 50% for the current year and a weight of 50% to the horizon year data. For the VTCS, 2040 is the horizon year February 2017


70 Figure New and Small Starts Project Evaluation and Rating Table 2-26 presents the summary of the project justification criteria ratings for the Refined Build Alternatives. The project justification rating for both of the Refined Build Alternatives is anticipated to be Low. FTA requires at least a Medium summary project justification rating to be considered for funding. Table FTA Project Justification Criteria Summary for Refined Build Alternatives Criterion Refined Build Alternative #4 - BRT Refined Build Alternative #5 - Commuter Rail Mobility Improvements Low Low Cost-Effectiveness Medium Low Congestion Relief Medium Medium Environmental Benefits Low Medium-Low Land Use Low Low Economic Development Low Low Project Justification Rating Low Low Proposed New and Small Starts projects are also required to be supported by an acceptable degree of local financial commitment, including evidence of stable and dependable financing sources to construct, maintain and operate the transit system, and maintain and operate the entire public transportation system without requiring a reduction in existing services. The measures FTA uses for the evaluation of the local financial commitment are: 2-62 February 2017
71 The proposed share of total project capital costs from sources other than the capital investment grant program. The current financial condition, both capital and operating, of the project sponsor and relevant project partners. The commitment of funds for both the capital cost of the proposed project and the ongoing transit system operation and maintenance. The reasonableness of the financial plan, including planning assumptions, cost estimates, and the capacity to withstand funding shortfalls or cost overruns. Projects must achieve at least a Medium rating for local financial commitment to be considered for funding. Given the preliminary ratings, it is unlikely the project would be competitive for these funds at this time. Headways for Alternative #4 were developed to directly compare impacts of bus and rail using similar headways during peak periods. Refined Build Alternative #5 Commuter Rail assumed a headway similar to that of the existing SunRail system, 30 minutes during peak periods (two hours during offpeak periods). Therefore effective 30 minute service for each of the two routes for Alternative #4 was assumed (with all-day service assumed on the longer Daytona Beach to DeBary route). Given that the two BRT routes would operate along U.S. 92 between Daytona Beach and DeLand, that section of the corridor would have an effective 15-minute headway during peak periods. It should be noted that headways assumed for Refined Build Alternative #4 BRT for comparison purposes do not meet the official FTA definition of BRT 10 minute service for at least 14 hours a day February 2017
72 3.0 IMPLEMENTATION STRATEGY 3.0 IMPLEMENTATION STRATEGY 3.1 Overview Given the input received from the PAG at its December 10, 2015 meeting, and recognizing that both Refined Build Alternatives would score poorly with respect to the FTA Small Starts/New Starts evaluation criteria, it is recommended that the recommended alternative be focused on the development of a long-term regional implementation strategy to enhance transit service in Volusia County. This strategy would involve investing in incremental transit improvements and land development strategies over time that would ultimately support a potential commuter rail extension to Daytona Beach or an intermediate location such at I-4 and S.R Based on input received from the PAG, the regional implementation strategy would be comprised of three components: Additional Studies: o Assess Transit Oriented Development (TOD) readiness for certain station areas. o Apply FTA Project Justification Rating Criteria to smaller segments of overall project, and assess potential smaller projects. o Evaluate ability and flexibility to go back and reassess other corridors if needed. o Advance to formal PD&E/NEPA study for one or more major transit corridor investments when warranted. Transportation Improvements: o Identify strategy for added transportation O&M revenues including Votran s Transit Development Plan (TDP) strategies. o Implement bus service improvements in latest Votran TDP related to new revenue sources when available. o Integrate transit priority and stop improvements into roadway improvements. o Develop new transit center and initial park-n-ride facilities to support major transit improvements. o o Implement BRT service in the U.S. 92 and/or U.S. 17/92 corridors, with added feeder bus connections improvements. Consider preserving right-of-way for future rail corridor. o Assess feasibility of implementing rail extension to Daytona Beach (construct guideway, stations, and systems; acquire vehicles; build vehicle storage/light maintenance facility). Land Development Strategies: o Adopt and enforce growth management and land conservation policies in Volusia County, focusing on increasing development density and market trends supportive of transit. 3-1 February 2017
73 3.0 IMPLEMENTATION STRATEGY o o Develop conceptual plans for designated BRT and rail transit station areas. Implement zoning changes that support major transit investment in most or all transit station areas. o Implement strategies to promote transit-supportive planning and station area development. o Develop affordable housing plans along transit corridors This draft implementation strategy was presented to the Project Advisory Group on January 27, 2016, and the group was supportive of this approach and the basic framework for the strategy. The remainder of this chapter further elaborates on the different transportation and land development strategies. Capital and operating costs are presented for the different bus service and infrastructure improvements, and the components of transit oriented development plans and ordinances to attract TOD and added land development density in Volusia County are identified. The chapter concludes with a summary of a TOD readiness assessment conducted for ten potential premium transit station areas in the study area. 3.2 Additional Studies Assessment of FTA Rating Criteria for Smaller Project The refined alternatives analysis revealed that a commuter rail extension to Daytona Beach under current financial and development conditions would not receive a very high rating by FTA, making it non-competitive for FTA New Starts funding. A potential shorter rail extension from I-4 to S.R. 472 might score higher as its capital cost would be less than half of the cost to extend a rail line the full distance to Daytona Beach. In the future, as new development occurs and potential local funding emerges as a match for federal funding, further evaluation of a shorter extension could be conducted to assess its competitiveness for FTA capital funding Reevaluate Other Corridors Over Time While the refined commuter rail alternative that was evaluated would operate along Fatio Road and S.R. 472 to get to I-4, this alignment does not provide direct rail access to the City of Deltona. The rail station would be located at the I-4/S.R 472 interchange, in the far northwest corner of Deltona. The City of Deltona has expressed interest in an east-west rail connection further south along the Duke Energy corridor, one of the initial corridor alternatives evaluated. Use of the Duke Energy Corridor would allow commuter rail to tie into I-4 further south and allow for a station at Saxon Boulevard better serving Deltona. In meeting with Duke Energy during this study, the consultant team found out that the utility provider was not supportive of commuter rail operating in its corridor. Over time, Duke Energy s position on use of their property might change, and hence there is could be a need to reassess this corridor in the future. Reassessment of the commuter rail tie-in in Daytona Beach would also be required if an alternate site was targeted for a new westside intermodal facility in Daytona Beach other than the one evaluated in this study. Potential alternate routings for new BRT service could also surface over time, which would require a reassessment of BRT feasibility, cost and impact. This could include use of the I-4 median for BRT. 3-2 February 2017

 process, followed by either moving to a formal FDOT PD&E study if local funding is envisioned for the")

74 3.0 IMPLEMENTATION STRATEGY Advance Premium Transit Improvement to Added Study When Warranted In future years, as the study area develops in a denser pattern, and local funding becomes available for a sizable transit investment, further assessment of the BRT and/or commuter rail options could be conducted. This could initially take the form of FDOT s new Transit Corridor Alternatives Review (TCAR) process, followed by either moving to a formal FDOT PD&E study if local funding is envisioned for the improvement or requesting entry to the FTA Project Development process (or some other process pending future federal transportation reauthorization program) if federal funding were to be requested. 3.3 Transit Improvements Figure 3-1 presents a roadmap for instituting transit service and facility improvements in Volusia County in the future, starting with identifying funding sources to cover new local bus service improvements, and ending with the potential extension of commuter rail into Volusia County in the longer-term. Each of the eight steps in this roadmap are discussed in this section, recognizing that some of these steps can proceed in tandem as opposed to sequentially pending available transit capital and operating funding. Figure 3-1. Transit Improvement Strategy Identify New Funding Sources As of 2015, Votran has indicated there are not sufficient funds to cover the cost of adding new local bus service let alone funds to support a commuter rail extension in Volusia County. While capital funding for new buses is typically available through existing FTA programs, federal operating dollars are very limited, resulting in state or local agencies having to cover operating costs. Thus until new funding is identified, the transit system in Volusia County cannot substantially expand. There are a number of local funding options which have been successfully applied in other parts of the U.S. which could be considered for Volusia County. These include the following: 3-3 February 2017
75 3.0 IMPLEMENTATION STRATEGY Rental Car Surcharge Registration Fee (Auto) Mobility Fee Special Assessment Tax Increment Financing Joint Development Developer Contributions Sponsorships & Naming Rights Air Rights Parking Fees Each of these potential funding sources is discussed in greater detail below. Table 3.1 summarizes the applicability of these funding sources to Florida and Volusia County. Rental Car Surcharge: Applied as a per-day, per-use or percentage-based surcharge on rental car purchases or leases. This will fluctuate with economic conditions, but can provide a reliable revenue stream if the economy remains strong. Currently there is a Florida rental car surcharge imposed by the state - $2 per day on car rentals/leases for first 30 days of term, and $1 per use on car-sharing services for less than 24 hours. Local rental car surcharge in addition to state and county rental rates has been instituted for Sound Transit services in the Seattle region. Registration Fee (Auto): Annual fee to register vehicle. In Florida, one-time registration fee of $225 for first-time registrants, with annual vehicle fees varying by weight and vehicle type (average of $70). This fee is reliable and easy to administer, but does not keep pace with inflation. In Alameda County, CA a $10 per year added vehicle registration fee is administered, with 25 percent of revenues allocated for transit improvements. Mobility Fee: New development and redevelopment applicants pay a one-time mobility fee which is calculated using: 1) multimodal transportation improvement needed to provide mobility and offset the impact of the development; 2) proximity to a multimodal corridor; and 3) person capacity projections. Mobility fees encourage more efficient development projects, but is dependent on new development. Osceola County has implemented such a fee, with allocation to transit. Special Assessment: Added tax in specified investment district may generate significant sums for investment, depending on rate and district size. Requires agreement of local property owners to establish district and contribute to the cost of the transportation infrastructure improvements. Property owners benefit through economic development and improved property values. Often includes financing where payments are not due until after the improvement is completed. Special Assessments are used to help cover operating costs for streetcars in Portland and Seattle. Tax Increment Financing: Captures incremental change in property, sales, or other taxes above a set threshold in a specified investment district over time. Revenue is small initially, but grows over time. Requires bonding to apply toward capital costs, and is often applied for 20 to 30 years. Tax Increment Financing is currently being applied to defray capital costs for the Atlanta Beltline streetcar. Joint Development: Partnership between a public entity and a private developer created to develop certain assets, often attracted by superior transit access to a site. This funding source generates revenue from development for transit on agency-owned property. Revenue potential varies based on site, situation, proper zoning and market conditions. Joint development of portions of existing MARTA park-n-rides in Atlanta area is one example. 3-4 February 2017
76 3.0 IMPLEMENTATION STRATEGY Developer Contributions: Developers often provide in-kind or monetary contributions to facilitate construction of projects that may result in a positive impact on property values. This can also include contributions to help defray transit operating costs. Contributions are often negotiated to reflect the benefit the developer derives from the project. Typical developers contributing include office parks, hospitals and shopping centers. Sponsorships & Naming Rights: Form of advertising where a private entity sponsors a transit service, line station or other asset. These funding sources can provide a significant revenue source during initial stages of construction and operation. They do require strong public and political project support. In Cleveland, the Healthline BRT service had naming rights purchased by Cleveland Clinic and university hospitals, with these sponsors offsetting annual O&M costs for 25 years. Air Rights: Public transit provider sells or leases development rights above the project site. The revenue should exceed the cost of developing above the project. Developer is incentivized to purchase and develop above the transit investment. Parking Fee: May be implemented for both existing and future parking supplies within and adjacent to a transit project. A Parking Fee may be a tax or surcharge on paid parking, assessed as percentage of receipts or fixed cost per space. It creates a dependable revenue stream for capital and operating costs and may encourage transit use in an area by increasing the cost of driving, and encouraging property owners to manage supply. The City of Orlando is using parking revenues in its downtown to help cover LYMMO operating costs. Summary Table 3-1 summarizes the applicability of local transit funding options in Florida, and whether the options cover capital and/or operating costs. Local Funding Options Table 3-1. Applicability of Local Funding Options for Transit Status in Florida Application to Transit Eligible Project Costs Enabled Application Project General Capital O&M in Florida to Transit Specific Rental Car Surcharge X Registration Fee (Auto) X Mobility Fee X Special Assessment X Tax Increment Financing X X Joint Development X Developer Contributions X Sponsorships & Naming Rights X Air Rights X Parking Fee X X Local Bus Service Improvements The Volusia Transit Connector Study focused on identifying local bus service modifications associated with both refined alternatives for BRT and commuter rail with the focus on addressing feeder bus service to these premium mode options. Irrespective of the development of such premium transit 3-5 February 2017
77 3.0 IMPLEMENTATION STRATEGY service, there is a critical need in the shorter term to increase transit service and hence transit tripmaking to provide a firm framework for supporting premium transit service in the future. This is recognized by two Votran recent transit planning initiatives, the Transit Development Plan (TDP) Major Update FY and the more detailed West Volusia Comprehensive Operations Analysis (COA), which provided data and insights that were integrated into the TDP update. Specific transit service and facility improvements applicable to the VTCS study area from the TDP Update are noted in the following section. Votran FY TDP Update The TDP planning effort involved an updated rider survey, a peer review of existing Votran system performance against other systems in the U.S. of similar size, a financial analysis, recommendations on transit service and facility improvements, and a 10-year staging plan to implement these improvements. A series of stakeholder interviews, discussion groups and public workshops were held to obtain insights on the local perception of existing transit service, transit service and facility improvements. A series of meetings and workshops also were held to obtain insights on the perception of transit, the future of transit, service and facility improvement needs and priorities, and potential acceptable local funding strategies. The Transit Development Plan Update document has identified several proposed existing route and new route improvements to Votran local bus service. The existing route modifications and new routes are shown in Figures 3-2 and 3-3. Improvements to existing service focus on increasing service frequency and providing added weekend service. This includes increased frequency for SunRail feeder routes. In particular, the following existing service improvements in the VTCS service area are noted: Route 20 increase service frequency to 20 min. Mon.-Sat.; add service to 9 PM Mon.-Sat.; add Sunday service with 60 min. headways Routes 32 and 33 Increase weekday frequencies to 30 min; add two mid-day trips and two later evening trips to connect with trains Route 60 Increase frequency to 20 min. Mon.-Sat.; increase PM service two hours Mon.- Sat.; add Sunday service with 60 min. frequency New services within the VTCS study area would include the following: SunRail feeder route from the Saxon Blvd. park-and-ride to the DeBary Station Lake Helen Connector route from Lake Helen to Southpointe Commons in DeLand Saxon Park-n-Ride to Elkcam route serving Deltona Bus trolley loop along International Speedway Blvd., Thames Road, and Beville Road in Daytona Beach Deltona Circulator connecting Howland, Elkcam and Providence Blvd. to serve the new Center at Daytona. None of the identified existing or new service improvements are currently funded. Over the next 10 years, funding is only deemed available to cover maintaining the existing transit service. With respect to identified capital improvements in the TDP Update, the focus would be on: purchasing new fixed-route, paratransit, and vanpool vehicles; adding shelters and ADA improvements at bus stops; expanding the Votran Operations/Administration facility, implementing transit signal priority, realtime information and constructing a new Westside Transfer Facility in the Orange City area. 3-6 February 2017
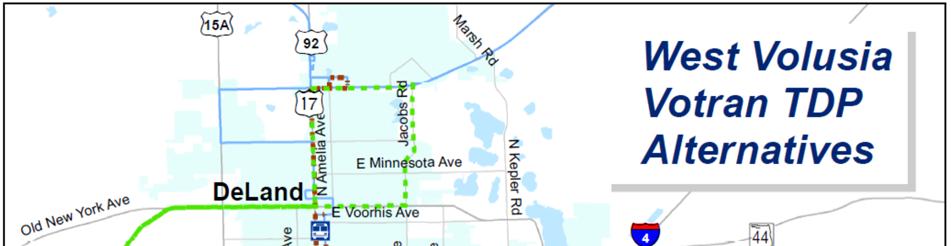

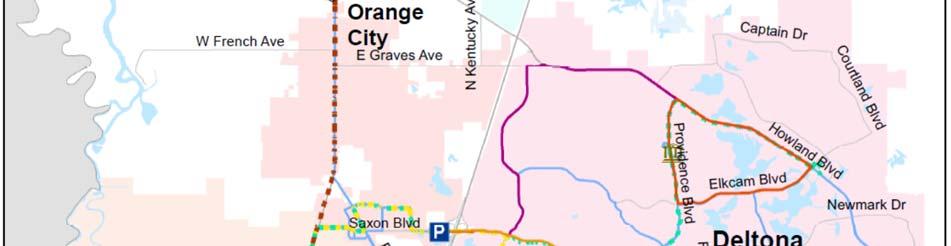
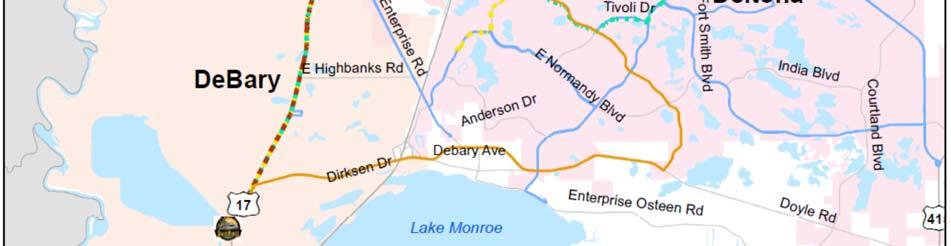
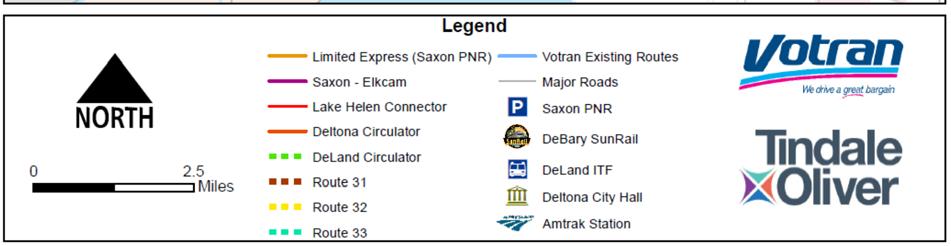
78 3.0 IMPLEMENTATION STRATEGY Figure 3-2. Votran TDP Update FY Route Modifications West Volusia County 3-7 February 2017


79 3.0 IMPLEMENTATION STRATEGY Figure 3-3. Votran TDP Update FY Route Modifications East Volusia County 3-8 February 2017
80 3.0 IMPLEMENTATION STRATEGY Integrate Transit Priority and Stop Improvements into Roadway or Development Projects Several transit facility improvements can be integrated into existing roadway or development projects, and thus would not require separate funding. This includes providing a hardened surface and ADA accessibility to bus stops, transit signal priority and queue jump signals. For this strategy to be successful, local jurisdictions must be aware of such improvement needs through the roadway scoping and development plan review process Develop New Transit Centers and Initial Park-n-Rides In the shorter-term, there is merit to develop smaller size park-n-rides and new transit centers to make local bus service more attractive in Volusia County. The intention of these new developments is to expand the service of premium transit in the future, whether it be BRT or commuter rail. The major transit center improvement would most logically be on the west side of Daytona Beach, with the site just north of Daytona International Airport being a prime target for such development. This could be integrated with TOD on the site and include provision for some park-n-ride if there were the demand. For new park-n-rides, building smaller facilities at the S.R. 44 and S.R 472 interchanges on I-4 would serve any short-term provision of new express bus service in the I-4 corridor. Such parking facilities would be small initially 100 spaces or less with sufficient land acquired to allow their expansion if and when commuter rail were to serve these sites Premium Bus Service Implementation Given the relatively low cost of investment, BRT should be considered for implementation in both the U.S. 17/92 and U.S. 92 corridors in the mid-term period after the local service improvements from the West Volusia COA and Votran TDP update are implemented. A new express bus route using the future managed lanes to be developed within I-4 would also have merit, with a direct connection to the DeBary SunRail station or an extended route to downtown Orlando. Further insights for each service are presented as follows. U.S. 17/92 BRT For such service to be successful in the U.S. 17/92 corridor, greater development density should be present along the corridor. If the Phase 2 North extension of SunRail does not occur due to the inability to secure funding, this BRT service would provide enhanced feeder service to the DeBary SunRail station as well as serving fewer intermediate stations. This service could overlay existing Route 20 local service in the corridor. The City of Orange City has identified in a recent meeting the desire to route any BRT service to the new Veterans Memorial Parkway as that is where the future City Center will be developed. FDOT has indicated a preference in the short-term not to implement transit signal priority in the corridor given the expectation that the new adaptive signal control system will provide sufficient benefit to transit. This will have to be carefully monitored as to the benefits to transit just for local service in the short-term. U.S. 92 BRT The U.S. 92 corridor through Daytona Beach already has sufficient development density to support BRT. If a new Intermodal Station on the west side of the City were developed, a logical BRT connection between that station and the intermodal station in downtown Daytona Beach would make sense. In the Traffic Analysis component of this study, it was shown that converting the outside curb lanes along U.S, 92 to BAT lanes would have a negative impact on general traffic operations, therefore the 3-9 February 2017
81 3.0 IMPLEMENTATION STRATEGY implementation of TSP along this corridor would appear to be the better transit priority strategy, as well as the provision of limited stops with BRT. If the new Intermodal Station on the west side of the City were developed, some reorientation of local Votran bus service to feed this station could be appropriate. I-4 Express Bus Implementing new express bus service in the I-4 corridor from Daytona Beach to the DeBary SunRail Station should be considered associated with the provision of managed lanes in the I-4 median associated with the I-4 Beyond the Ultimate improvement project. With such service, smaller park-nride facilities could initially be developed along I-4 at the S.R. 44 and S.R. 472 interchanges to complement the existing park-n-ride at Saxon Boulevard which historically had been an anchor of the previous LYNX express bus service to downtown Orlando Acquire Land and Develop Commuter Rail Based on current and projected future conditions, this study has shown from both a cost and ridership perspective, extending commuter rail service to Daytona Beach is not currently cost-feasible. To make such service attractive to implement, much greater development density at potential station locations is needed, as well as a sizable local funding share to help defray the over $1 billion investment (just in existing dollars) required, and to cover the estimated $30 million per year in operating costs. Given the cost constraint, one option is to pursue a staged extension of commuter rail, with a potential initial north terminus at I-4 and S.R. 472, instead of in Daytona Beach. It is estimated that the cost of this extension from the existing DeBary SunRail station could be only a third of the cost of the longer extension. By getting commuter rail over to the I-4 corridor, access would be provided to DeLand, Deltona, Lake Helen, New Smyrna Beach and Daytona Beach, though enhanced feeder services would be required. Initial steps could be taken to obtain acquire land initially at interchanges along the I-4 corridor for future park-n-ride development, that could initially be used for smaller park-n-ride facilities for new I-4 express bus service. These park-n-rides could eventually be expanded when commuter rail would serve those locations. If an alignment for a future extension of commuter rail can be agreed to, some advanced purchase of right-of-way could be achieved before commuter rail is actually constructed. An example would be along the south side of Fatio Road if the refined rail alignment evaluated in this study were actually implemented. There is a possibility that the intercity Brightline train service scheduled to begin operation between Miami and Orlando by 2018 could eventually be extended to the Jacksonville area. The most logical route for this extension would be along the Florida East Coast (FEC) railroad corridor, and if developed would allow for an intercity train station to be developed in Daytona Beach. In this case, the existing Votran Transfer Plaza off U.S.1 north of International Speedway Boulevard should be relocated to the train station location, envisioned to be the original intercity station site south of ISB. Any BRT service operating ultimately in the ISB corridor would need to be routed to this new transfer center location. 3.4 Land Development Need for Increased Density For premium transit to thrive in Volusia County there must be adequate development density to generate sufficient transit trip-making close to designated station locations to make the service, whether it be BRT or commuter rail, cost effective. Table 3-2 identifies the minimum development 3-10 February 2017
82 3.0 IMPLEMENTATION STRATEGY levels to support different types of transit service. Local bus with 10 minute frequency is seen to be generally considered as equivalent to BRT. The greater the development density, the higher order of transit mode that would be sustainable by that development. It is noteworthy that the employment of the central city served by commuter rail drives potential ridership more than the population and employment density around commuter rail stations at the trip origin. This is also reflective of park-nride being the primary mode for commuter rail access with a much larger ridership shed than light or heavy rail transit or BRT. Figure 3-4 applies the minimum development thresholds to support different transit modes related to the current population and employment projections for 2040 for the Volusia Transit Connector Study Area. As can be seen, current planned development levels will only support local bus service in most of the study area. There is no continuous string of density along a corridor other than International Speedway Boulevard in Daytona Beach to support more than local bus service at 30 minute frequency. This does not reflect the impact of a more transit-oriented development pattern around future BRT or commuter rail stations. The lack of existing or planned development density in Volusia County to support premium transit is further illustrated by comparing the aggregate population and employment density around the commuter rail stations (within ½ mile) associated with the refined build alternative for commuter rail, vs. the existing and projected development at existing SunRail stations in Seminole and Orange Counties and in the City of Orlando (see Table 3-3). The Volusia station area density is much less than in the other station areas. Given this development density condition around the identified BRT and commuter rail stations in the refined build alternatives in this study, a TOD assessment was conducted for ten of the stations identified to have higher ridership potential. This assessment is summarized in Section February 2017
83 3.0 IMPLEMENTATION STRATEGY Table 3-2. Transit Mode Applicability vs. Development Density Mode Local Bus Express Bus- Reached on foot Express Bus- Reached by auto Light Rail (LRT) Heavy Rail Service Minimum ½ mi. route spacing, 40 buses/day, approx 60 min. freq.) Minimum ½ m. route spacing, 60 buses/day, approx. 30 min. freq. Minimum ½ mi. route spacing, 120 buses/day, approx. 10 min. freq.(equiv. to BRT) 5 buses/2-hr. peak period 5-10 buses/2 hr. peak period 5 min. freq. or better in peak hr. 5 min. freq. or better in peak hr. Min. Residential Density (HH/gross acre) Min. Employment Density (jobs/ gross acre) avg. density over 2 sq. mi. tributary area 2 avg. density over 20 sq. mi. tributary area 6 avg. density for corridor sq. mi. 8 Avg. density for corridor sq. mi Commuter Rail 20 trains/day Size of Downtown 10 m sq. ft. non-residential space 35 m sq. ft. non-residential space More than 20 m sq. ft. nonresidential space 20 m 50 m sq. ft. nonresidential space 50+ m sq. ft non-residential space Only to largest downtowns, if rail line exists Remarks Average, varies as a function of downtown size & distance from residential area to downtown 1-15 mi. from largest downtowns only mi. from downtowns 3-12 February 2017
84 3.0 IMPLEMENTATION STRATEGY Table 3-3. Development Density around Commuter Rail Stations Area 2010 Density (per sq.mi.) 2040 Density (per sq.mi.) Population Employment Population Employment Study Area Seminole County Downtown Orlando 1,090 1,540 1,650 2,430 3,600 33,040 11,540 39,410 Orange County 1,550 3,500 3,520 5, February 2017

85 3.0 IMPLEMENTATION STRATEGY Figure 3-4. Highest Modal Sustainability Based on 2040 Population & Employment Projections 3-14 February 2017


86 3.0 IMPLEMENTATION STRATEGY Land Development Strategies To foster more concentrated urban development in Volusia County to support premium transit, five land development strategies have been identified, as shown in Figure 3-5. These strategies should be applied in tandem, related to fostering programs for more transit-oriented development around identified future premium transit stations and along corridors that can be served by feeder bus service to access such stations. Each of these is discussed further as follows. Figure 3-5. Land Development Strategies Growth Management and Land Conservation Policies The County and local cities can develop and implement policies that would be conducive to increasing development density around designated future premium transit stations and around transit stops in general, through amendments to local Comprehensive Plans. These policies can encourage mixeduse development in station and stop areas, and infrastructure development to attract developers to help defray development costs. At the same time, policies to maintain environmentally-sensitive areas in attracting such new development should be pursued. Conceptual Plans for TOD Development Local jurisdictions can proceed and develop concept plans for transit-oriented development around transit station areas, to provide an organized framework for such development and needed infrastructure improvements. The development plans should be of a nature to support a major transit investment. Plans for providing basic infrastructure to promote TOD should be included, including roadways, water/sewer, power, and fire/police services. Local comprehensive plans should reflect the station area plans developed. The City of DeBary has already taken the initiative of developing a TOD plan for the DeBary SunRail station area February 2017
87 3.0 IMPLEMENTATION STRATEGY Implement Zoning Changes Associated with the development of TOD concept plans, proper zoning at station areas should be developed. This would include provision for specific land use categories of development density bonuses, greater floor area ratios, and maximum parking requirements. Implement Strategies to Promote TOD Different strategies can be applied to foster TOD in station areas. This includes implementation of an overall Joint Development Program, regulatory and financial incentives, and subsidizing initial infrastructure improvements to lower the cost to developers. Develop Affordable Housing Plans One of the key rating criteria for FTA s Capital Improvement Program is the provision of affordable housing in station areas that would support a major transit investment. This would provide a balance of housing in station areas, and attract more persons historically dependent on transit living on lower incomes to live in station areas, and thus increase ridership potential. A few jurisdictions in Volusia County, notably the City of DeLandin the study area, have affordable housing policies currently in place TOD Assessment A major effort undertaken at the end of this study was a Transit-Oriented Development (TOD) readiness assessment at selected potential station locations. This assessment was completed for both of the Refined Build Alternatives (Commuter Rail and BRT). The TOD assessment included policy, market, physical and social aspects to develop strategies to increase readiness by building upon the area s strengths, and seizing opportunities to address areas of weaknesses. The results of this assessment are documented in a separate Transit-Oriented Development Assessment report, dated June TODs are compact, moderate to high intensity and density, mixed use areas within walking distance of a transit station which is designed to maximize walking trips and access to transit. TODs need a specific combination of geographic, demographic, economic, and institutional factors to emerge and function effectively. TOD emerges from opportunities created by planners and local governments, opportunities that elected officials enable, and opportunities that developers and financial institutions recognize and act upon. The assessment includes policy, market, physical and social aspects to develop strategies to increase readiness by building upon the area s strengths, and seizing opportunities to address areas of weaknesses. The TOD readiness assessment was conduct at the ten potential station locations listed below and identified in Figure February 2017


88 PROJECT SUMMARY REPORT 3.0 IMPLEMENTATION STRATEGY Figure 3-6. Station Areas Evaluated in the TOD Assessment 3-17 February 2017